


-
Chili pepper (Capsicum annuum L.) is one of the most important vegetable crops globally. It serves not only as a major seasoning and valuable economic crop globally, but also finds broad applications across agriculture, the food industry, and medicine[1−4]. Leaf color mutants are highly valuable for genetics and molecular biology. They provide essential systems to investigate chloroplast development, the control of photosynthesis, and the pathways of chlorophyll production in plants. In chili peppers, leaf color mutations influence both photosynthetic efficiency and plant morphology, and also offer valuable potential as genetic markers and resources for breeding improvements[5−8]. Therefore, studying the mutation mechanisms of these traits holds both theoretical and practical significance.
In recent years, rapid advances in high-throughput sequencing have significantly enhanced the genetic study of complex traits in plants. BSA-seq (bulked segregant analysis sequencing) is a genetic mapping approach that integrates analyses of population segregation with high-throughput sequencing techniques. This approach constructs mixed pools showing extreme phenotypic differences and uses high-throughput sequencing to compare the frequency of genetic variants between these pools. Through this comparison, it identifies genomic regions linked to specific target traits[9,10]; nevertheless, the regions detected tend to be quite extensive. For example, research on chili pepper[11], cabbage (Brassica oleracea)[12], cucumber (Cucumis sativus)[13], soybean (Glycine max)[14], and radish (Raphanus sativus)[15] have applied BSA-seq, typically mapping regions on the megabase scale. Bulked segregant RNA sequencing (BSR-seq) is a rapid gene-mapping approach that pairs RNA sequencing with BSA-seq. By comparing transcript levels between contrasting pools, it pinpoints regions that harbor genes linked to the observed trait[16,17]. Because it draws on expression signals, BSR-seq can narrow intervals to the kilobase range[18,19]. Li et al.[20] integrated both datasets to identify the key gene controlling head formation in cabbage. However, the regions identified by high-throughput sequencing often span many genes, complicating downstream analysis. To refine these intervals, KASP (kompetitive allele-specific polymerase chain reaction) converts genome-wide SNPs into allele-specific primer assays, enabling rapid, high-throughput genotyping in large populations. The platform is sensitive, reproducible, straightforward to run, and cost-effective, making it very suitable for routine screening. As a result, KASP has been widely used for fine mapping of quantitative trait loci (QTLs), gene verification, and marker-assisted selection in crop breeding[21,22]. The combined use of BSA/BSR and KASP has produced strong results across many crops. In Brassica napus, Zhang et al.[23] used KASP assays to validate two candidate genes for a leaf color mutant identified by BSA-seq. Xiao et al.[21] designed KASP primers within the BSA-seq interval and thereby fine-mapped the male sterility gene. In rice (Oryza sativa), integrating BSA-seq with KASP delimited a plant height QTL to a 126-kb window and proposed OsPH9 as the candidate gene[24]. In peanut (Arachis hypogaea)[25], the same workflow generated KASP markers for disease resistance, enabling rapid identification and practical deployment of the net blotch resistance gene. The approach also extends to complex traits, including leaf-color variants and smut resistance, in wheat (Triticum aestivum)[26] and sugarcane (Saccharum officinale)[27]. These studies show that combining BSA/BSR with KASP unites genomic signals and expression data, offering an efficient path from locus discovery to validation of candidate genes[28,29].
In Arabidopsis research, LAP2 functions as a multifunctional leucine aminopeptidase that regulates plant growth and leaf senescence by modulating the homeostasis of amino acid metabolism, particularly through the leucine and glutamate/γ-Aminobutyric acid (GABA) pathways. Loss of LAP2 function leads to delayed vegetative growth, altered flowering time, and (during later development) earlier appearance of initial senescence symptoms such as decreased chlorophyll content in the mutant[30]. Some studies have shown that LAP2 interacts with and stabilizes the catalase CAT2, playing a key role in scavenging reactive oxygen species and enhancing antioxidant capacity, thereby conferring tolerance to salt and osmotic stress in plants. Additionally, LAP2 possesses a chaperone function independent of its enzymatic activity, which directly protects proteins and mitigates stress-induced damage[31,32].
The starting material for this study was a naturally occurring recessive mutant derived from the pepper inbred line '96-140', named '96-140YBM'. This mutant exhibits a distinct yellow-leaf phenotype, with newly emerged leaves appearing yellow and gradually turning green as they mature. Notably, it is accompanied by a range of desirable agronomic traits, including enhanced plant vigor, increased fruit size and weight, improved disease resistance, and greater stress tolerance, particularly to low light conditions[33,34]. To elucidate the molecular genetic mechanisms underlying this unique yellow-leaf phenotype, we first crossed 96-140YBM with the wild-type parent to construct an F2 segregating population. Subsequently, using this population, we initiated candidate gene mapping by combining BSA-seq and BSR-seq.
To evaluate candidates more precisely, we identified polymorphic single-nucleotide polymorphisms (SNPs( within the target interval previously mapped by BSA-seq and BSR-seq[6], and converted them into high-throughput KASP assays. An F2 segregating population genotyped with these KASP markers enabled fine mapping that progressively narrowed the target interval. This strategy effectively integrates the dual advantages of genome resequencing and transcriptome data for mapping, combined with high-precision molecular marker technology to significantly enhance the efficiency of identifying mutation sites. This workflow establishes a solid technical basis for downstream gene editing or functional assays to confirm the roles of the mutated genes.
-
The experimental materials were the leaf-color mutant pepper 96-140YBM and its wild type, 96−140. The mutant displays yellow color in young leaves, and the phenotype is governed by a single recessive gene[34]. The wild-type has green leaves. Both lines were provided by the Vegetable and Flower Research Laboratory of the Zhenjiang Institute of Agricultural Sciences in the Hilly Area of Jiangsu Province. In the spring of 2021, the female 96-140YBM was crossed with the male 96−140 to generate F1 seeds. In 2022, F1 plants were sown and selfed, and the resulting F2 seeds were harvested (Fig. 1). In the spring of 2023, 2,000 F2 seeds were prepared; after discarding unfilled seeds, the remainder was sown in 105-cell trays. We placed one seed per cell, allocating 100 seeds per tray for a total of 20 trays. To provide controls, one tray each of the female parent 96-140YBM and the male parent 96−140 was also sown. Next, 90 d after emergence, two F2 trays showing 100% germination were selected, and 200 plants were used for phenotyping and DNA extraction to enable fine mapping. This population size provides sufficient statistical power for detecting major QTLs with high contribution rates in this study. In previous QTL mapping studies on pepper and other crops, populations of a similar scale have been widely demonstrated to effectively identify major QTLs[35−37]. Three plants each were collected from the male parent, the female parent, green F2 seedlings, and yellow F2 seedlings. After sampling, tissues were snap-frozen in liquid nitrogen and stored at −80 °C.
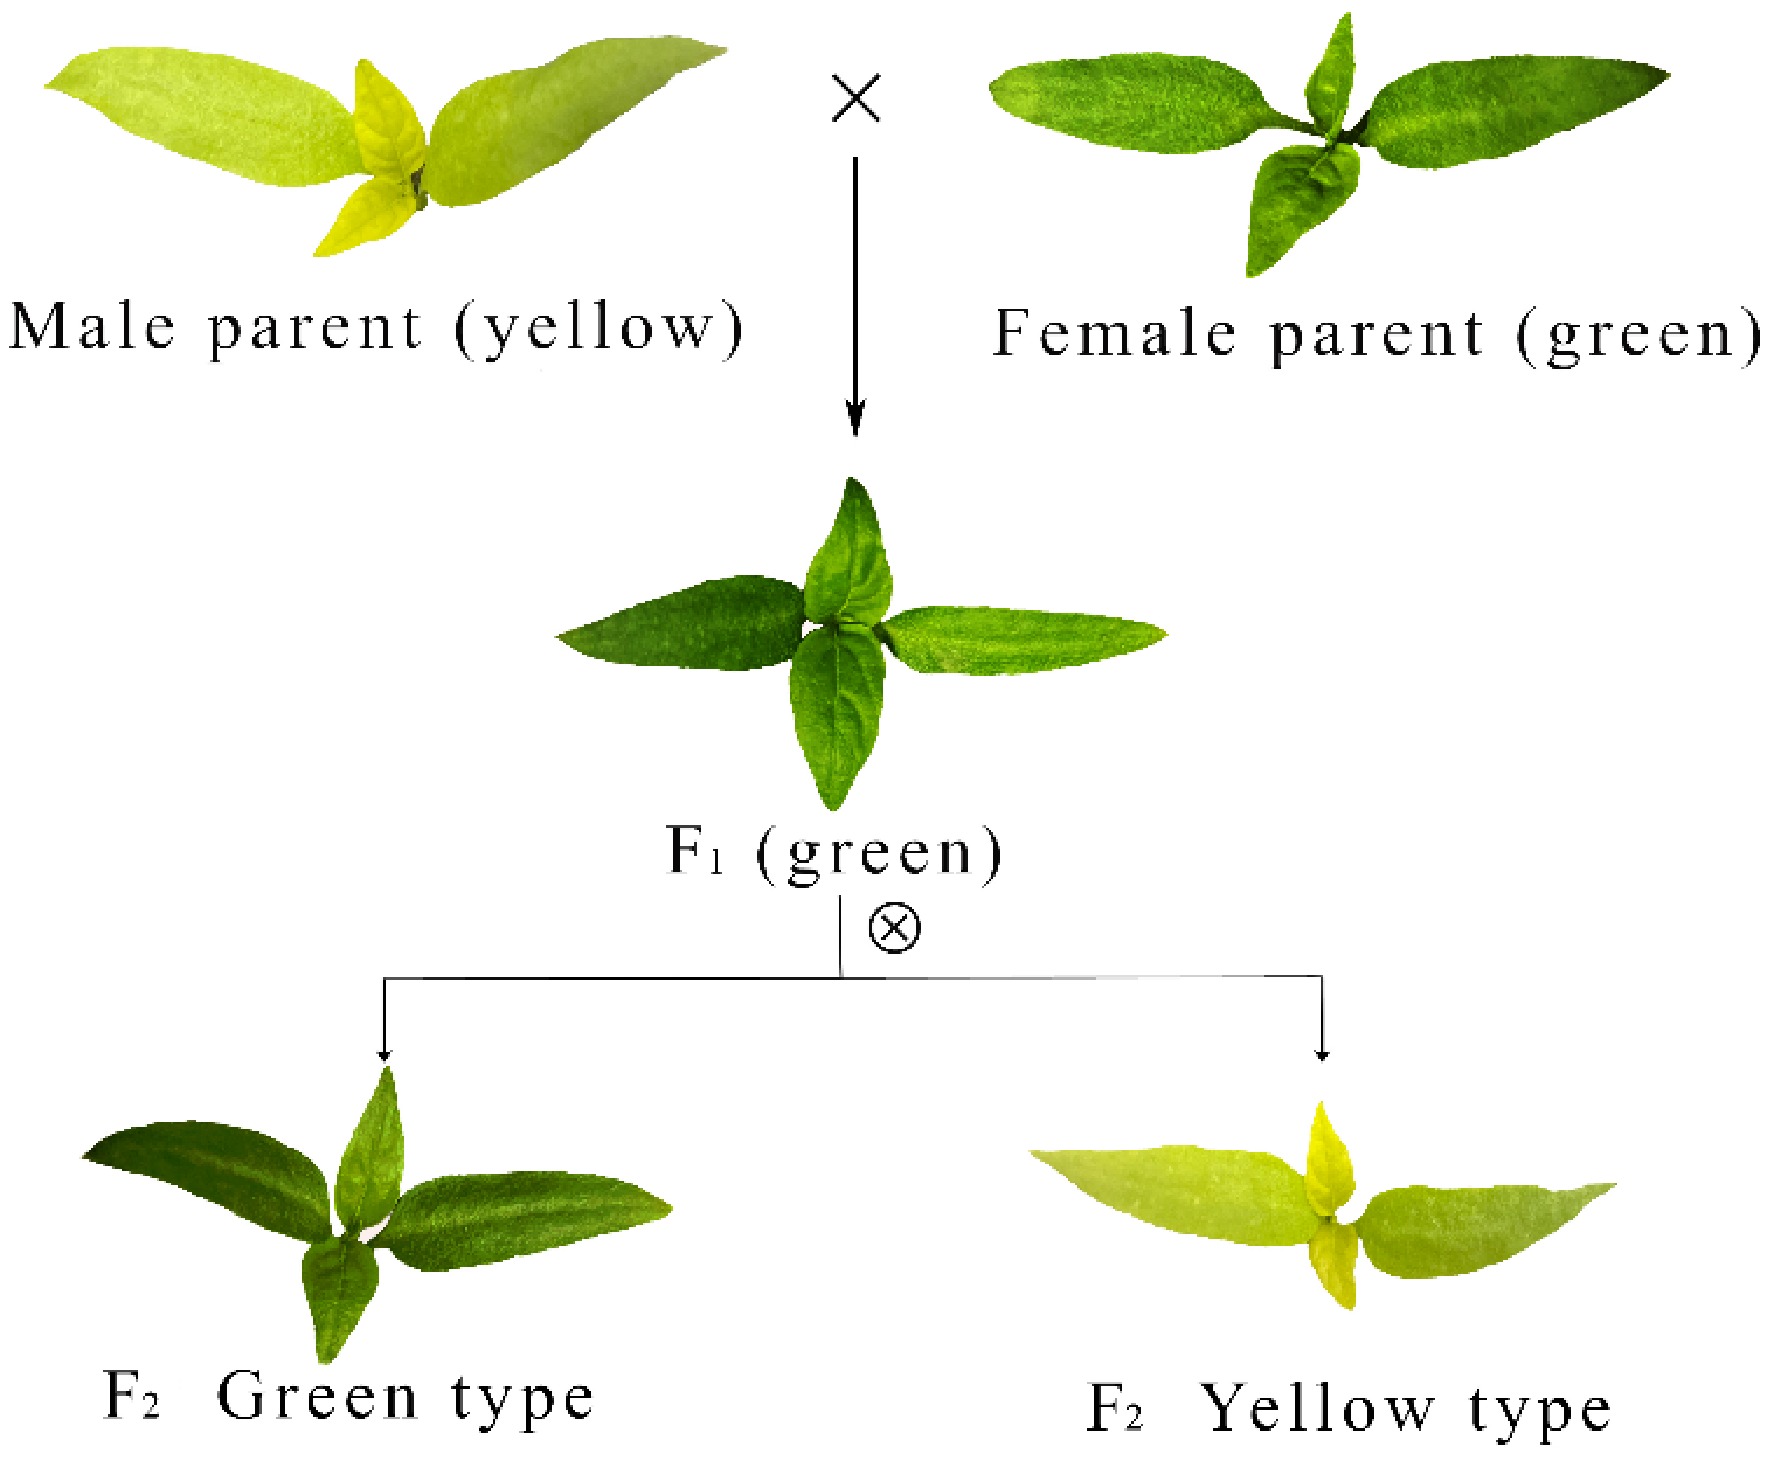
Figure 1.
Construction of the F2 segregating population and phenotype of pepper
SNP molecular marker screening
-
On the basis of the results from the combined BSA-seq and BSR-seq analyses[6], SNPs within the predefined intervals were identified using VCFtools (v0.1.16;
https://vcftools.github.io ) and PLINK (v1.9 beta;www.cog-genomics.org/plink/1.9 ). Specifically, through the integrated analysis of BSA-seq and BSR-seq data, this study systematically accomplished the screening of target intervals and identification of the candidate genes. In the BSA-seq analysis, high-quality sequencing data were first aligned to the pepper reference genome (Pepper Zunla 1 Ref_v2.0) using BWA software. Duplicate reads were removed with SAMtools, followed by local realignment and base quality recalibration with GATK. SNPs and small insertions and deletions (indels) were subsequently detected using GATK and functionally annotated with SnpEff V5.0. Candidate genomic regions were delineated by selecting SNP/indel sites that were heterozygous and inconsistent between the F2 bulks or homozygous and inconsistent between the parents (sequencing depth > 5×), calculating the Δ(SNP index), and determining the association thresholds through sliding window analysis combined with locally estimated scatterplot smoothing (LOESS) regression (mean p-value ≤ 0.01). Concurrently, in the BSR-seq analysis, transcriptomic data were aligned using HISAT2, and gene expression levels were quantified via the fragments per kilobase of exon per million mapped reads (FPKM) method. Differential expression analysis was performed on cDNA bulks (T01 vs. T02 and T03 vs. T04) with edgeR software (dispersion set to 0.1), and significantly differentially expressed genes (DEGs) were identified using the criteria of |log2(fold change)| ≥ 1 and a false discovery rate (FDR) < 0.05. Meanwhile, SNPs and small indels in the transcriptome were detected with GATK, and transcriptomic association intervals were localized via sliding window analysis of Δ(SNP index). By integrating the candidate genomic intervals, DEGs, and their physical locations derived from both approaches, this study identified key SNP sites, laying a foundation for the subsequent fine mapping of the target intervals and functional validation of the candidate genes.SNPs were selected to ensure uniform coverage across both intervals, adhering to the principle of even distribution for subsequent marker development.
SNP selection adhered to four criteria designed to optimize the assays' performance and mapping resolution: (i) Placement ensured even coverage across the two target intervals; (ii) each site was strictly biallelic; (iii) loci with very high or very low heterozygosity were excluded; (iv) no additional variants were permitted within 150−200 bp upstream or downstream of the focal SNP.
KASP marker development
-
The sequences 50−100 bp upstream and downstream of the selected SNP markers were extracted. Using Primer 3 Plus (
www.primer3plus.com ) and Primer 6.0 (www.primerbiosoft.com ), KASP markers were developed for the selected SNPs. The forward primers were designed to ensure a perfect match at the 3' end with the SNP, placing the SNP at the final base of the primer. Fluorescent labels were incorporated at the 5' end of the forward primers: the 6-carboxyfluorescein (FAM)-tagged forward primer (F1) included FAM GAAGGTGACCAAGTTCATGCT, whereas the 6-carboxyfluorescein succinimidyl ester (VIC)-tagged forward primer (F2) contained VIC GAAGGTCGGAGTCAACGGATT. The reverse universal primers were designed according to the annealing temperature of their respective forward primers.KASP genotyping
-
Genomic DNA from 96-140YBM, 96−140, and 200 F2 individuals served as the template. Genomic DNA was isolated using the cetrimonium bromide (CTAB) method[38]. Newly developed KASP primers were first screened by quantitative polymerase chain reaction (qPCR) to verify robust genotyping performance across these materials. Primers were diluted to 1.0 μM, and the two allele-specific forward primers (F1 and F2) were combined with the common reverse primer at a 1:1:3 ratio. Each KASP reaction (5.00 μL total) contained 2.50 μL of FLU-ARMS for KASP 2× PCR Mix (Videgene Good, China), 0.50 μL of the primer mixture, and 2.00 μL of the DNA template (20 ng/μL).
Each KASP primer set was tested on a 384-well plate using a touchdown polymerase chain reaction (PCR) protocol. The program started with denaturation at 95 °C for 10 minutes, followed by 10 touchdown cycles (95 °C for 15 s and a 60-s annealing step, starting at 61 °C and decreasing by 0.6 °C per cycle to 55 °C). This was followed by 28−35 amplification cycles at 95 °C for 15 s and 55 °C for 60 s. A final fluorescence read was taken at 30 °C for 30 s. PCR and fluorescence detection were performed on an ABI QuantStudio 6 Flex system. Genotyping and data analysis were carried out using the system's software. If clustering was poor, a short add-on PCR was performed to improve it (95 °C for 20 s for three cycles, 57 °C for 60 s for one cycle).
QTL analysis and annotation
-
Genotype data obtained from the 200 segregating individuals and their parents using the KASP assays were formatted for compatibility with IciMapping (v4.2;
https://isbreeding.caas.cn/rj/QTLIciMapping/3bbc927e6c194b728026b5d68f1c6b67.htm ) and then imported into the software. Under the BIP (Biparental) function, QTL mapping was performed using the software's default parameters for the input data. QTLs associated with the yellow-green mutation in pepper were identified, and significance testing of the QTL results was used to determine the major QTLs related to the mutant phenotype. According to the QTL analysis results generated by IciMapping, the distribution of QTLs on pepper chromosome 9[6] was visualized using MapChart software (version 2.32;www.wur.nl/en/show/Mapchart.htm ).On the basis of the QTL analysis, the target physical interval was identified and all genes within this region were retrieved. Gene information, including gene IDs and genomic coordinates, was extracted from the reference genome annotation file (Capsicum annuum L. Zunla-1 Release 2.0). Protein domains were predicted using InterProScan, and gene functions were inferred through sequence comparisons against the NR and Swiss-Prot databases. Kyoto Encyclopedia of Genes and Genomes (KEGG) analysis was used to examine metabolic pathway involvement, Gene Ontology (GO) analysis was applied for functional classification, and Pfam was used to predict functional domains. These analyses facilitated the identification of potential candidate genes for subsequent functional validation.
The identified mutant SNPs were validated using the same set of materials employed for the KASP genotyping.
Gene silencing via virus-induced gene silencing and physiological–biochemical analyses
-
To construct the virus-induced gene silencing (VIGS) vector for CaLAP2, a specific fragment of the gene was cloned into the TRV2 vector. After confirmation by sequencing, the recombinant vector was used to infect pepper plants to achieve gene silencing.
Total RNA was extracted from leaves of the control (CK), TRV2 empty vector-infected, and TRV2-LAP2-silenced plants showing phenotypic changes. The RNA was reverse-transcribed into cDNA, and the expression level of the target gene was quantified by quantitative real-time PCR (qRT-PCR) using the primers qPCR-ljLAP2F and qPCR-ljLAP2R (the primer sequences are listed in Supplementary Table S1).
Chlorophyll was extracted from the leaves of the same three groups. Briefly, 30 mg of leaf tissue was ground in 5 mL of an acetone: 0.1 M ammonia solution (9:1, v/v) to fully release the pigments. After centrifugation at 3,000×g for 10 min, the supernatant was collected and washed three times with an equal volume of hexane. The lower aqueous phase was retained and diluted to 5 mL with acetone, and the absorbance was measured at 663 and 645 nm using a spectrophotometer to determine chlorophyll content.
The maximum photochemical efficiency of Photosystem II (Fv/Fm) was measured in CK plants, TRV2 empty vector-infected plants, and TRV2-LAP2-silenced plants displaying phenotypic changes.
-
All SNP markers in two physical intervals (98,520–1,575,124 and 3,520,729–6,351,390) on pepper's chromosome 9 obtained via BSA-seq (Fig. 2) and BSR-seq association analysis were analyzed. SNPs with allele frequencies < 10% were excluded. SNPs within 150−200 bp upstream or downstream of each other, with more than two SNPs in this range, were also excluded. Then the remaining markers were subjected to statistical analysis and a χ2-test, with markers showing segregation distortion excluded at a threshold of p < 0.05. In total, 50 SNPs were selected on the basis ofthe principle of even distribution across the two intervals, then 23 closely spaced SNPs were removed, leaving 27 SNPs. The 27 SNPs were developed into KASP markers and tested, with six markers failing sample testing. The statistics for the remaining 21 SNPs are shown in Table 1.
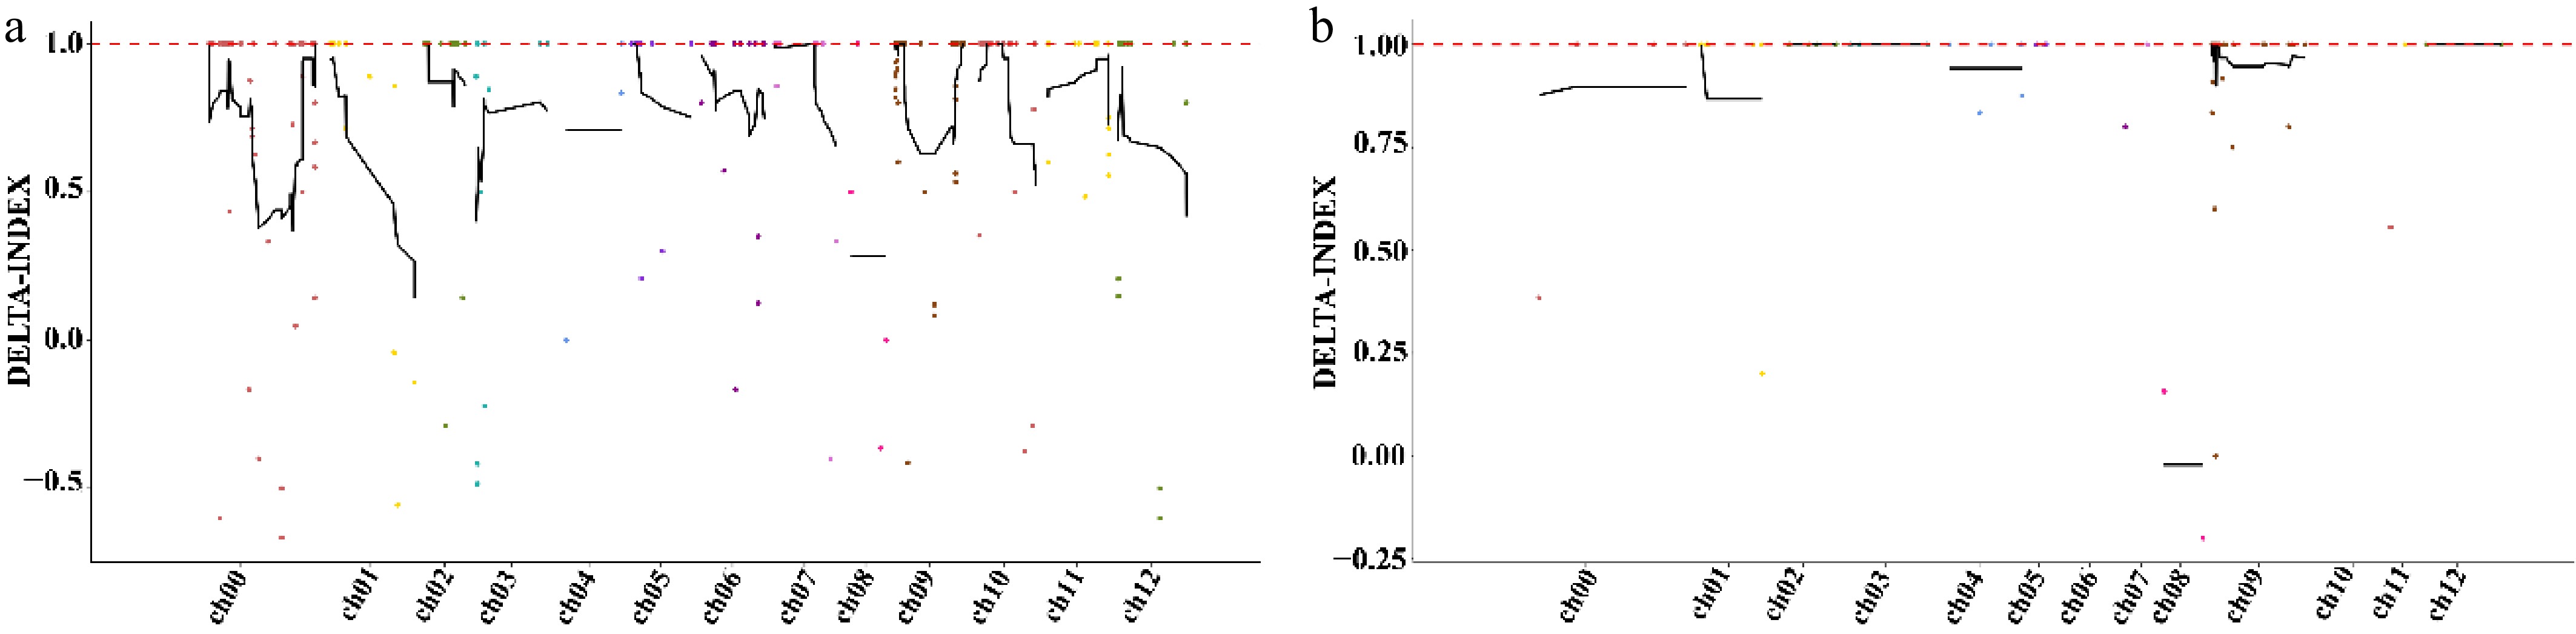
Figure 2.
Chromosomal localization of the candidate regions by BSA-seq (Δ[SNP index]). (a) Candidate regions identified through SNP association analysis via BSA-seq. (b) Candidate regions identified through small indel association analysis via BSA-seq.
Table 1. Information of 21 SNP markers.
ID Position Allele Missing (%) χ2 Pr > χ2 KASP1 C09-150411 TC 0.50 1.7739 0.411917 KASP2 C09-277885 AT 0.50 1.6633 0.435327 KASP3 C09-293859 CT 0.00 2.43 0.296711 KASP4 C09-390887 AG 5.00 3.2947 0.192556 KASP5 C09-398468 GT 2.00 0.2755 0.871312 KASP6 C09-404800 GC 0.50 1.2211 0.543051 KASP7 C09-585524 GA 4.50 1.6806 0.431575 KASP8 C09-690139 TC 1.50 2.6041 0.271979 KASP9 C09-760388 TG 1.00 3.7273 0.155108 KASP10 C09-832447 CT 1.00 5.1818 0.074953 KASP11 C09-981827 CA 1.00 3.1616 0.20581 KASP12 C09-1084701 TC 3.00 5.2887 0.071054 KASP13 C09-1548432 AT 11.50 1.2712 0.529622 KASP14 C09-5084723 GA 1.00 5.5556 0.062177 KASP15 C09-5277105 TA 5.00 0.5684 0.752608 KASP16 C09-5281991 CA 1.00 2.2828 0.319367 KASP17 C09-5516629 AG 1.50 1.3959 0.497595 KASP18 C09-5588330 GA 2.00 4.8469 0.088614 KASP19 C09-5737361 TC 6.50 3.8984 0.142389 KASP20 C09-5756188 GC 2.00 1.6735 0.433123 KASP21 C09-6227942 AG 1.00 3.899 0.142347 All selected markers were used to construct a local linkage map using the MAP function in IciMapping, and the grouping function was applied to group the markers. A limit of detection (LOD) threshold of 3.00 was established to confirm significant genetic linkage among markers within each population, thereby enabling the rational delineation of distinct linkage groups. We used the ordering function and the input order (fixed order) algorithm to determine the linear arrangement order of the markers on the chromosome through iterative optimization. Finally, we used the outputting function to output detailed information of the genetic linkage map, and used MapChart (software version: 2.32) to draw the genetic map and physical position map of 21 SNP markers on chromosome 9 of pepper (Fig. 3, left panel).
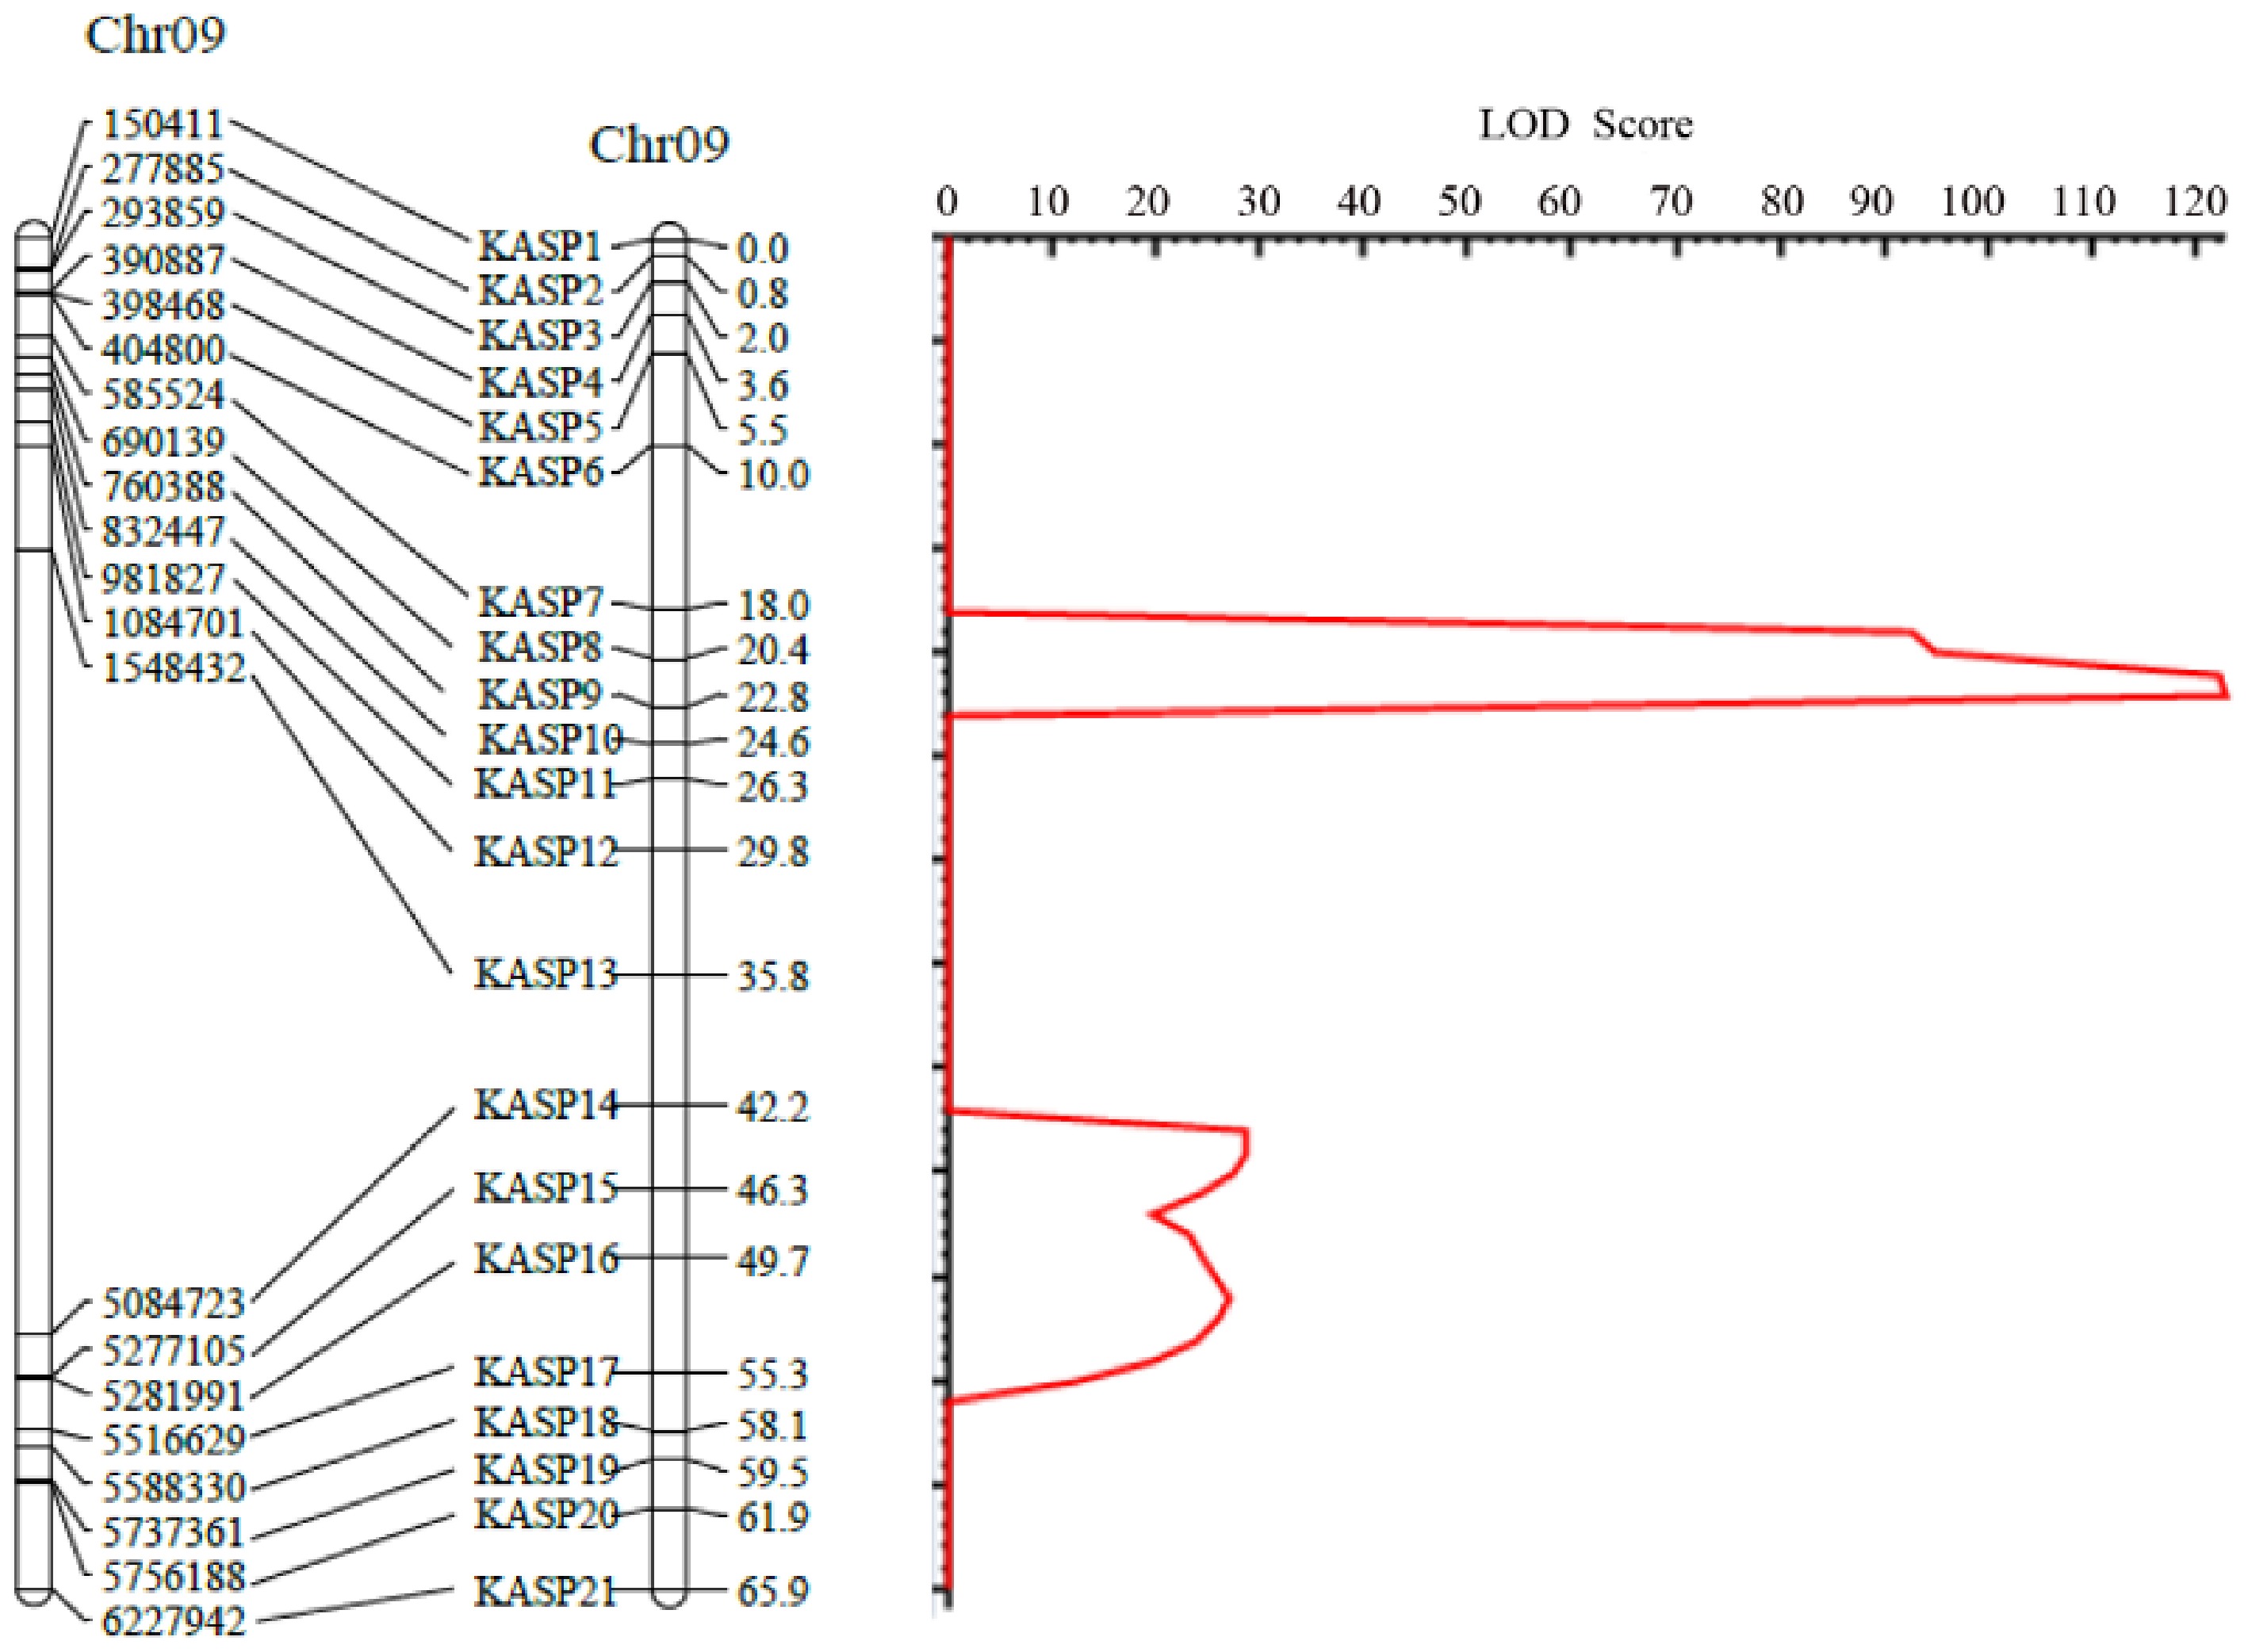
Figure 3.
Linkage genetic map and LOD score peak map of leaf color mutation in pepper.
Development of KASP markers
-
SNP markers were developed with Primer 3 Plus, and the markers were validated with Primer 6. The designed primers were converted into KASP primers: The FAM fluorescent tag sequence was added to the 5' end of the allele-specific forward primer F1, and the VIC fluorescent tag sequence was added to the 5' end of the forward primer F2 (Supplementary Table S2).
Genotyping based on KASP
-
Two F2 populations in 105-cell plug trays were randomly selected; from each tray, the first 100 plants were sampled in order, yielding 200 numbered plants in total, and the leaf color of each plant was recorded phenotypically. In total, 52 yellow-leaf and 148 green-leaf plants were sampled, with one sample each from the yellow-leaf maternal parent and the green-leaf paternal parent (Supplementary Table S3).
Genotyping data were analyzed via the BIP module of QTL IciMapping to detect QTLs. With a LOD threshold of 2.5, three intervals were resolved on pepper chromosome 9: 690,139−760,388, 5,084,723−5,277,105, and 5,281,991−5,516,629. The corresponding LOD scores were 122.57, 28.73, and 27.19, and the phenotypic variance explained (PVE) values were 68.16%, 9.00%, and 7.86%, respectively (Table 2). Except for these three intervals, no interval with an LOD score greater than 2.5 was detected, indicating that the mutant genes are highly likely located within these three intervals. Finally, the QTL interval distribution was plotted using MapChart (Fig. 3).
Table 2. Fine mapping results of QTLs for leaf color mutation in pepper.
Trait name Chromosome Left marker Right marker LOD PVE (%) color Chr09 690,139 760,388 122.5747 68.1596 color Chr09 5,084,723 5,277,105 28.7305 9.0028 color Chr09 5,281,991 5,516,629 27.1862 7.8642 Prediction of candidate genes for the leaf color mutation in pepper
-
After alignment with the pepper reference genome Capsicum annuum L. Zunla-1 Release 2.0.fa, 22 genes were detected in QTL mapping intervals: Interval 1 (585,524−760,388): 4 genes; Interval 2 (5,084,723−5,277,105): 10 genes; Interval 3 (5,281,991−5,588,330): 8 genes (Table 3). Among them, the functional annotations of Capana09g000125, Capana09g000139, Capana09g000140, and Capana09g000141 are associated with the chloroplasts. Capana09g000125 is the LAP2 gene, which exhibits accelerated senescence and decreased chlorophyll content in Arabidopsis mutants[30]. In previous work, we compared the expression levels of this gene between the wild-type and the leaf-color mutant of pepper[6]. Combining these previous results with the findings from the present study, we identified this gene as a candidate gene for the leaf color mutation and designated it as CaLAP2. Sequence analysis revealed a base variation in the exon of CaLAP2 in the leaf color mutant, where GGA was mutated to GAA, resulting in an amino acid change from glycine (Gly) to glutamic acid (Glu) (Fig. 4). The mutation site was identified in the coding sequence (CDS) region of the gene, and structural analysis of the gene's functional domains demonstrated its localization within a conserved domain (Supplementary Fig. S1). As conserved domains are the core regions mediating essential biological functions of proteins with highly preserved sequence and functional conservation across species' evolution, this mutation site is hypothesized to exert a notable regulatory impact on the protein's spatial conformation, binding activity, and catalytic function. Subsequent research will prioritize the functional characterization of this protein.
Table 3. Information on genes in the mapped interval.
Gene ID Start position End position Annotation Capana09g000022 711,077 714,954 SPX domain-containing protein 2-like Capana09g000023 732,458 735,299 Ethylene-responsive transcription factor WIN1-like isoform X1 Capana09g000024 746,469 752,891 Elongator complex protein 6 Capana09g000025 756,104 758,530 Receptor-like protein 12-like Capana09g000124 5,083,147 5,088,934 Probable cyclic nucleotide-gated ion channel 5-like isoform X1 Capana09g000125 5,089,856 5,094,793 Leucine aminopeptidase 2, chloroplastic-like Capana09g000126 5,102,001 5,102,363 Uncharacterized protein LOC101267869 isoform X2 Capana09g000127 5,102,882 5,105,381 Uncharacterized protein LOC102595001 isoform X1 Capana09g000128 5,109,856 5,112,450 Mary's story protein Capana09g000129 5,116,611 5,117,939 BTB/POZ domain-containing protein At4g30940-like Capana09g000130 5,210,976 5,212,166 BTB/POZ domain-containing protein At4g30940-like Capana09g000131 5,214,327 5,222,692 Elongation factor Ts, mitochondrial-like Capana09g000132 5,233,225 5,238,373 Reticulon-like protein B21 Capana09g000133 5,251,929 5,252,757 CBL-interacting serine/
threonine-protein kinase 6-likeCapana09g000134 5,317,930 5,318,742 Zeatin O-glucosyltransferase-like Capana09g000135 5,321,977 5,322,318 Zeatin O-glucosyltransferase-like Capana09g000136 5,322,794 5,323,186 Zeatin O-glucosyltransferase-like Capana09g000137 5,400,159 5,402,583 Serine/threonine-protein kinase At5g01020-like Capana09g000138 5,413,772 5,417,555 Sucrose synthase Capana09g000139 5,431,595 5,431,927 Cytochrome b6 (chloroplast) Capana09g000140 5,455,635 5,459,999 Predicted: 3-oxoacyl-[acyl-carrier-protein] synthase II, chloroplastic-like Capana09g000141 5,505,303 5,508,628 20-kDa chaperonin, chloroplastic-like 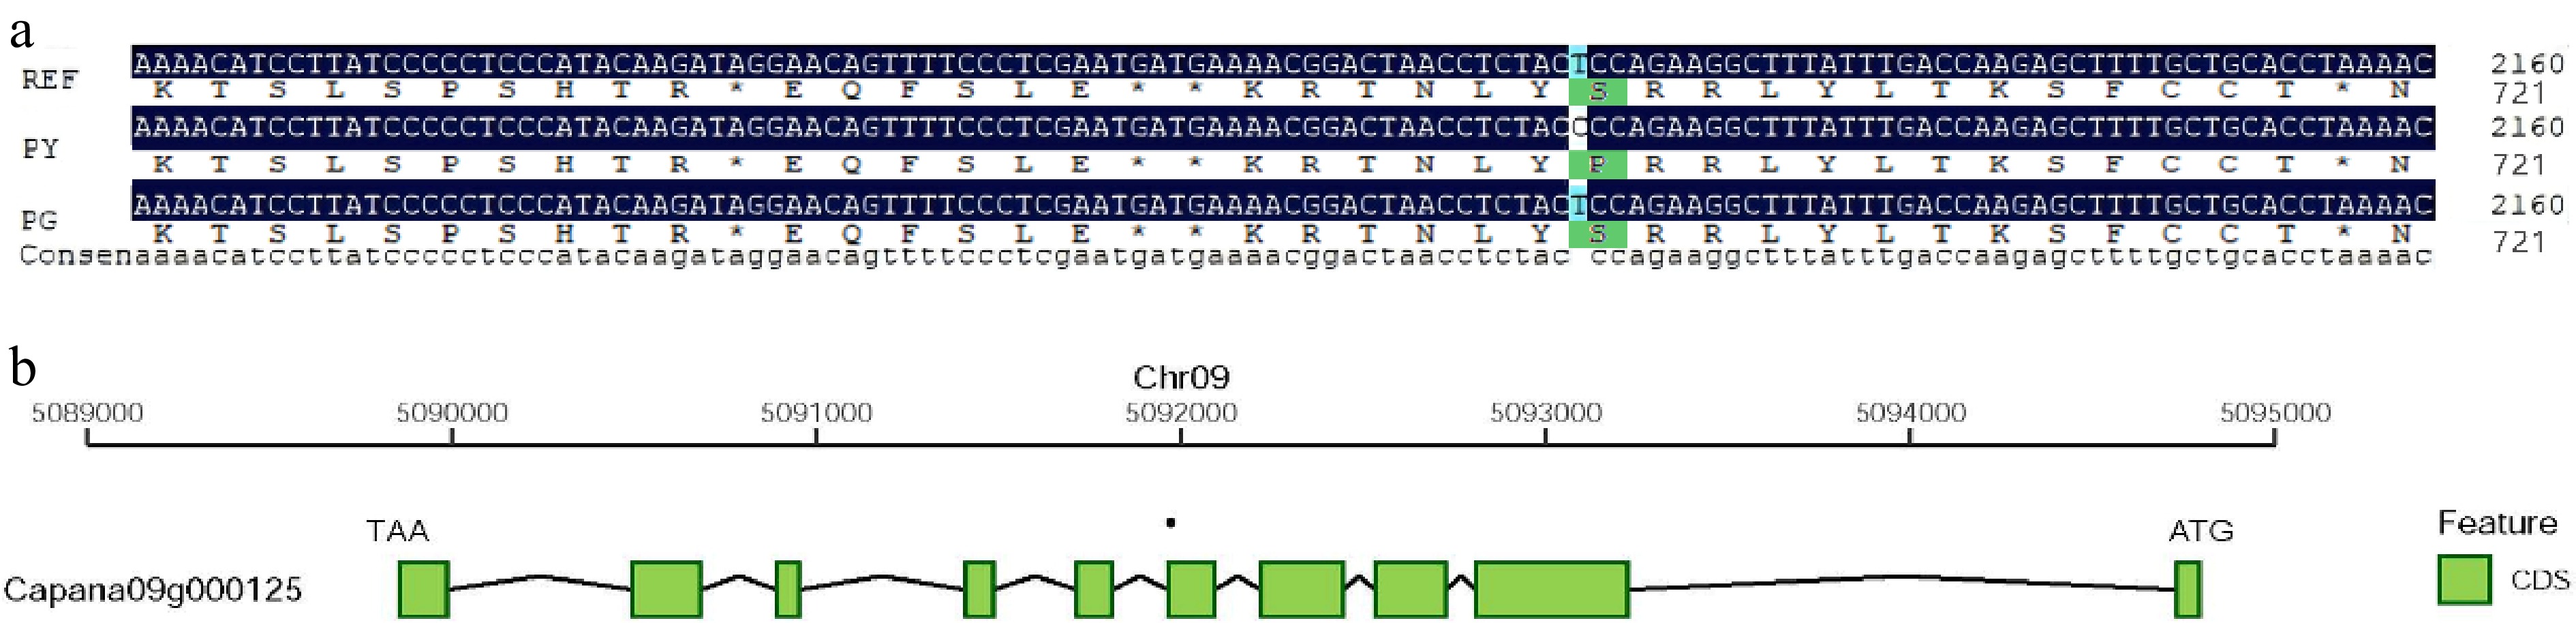
Figure 4.
Variant sites and structural diagram of the candidate gene CaLAP2. (a) Multiple sequence alignment of the CaLAP2 gene region among RY, FY, and FG. (b) Schematic diagram of the CaLAP2 gene structure on Chr09 of pepper.
SNP validation of the mutation
-
The CaLAP2 mutation site was developed into a KASP marker; the primer sequences are listed in Table 4. Following the same procedures as KASP genotyping, molecular marker and phenotype association analyses were performed on 200 F2 segregating individuals and both parents (Fig. 5). The results showed that T:T corresponded to the homozygous yellow-leaf genotype (45 plants), C:C to the homozygous green-leaf genotype (38 plants), and T:G to the heterozygous green-leaf genotype (111 plants). In total, seven plants displayed genotype and phenotype inconsistency, six had no genotype call, and one had a mismatched call, yielding an overall marker accuracy of 96.5% (Table 5).
Table 4. Information of KASP primers developed from the CaLAP2 variants' SNPs.
ID Primer information KASP-LAP2 F1: GAAGGTGACCAAGTTCATGCTgaaaacggactaacctctactC F2: GAAGGTCGGAGTCAACGGATTgaaaacggactaacctctactT R: catgttcccagtggtggctac 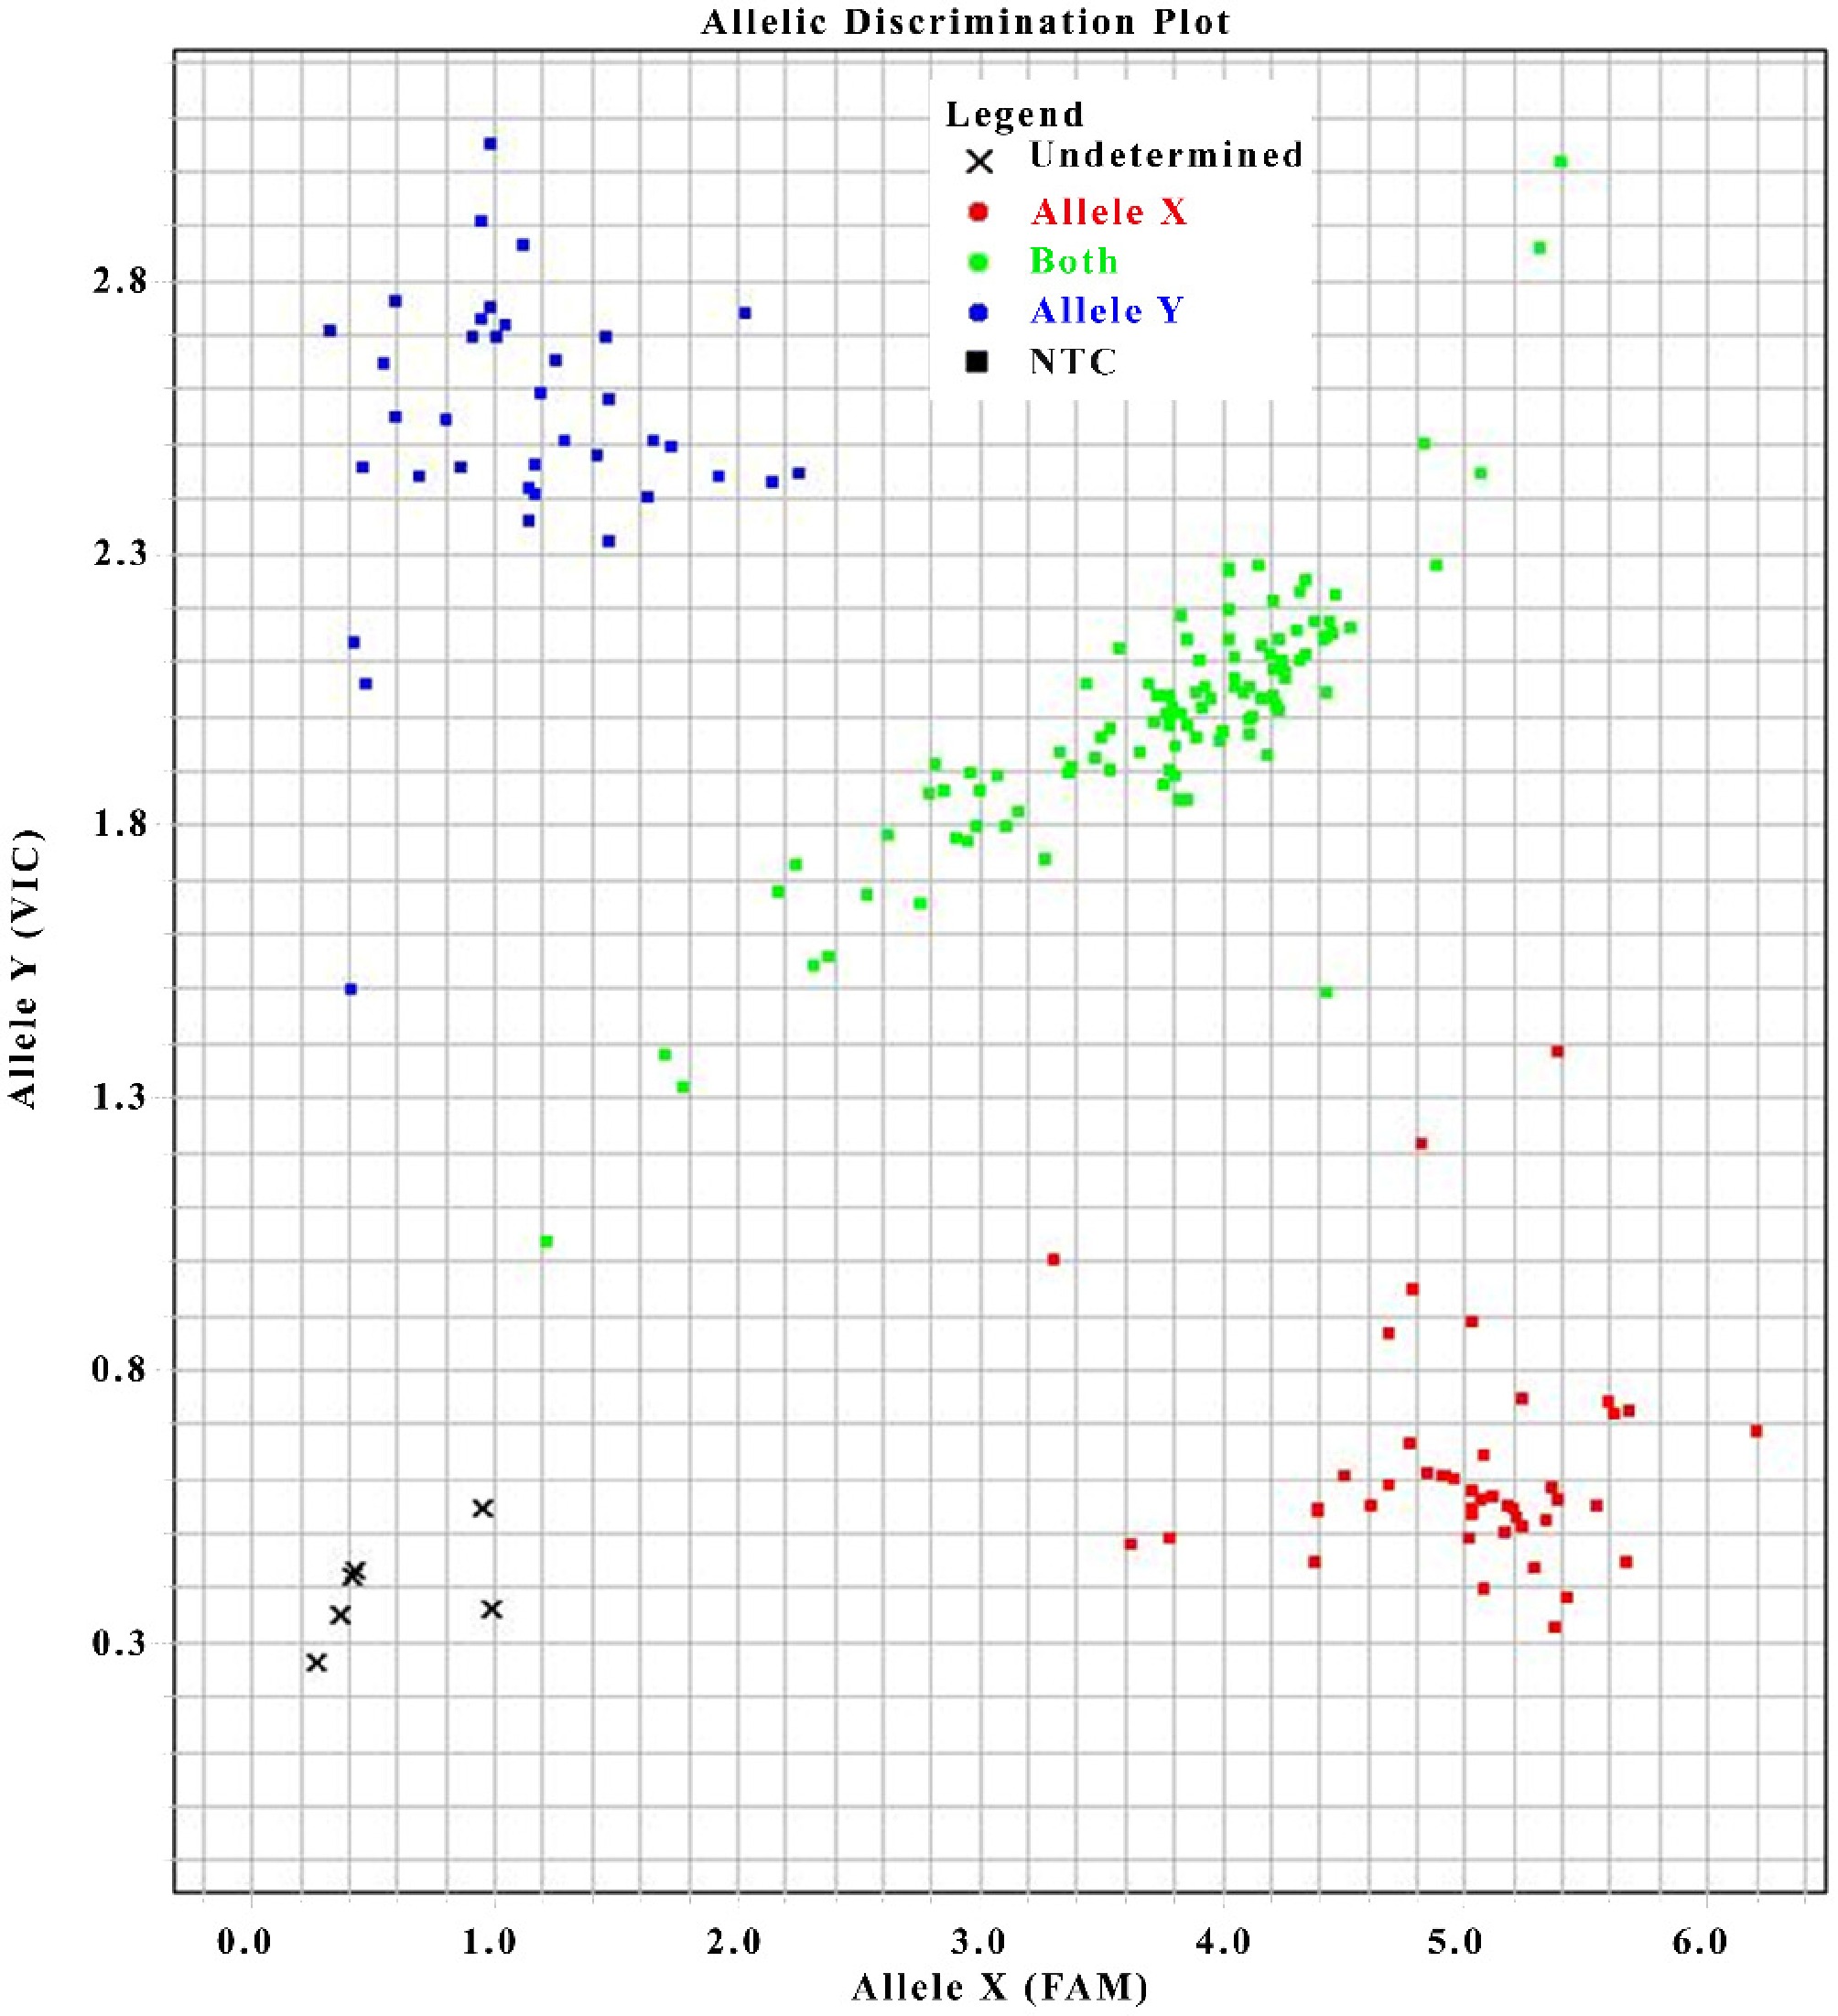
Figure 5.
KASP genotyping plot of the CaLAP2 variant's SNPs
Table 5. Phenotypic identification of leaf color in parents and the F2 population.
Genotype–phenotype matching Genotype–phenotype mismatch TT (yellow) CC (green) TG (green) TT (green) GG (green) TG (yellow) Undetermined (yellow) Undetermined (green) F2 45 38 111 0 0 0 1 6 Maternal parent 1 0 0 0 0 0 0 0 Paternal parent 0 1 0 0 0 0 0 0 Results of VIGS and physiological–biochemical analyses
-
After inoculating pepper plants with TRV cultures and cultivating them for 30 d, plants carrying TRV2-LAP2 began to show lightening of their leaf color. By 60 d post-inoculation, the leaves of TRV2-LAP2 plants exhibited obvious yellowing. Plants carrying the TRV2 empty vector also displayed a lighter leaf color, though the degree of yellowing was less severe than that in TRV2-LAP2 plants (Fig. 6).
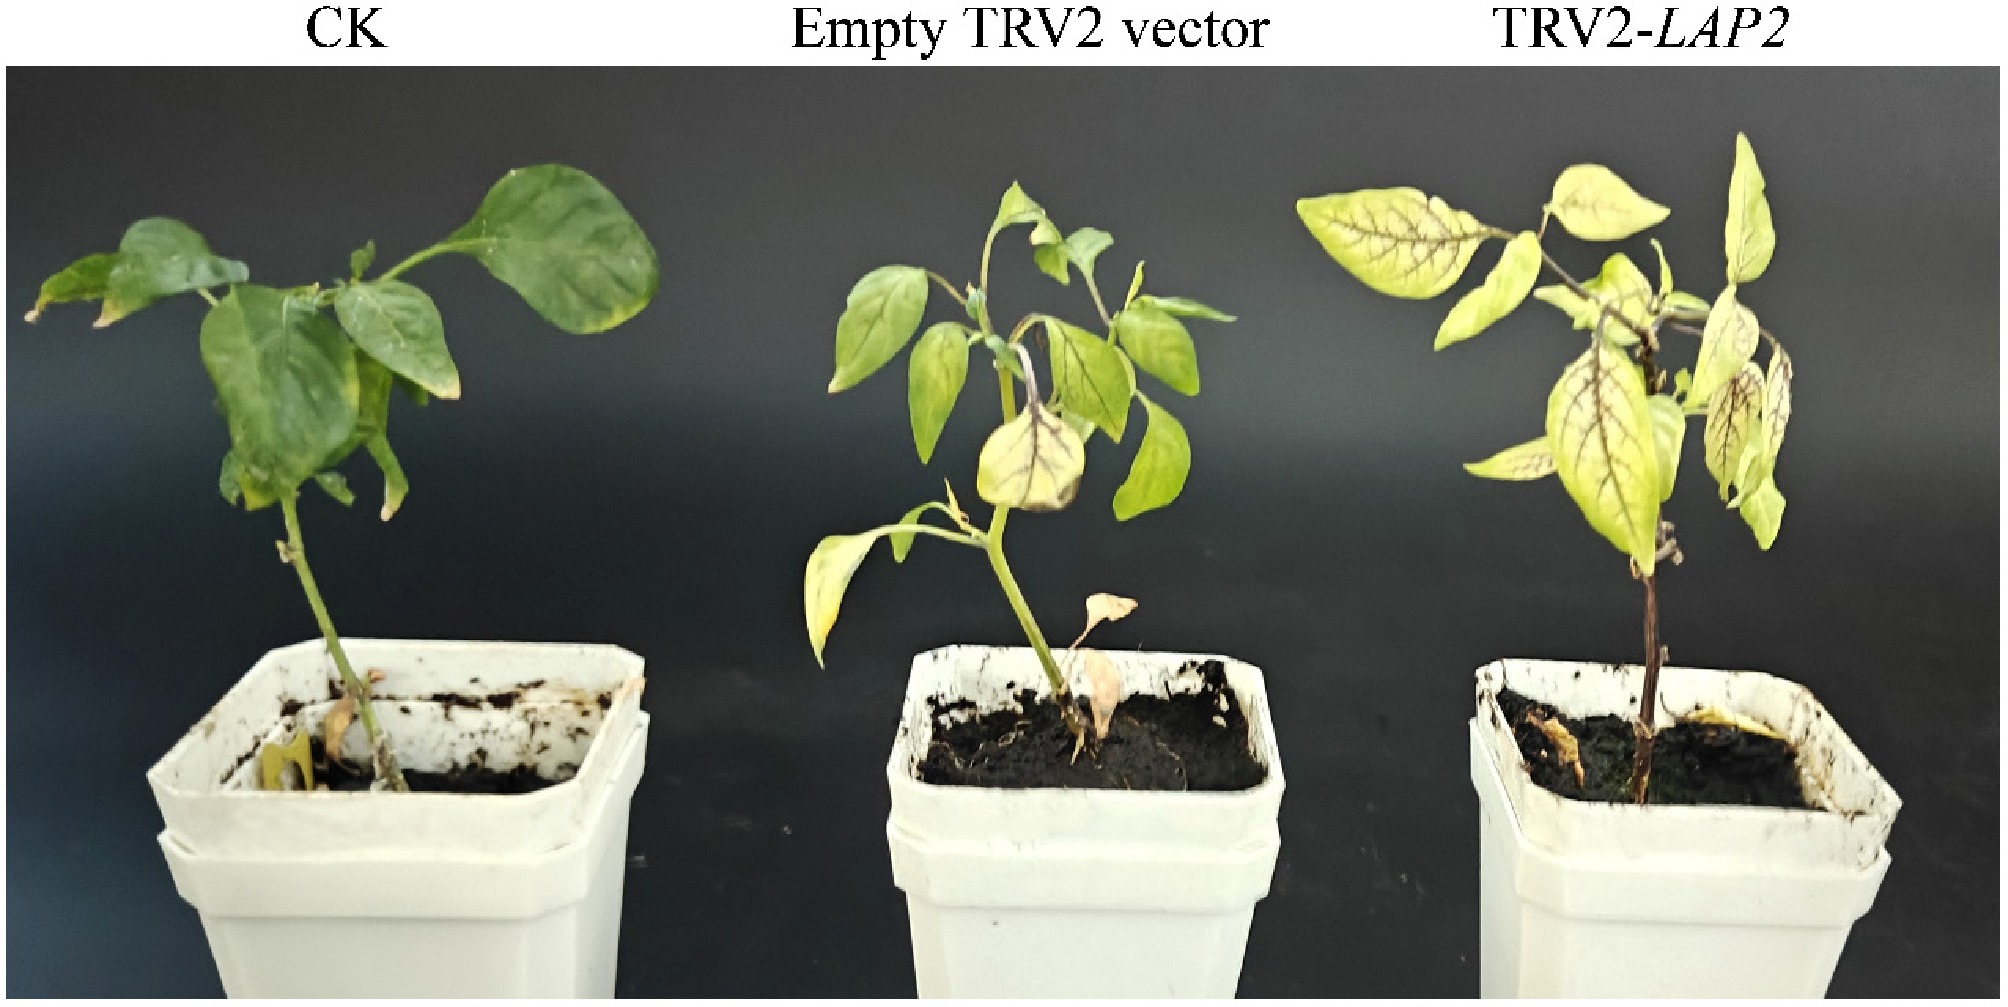
Figure 6.
Phenotype of virus-induced gene silencing
qRT-PCR analysis was performed on CK plants and phenotypically affected TRV2 empty vector and TRV2-LAP2 plants. As shown in Fig. 7, the expression level of the LAP2 gene was nearly equivalent in CK and TRV2 empty vector plants, whereas in TRV2-LAP2 plants, LAP2 expression was only 35.4% of that in the CK plants.
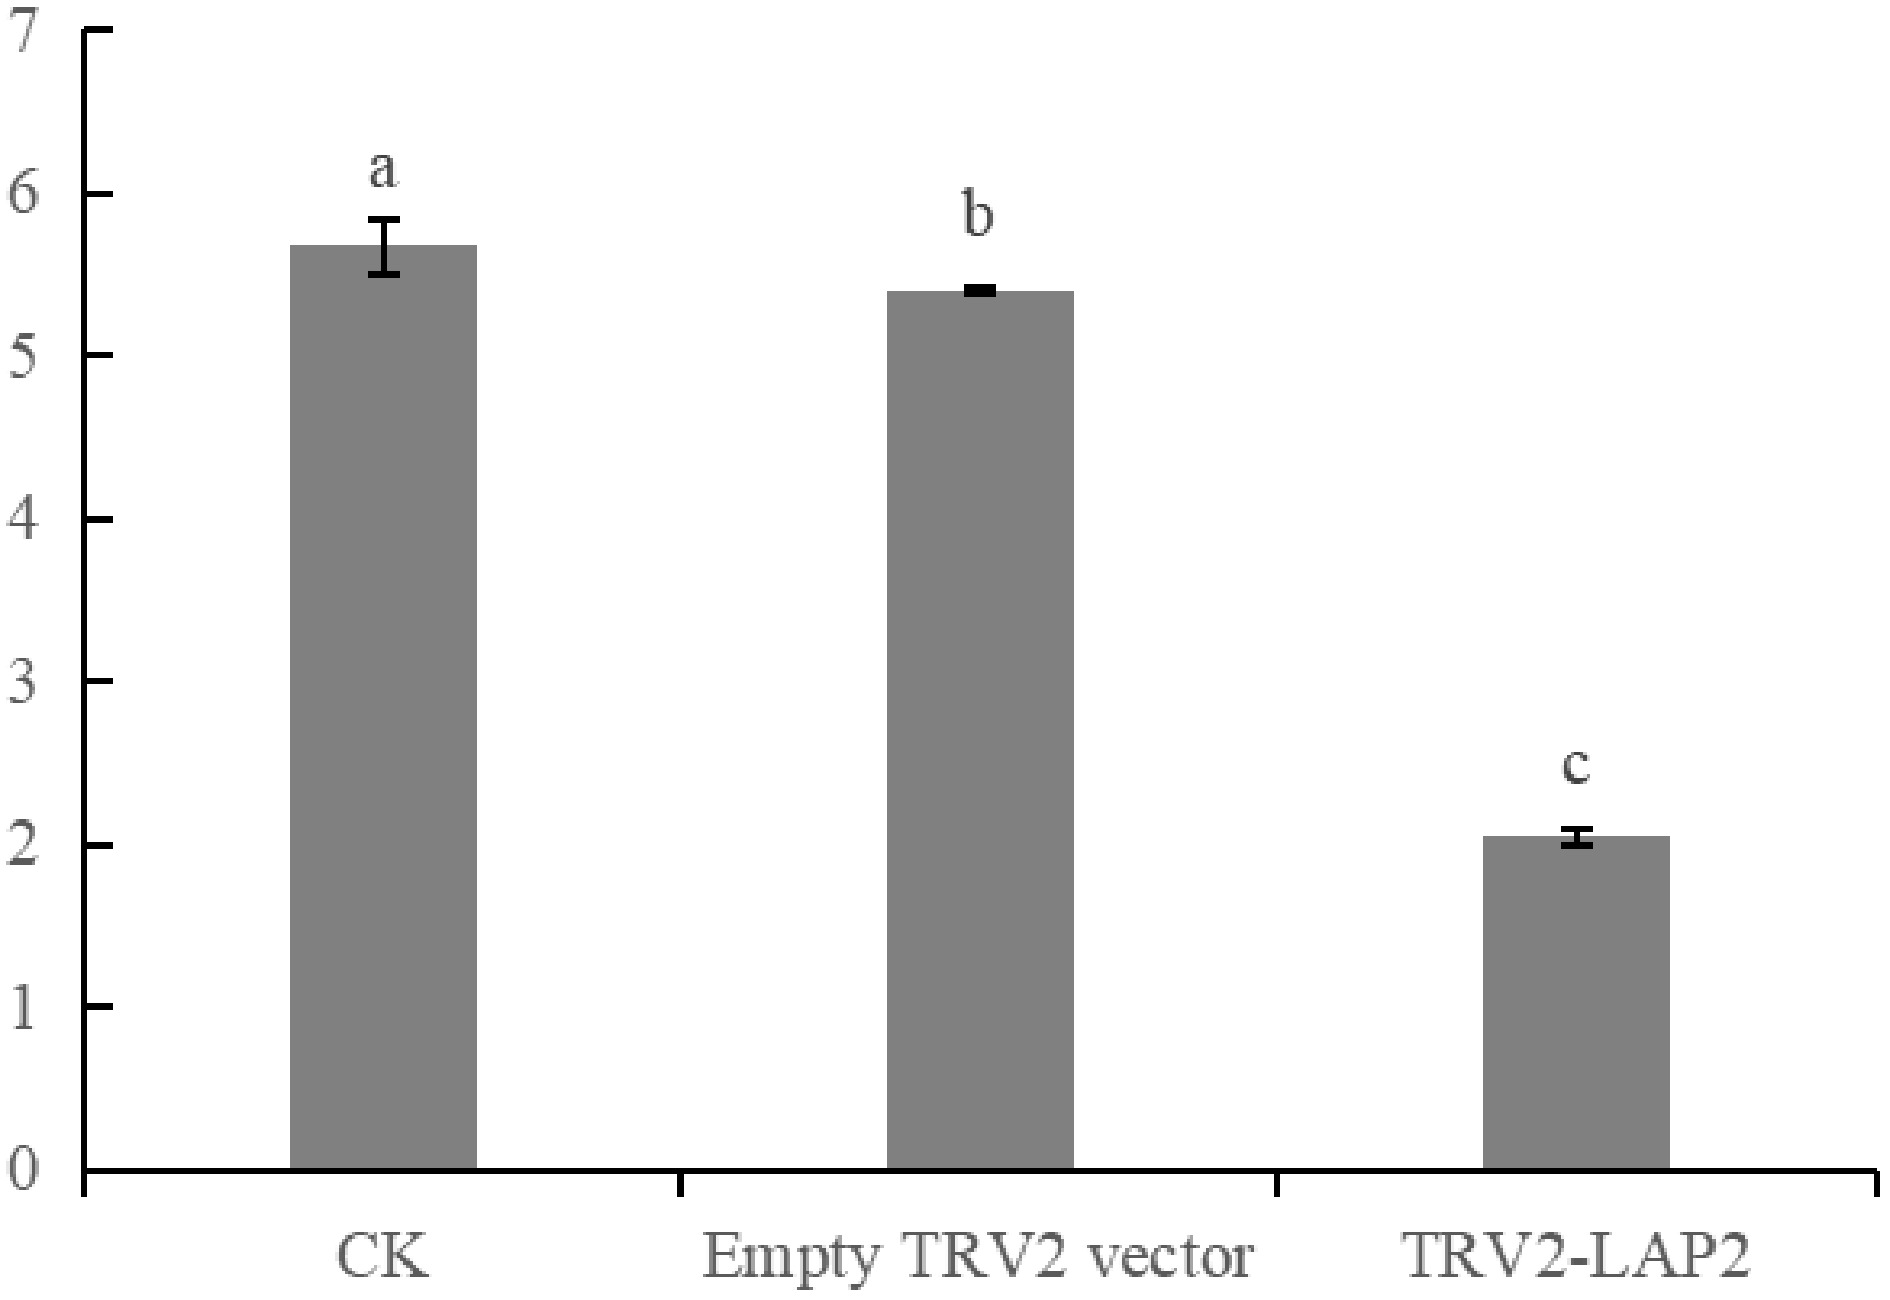
Figure 7.
Detection of the silencing efficiency of LAP2, with significance at p < 0.05.
Chlorophyll content was measured in CK, TRV2 empty vector, and TRV2-LAP2 plants with visible phenotypes. According to Fig. 8, chlorophyll a content in TRV2-LAP2 plants decreased significantly compared with both CK and TRV2 plants (Fig. 8a). Chlorophyll b content was also significantly reduced compared with the CK, but remained higher than in TRV2 plants (Fig. 8b). These results suggest that the CaLAP2 gene significantly affects chlorophyll a content. Total chlorophyll content was significantly lower in TRV2-LAP2 plants than in both CK and TRV2 plants (Fig. 8c). However, because of the more pronounced reduction in chlorophyll a, the chlorophyll a/b ratio in TRV2-LAP2 plants was lower (Fig. 8d). Silencing of the CaLAP2 gene clearly reduced chlorophyll content in pepper leaves, indicating that CaLAP2 plays a role in regulating chlorophyll levels in pepper.
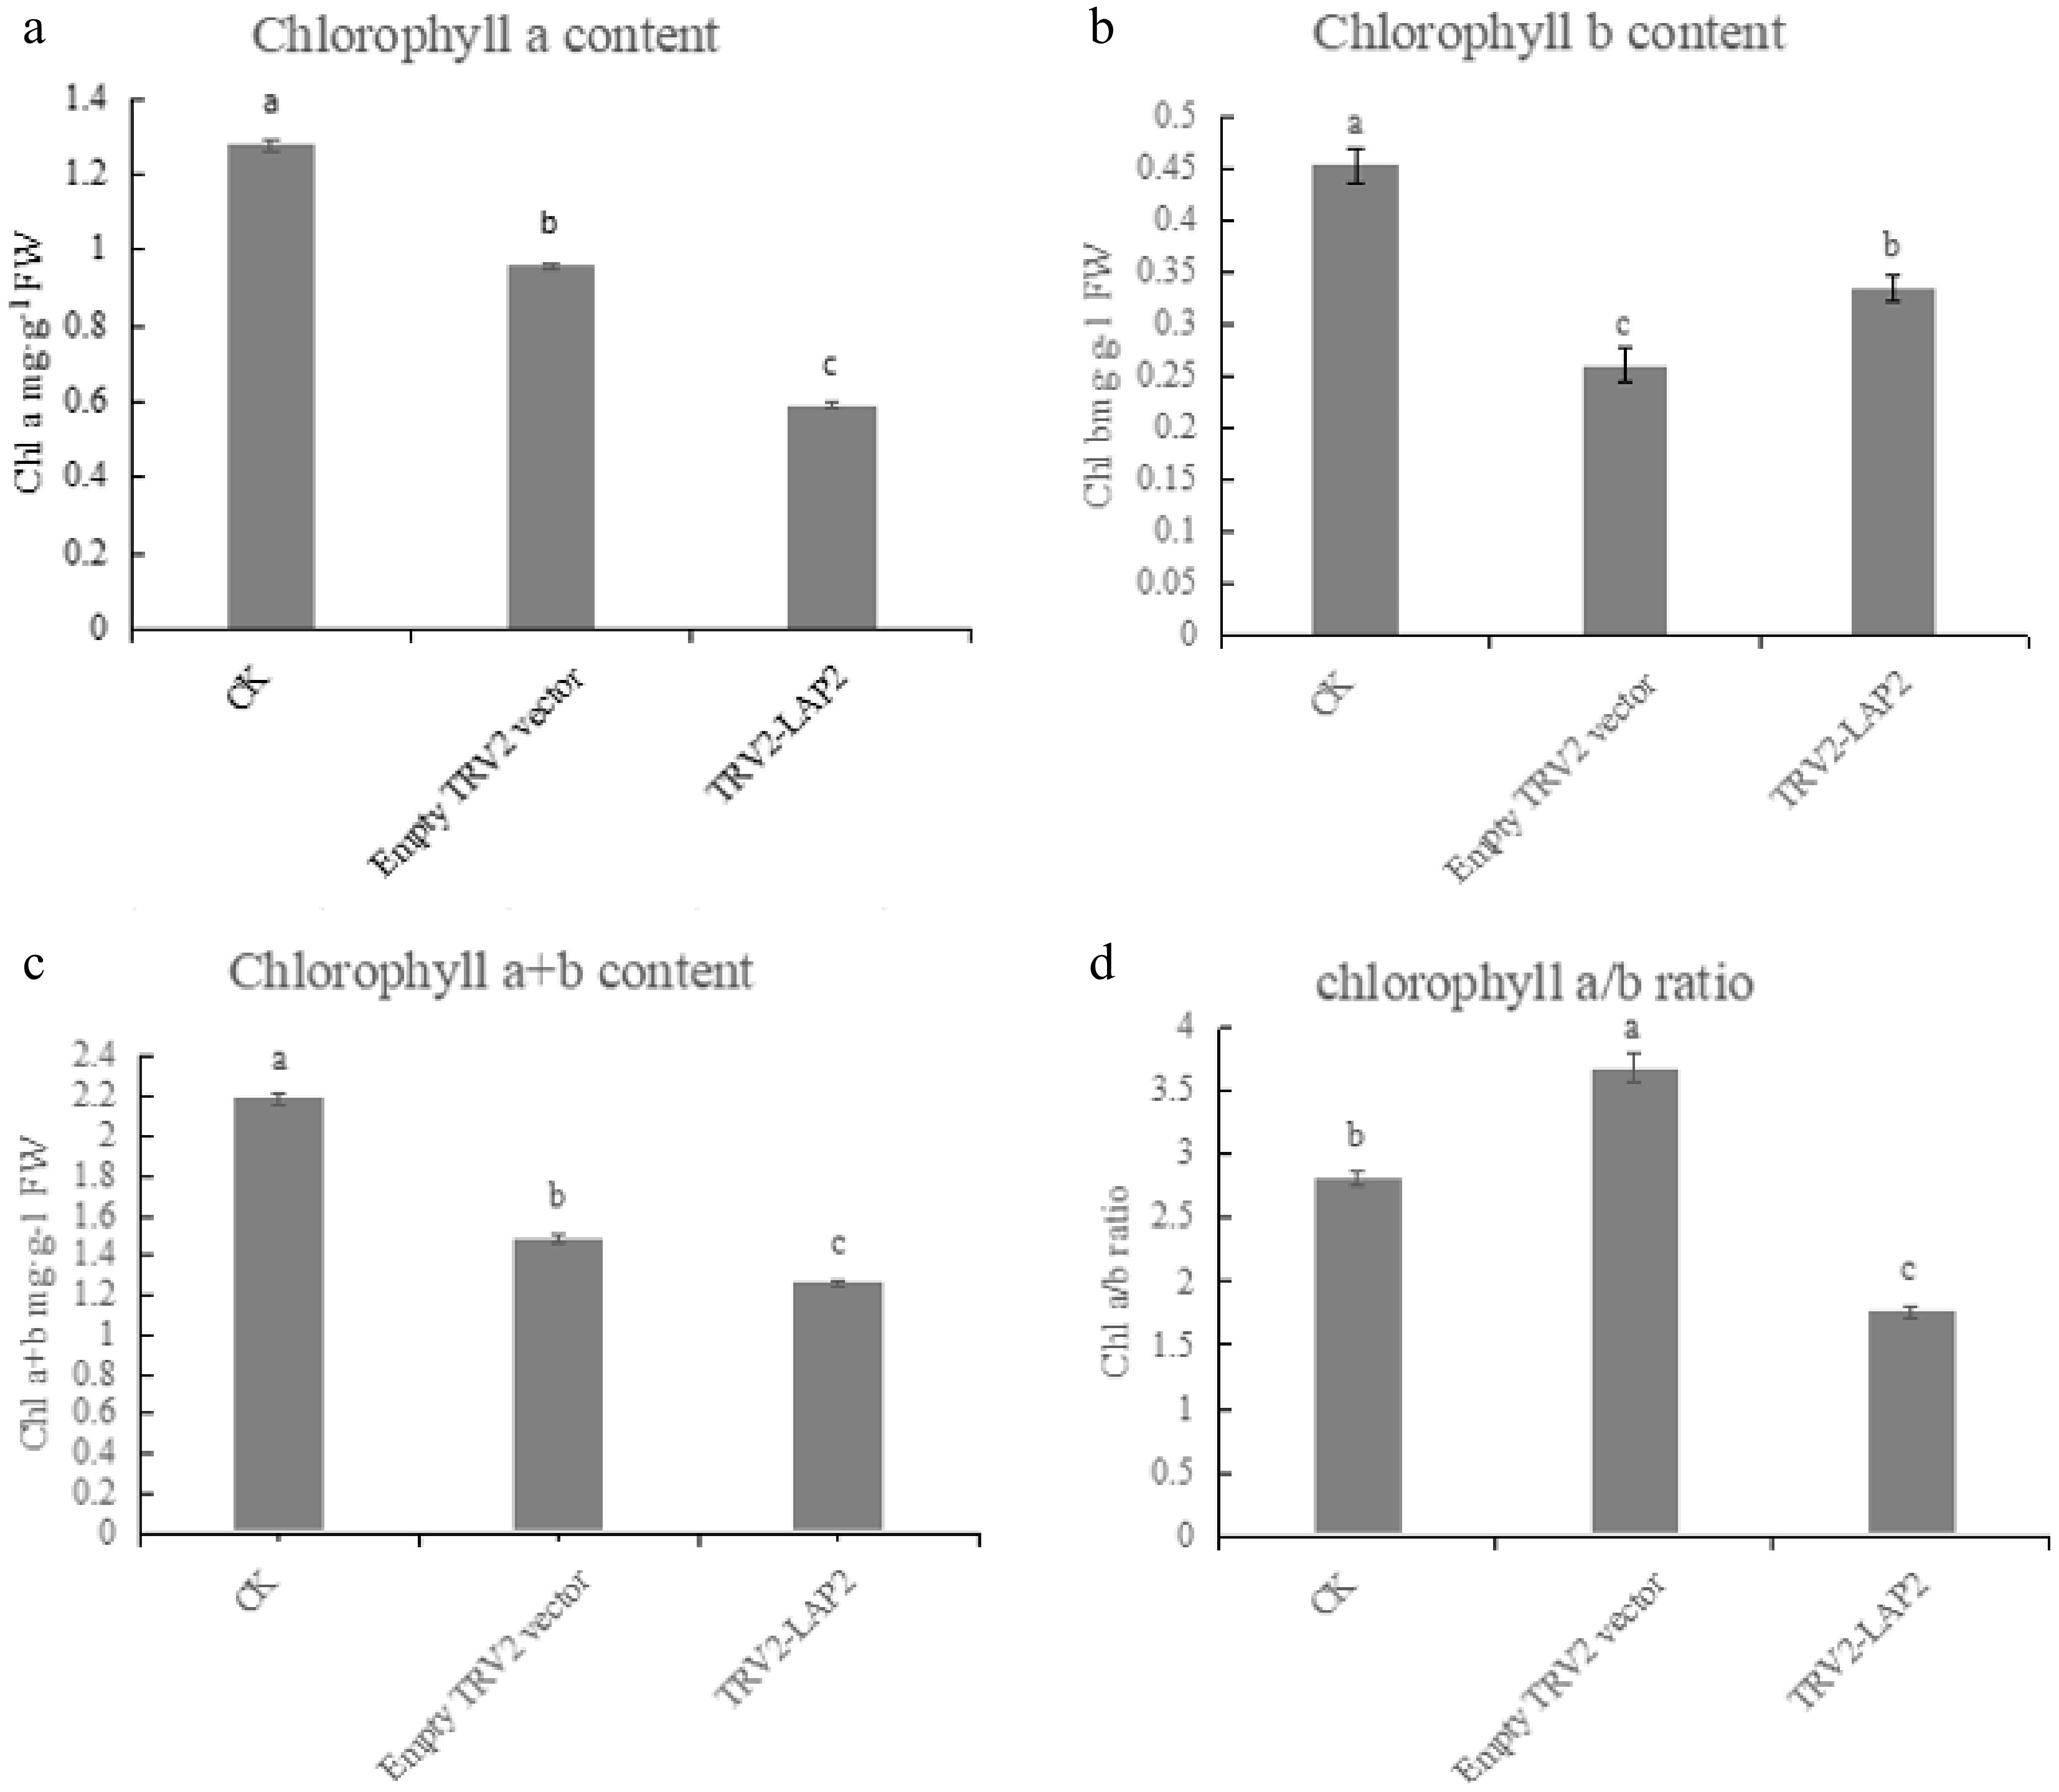
Figure 8.
Detection of chlorophyll content after silencing of CaLAP2. (a) Comparison of chlorophyll a content. (b) Comparison of chlorophyll b content. (c) Comparison of chlorophyll a + b content. (d) Comparison of the chlorophyll a/b ratio. Comparisons are significant at p < 0.05.
As shown in Fig. 9, the Fv/Fm value of TRV2-LAP2 plants was only 0.45, which is significantly lower than that of CK (0.75) and TRV2 (0.68). This demonstrates that silencing the CaLAP2 gene severely impairs the photochemical efficiency of pepper leaves.
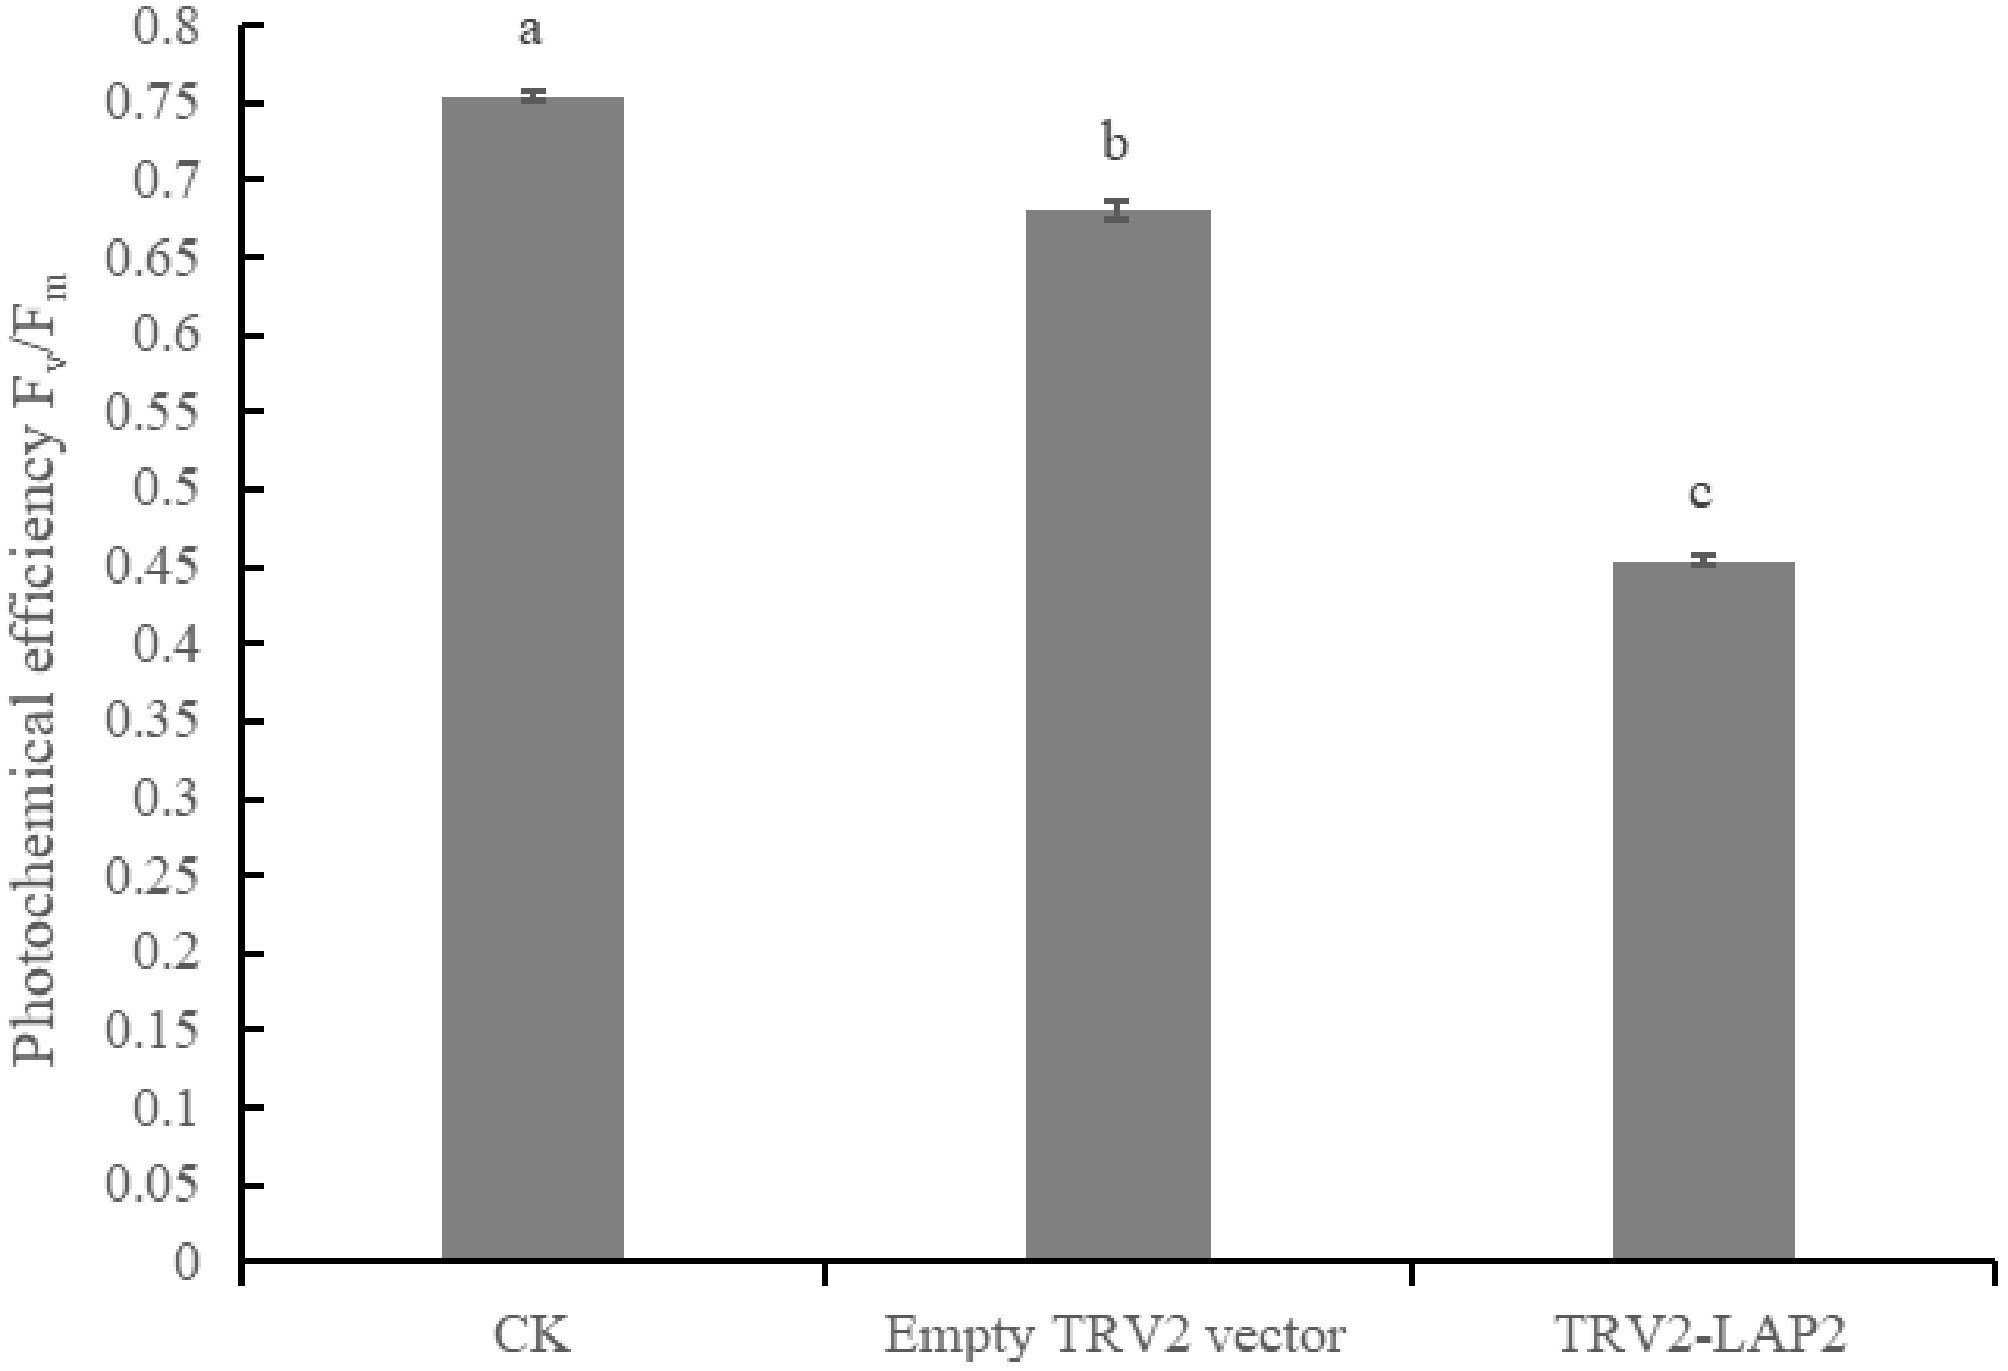
Figure 9.
Detection of photochemical efficiency (Fv/Fm) after silencing CaLAP2
-
In research on plant leaf color mutations, many mutants represent deleterious mutations, manifesting as reduced photosynthetic efficiency[39], decreased chlorophyll content[40], and abnormal chloroplast structure[41]. However, the leaf color mutant examined in this study initially shows leaf chlorosis, with older leaves reverting to green as the plants grow. The mutant has no obvious yield reduction, so the trait can also serve as a leaf color marker as an agronomic character, effectively turning a deleterious mutation into a beneficial one.
Yellow-leaf mutants often exhibit decreased photosynthetic capacity[42,43] and an abnormal chloroplast structure[44−46]. At present, research on plants' yellow leaf color mutations mainly focuses on the physiological and cytological aspects, such as the pigment metabolism[47], the chloroplast structure[43], and the light saturation mechanism[48]. In research on the genetic regulation mechanisms, most studies focus on genetic relationships, and it is currently believed that the traits of most yellow-leaf mutants are controlled by a single recessive gene[45,49]. In the research on candidate genes for yellow-leaf mutations, relevant genes have been identified via sequencing technologies in some plants. Examples include HemF in Forsythia suspensa[50] and CHLI in wheat (Triticum aestivum)[51], both of which are associated with chlorophyll biosynthesis. In peas (Pisum sativum), mutations in two genes, RKP and eIFiso4G, lead to abnormal chloroplast development[52]. However, research on yellow-leaf mutants in pepper has mostly focused on the mutants' characteristics, physiological mechanisms[6], and application value in breeding[53], with relatively few studies on mapping the mutated genes. Liu et al.[54] identified bHLH71 as a positive regulator of chlorosis mutations in pepper through multiomics approaches.
To identify the causal mutation, we screened SNP markers within the initial mapping intervals via BSA-seq and BSR-seq of the pepper leaf color mutant. These SNPs were then developed into KASP markers, which were then used for fine mapping in a population of 200 F2 individuals. The causal genes were thereby narrowed down to three intervals, namely 690,139–760,388, 5,084,723–5,277,105, and 5,281,991–5,516,629, encompassing 22 genes in total. Among these, four genes are associated with chloroplast function. The locus located in the interval 690,139–760,388 exhibits an exceptionally significant effect (LOD = 122.57), with a phenotypic contribution rate as high as 68%, indicating that this interval may harbor genes that are decisive for the trait. In contrast, the two loci located in the intervals 5,084,723–5,277,105 and 5,281,991–5,516,629 both show phenotypic contribution rates below 10%. This remarkable difference in effect size suggests that the 690,139–760,388 interval is likely a major QTL and serves as the core genetic determinant of the trait, whereas the two intervals 5,084,723–5,277,105 and 5,281,991–5,516,629 may function as minor QTLs, acting more akin to genetic modifiers. They might fine-tune the final phenotype through epistatic interactions with the major QTL or by regulating different physiological pathways. Capana09g000125 (designated CaLAP2) overlaps with the gene previously mapped by Sun et al.[6]. A base variation (GGA to GAA) in its exon results in an amino acid substitution from Gly to Glu, which is likely the key mutation responsible for the leaf color mutant.
LAP is a widely distributed metalloenzyme[55]. In tomato (Solanum lycopersicum), LAP is localized in the chloroplast stroma and plays a critical role in the transport of photosynthetic proteins[56]. LAP genes may influence chlorophyll biosynthesis by regulating proteolysis, given that leucine serves as a precursor for chlorophyll synthesis[57], and its metabolism relies on the activity of related proteolytic enzymes. Loss of LAP function could disrupt protein turnover, leading to abnormal chloroplast structure and impaired chlorophyll synthesis, consistent with findings in tomato where the silencing of proteasome subunits reduced chlorophyll content and hindered photosynthesis[58]. In this study, the pepper CaLAP2 gene was successfully silenced using VIGS, resulting in decreased leaf chlorophyll content and reduced photosynthetic rate. This complete evidence chain—from gene expression to physiological function—confirms that CaLAP2 is a key positive regulator in maintaining both chlorophyll accumulation and efficient photosynthesis in pepper leaves. This gene has also been associated with leaf senescence in Arabidopsis thaliana[30], where silencing of AtLAP2 led to leaf yellowing, reduced chlorophyll content, and decreased photochemical efficiency, which aligns with the results observed in this study.
The combined application of QTL fine mapping and multiomics integration plays a positive role in crop breeding[59], disease resistance research[60], and candidate gene identification[61]. Converting SNP markers into specific PCR markers via KASP technology significantly improves the precision of QTL mapping. For example, in research on peanut[62], QTL mapping using KASP localized the cold tolerance QTL to a 216.6-kb interval containing 15 genes. In studies on cauliflower and broccoli (both Brassica oleracea)[63], KASP technology was used to map the candidate genes controlling self-incompatibility to a 168.5-kb interval, where candidate genes highly homologous to those in Arabidopsis thaliana were identified. In current research, KASP-mediated QTL mapping technology, as a supplement to BSA-seq, can significantly narrow down the mapping interval. In research on rice[22], through BSA-seq and KASP marker-based local QTL analysis, the QTL associated with rice plant height was mapped to a 126-kb interval, and OsPH9 was selected as a candidate gene from the 15 genes contained in this interval. In research on peanut[25], SNPs related to peanut web blotch resistance were first developed via BSA-seq, followed by the development of KASP markers for QTL mapping, and two major QTLs were identified and converted into markers to distinguish peanut web blotch-resistant and susceptible materials. In research on wheat[64], the combination of BSA-seq and KASP technologies led to the identification of a potential stripe rust resistance gene through linkage analysis. With high throughput and low cost, KASP markers are well suited to gene mapping and validation. Integrated with BSA-seq and BSR-seq, they capture genome-wide variants and changes in expression, greatly speeding the discovery and breeding of key agronomic traits[25, 65−67].
Mapping the mutant gene of the leaf color mutant of pepper provides a foundation for studying the carotenoid and chlorophyll metabolic pathways in pepper, and holds positive significance for elucidating the color formation mechanisms of pepper fruits and leaves[68]. The impact of the mutant gene on chlorophyll biosynthesis and chloroplast development in pepper can improve the theoretical framework for photosynthetic efficiency in pepper[69], and also provides new evidence for the theory of coevolution between leaf color and flower color in plants[70].
-
The most significant result of studying the mutant gene in the pepper leaf color mutant lies in its application in breeding. The pepper leaf color mutant identified in this study transforms the adverse effects of the leaf color mutation into favorable traits: It can serve as a marker for purity identification and exhibits no undesirable agronomic traits despite being a yellow-leaf mutant. It can be used as a basic germplasm resource to create various types of new pepper germplasms through cross-breeding. In addition, referring to the research methods of other studies, this pepper can be developed into a new line with ornamental value and stress resistance. With the continuous advancement of research on gene editing in pepper, the introduction or knockout of key genes via gene editing technologies can improve the photosynthetic performance of pepper, ultimately enhancing its yield.
We are very grateful to the Chinese Cabbage Systems Biology Laboratory of the College of Horticulture at Nanjing Agricultural University for providing technical guidance.
-
The authors confirm their contributions to the paper as follows: conceptualization: Sun GS, Ma ZH, Zhang CW; data curation: Shan X, Sun GS, Xu DF; investigation: Sun GS, Shan X, Xu DF; project administration: Ma ZH, Zhang CW, Zhang ZC, Dai ZL; writing – original draft preparation: Sun GS, Shan X; writing – review and editing: Sun GS, Shan X, Liu LW. All authors reviewed the results and approved the final version of the manuscript.
-
All data generated or analyzed during this study are included in this published article.
-
The authors declare that they have no conflict of interest.
-
accompanies this paper online at: https://doi.org/10.48130/vegres-0026-0012.
-
# Authors contributed equally: Guo-Sheng Sun, Xi Shan
- Supplementary Table S1 The primer sequences used in the experiment.
- Supplementary Table S2 Information on KASP primers developed based on 21 SNP loci.
- Supplementary Table S3 Sampling information of pepper populations for genotyping.
- Supplementary Fig. S1 Identification of representative families and domains in the CaLAP2 protein sequence.
- Copyright: © 2026 by the author(s). Published by Maximum Academic Press, Fayetteville, GA. This article is an open access article distributed under Creative Commons Attribution License (CC BY 4.0), visit https://creativecommons.org/licenses/by/4.0/.
-
About this article
Cite this article
Sun G S, Shan X, Xu D F, Zhang Z C, Dai Z L, et al. 2026. Identification of CaLAP2 as a candidate gene for the yellow-green mutation in bell pepper through fine mapping of quantitative trait loci with kompetitive allele-specific polymerase chain reaction markers. Vegetable Research 6: e021 doi: 10.48130/vegres-0026-0012 

Identification of CaLAP2 as a candidate gene for the yellow-green mutation in bell pepper through fine mapping of quantitative trait loci with kompetitive allele-specific polymerase chain reaction markers
- Received: 03 December 2025
- Revised: 11 February 2026
- Accepted: 11 March 2026
- Published online: 11 June 2026
Abstract: Chili pepper (Capsicum annuum L.) is one of the most important vegetable crops worldwide, and leaf color mutants are valuable for studying chloroplast development and chlorophyll biosynthesis. This study used the yellow-green mutant 96-140YBM and its wild-type 96-140 as materials, aiming to fine-map candidate genes controlling the yellow leaf trait. On the basis of a preliminary mapping interval via bulked segregant analysis and bulked segregant RNA sequencing (BSA/BSR-seq) in the early stage, 21 single nucleotide polymorphism (SNP) markers were screened on chromosome 9 of pepper, which were developed into kompetitive allele-specific polymerase chain reaction (KASP) molecular markers. Genotyping analysis and quantitative trait locus (QTL) mapping were performed using 200 segregating F2 populations, and three intervals strongly associated with the yellow-green leaf trait were detected on chromosome 9 (690,139–760,388; 5,084,723–5,277,105; 5,281,991–5,516,629). Twenty-two genes were identified within the mapping intervals, four of which were related to chloroplast function. Capana09g000125 (named CaLAP2) was identified as the candidate gene. Sequence analysis revealed a base variation in its exon (GGA→GAA), resulting in a glycine (Gly) to glutamic acid (Glu) substitution. This mutation site was developed into a KASP marker for genotype–phenotype association analysis in the F2 population, and validation results showed that the association accuracy between this mutation site and the phenotype reached 96.5%. This study established a fine-mapping technical system combining BSA/BSR-seq with KASP markers, which significantly narrowed the mapping interval and rapidly located key genes for the yellow-green mutation. This work lays an important foundation for elucidating the molecular mechanisms of yellow-green mutants in pepper, functional verification, and their application in molecular marker-assisted selection breeding.
-
Key words:
- Capsicum annuum L. /
- Yellow-green mutation /
- QTL fine mapping /
- KASP /
- CaLAP2 /
- Marker-assisted selection