











-
Nitrogen (N) serves as an essential limiting factor for plant growth and productivity in agricultural production[1]. As the main component of proteins, nucleic acids, enzyme cofactors, and secondary metabolites, nitrogen is crucial for the growth and development of plants[2−5]. Proper application of nitrogen fertilizers can significantly enhance plant growth, NUE, and crop productivity[6,7]. Cucumber (Cucumis sativus L.) is a widely cultivated vegetable crop with a high demand for nitrogen fertilizers[8,9]. However, the excessive use of nitrogen fertilizers in recent years in China has led to restricted plant growth, reduced NUE, and lower fruit yield of cucumber[10]. Thus, improving the NUE of cucumber under high nitrogen conditions not only benefits the efficiency of nitrogen fertilizer use but is also crucial for increasing yields.
The NAC (NAM-ATAF1/2-CUC2) gene family comprises important transcription factors involved in various aspects of plant growth, development, and stress responses[11−15], and has recently been found to be closely related to plant NUE. In soybeans, NAC transcription factors SNAP1/2/3/4 control genes that trigger early nodule senescence and lower nitrogenase activity under high nitrogen conditions, ultimately reducing NUE[16]. GmNAC018 and GmNAC039, under normal nitrogen conditions, activate genes such as GmCYP35/GmCYP37, promoting nodule senescence and further reducing nitrogenase activity in soybean nodules[17]. OsSNAC1 enhances NUE in rice by upregulating the expression of OsNRT2.1/2.2 and OsNRT1.1A/1.1B[18]. Overexpression of TaNAC2-5A in wheat enhances root growth and nitrate influx rates, thereby increasing the root's ability to acquire nitrogen[19]. In apples, MdNAC4 increases abscisic acid (ABA) levels, promoting leaf senescence and reducing nitrogen absorption and utilization efficiency in roots under low nitrogen conditions[20]. MhNAC1 regulates high-affinity nitrogen transporters MhNRT2.4 and citrate transporters MhMATE to reduce the nitrogen absorption capacity in roots under low nitrogen conditions[21]. However, systematic research on the function of the NAC gene family in cucumber NUE has not yet been conducted.
The NAC gene family is extensive in plants; for instance, Arabidopsis has 105 members[22], rice has 151[23], maize has 87[24], soybean has 173[25] and melon has 82[26]. Liu et al.[27] identified 91 NAC genes in the V2 genome of Chinese long cucumbers. Guan et al.[28] completed a further update of the cucumber genome, upgrading it to the V4 genome, which expanded to 319 Mb, over 1.5 times the size of the V2 genome (193 Mb), which means more comprehensive and accurate sequencing data. Of the 91 genes identified by Liu et al.[27], only 75 could be accurately mapped to the V4 genome. Furthermore, the V2/V3 genome contains significant inaccuracies in the coding regions of these genes[28]. Moreover, Guan et al.[28] conducted a comprehensive analysis of gene expression across various cucumber tissues, offering critical insights into the tissue-specific expression patterns of the NAC gene family. The availability of the V4 genome and corresponding transcriptomic resources provides an opportunity to systematically reassess the NAC gene family and investigate its potential involvement in nitrogen-responsive processes in cucumber.
A recent genome-wide association study in cucumber demonstrated that whole-plant dry weight is strongly correlated with NUE (r = 0.834), supporting the use of biomass-related traits as indicators of NUE performance[29]. In our previous study, two cucumber lines exhibiting contrasting nitrogen use efficiency phenotypes under high nitrogen conditions were identified, including a high-NUE line (L2) and a low-NUE line (L8)[30]. L2 exhibited significantly greater biomass accumulation than L8 under high nitrogen conditions (see Results). Based on these resources, this study utilized the cucumber V4 genome and publicly available transcriptomic datasets from the Cucumber Multi-omics Database to systematically re-identify and characterize the NAC gene family in cucumber. Furthermore, expression profiling and weighted gene co-expression network analysis were performed to identify NAC genes associated with high-nitrogen responses and NUE-related traits. This work provides updated genomic resources and candidate genes for future functional studies of nitrogen response and NUE in cucumber.
-
Genomic and transcriptomic datasets of cucumber were obtained from the Cucumber-DB database (
http://cucumberdb.com ), while bottle gourd genome sequences were downloaded from the Cucurbit Genomics Database (http://www.cucurbitgenomics.org ). Arabidopsis protein sequences were retrieved from TAIR (http://www.arabidopsis.org ).To identify NAC family members in cucumber, the NAM domain profile (PF02365) was downloaded from the Pfam database (
http://pfam.sanger.ac.uk ) and used as a query in HMMER 3.0 (http://hmmer.org ) with an E-value threshold of 1[31,32]. Candidate proteins lacking a complete NAM domain were discarded. Conserved motifs in CsNAC proteins were subsequently identified using MEME v4.9.1 (http://nbcr-222.ucsd.edu/opal-jobs )[33]. Basic physicochemical properties, including protein length, molecular weight, and theoretical isoelectric point, were calculated using the ExPasy server (http://www.expasy.org/tools )[34]. Subcellular localization was predicted through WoLF PSORT[35]. Raw RNA-seq data generated under high-nitrogen treatment are publicly available in the Sequence Read Archive (SRA) under accession number PRJNA1175851[30].Phylogenetic and chromosomal analysis
-
Phylogenetic relationships among NAC proteins were inferred in MEGA11 using the Maximum Likelihood (ML) method with 1,000 bootstrap replications to assess branch reliability[36]. The protein sequences are listed in Supplementary File 1.
Chromosomal position information was extracted and summarized using the 'Fasta Stats' module of TBtools. The distribution of NAC genes across cucumber chromosomes was visualized with the 'Gene Locations Visualize from GTF/GFF' function. Gene duplication events and syntenic relationships were analyzed using the 'One Step MCScanX' workflow and displayed with the Dual Synteny Plot tool[37]. In addition, predicted subcellular localization information was integrated into gene annotations using ID-convert.
Gene structure, conserved motif, and cis-element analysis
-
Gene structural organization was analyzed using the Gene Structure Display Server 2.0 (GSDS) (
http://gsds.gao-lab.org/ )[38]. Conserved protein domains were identified through NCBI Batch CD-Search (www.ncbi.nlm.nih.gov/Structure/bwrpsb/bwrpsb.cgi ). Conserved motifs within NAC proteins were detected using MEME, with the maximum number of motifs set to 10[33].For promoter analysis, the 2,000 bp genomic region upstream of each transcription start site was extracted and submitted to PlantCARE (
http://bioinformatics.psb.ugent.be/webtools/plantcare/html ) to identify putative cis-regulatory elements[39]. The results of gene structure, motif composition, and cis-element distribution were integrated and visualized using the 'Gene Structure View Advanced' function in TBtools[37]. The promoter sequences are listed in Supplementary File 2.Correlation and expression pattern analysis
-
Expression profiles of NAC genes across different cucumber tissues were obtained from the Cucumber Multi-omics Database (cucumberdb.com)[28]. The transcriptomic data of different tissues are listed in Supplementary Table S1. A schematic diagram illustrating the various tissues along with their full names is provided in Supplementary Fig. S1. The analyzed tissues included root, leaf, seedling, flower, ovary, unpollinated fruit, pollinated fruit, mature fruit mesocarp, and seed. Spearman correlation coefficients among NAC genes were calculated using R software. Correlation matrices were visualized as heatmaps using TBtools[37]. Transcriptomic datasets derived from roots of the high-NUE cucumber line L2 and the low-NUE cucumber line L8 under high-nitrogen treatment (20 mmol L–1 nitrate) were obtained from our previous study[30]. Detailed data are listed in Supplementary Table S2. Differential expression analysis was performed using the edgeR package. Gene expression values were normalized using the Trimmed Mean of M-values (TMM) method, and statistical significance was estimated based on a negative binomial distribution model[40].
To control the false discovery rate, raw p-values were adjusted using the Benjamini–Hochberg procedure. Genes with an adjusted p-value < 0.05 and |log2(fold change)| ≥ 1 were considered significantly differentially expressed. Venn diagrams illustrating overlapping DEGs were generated using R software.
Weighted Gene Co-expression Network Analysis (WGCNA) was conducted using transcriptome data from 14 samples through the Novamagic cloud platform. A soft-thresholding power was selected according to the scale-free topology criterion. Genes were clustered based on Topological Overlap Matrix (TOM)-based dissimilarity, and modules were identified using dynamic tree cutting. Module–trait relationships were evaluated using Pearson correlation analysis[41].
Plant materials and biomass measurement
-
The cucumber lines L2 and L8 used in this study were previously identified as contrasting nitrogen use efficiency (NUE) genotypes under high nitrogen conditions[30]. Seeds were germinated and grown hydroponically as previously described[30]. Plants were subjected to high-nitrogen treatment (20 mmol L–1 nitrate), and samples were collected at the same developmental stage used for transcriptome analysis.
To evaluate growth performance under high-nitrogen conditions, dry weight was determined after drying plant samples at 95 °C until a constant weight was reached. Three biological replicates were analyzed for each treatment.
Protein interaction network prediction and interaction site analysis
-
Potential protein–protein interaction networks were predicted using the STRING database with default parameters (
https://cn.string-db.org ). Three-dimensional protein structures were generated using AlphaFold3 under default settings for speed and copy number[42]. Predicted interaction interfaces and structural features were visualized and analyzed using PyMOL v3.1.0.Quantitative real-time PCR analysis
-
Plants were grown hydroponically as previously described[30]. Root samples were collected from L2 and L8 at 3 and 48 h after high-nitrogen treatment. Gene-specific primers were designed based on sequences obtained from the NCBI database (
www.ncbi.nlm.nih.gov ) and are listed in Supplementary Table S3. Primers were synthesized by Sangon Biotech (Shanghai, China).Total RNA was extracted and reverse transcribed into cDNA following the procedures described previously[30]. Quantitative real-time PCR (qRT-PCR) was performed using SYBR Green chemistry on a Bio-Rad CFX96 Real-Time PCR System. Relative gene expression levels were calculated using the 2−ΔΔCᴛ method, with EF1α serving as the internal reference gene. Three biological replicates were analyzed for each sample.
Statistical analysis
-
All experimental data are presented as the mean ± standard deviation (SD) of three biological replicates.
Student's t-test was used to compare differences between two groups, such as control and high-nitrogen treatments. One-way analysis of variance (ANOVA) followed by Duncan's multiple range test was used for comparisons among three or more groups. Differences were considered statistically significant at p < 0.05 and highly significant at p < 0.01. In figures, * and ** indicate significant differences at p < 0.05 and p < 0.01, respectively.
-
A total of 88 members of the NAC gene family were identified, designated as CsNACx.xx, where 'XX' represents the species name, the first 'x' indicates the gene's chromosomal location, and the following two 'x's denote the gene number. Based on protein sequences, a phylogenetic tree was constructed, classifying these members into six subfamilies, labeled NAC-I through NAC-VI (Fig. 1). The NAC-I and NAC-II subfamilies contained the largest number of genes, with each comprising 26 members. In contrast, the NAC-VI subfamily included only one gene, suggesting its specialized role or recent evolutionary development. The NAC-III, NAC-IV, and NAC-V subfamilies contained 21, five, and nine genes, respectively. Detailed information on gene ID conversion is listed in Supplementary Table S4.
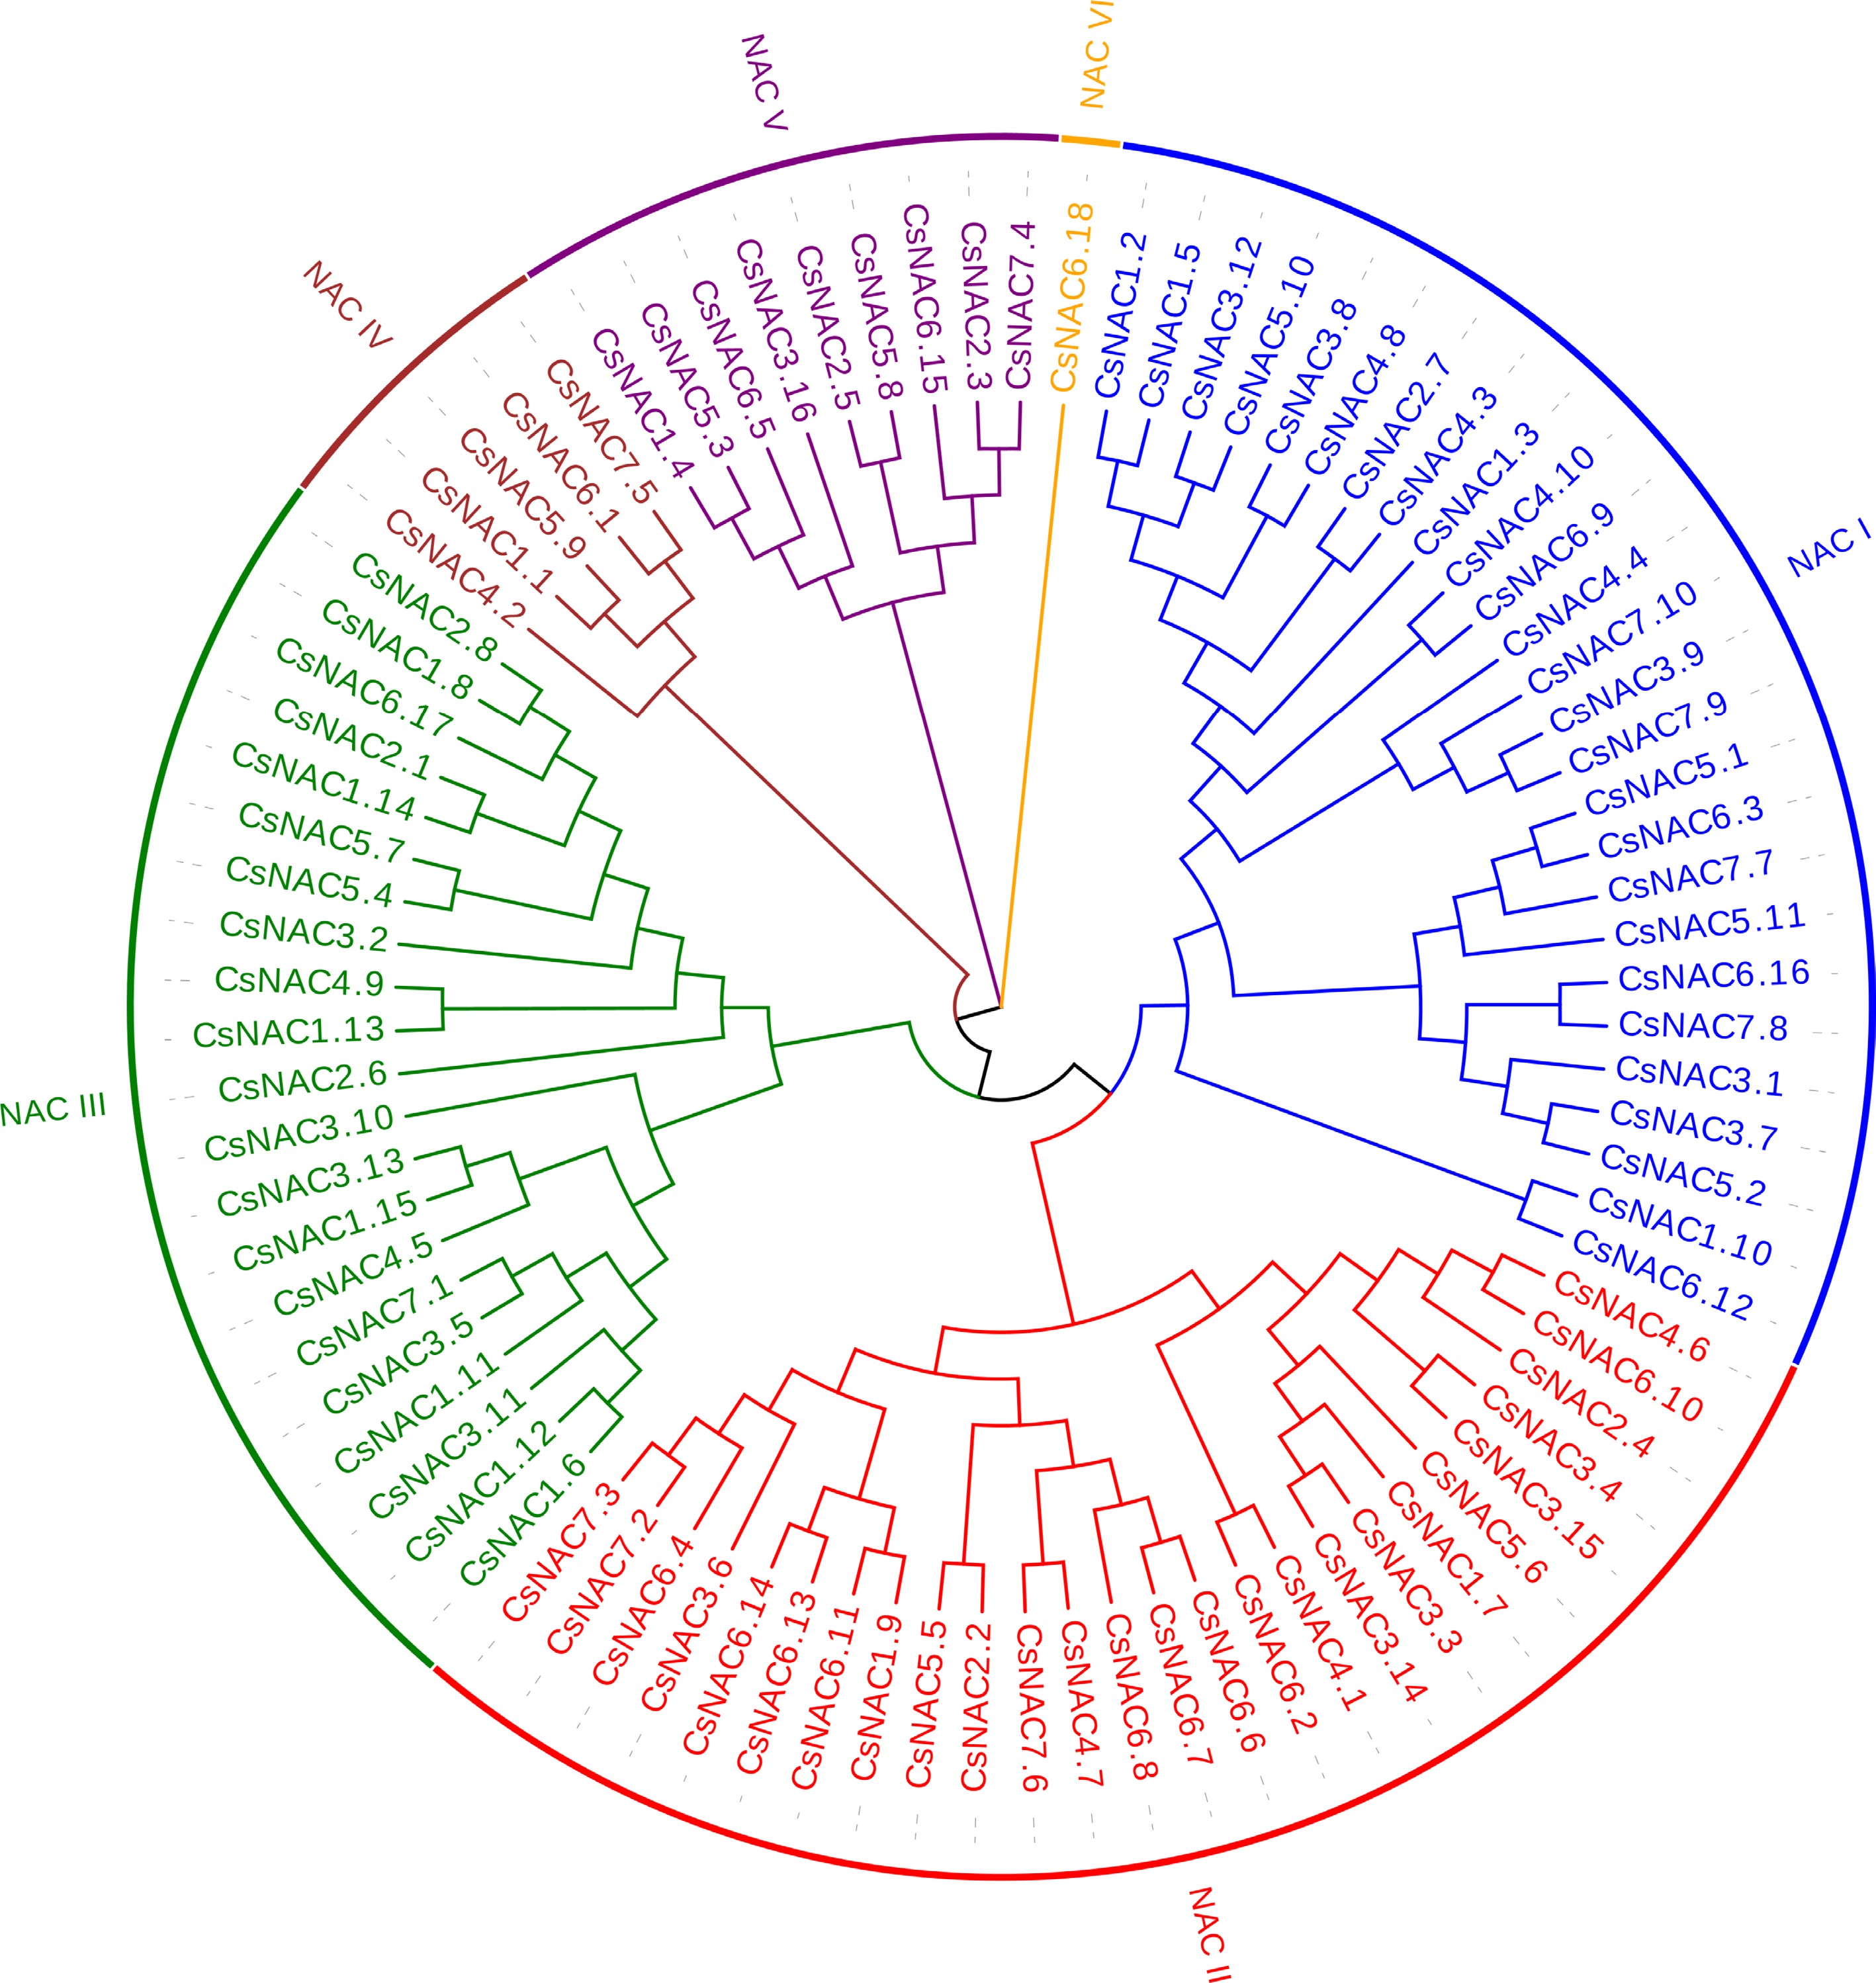
Figure 1.
Phylogenetic tree of NAC proteins in cucumber. Amino acid sequences were aligned using CLUSTAL W, and a phylogenetic tree with 1,000 bootstrap replicates was generated using MEGA 11. Each subfamily is distinctly represented by a specific color.
Chromosomal and subcellular localization of CsNAC genes
-
Figure 2 depicts the distribution of the 88 NAC genes across the 7 chromosomes of cucumber, revealing a heterogeneous pattern. Chr6 had the greatest number of genes, totaling 18, followed by Chr3 with 16 genes, and Chr2 with the fewest, at only 8. Genes such as CsNAC1.1-CsNAC1.5, CsNAC3.1-CsNAC3.6, CsNAC3.11-CsNAC3.16, CsNAC4.8-CsNAC4.10, CsNAC5.5-CsNAC5.11, CsNAC6.16-CsNAC6.18, and CsNAC7.1-CsNAC7.4 were located near the telomeric regions, areas characterized by high gene density. In contrast, the central portions of the chromosomes exhibited fewer NAC genes and lower gene density.
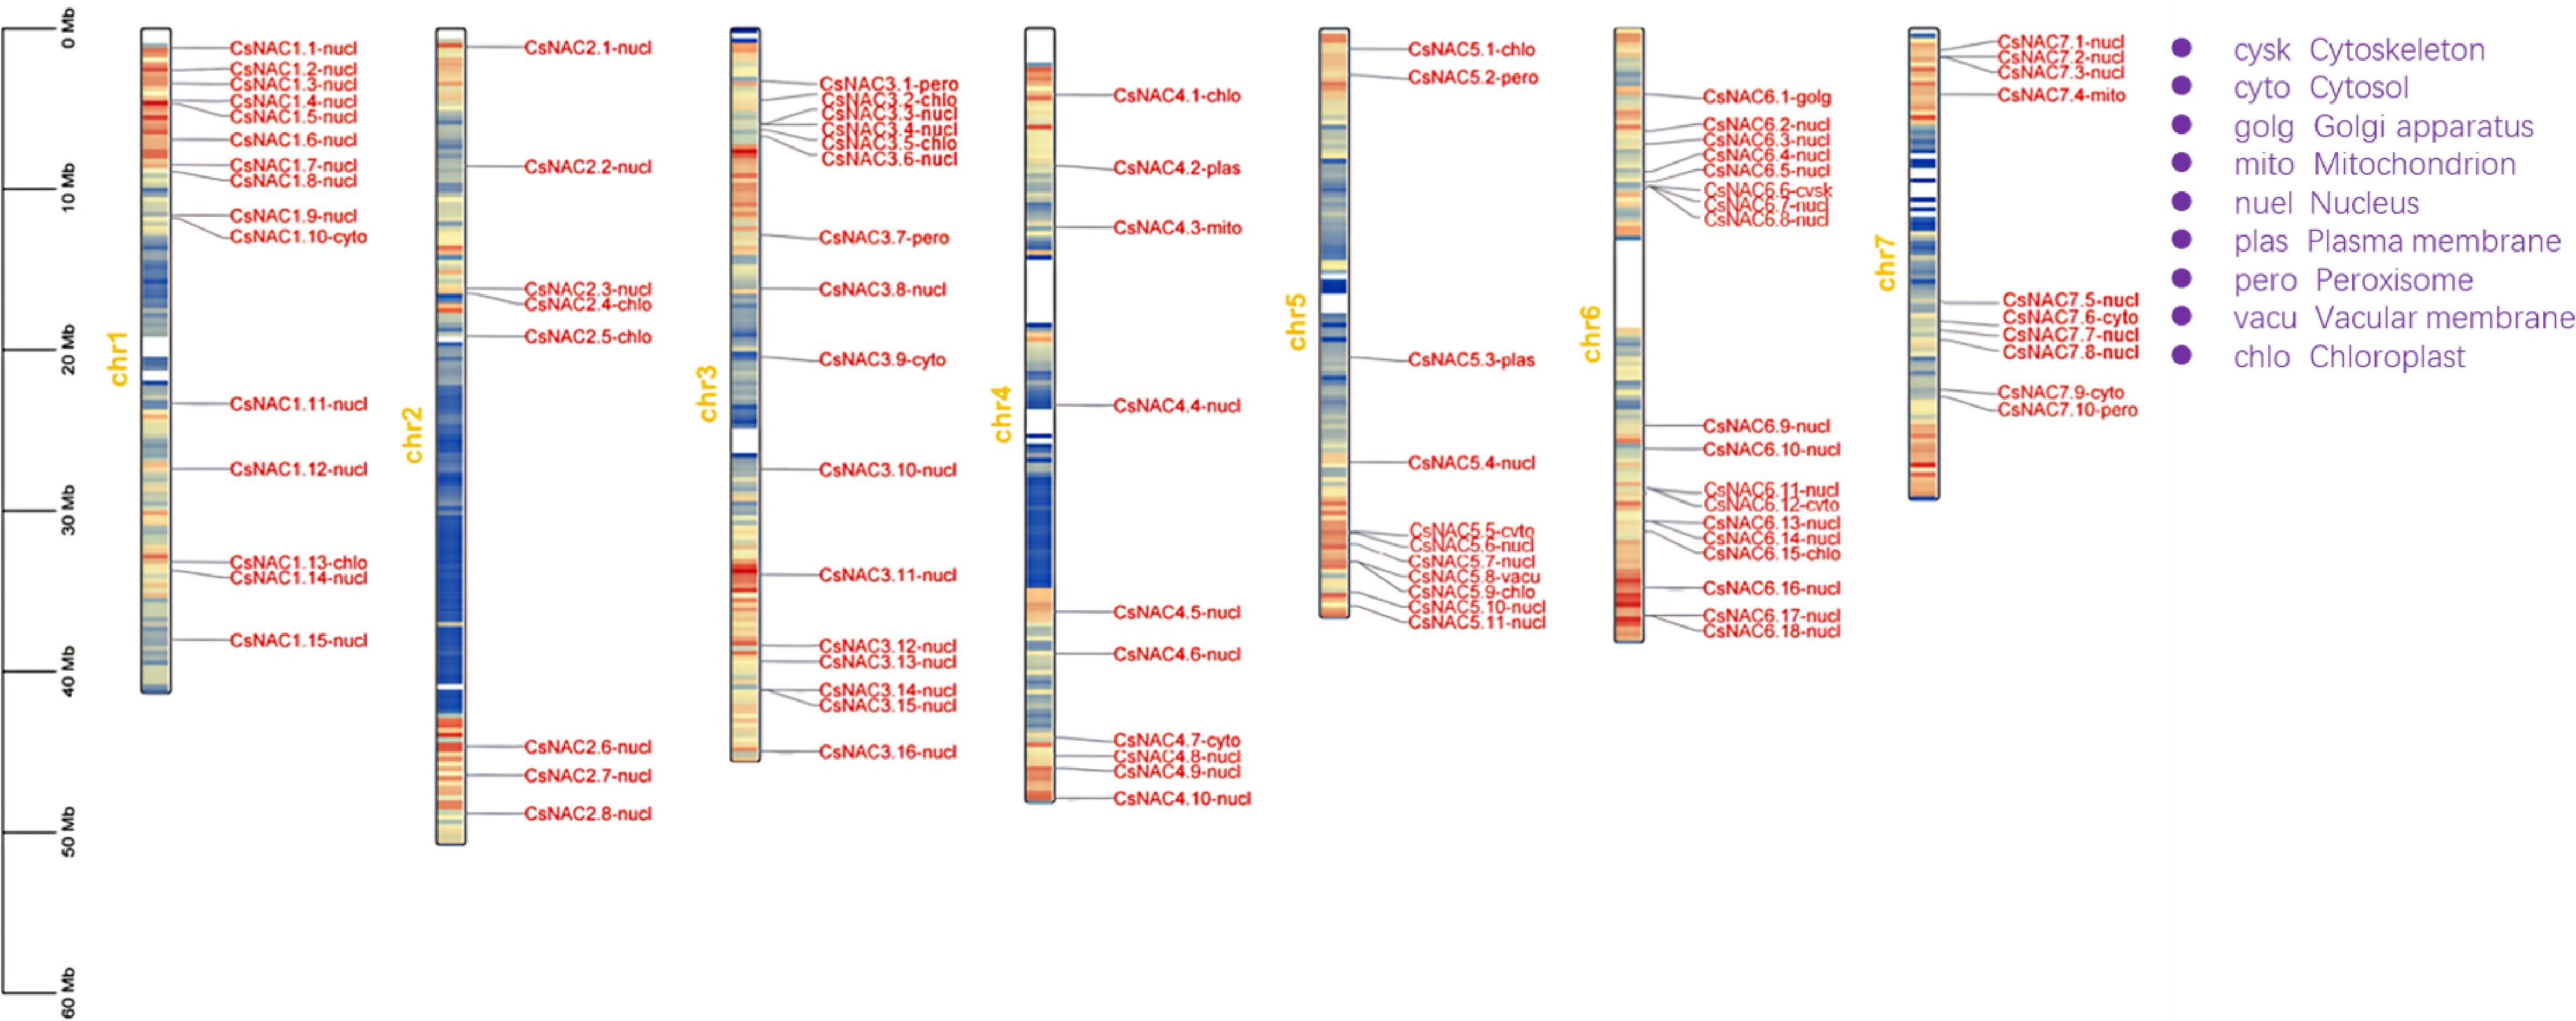
Figure 2.
Chromosomal localization and subcellular localization prediction of the cucumber NAC gene family. The left scale indicates chromosome length, with gene names followed by their predicted subcellular localizations. Full names are labeled in purple at the top right. Yellow numbers indicate chromosome counts, and the blue-to-red gradient represents gene density.
Subcellular localization predictions predominantly identified a nuclear presence for 61 genes, aligning with the conventional role of NAC proteins as transcription factors. Moreover, nine genes were anticipated to localize within chloroplasts, hinting at a potential involvement in plastid-associated functions. Other cellular compartments such as the cytoplasm, peroxisomes, mitochondria, the Golgi apparatus, the cytoskeleton, the plasma membrane, and the vacuolar membrane contained seven, four, two, one, one, two, and one genes, respectively.
Some NAC genes were located in regions of high gene density on chromosomes, suggesting that these genes could be conserved. The distribution and subcellular localization of NAC genes in cucumber highlight their multifaceted roles across cellular and chromosomal contexts. Most NAC genes localize to the nucleus, confirming their primary function as transcription factors. The presence of NAC genes in chloroplasts and other cellular compartments indicates that NAC proteins play crucial roles in a wide range of physiological functions.
Comparative synteny analysis of the CsNAC gene family
-
Comparative synteny analysis among the NAC gene families from cucumber, Arabidopsis, watermelon, and melon revealed significant conservation and variation in gene homology. As depicted in Fig. 3, of the 88 NAC genes identified in cucumber, 54 exhibit homology with genes in Arabidopsis. Specifically, 15 homologous genes were present on each of Arabidopsis Chr1 and Chr5, while Chr4 contained the fewest, with only three.
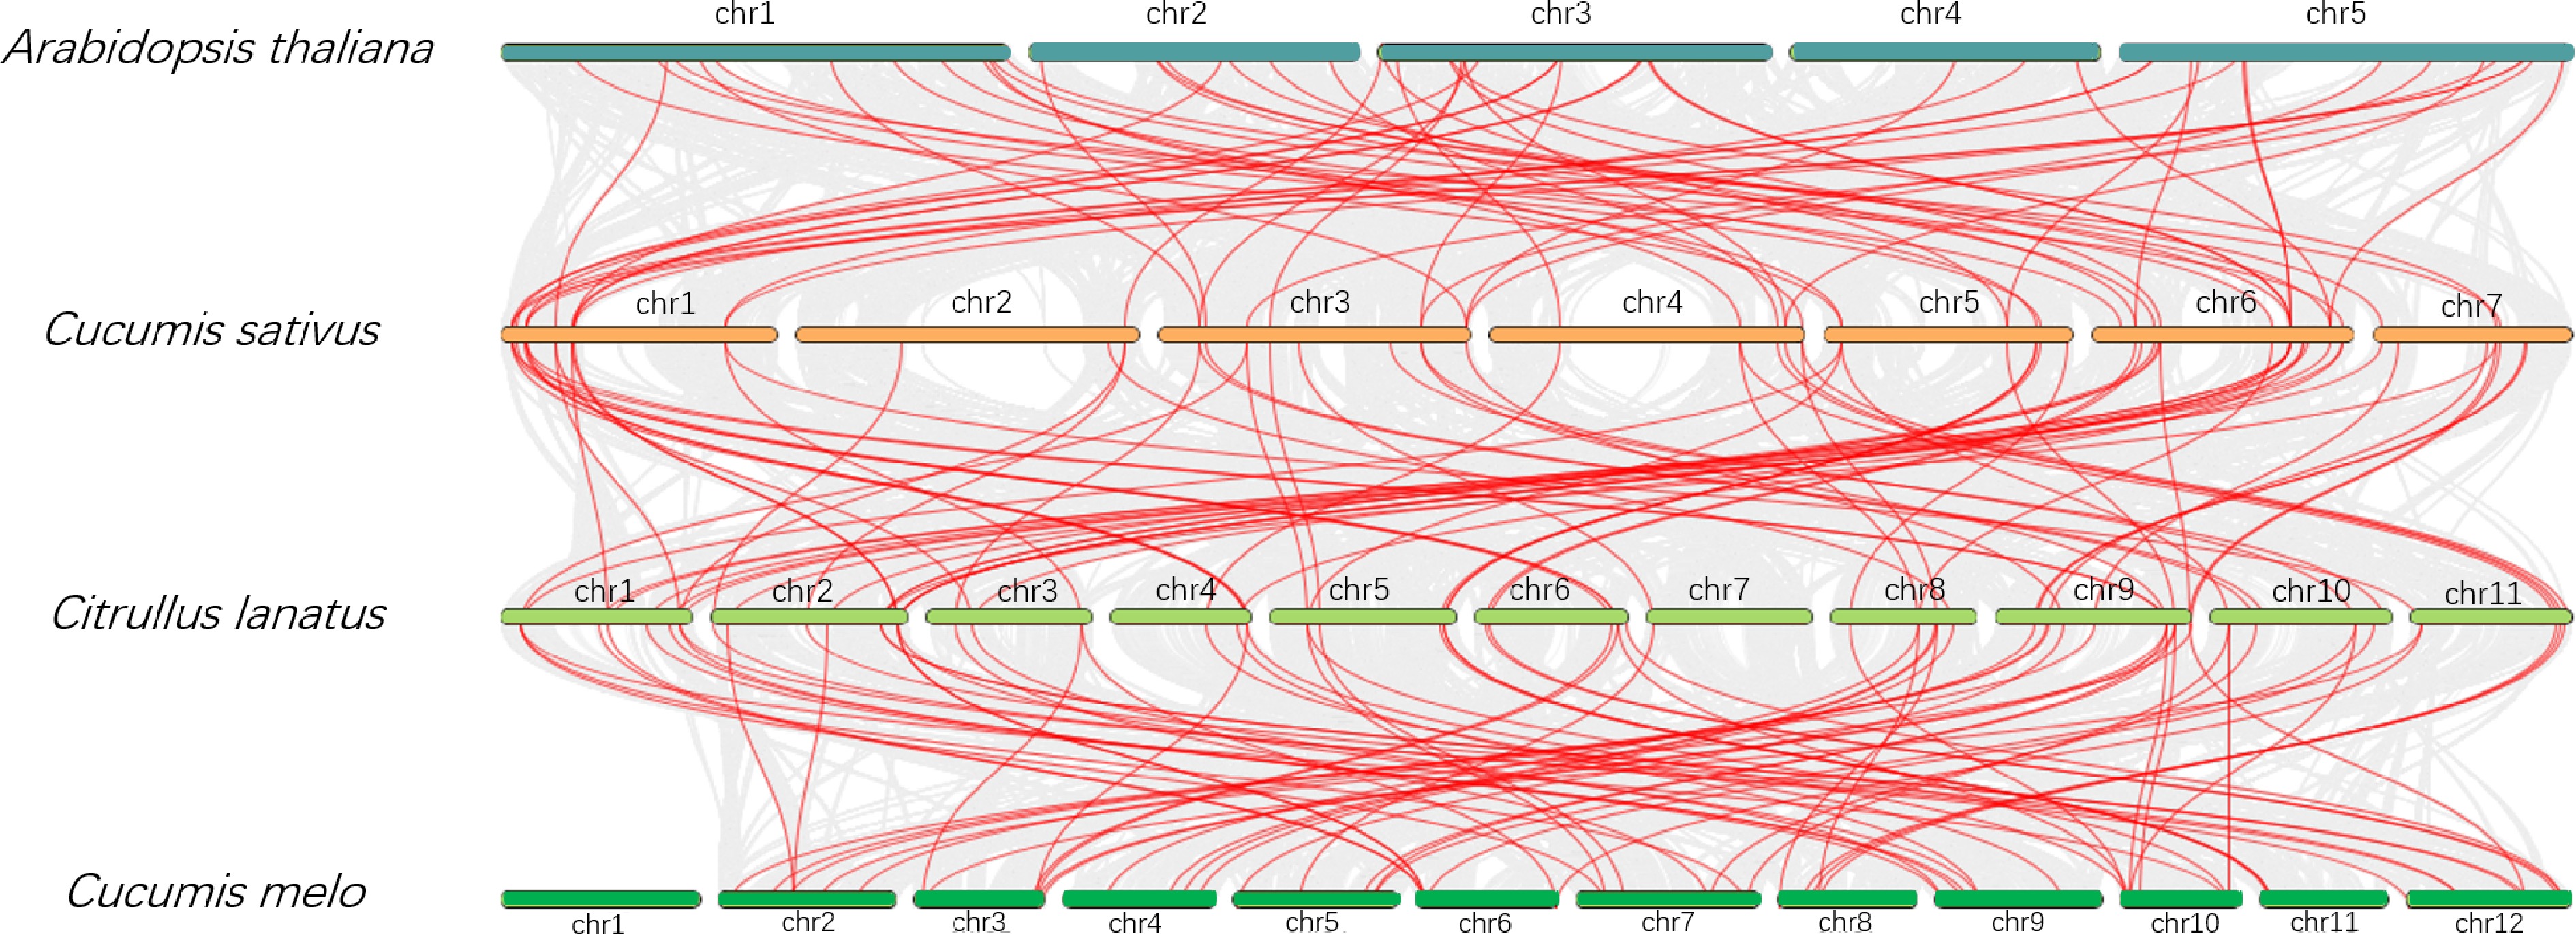
Figure 3.
Comparative analysis of NAC gene family collinearity among cucumber, watermelon, melon, and Arabidopsis. Chromosomes are color-coded by species, and chromosome numbers are labeled. Gene locations are linked across species with red lines.
A considerable number of homologs, totaling 70, were shared between cucumber and watermelon. Chr2 and Chr9 in watermelon each had 12 homologous genes, indicating potential shared evolutionary pressures or functional significance. In contrast, Chr7 hosts only a single homolog.
Cucumber and melon also demonstrated significant homology, with 64 genes shared between the two. These genes were relatively evenly distributed across melon chromosomes, except for Chr1. Melon Chr11 had the most homologous genes, numbering seven, whereas Chr7 and Chr10 each contained only three.
NAC genes located in the high-density regions of cucumber chromosomes exhibited high conservation across the four species, such as the tops of Chr1 and Chr6, and the bottoms of Chr4, Chr5, and Chr6. The results indicated that NAC genes were conserved in these species, especially within the Cucurbitaceae family, with a homology as high as 79.55% with watermelon.
Structural and sequence analysis of the CsNAC gene family
-
To elucidate the relationship between the structure and functionality of NAC genes in cucumber, comprehensive analyses were conducted on their conserved domains, exon structures, and cis-regulatory elements, as shown in Fig. 4. Ten distinct conserved motifs were identified across the NAC gene family, with members within the same subfamily typically displaying similar motifs and structural domains.
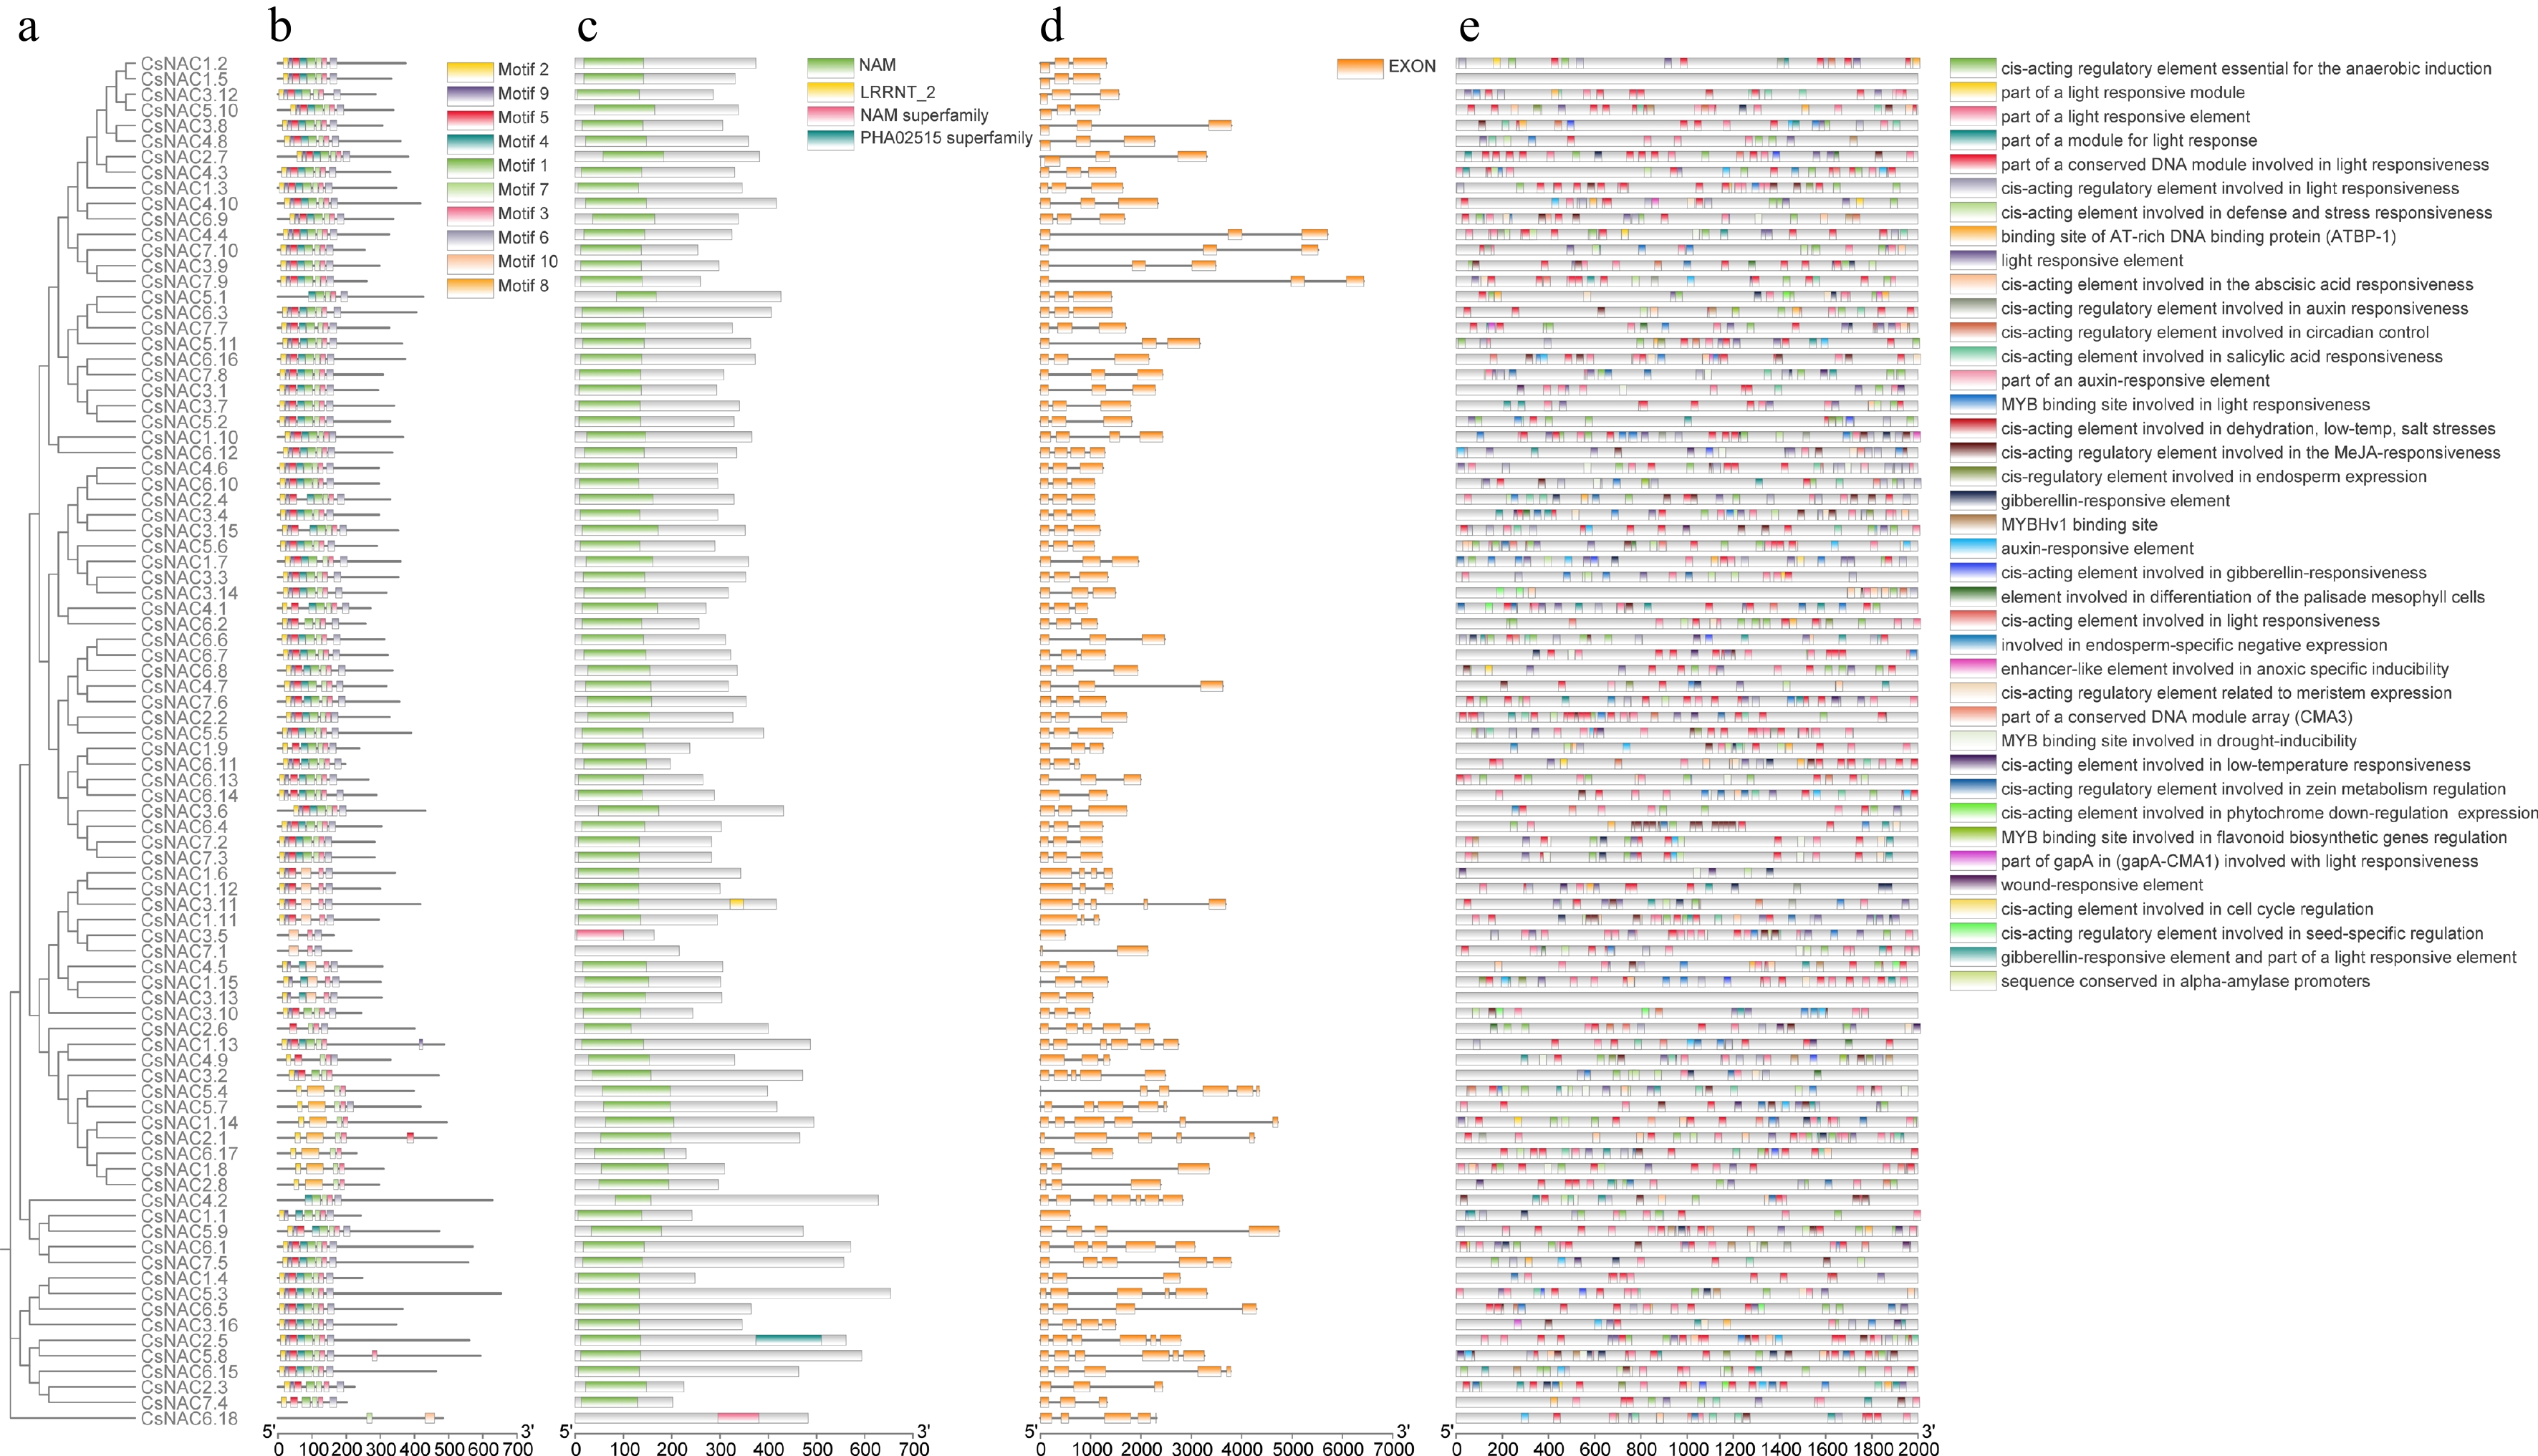
Figure 4.
Phylogenetic, exon-intron structure, and cis-element analysis of CsNAC genes. (a) Phylogenetic tree of gene family members. (b) Distribution of conserved motifs. (c) Protein structural domains. (d) Exon distribution. (e) Distribution of cis-regulatory elements in the promoter region (−2,000 bp). Different colors and shapes represent various types of cis-regulatory elements.
Extensive cis-acting regulatory elements were identified within the promoter regions of CsNAC genes, indicating intricate regulatory mechanisms. Light-responsive elements were predominant, highlighting the critical role of light signaling in regulating these genes. The analysis also revealed a diverse array of stress-responsive elements, particularly those responsive to salicylic acid and abscisic acid, which are central to plant stress response pathways. Additional elements included MYB binding sites, associated with various regulatory roles in growth and stress responses, and methyl jasmonate-responsive elements, linked to plant defense mechanisms.
Moreover, the promoter regions of CsNAC genes were enriched with elements involved in alcohol-soluble protein metabolism and circadian rhythms, suggesting their roles in daily metabolic and physiological activities. Notably, abscisic acid-responsive elements, auxin-responsive elements, and elements related to alcohol-soluble protein metabolism may be involved in nitrogen utilization, indicating a potential link between NAC gene expression and nitrogen metabolism efficiency.
These findings highlight the complex regulatory architecture governing the CsNAC gene family, reflecting their crucial roles in plant developmental processes and stress responses. Integrating structural data with regulatory elements provides valuable insights into the functional dynamics of CsNAC genes, which may be critical for enhancing stress resilience and metabolic efficiency in cucumber.
Expression correlation analysis of CsNAC genes across plant tissues
-
To elucidate the complex expression dynamics of the CsNAC gene family in cucumber, a comprehensive correlation analysis was conducted on transcript data from 31 diverse samples, including roots, leaves, stems, flowers, ovaries, and fruit. Detailed information on the sample distribution is provided in Supplementary Table S5.
The resulting correlation heatmap (Fig. 5a) indicated that 9 of the 88 CsNAC genes were not expressed in any of the sampled tissues. Moreover, 55 genes exhibited strong intercorrelation, with correlation coefficients exceeding 0.7, suggesting a robust correlation in expression within the gene family. Specifically, genes in the NAC-II subfamily—such as CsNAC2.4, CsNAC6.10, CsNAC5.6, and CsNAC4.6—as well as those in the NAC-I subfamily, including CsNAC5.1, CsNAC3.1, and CsNAC3.7, showed correlation coefficients greater than 0.8.
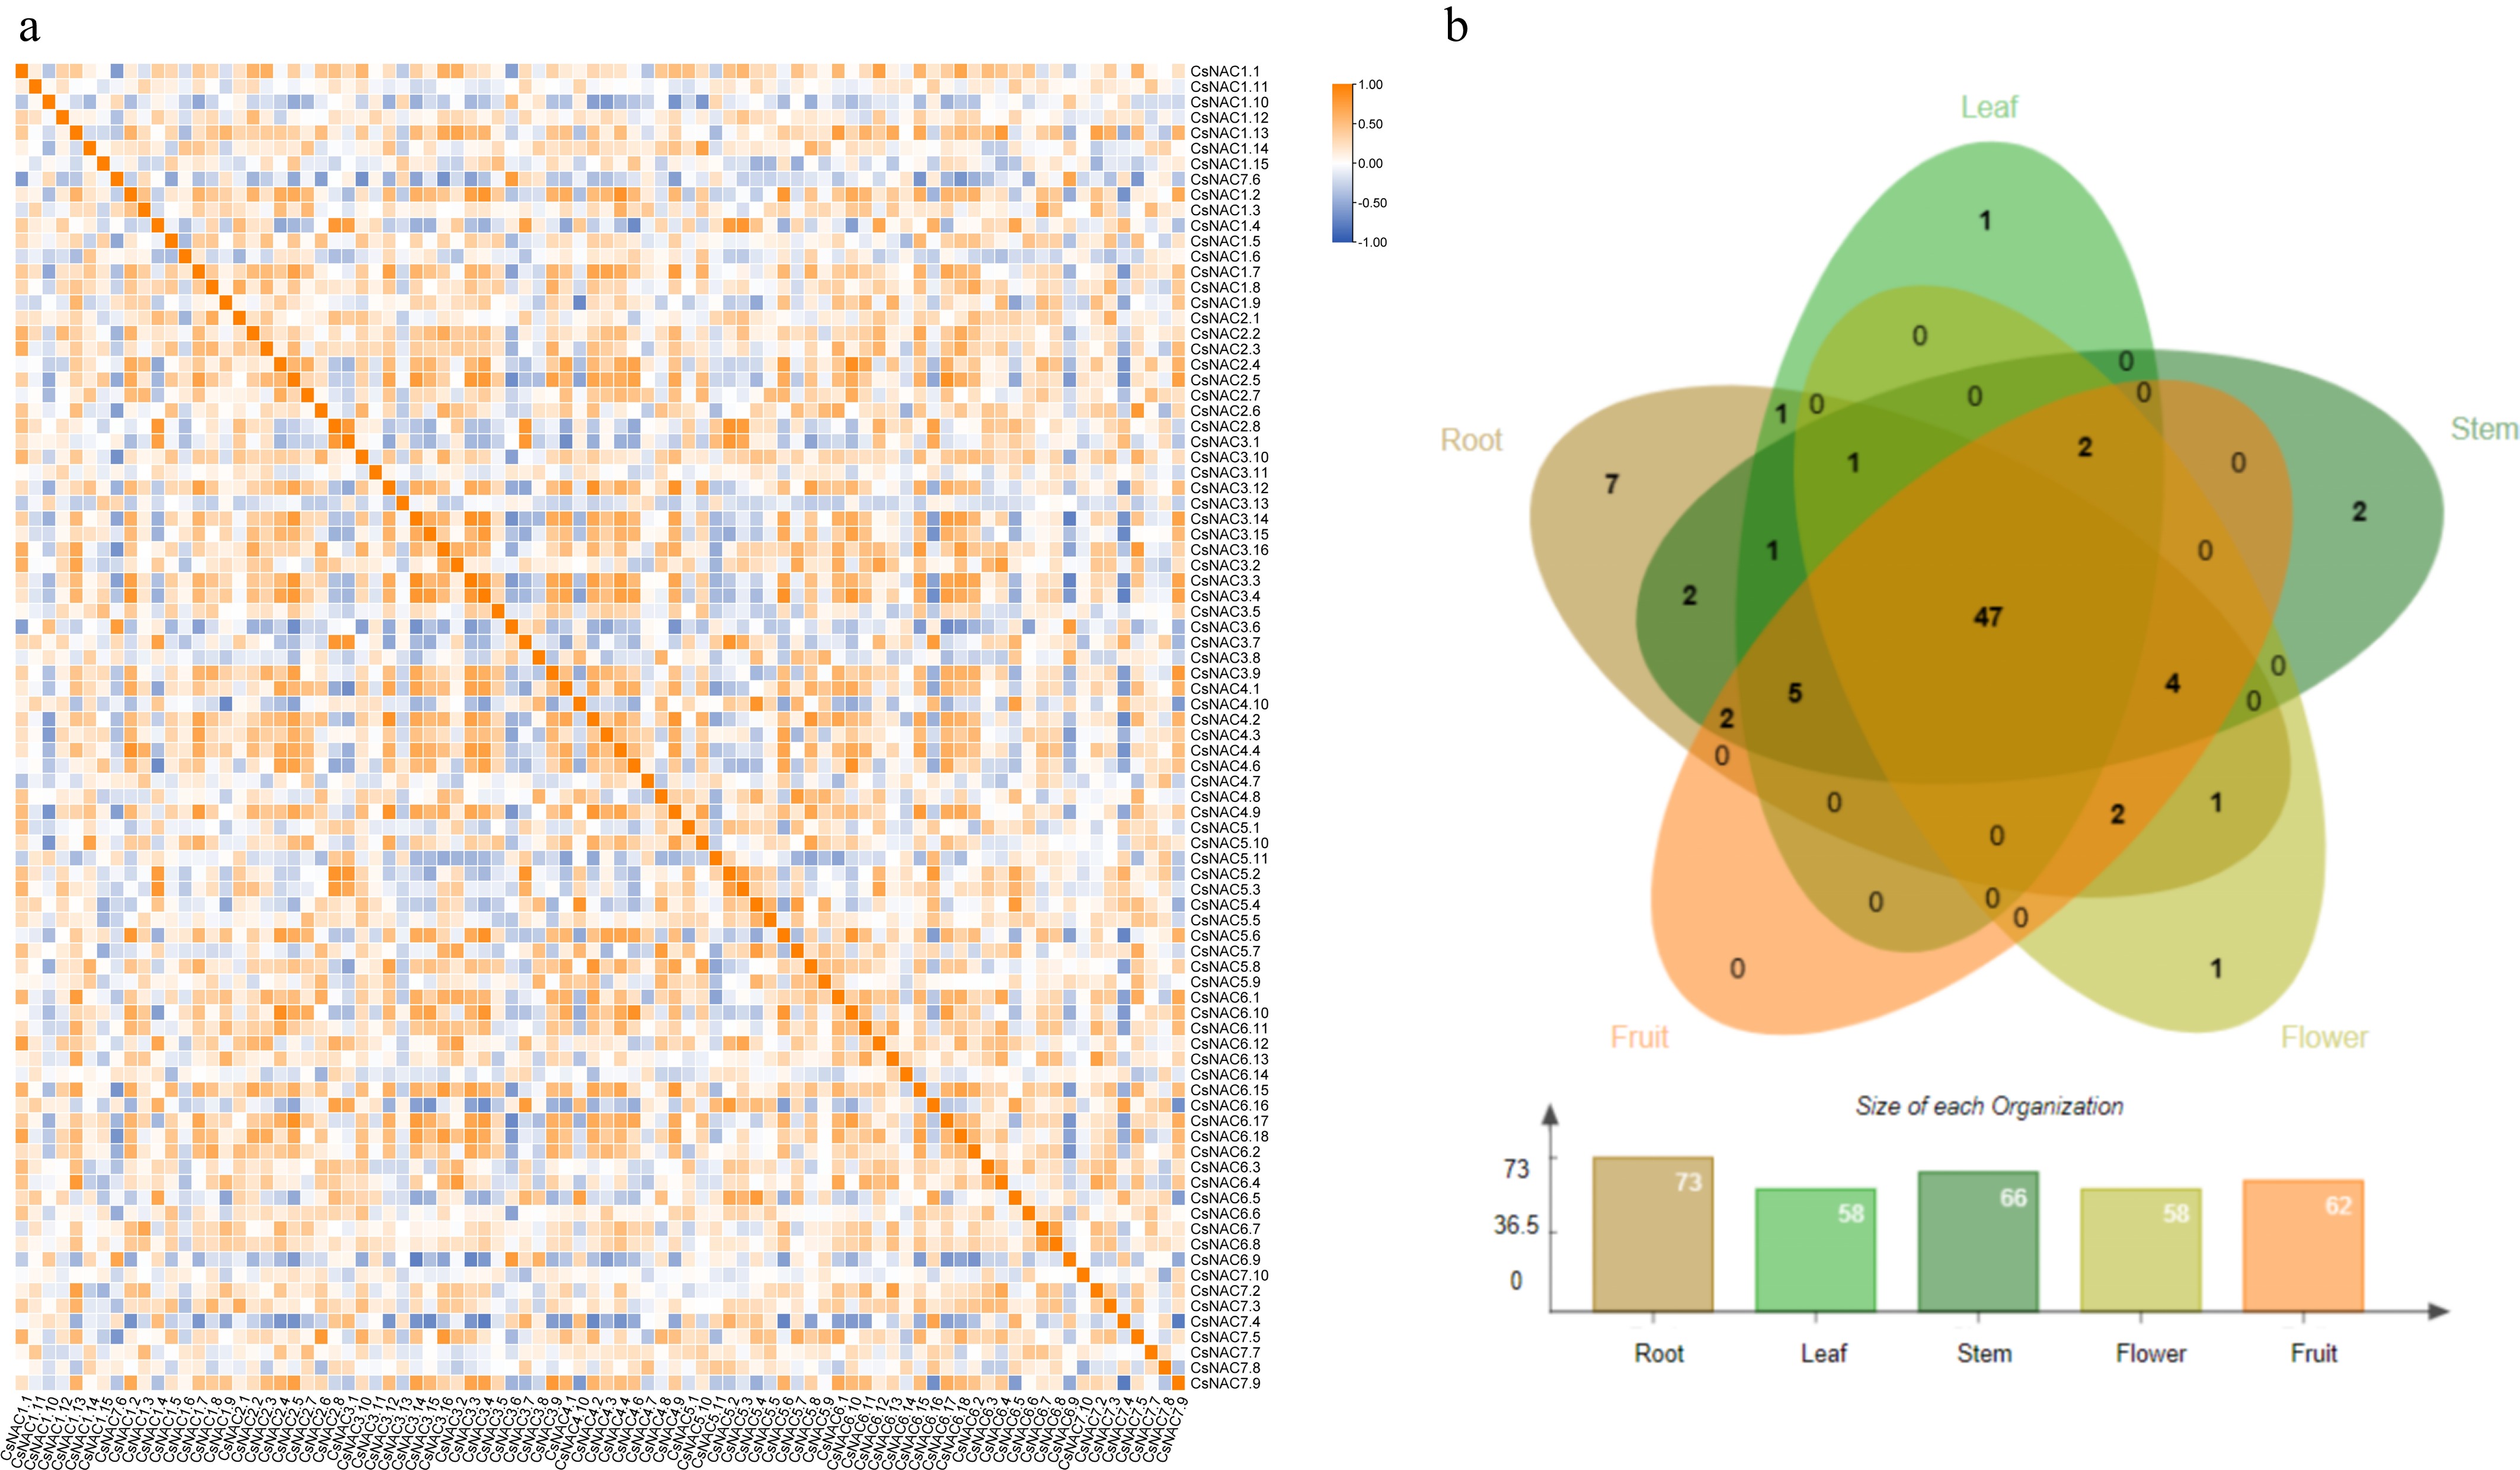
Figure 5.
Transcriptomic expression analysis of the NAC gene family. (a) Heatmap of correlation analysis of expression levels. The correlation strength is indicated by a color gradient from white to orange-yellow, with 1 representing perfect positive correlation, −1 indicating perfect negative correlation, and 0 indicating no correlation. (b) Expression of NAC genes in different tissues. Different tissues are represented by distinct colors, with a bar chart indicating the number of genes expressed in each tissue.
Additionally, the analysis revealed that 73 CsNAC genes were predominantly expressed in roots, with 66 and 62 genes prominently expressed in stems and fruits, respectively (Fig. 5b). Both leaves and flowers shared the expression of 58 genes, emphasizing the versatile roles of NAC genes in organ development and stress responses. These results suggested that roots serve as pivotal sites for the functional activities of the CsNAC gene family, playing crucial roles in stress response and developmental regulation.
Biomass accumulation in response to high nitrogen treatment of HNUE L2 and LNUE L8
-
To further characterize the contrasting responses of the two cucumber lines to high nitrogen supply, biomass accumulation was evaluated under normal nitrogen (NN) and high nitrogen (HN) conditions (Fig. 6).
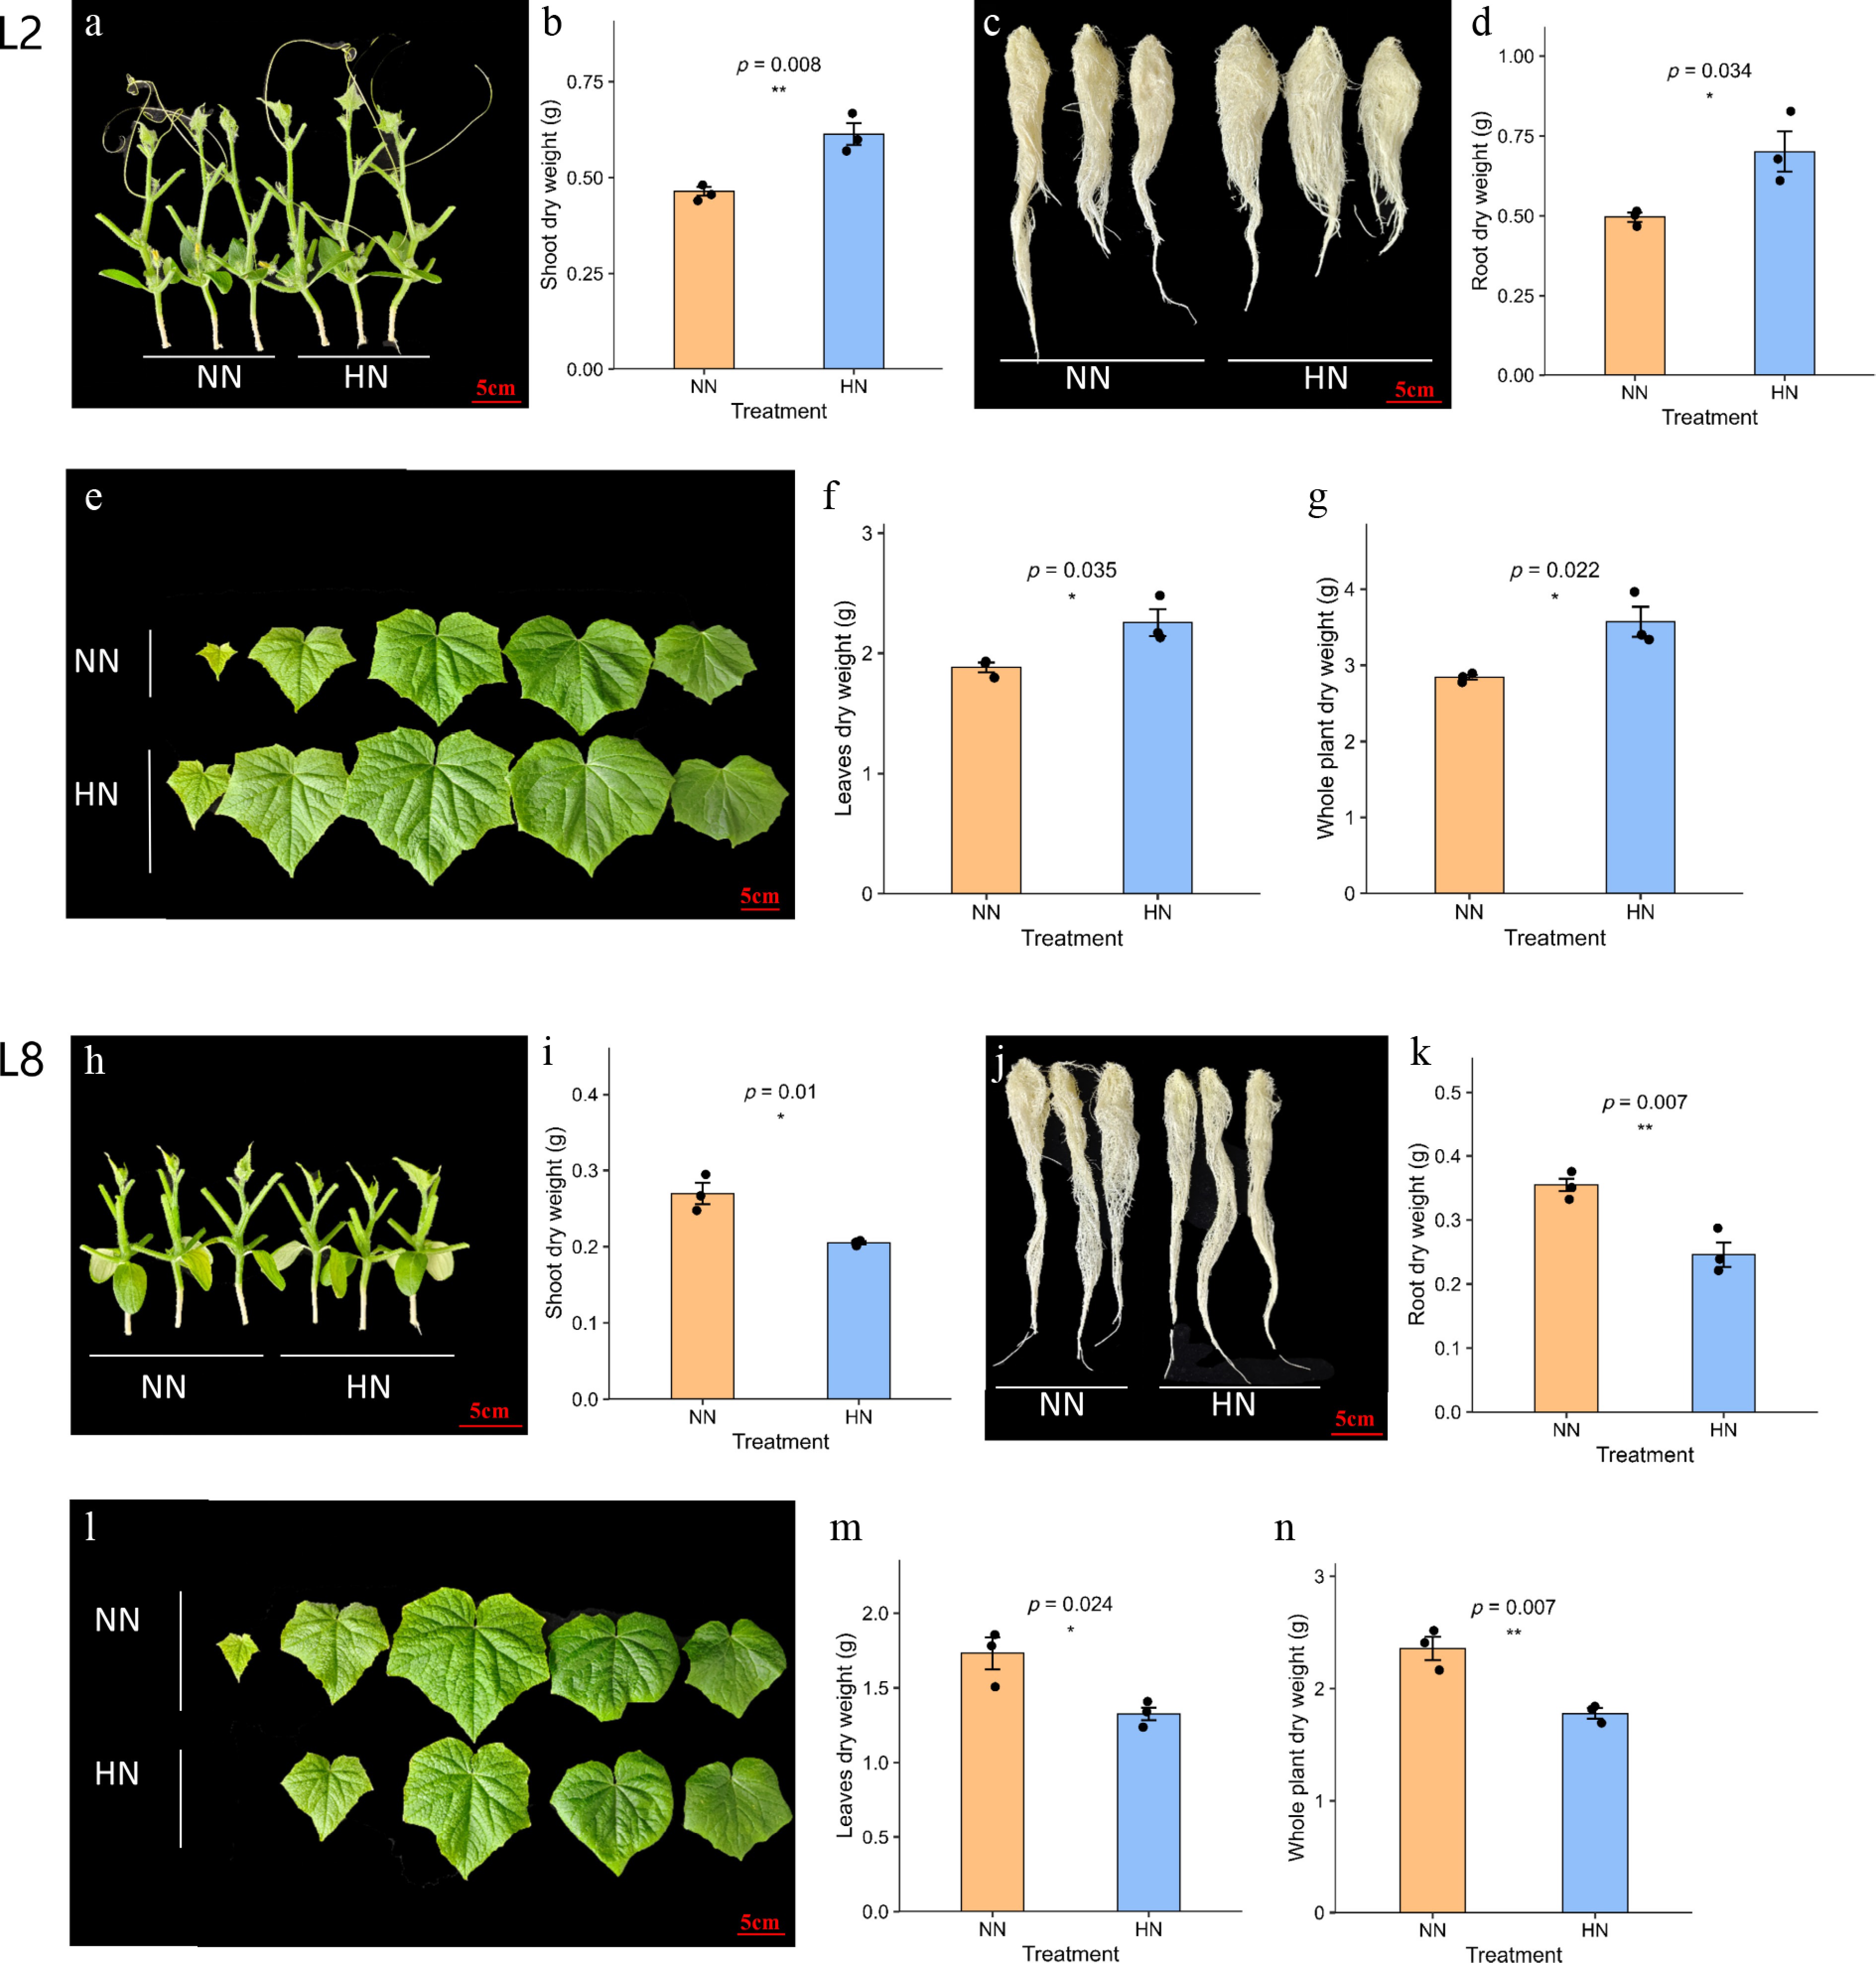
Figure 6.
Biomass responses of the high-NUE line L2 and low-NUE line L8 under NN and HN conditions. (a) Representative stem phenotype of L2; (b) stem dry weight of L2; (c) representative root phenotype of L2; (d) root dry weight of L2; (e) representative leaf phenotype of L2; (f) leaf dry weight of L2; (g) whole-plant dry weight of L2; (h) representative stem phenotype of L8; (i) stem dry weight of L8; (j) representative root phenotype of L8; (k) root dry weight of L8; (l) representative leaf phenotype of L8; (m) leaf dry weight of L8; and (n) whole-plant dry weight of L8. Data are presented as mean ± SD (n = 3). * Indicate significant differences between NN and HN treatments (* p < 0.05, ** p < 0.01; student's t-test).
Under NN conditions, L2 exhibited greater biomass accumulation than L8. The whole-plant dry weight of L2 reached 2.841 ± 0.051 g, whereas that of L8 was 2.356 ± 0.176 g. Following HN treatment, the whole-plant dry weight of L2 increased significantly to 3.569 ± 0.348 g, representing a 25.6% increase relative to NN conditions (Fig. 6g). In contrast, the whole-plant dry weight of L8 decreased significantly to 1.777 ± 0.084 g under HN treatment, corresponding to a 24.6% reduction compared with NN conditions (Fig. 6n).
Similar trends were observed for individual organs. In L2, HN treatment promoted stem growth, with stem dry weight increasing from 0.464 ± 0.020 g to 0.613 ± 0.049 g, representing a 32.1% increase (Fig. 6a, b). Root dry weight increased from 0.496 ± 0.025 g to 0.701 ± 0.109 g, corresponding to a 41.3% increase (Fig. 6c, d). Leaf dry weight also increased significantly from 1.881 ± 0.070 g to 2.255 ± 0.194 g, representing a 19.9% increase (Fig. 6e, f).
Conversely, HN treatment inhibited biomass accumulation in L8. Stem dry weight decreased from 0.270 ± 0.024 g under NN conditions to 0.205 ± 0.004 g under HN conditions, representing a 24.1% reduction (Fig. 6h, i). Root dry weight declined from 0.355 ± 0.017 g to 0.246 ± 0.033 g, corresponding to a 30.7% decrease (Fig. 6j, k). Leaf dry weight decreased from 1.732 ± 0.185 g to 1.327 ± 0.073 g, representing a 23.4% reduction (Fig. 6l, m).
Overall, high nitrogen supply promoted biomass accumulation in the high-NUE line L2 but inhibited growth in the low-NUE line L8. These contrasting phenotypic responses further demonstrated substantial differences in nitrogen-response characteristics between the two cucumber lines and provided physiological support for the subsequent transcriptomic and co-expression network analyses.
Identification of gene co-expression modules through WGCNA and the correlation of modules with NUE
-
To further explore the role of the NAC gene family in the process of NUE, the root transcriptome data of high-NUE L2 and low-NUE L8 lines at seven time points treated with high nitrogen were analyzed: 0, 2, 4, 8, 12, 24, and 30 h. High- and low-NUE lines represent two extreme phenotypes under high-nitrogen conditions (nitrogen at 20 mmol/L).
Hierarchical clustering analysis was conducted on seven high- and seven low-NUE cucumber samples to delineate distinct gene expression modules. Employing the dynamic tree cut method, four major gene modules were identified, each uniquely color-coded in the dendrogram to highlight potential co-regulation of genes associated with specific biological pathways (Fig. 7a). The blue module comprises 24 genes, the brown module contains 10 genes, the grey module includes 11 genes, and the turquoise module, being the largest, contains 32 genes.
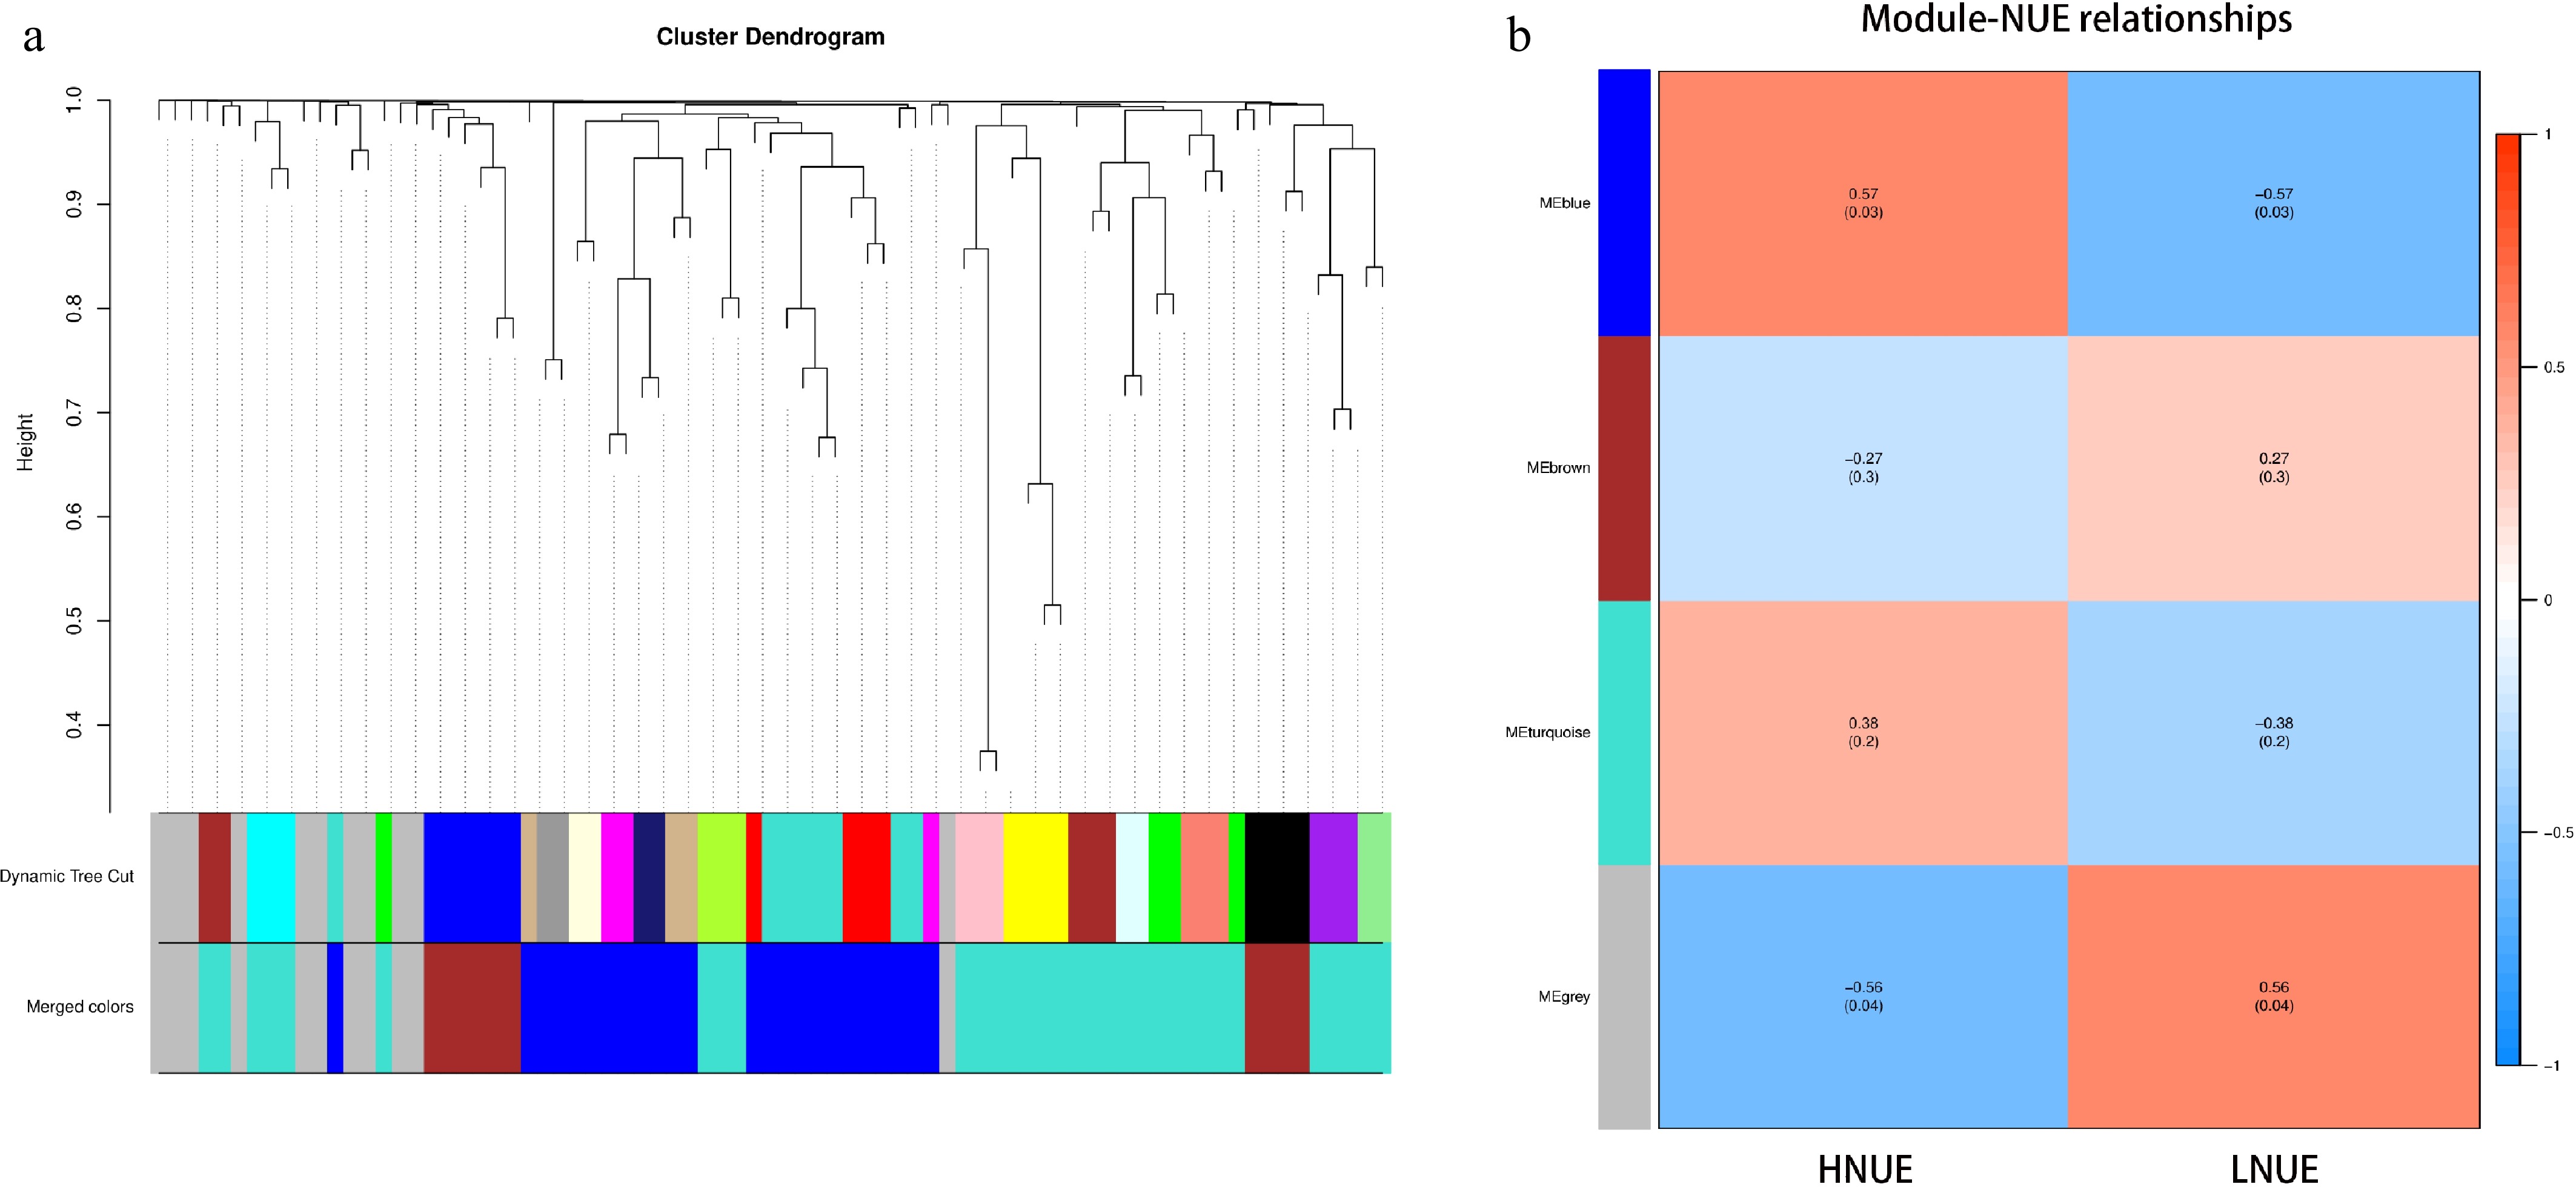
Figure 7.
The identification of key modules through WGCNA. (a) Each module is represented by a unique color, grouping genes with highly similar expression patterns. These modules are constructed based on TOM similarity, clustering genes that exhibit co-expression across various samples and conditions. The uppermost part of the figure illustrates the gene clustering tree, where each leaf represents an individual gene, and different gene modules appear as branches. The middle section displays the Dynamic Tree Cut used to identify the modules, with each color denoting a distinct module. The lower part, labeled 'Merged colors', shows the result of merging modules with a dissimilarity coefficient below 0.25, further simplifying the visualization of clustered gene groups. (b) Correlation heatmap between gene co-expression modules and NUE. Red indicates positive correlations, and blue represents negative correlations. The numbers within the cells denote Pearson correlation coefficients, with corresponding p-values shown in parentheses.
These findings imply that genes within each module may be co-regulated, contributing to distinct biological functions. Notably, the modules exhibited significant variation in size and composition, suggestive of specialized roles across different cucumber sample types. This diversity in module characteristics underscores the complexity of gene regulation within the cucumber genome and highlights the potential for targeted genetic studies to elucidate the biological functions of these gene clusters.
To elucidate the roles of the four identified gene co-expression modules in NUE, Pearson correlation coefficients between module eigengenes and NUE were calculated. As illustrated in Fig. 7b, a detailed heatmap vividly displays the strength and significance of these correlations, suggesting how each module may influence NUE. Notably, the most significant correlation with NUE was observed in the blue module, marked by a correlation coefficient of 0.57.
Comprehensive analysis of the blue module
-
The blue module contained 24 genes, of which 18 responded to high nitrogen at specific time points in at least one cucumber line (Fig. 8a). Most genes in this module exhibited a stronger response to nitrogen in the high-NUE line. Specifically, in the high-NUE line, 11 genes responded to high nitrogen at 8 h and 12 genes at 30 h. In contrast, only 6 genes responded at 24 h in the low-NUE line. Furthermore, the high-NUE line showed more genes reaching peak expression levels at 8 and 30 h, suggesting differences in the timing and intensity of NAC gene functionality between the two lines. Notably, five genes in this module—CsNAC2.2, CsNAC3.1, CsNAC3.16, CsNAC6.5, and CsNAC6.11—were differentially expressed at more than four time points, relative to the 0-hour baseline.
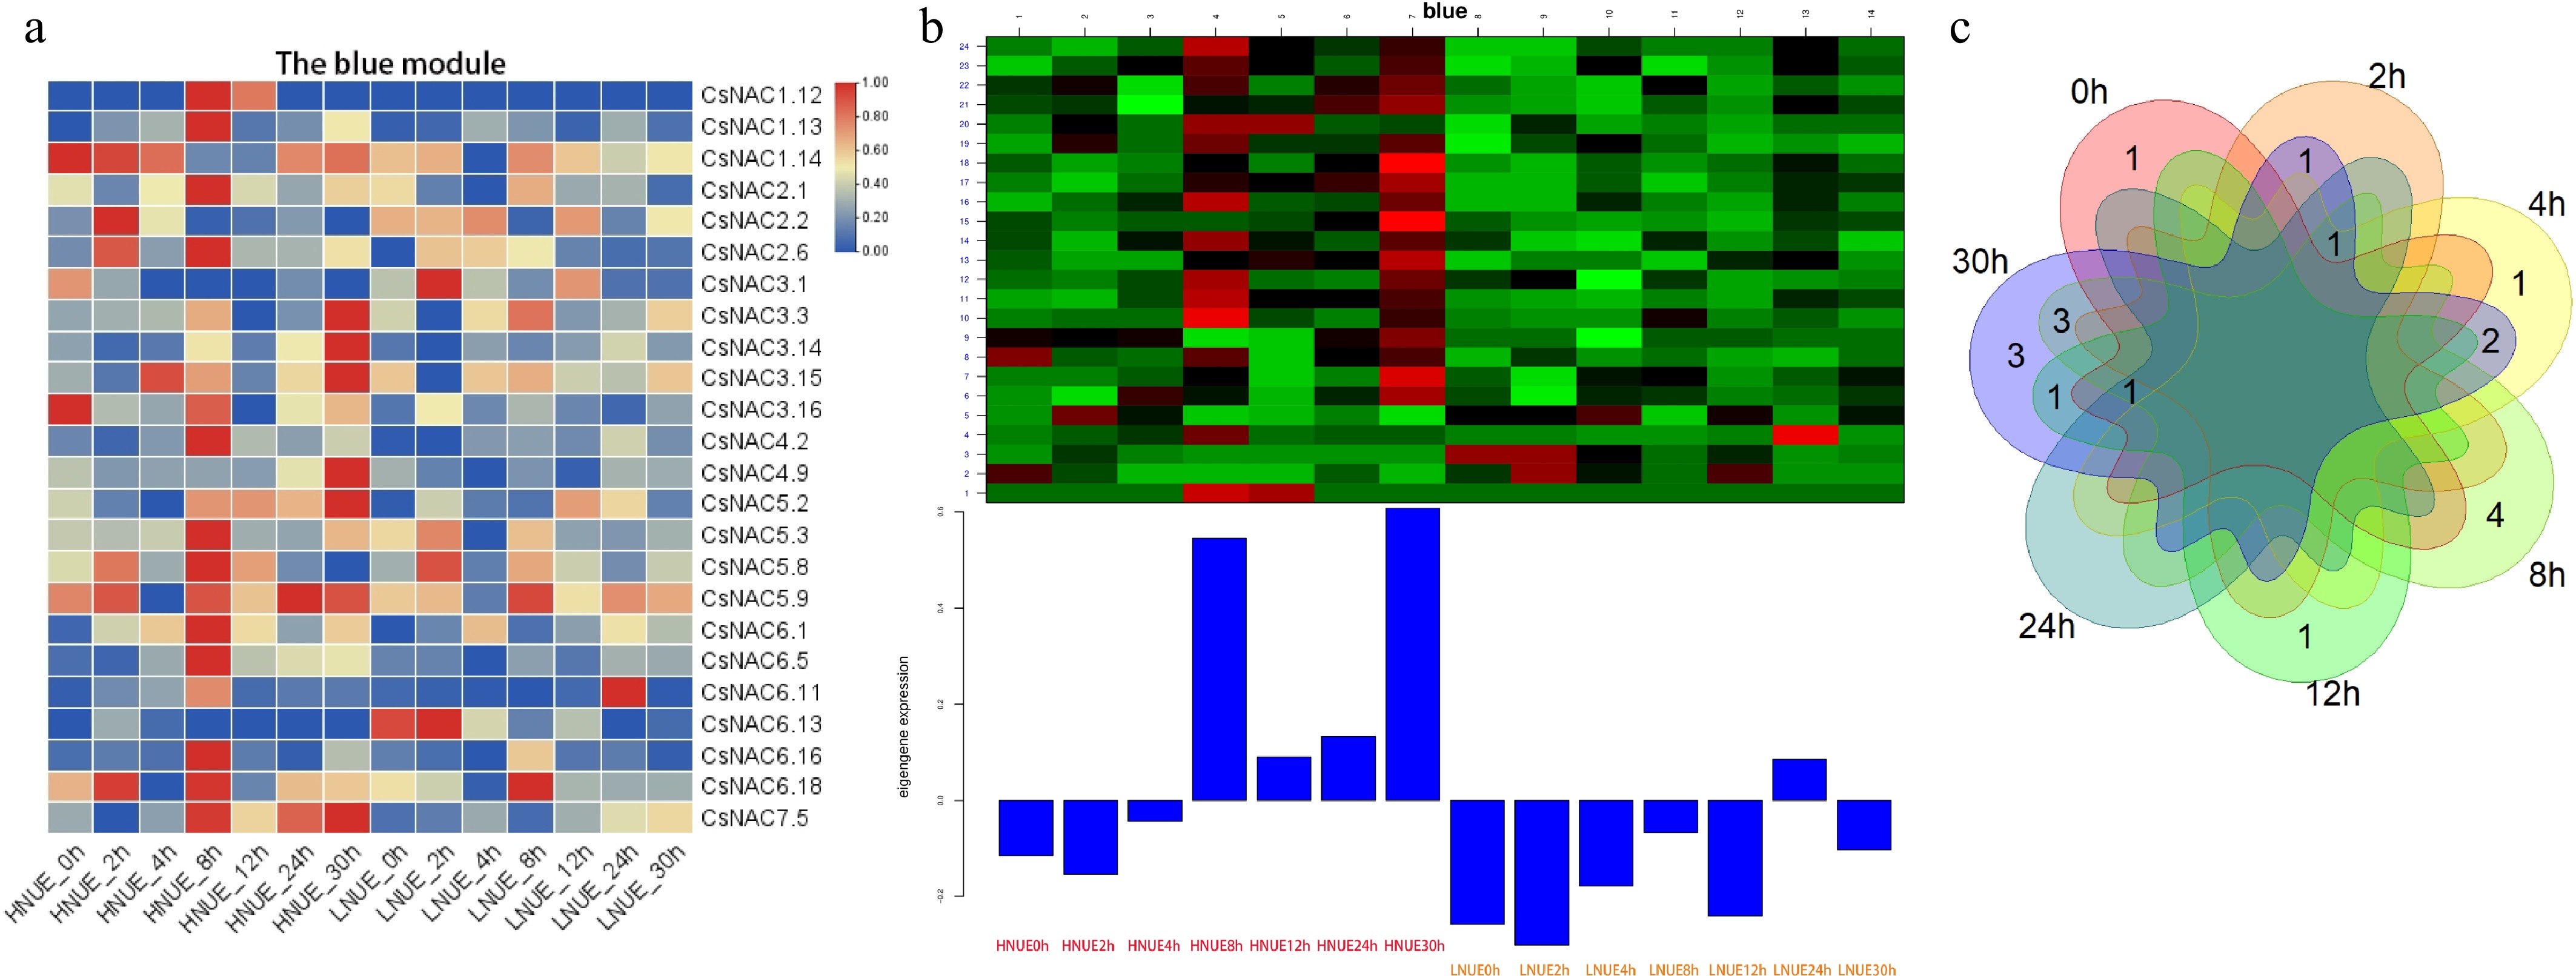
Figure 8.
Expression analysis of the module genes. (a) The expression of the genes in the blue module; (b) gene expression patterns within the blue module; (c) overlapping and unique DEGs at seven time points between high- and low-NUE lines in the blue module.
As illustrated in Fig. 8b, eigengene expression profiles differed significantly between the high- and low-NUE lines. Peaks at 8 and 30 h in the high-NUE line contrasted with those in the low-NUE line, underscoring marked differences in nitrogen responsiveness. These findings aligned with the heatmap results of gene expression. Figure 8c depicts the number of genes showing significant differences between the high- and low-NUE lines across seven time points. The highest number of DEGs was observed at 30 h, with 12 genes, followed by nine DEGs at 8 h, four at 4 h, and three at 12 h. The fewest DEGs—two at each time point—were detected at 0, 2, and 24 h. In total, 19 genes in the module exhibited differential expression, accounting for 79% of the genes. Of these, seven genes were differentially expressed at two time points, while 10 were differentially expressed at one time point. Notably, CsNAC3.16 and CsNAC6.11 were differentially expressed at five time points, highlighting their potential importance in regulating NUE variation between the two cucumber lines.
Protein interaction network prediction of CsNAC3.16 and CsNAC6.11
-
Protein interaction network analysis predicted five potential interacting proteins for CsNAC3.16 (CsaV4_3G004939) (Fig. 9a). Among them, CsaV4_4G000713 contains a Glyco_trans_4-like_N domain, whereas CsaV4_6G003680 encodes a GRAS family transcription factor containing a GRAS domain. In addition, CsaV4_3G002564 and CsIAA1 (CsaV4_3G002565) belong to the Aux/IAA family and are associated with auxin-responsive signaling pathways. CsaV4_3G001730 encodes a TCP domain-containing protein involved in plant developmental regulation.
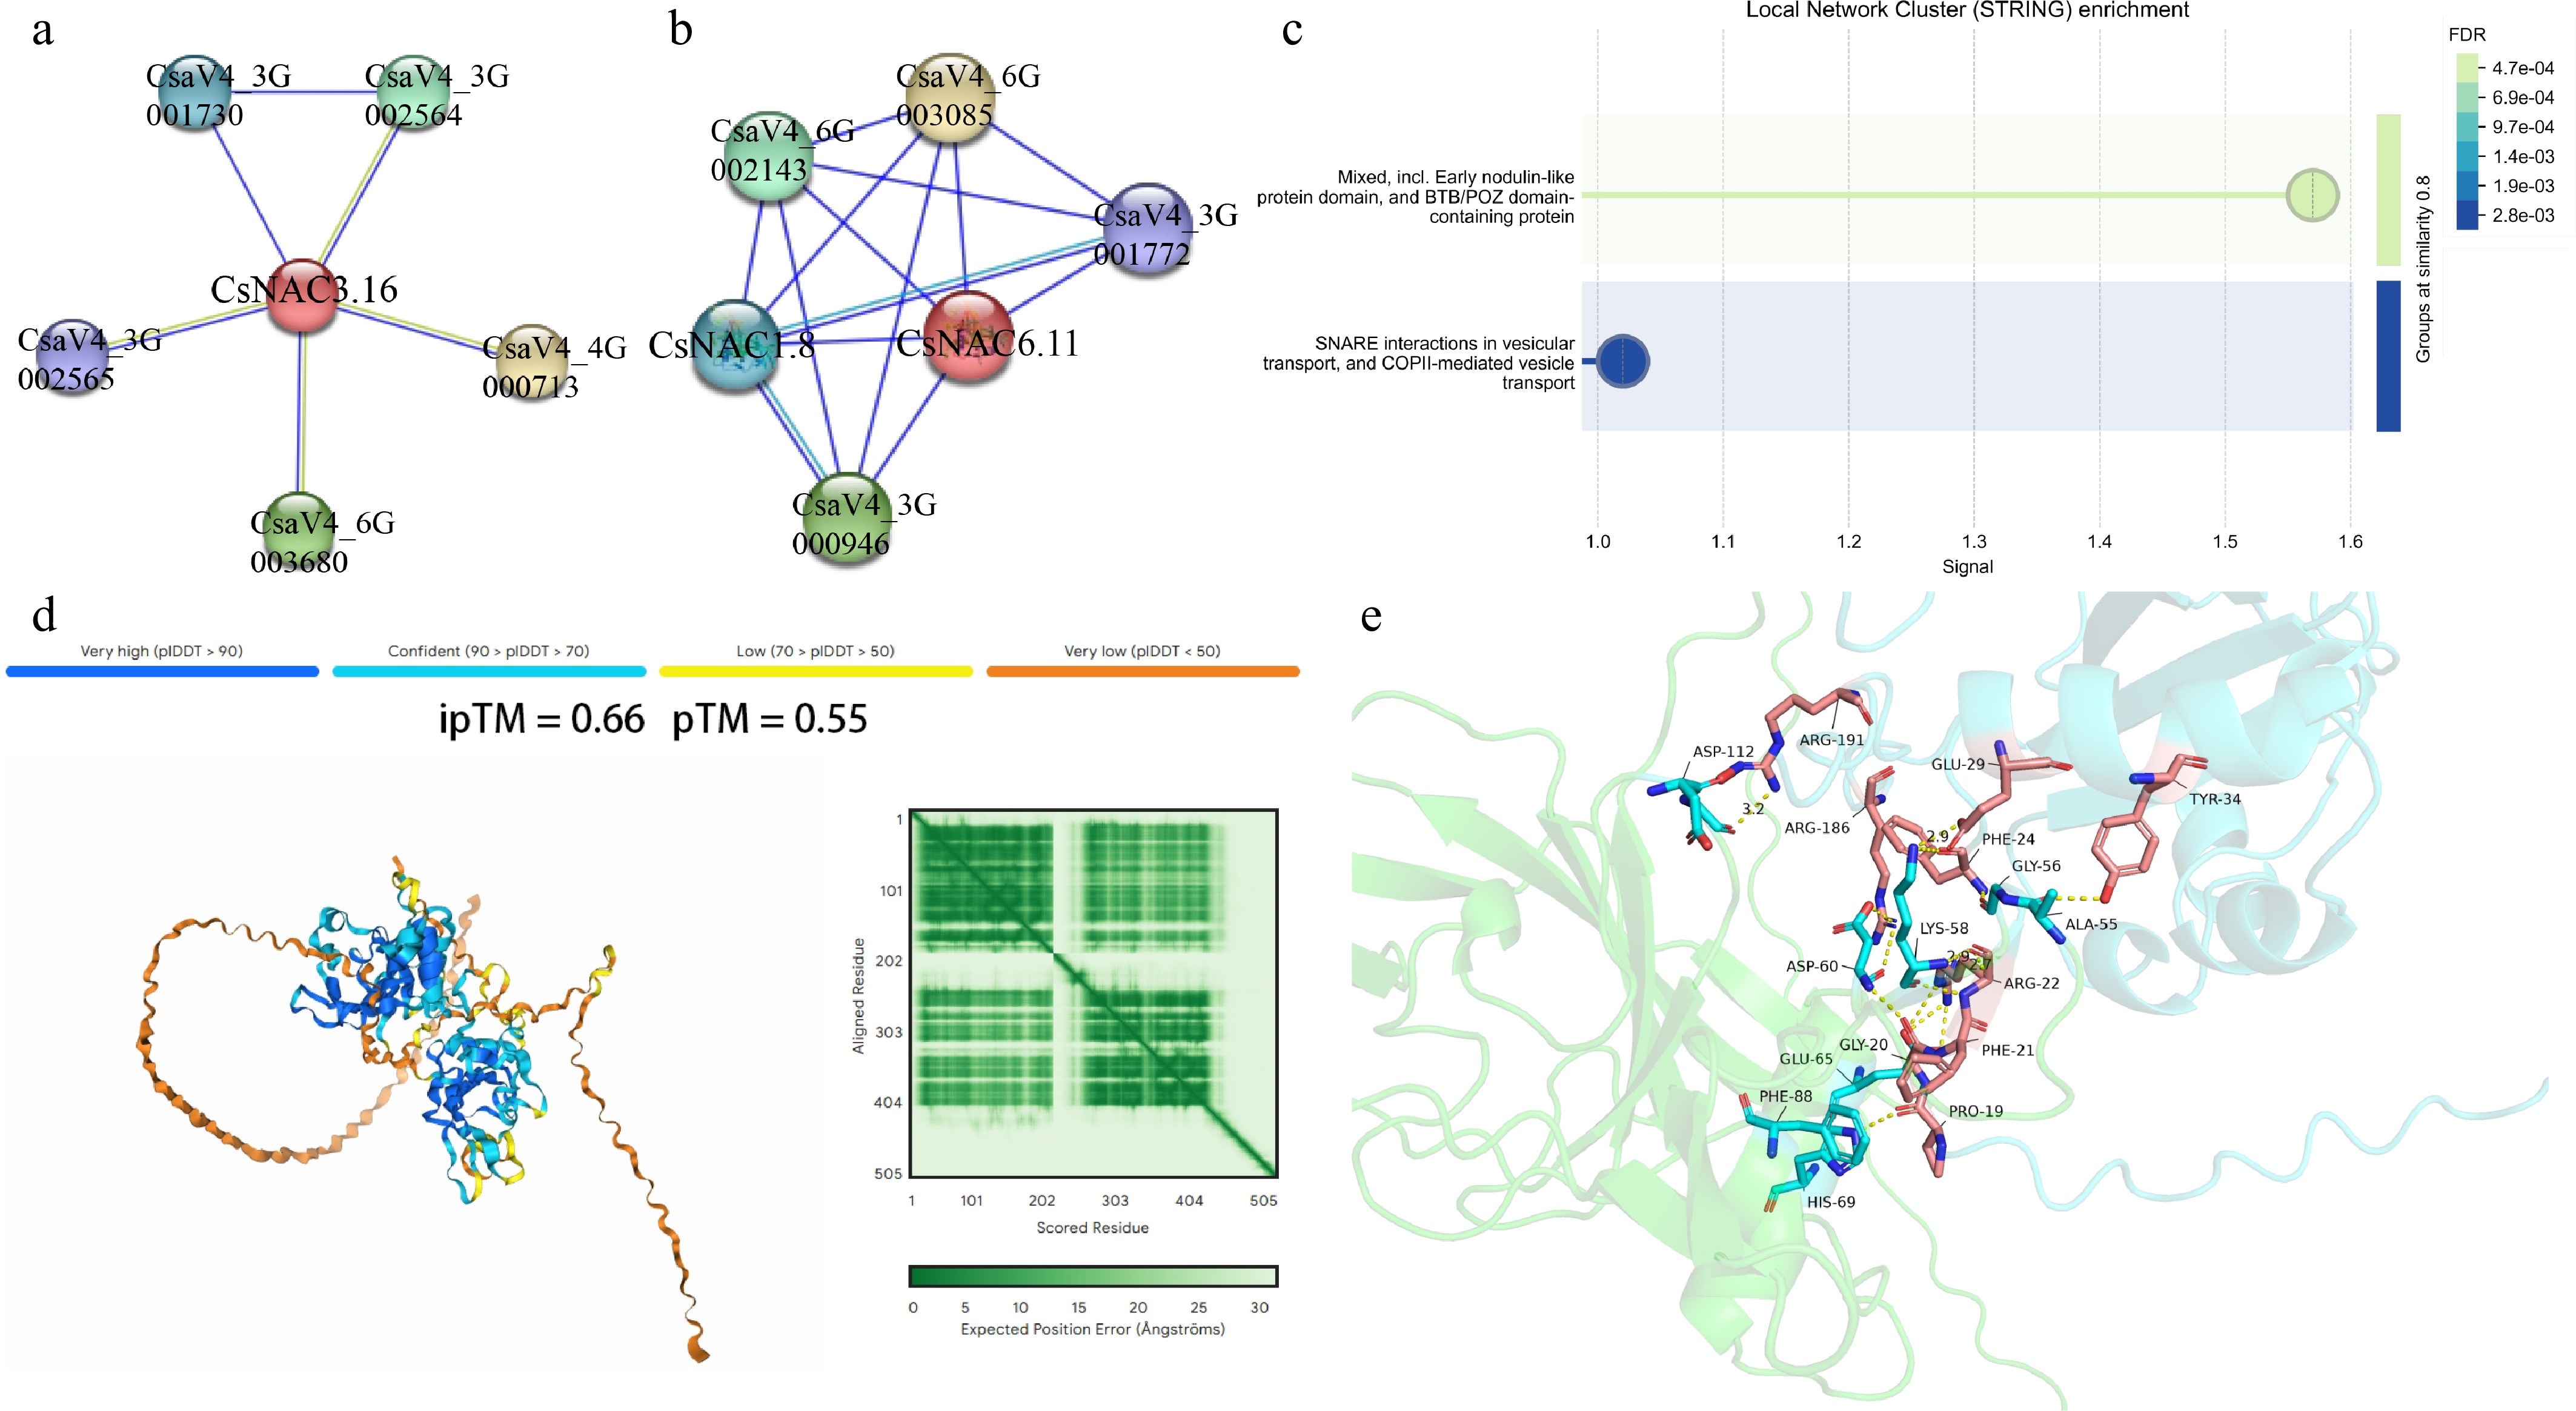
Figure 9.
Predicted protein interaction networks and structural interaction analysis of CsNAC3.16 and CsNAC6.11. (a) STRING-predicted protein interaction network of CsNAC3.16; (b) STRING-predicted protein interaction network of CsNAC6.11; (c) functional enrichment analysis of proteins predicted to interact with CsNAC3.16 and CsNAC6.11. Circle size indicates the number of genes enriched in each category, and color intensity represents the false discovery rate (FDR); (d) AlphaFold3-predicted interaction model between CsNAC6.11 and CsNAC1.8. The ipTM and pTM scores are shown as indicators of predicted interaction confidence and structural similarity; (e) predicted interaction interface between CsNAC6.11 and CsNAC1.8. Yellow dashed lines indicate potential hydrogen bonds at the predicted interaction interface.
Functional enrichment analysis indicated that the predicted interaction partners of CsNAC3.16 were mainly associated with DNA-binding transcription factor activity and transcriptional regulation-related processes (Fig. 9c), suggesting that CsNAC3.16 may participate in transcriptional regulatory networks involved in plant growth and environmental responses.
Similarly, five potential interacting proteins were predicted for CsNAC6.11 (CsaV4_6G002653) (Fig. 9b). Among these proteins, CsaV4_1G001338 was identified as CsNAC1.8 based on protein sequence annotation. Since both proteins belong to the NAC transcription factor family, they may be functionally associated in related biological processes.
To further explore the potential interaction between CsNAC6.11 and CsNAC1.8, protein complex structures were predicted using AlphaFold3. The predicted model showed an ipTM score of 0.66 and a pTM score of 0.65 (Fig. 9d), indicating a possible interaction between the two proteins. Furthermore, several potential hydrogen-bonding sites were identified at the predicted interaction interface (Fig. 9e). These results provide a structural basis for the hypothesis that CsNAC6.11 and CsNAC1.8 may interact, although experimental validation is required to confirm this prediction.
Expression patterns of CsNAC3.16 and its predicted interacting genes under high nitrogen conditions
-
To validate the nitrogen responsiveness of CsNAC3.16 and its predicted interacting genes, qRT–PCR analyses were performed in the high-NUE line L2 and low-NUE line L8 under high-nitrogen treatment (Fig. 10).
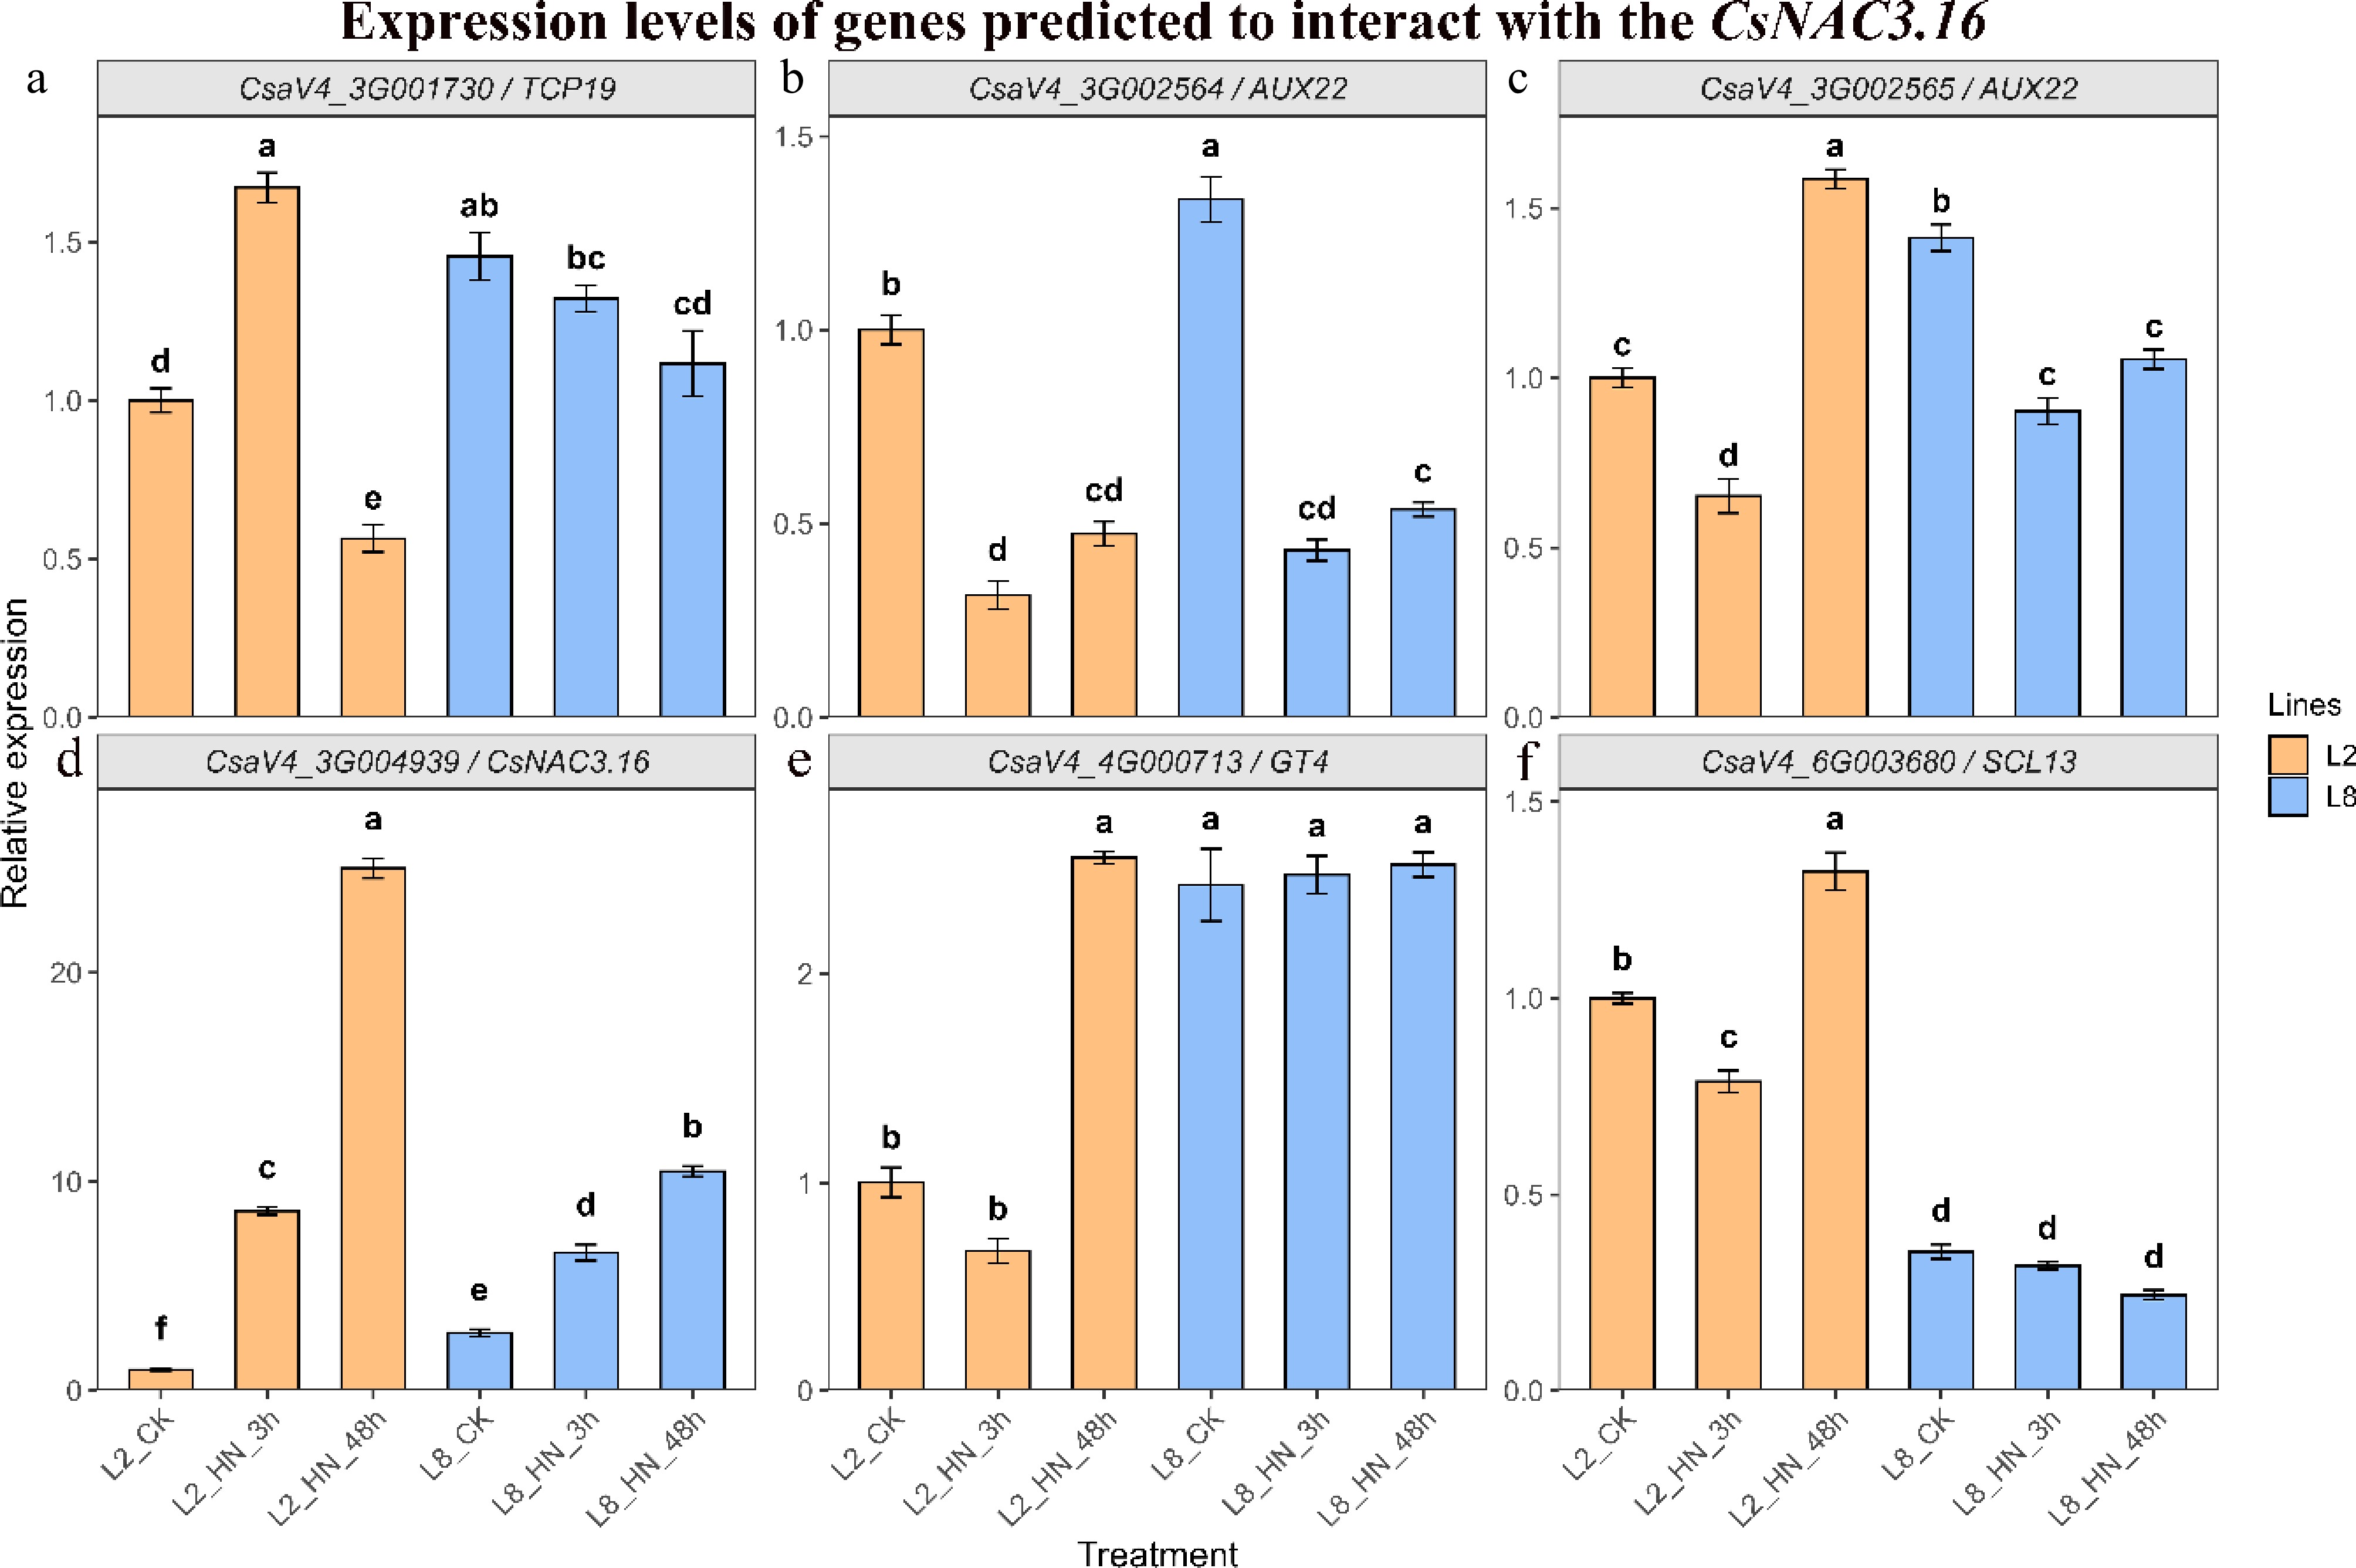
Figure 10.
Expression patterns of CsNAC3.16 and its predicted interacting genes under high nitrogen treatment. Relative expression levels were determined by qRT–PCR in the high-NUE line L2 and low-NUE line L8 under control conditions and after 3 and 48 h of high-nitrogen treatment. (a) CsaV4_3G001730; (b) CsaV4_3G002564; (c) CsaV4_3G002565; (d) CsNAC3.16 (CsaV4_3G004939); (e) CsaV4_4G000713; and (f) CsaV4_6G003680. Data are presented as mean ± SD (n = 3). Different lowercase letters indicate significant differences among treatments within the same genotype according to one-way ANOVA followed by Duncan's multiple range test (p < 0.05).
Among the predicted interacting genes, CsaV4_3G001730 (Fig. 10a) and CsaV4_3G002564 (Fig. 10b) were consistently downregulated following high nitrogen treatment in both genotypes. CsaV4_3G002565 (Fig. 10c) exhibited a dynamic expression pattern in L2, showing reduced expression at 3 h followed by induction at 48 h, whereas only minor expression changes were observed in L8.
CsNAC3.16 (CsaV4_3G004939; Fig. 10d) showed a strong transcriptional response to high nitrogen in both genotypes. In L2, transcript abundance increased approximately 8.6-fold at 3 h and 25-fold at 48 h relative to the control. In L8, expression increased approximately 6–7-fold at 3 h and 10-fold at 48 h. Notably, the induction level was consistently higher in L2 than in L8. The remaining predicted interacting genes, CsaV4_4G000713 (Fig. 10e) and CsaV4_6G003680 (Fig. 10f), were induced by high nitrogen treatment, particularly in L2 at 48 h, reaching approximately 2.6-fold and 1.3-fold of the control level, respectively. In contrast, their transcriptional responses were comparatively weaker in L8.
Overall, CsNAC3.16 and its predicted interacting genes exhibited distinct nitrogen-responsive expression patterns. The generally stronger transcriptional responses observed in the high-NUE line L2 suggest that these genes may participate in genotype-dependent responses to high nitrogen supply.
Expression patterns of CsNAC6.11 and its predicted interacting genes under high nitrogen conditions
-
To further investigate the nitrogen responsiveness of CsNAC6.11 and its predicted interacting genes, qRT–PCR analyses were conducted in the high-NUE line L2 and low-NUE line L8 under high-nitrogen treatment (Fig. 11).
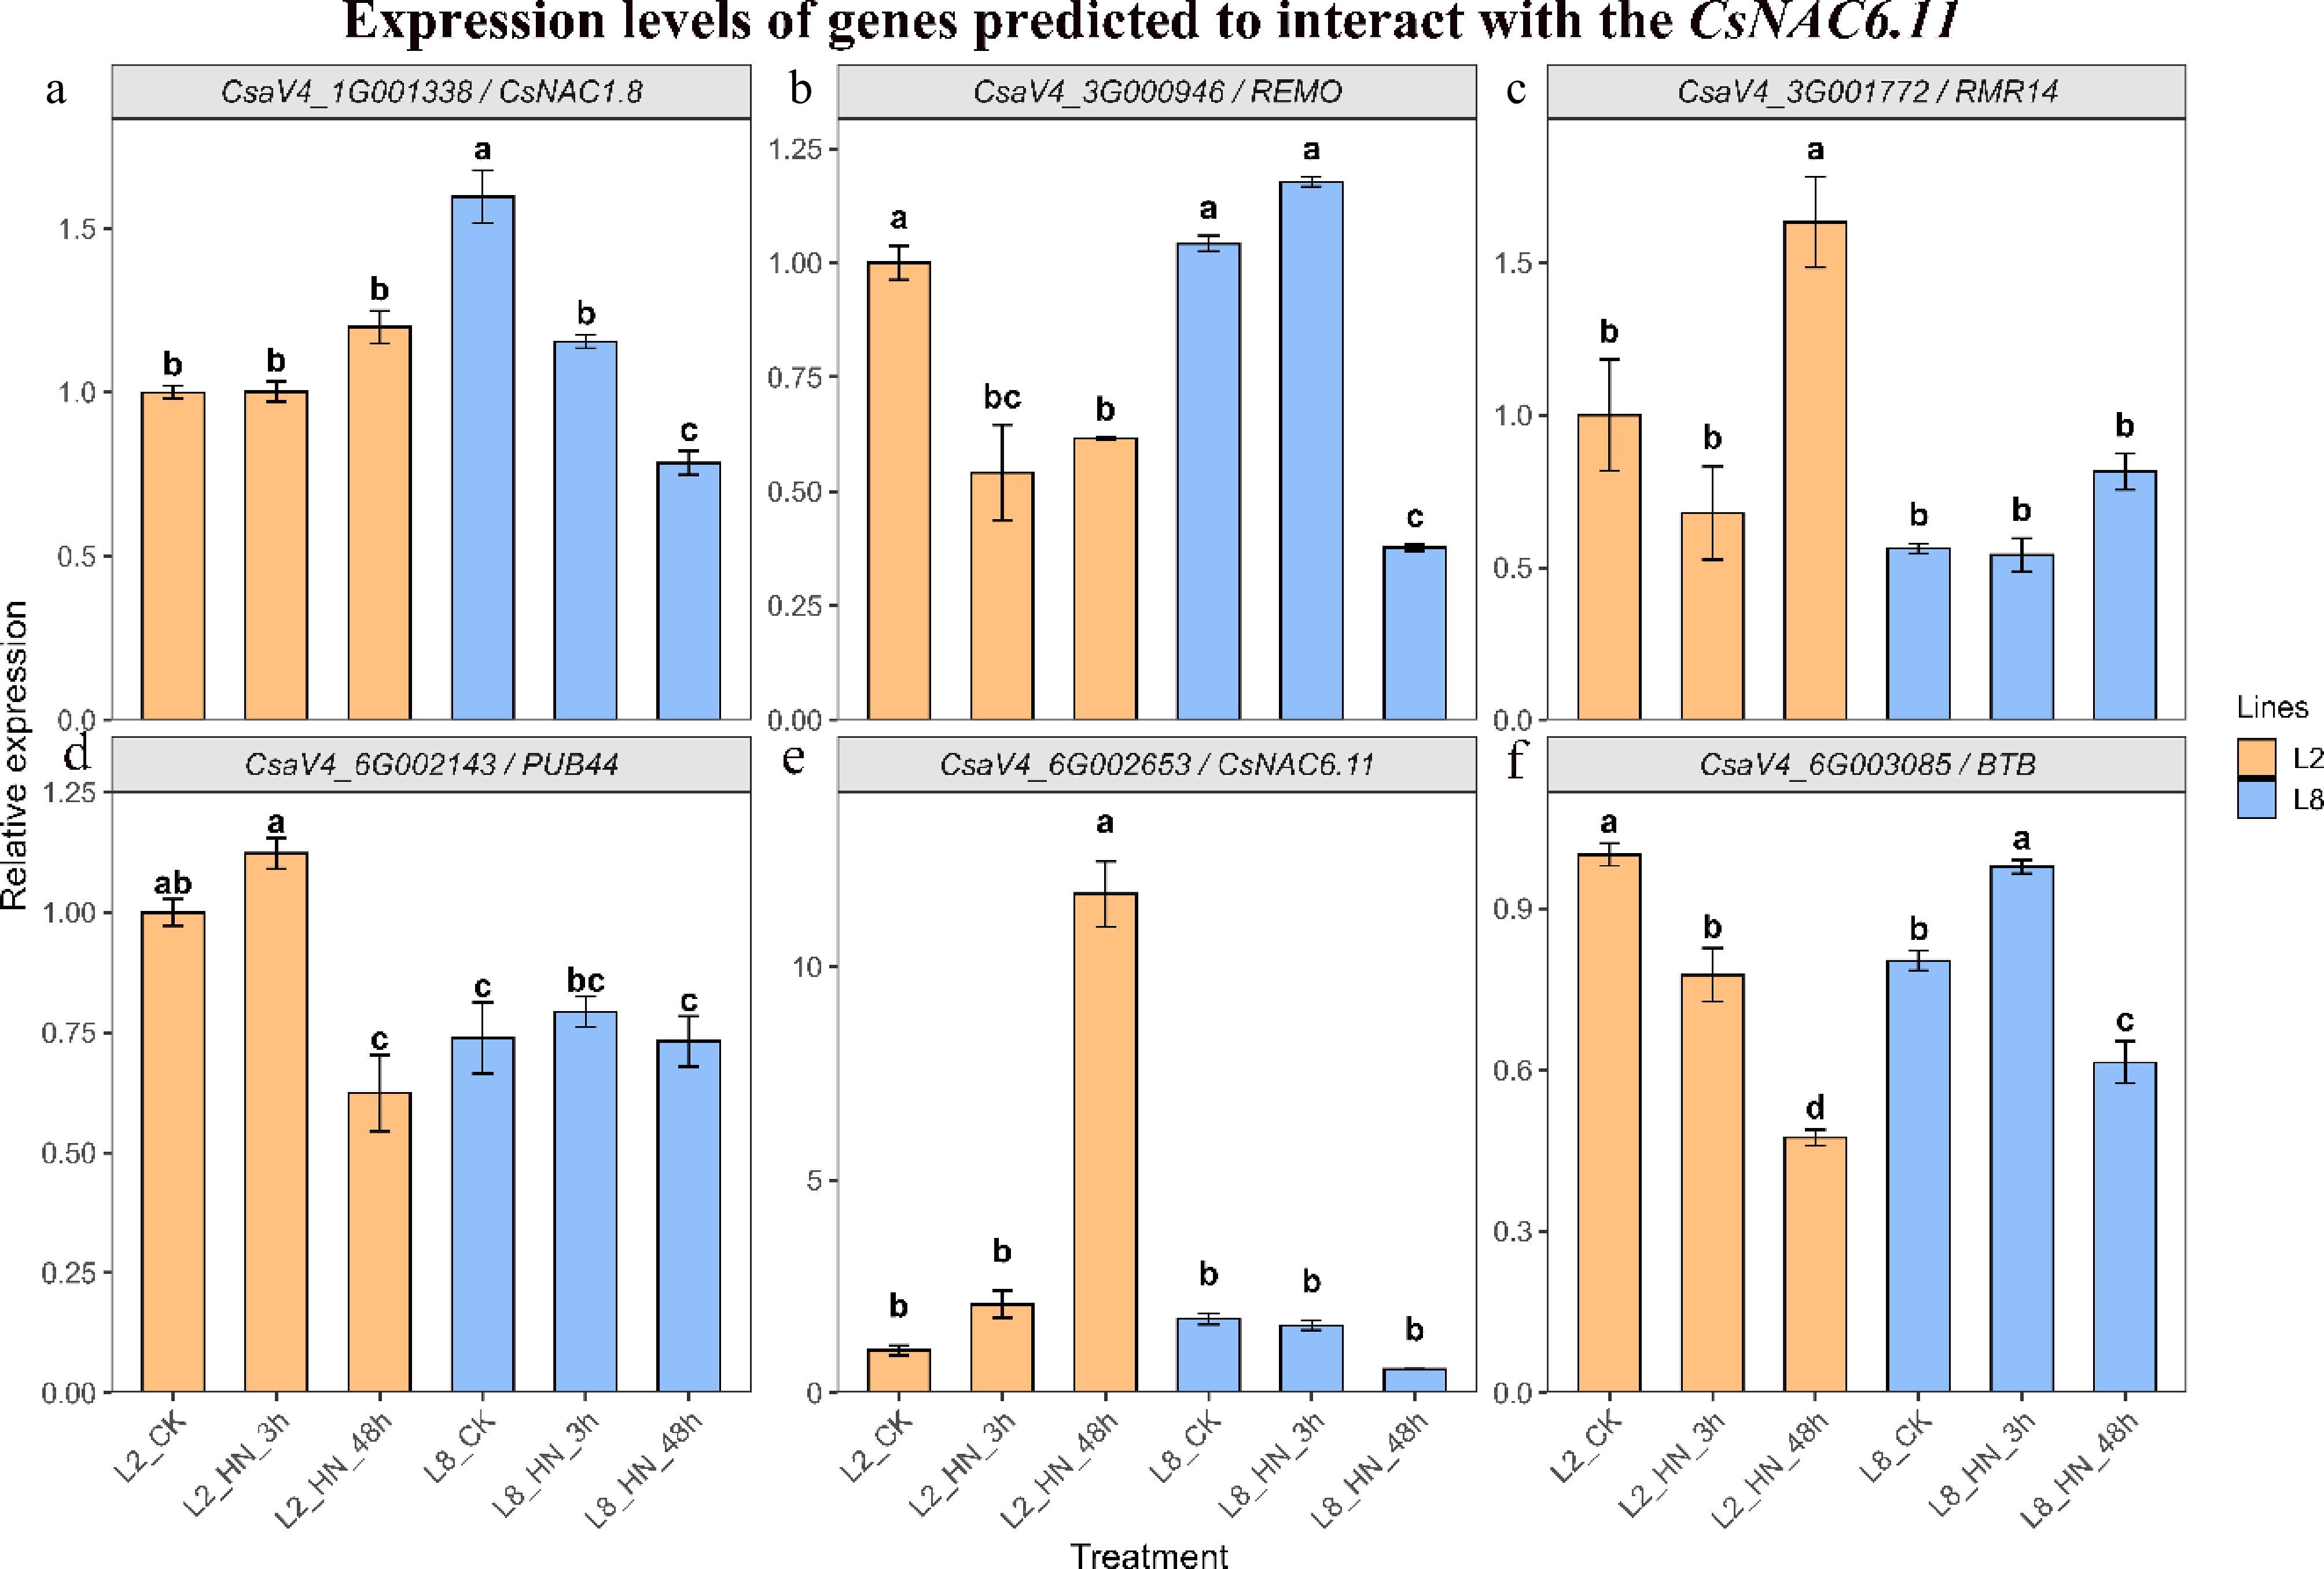
Figure 11.
Expression patterns of CsNAC6.11 and its predicted interacting genes under high-nitrogen treatment. Relative expression levels were determined by qRT–PCR in the high-NUE line L2 and low-NUE line L8 under control conditions and after 3 and 48 h of high-nitrogen treatment. (a) CsaV4_1G001338; (b) CsaV4_3G000946; (c) CsaV4_3G001772; (d) CsaV4_6G002143; (e) CsNAC6.11 (CsaV4_6G002653); and (f) CsaV4_6G003085. Data are presented as mean ± SD (n = 3). Different lowercase letters indicate significant differences among treatments within the same genotype according to one-way ANOVA followed by Duncan's multiple range test (p < 0.05).
Among the predicted interacting genes, CsaV4_1G001338 (Fig. 11a) maintained relatively stable expression in L2 but showed a slight decrease at 48 h in L8. CsaV4_3G000946 (Fig. 11b) and CsaV4_6G003085 (Fig. 11f) were consistently downregulated following high nitrogen treatment in both genotypes. CsaV4_3G001772 (Fig. 11c) exhibited a dynamic expression pattern in L2, characterized by downregulation at 3 h followed by induction at 48 h, whereas the transcriptional response was less pronounced in L8. In contrast, CsaV4_6G002143 (Fig. 11d) displayed only minor expression changes throughout the treatment period.
CsNAC6.11 (CsaV4_6G002653; Fig. 11e) showed a distinct genotype-dependent response to high nitrogen. In L2, transcript abundance increased to approximately 2-fold the control level at 3 h and more than 11-fold at 48 h. In contrast, only slight expression changes were observed in L8 at 3 h, followed by a reduction to approximately 0.55-fold of the control level at 48 h.
Overall, CsNAC6.11 and its predicted interacting genes exhibited diverse transcriptional responses to high nitrogen treatment. The contrasting expression pattern of CsNAC6.11 between L2 and L8, together with the differential responses of several associated genes, suggests their potential involvement in genotype-dependent nitrogen-responsive regulatory processes.
-
In this study, the NAC gene family was re-identified using the more comprehensive V4 genome (319 Mb), revealing differences compared to the V2 genome (193 Mb). Unlike Liu et al.[27] who identified 91 NAC genes, we detected only 88, despite using the larger V4 genome. Notably, only 72 genes overlapped between the two studies. To investigate this discrepancy, we conducted further analysis and found that some genes identified in Liu's study were merged into single genes in our results. For example, CsvNAC013 and CsvNAC071 were identified as CsNAC1.10, while CsvNAC004 and CsvNAC090 corresponded to CsNAC1.14. Overall, 23 genes in Liu's results were consolidated into 10 genes in our study. Additionally, genes such as CsvNAC052, CsvNAC062, CsvNAC069, and CsvNAC070 were excluded from the NAC gene family after re-annotation using the V4 genome, which provides more accurate and complete structural information. Furthermore, five genes—CsvNAC001, CsvNAC046, CsvNAC068, CsvNAC082, and CsvNAC088—were found to lack corresponding complete gene structures in the V4 genome. This refinement in structural annotation likely accounts for the reduced number of NAC genes identified in our study. It also highlights the improved accuracy and comprehensiveness of the V4 genome annotation, emphasizing the necessity of re-identifying the NAC gene family to ensure reliable results.
The chromosomal localization of NAC genes was also examined, with many found near the ends of chromosomes, particularly near the endpoints of Chr1, 3, 4, 5, 6, and 7. High recombination rates at chromosome ends may have facilitated the formation and functional diversification of new genes during evolution[43,44]. In contrast, genes in the middle regions of chromosomes tended to conserve essential biological functions, such as basic metabolic processes and cellular functions, due to their positional stability[43,44]. Genes located in subtelomeric regions are often associated with complex epigenetic regulation, including DNA methylation and chromatin remodeling, due to the unique heterochromatic characteristics of these genomic regions[45,46]. Gene density was higher in regions like the tops of Chr1, 2, and 3, where genes might play critical roles in genetic regulation and expression; conversely, areas with lower gene density, like the bottoms of Chr1 and Chr6, might contain more non-coding DNA or regulatory regions. The chromosomal positioning of genes not only influences their genetic stability and mutation rate but also relates to the complexity of their functions and regulatory controls[47]. Most NAC genes are localized in the nucleus, consistent with the findings of Liu et al.[27], suggesting that these genes primarily perform transcriptional regulatory functions. As transcription factors, NAC proteins directly participate in regulating gene expression, affecting plant growth, development, and responses to environmental stresses. Their nuclear localization enables these proteins to interact directly with DNA, regulating the transcription of downstream target genes, thereby playing a key role in physiology and development[22,48,49]. However, our localization results also show more diverse locations, including chloroplasts, cytoplasm, peroxisomes, mitochondria, and other organelles. This diversity may reflect the complex functions of the NAC gene family in cucumber. In synteny analysis, Liu et al.[27] identified 39 homologous genes between cucumber and Arabidopsis, while our analysis identified 54. Additionally, our study revealed 70 homologous genes between cucumber and watermelon, and 64 between cucumber and melon, indicating relatively low evolutionary divergence within the Cucurbitaceae family. It was also found that a large number of genes at the tops of Chr1, 5, 6, and 7, as well as at the bottoms of Chr3, 5, and 6, were conserved throughout evolution, suggesting that these genes may play important roles in these species. In motif analysis, our findings aligned with those of Liu et al.[27], identifying typical motifs of the NAC protein family, including subdomains A–E[50−52]. These motifs are also widespread in other species[51,53], further supporting the conservation and functional diversity of the NAC gene family. Statistics of cis-acting elements are associated with many elements involved in stress and adversity responses. Among these, salicylic acid and methyl jasmonate are implicated in plant stress responses[54−56], while abscisic acid may play an important regulatory role in NUE[16,17,20]. This underscores the important role of the NAC gene family in adversity stress and plant growth and development. Liu et al.[27] focused subsequent research on the development of fruit spines, whereas our analyses concentrated on processes related to NUE.
The NAC gene family has been implicated in the regulation of nitrogen uptake, transport, and utilization in several crops, including rice, wheat, soybean, and apple[16−21]. To investigate whether NAC genes may also contribute to nitrogen-responsive processes in cucumber, expression patterns were analyzed using high-nitrogen transcriptomic datasets from two cucumber lines exhibiting contrasting growth responses under high-nitrogen conditions.
Before transcriptomic analysis, the contrasting nitrogen-response phenotypes of the two cucumber lines were further validated through biomass measurements. Under high-nitrogen treatment, the whole-plant dry weight of the high-NUE line L2 increased by 25.6%, whereas that of the low-NUE line L8 decreased by 24.6%. Similar trends were observed in leaf, stem, and root biomass. Previous studies have reported a strong positive correlation between whole-plant dry weight and NUE in cucumber, indicating that biomass accumulation can serve as a reliable indicator of nitrogen utilization performance. Therefore, the contrasting biomass responses observed under identical nitrogen conditions provided physiological evidence supporting the classification of L2 and L8 as high- and low-NUE materials and justified their use for subsequent transcriptomic analyses.
The NUE process in plants encompasses several stages, including nitrogen absorption, transport, and assimilation[57]. Roots serve as the primary organs for nitrogen uptake, playing a crucial role in NUE[58]. In Arabidopsis thaliana, two genes known to be involved in nitrogen absorption are the extracellular nitrogen uptake gene NRT1.1 and the intracellular nitrogen uptake gene NLP7 in roots[59]. NRT1.1, located on the plasma membrane, facilitates the transport of nitrate from the extracellular environment into the cytoplasm through phosphorylation, opening nitrate ion channels[60,61]. In contrast, unphosphorylated NLP7 remains in the cytoplasm; however, upon stimulation and phosphorylation by nitrate and protein kinases such as CPK10/30/32, NLP7 translocates nitrate into the nucleus[62−65]. This process leads to the accumulation of Ca2+ in the nucleus, initiating the primary nitrogen response through signaling from members of the NRT gene family, including NRT1.1, NRT2.1, NRT2.2, NRT2.4, and NRT2.5 transport proteins[65,66]. Once nitrate is transported to the appropriate sites, enzymes such as nitrate reductase (NR), nitrite reductase (NiR), glutamine synthetase (GS), and glutamate synthase (GOGAT) convert it into amino acids, fulfilling various biological roles[67]. Eighty-three percent of the NAC gene family was expressed in the roots, which likely participated in primary nitrogen response and transport processes. Furthermore, specific NAC family genes have been shown to directly interact with NRT family genes in some crops. For instance, OsSNAC1 enhances NUE in rice by upregulating the expression of OsNRT2.1/2.2 and OsNRT1.1A/1.1B[18]. Similarly, MhNAC1 regulates the expression of the high-affinity nitrogen transporter MhNRT2.4[21], reducing nitrogen absorption capability in roots under low-nitrogen conditions.
In the present study, expression profiling revealed that 83% of NAC family members were expressed in roots, suggesting a potential involvement in root-associated biological processes. Previous studies have demonstrated that NAC transcription factors directly regulate nitrate transporter genes in several plant species. For example, OsSNAC1 enhances NUE in rice by promoting the expression of OsNRT2.1/2.2 and OsNRT1.1A/1.1B[18], whereas MhNAC1 regulates the high-affinity nitrate transporter MhNRT2.4 in apple rootstocks[21]. These findings support the possibility that NAC genes may participate in nitrogen-responsive regulatory networks in cucumber.
Among the 88 identified NAC genes, 77 were found to be expressed, aligning closely with the findings of Guan et al.[28], who reported the expression of 73 NAC genes. Furthermore, 63 NAC genes responded to high-nitrogen treatment, indicating that a substantial proportion of the NAC family may participate in nitrogen-responsive processes. Among these genes, CsNAC3.16 and CsNAC6.11 exhibited differential expression at five sampling time points, whereas most other NAC genes showed differential expression at fewer than three time points. WGCNA further assigned both genes to the blue module, which showed the strongest association with NUE-related traits. These observations suggested that CsNAC3.16 and CsNAC6.11 may represent important nitrogen-responsive candidate genes.
The expression patterns of CsNAC3.16 and CsNAC6.11 were subsequently validated by qRT-PCR. Both genes exhibited significant transcriptional responses following high-nitrogen treatment in L2 and L8, supporting the transcriptomic results. Interestingly, the two genes displayed distinct expression dynamics between the two lines. CsNAC6.11 showed similar expression levels in L2 and L8 before treatment but exhibited divergent expression patterns after nitrogen application, particularly during the later stages of treatment. In contrast, CsNAC3.16 displayed constitutive differences between the two lines even before nitrogen treatment, suggesting that genetic variation affecting basal expression levels may contribute to the distinct nitrogen-response characteristics observed in L2 and L8. These results indicate that both genes are associated with nitrogen-responsive processes, although their precise biological functions remain unclear.
To further explore the potential functions of these candidate genes, protein interaction network analyses were performed. CsNAC3.16's interaction network is linked to five proteins related to plant growth and development processes, including CsaV4_3G002564 and CsIAA1, which are auxin-responsive proteins of the Aux/IAA family. The overproduction of indole-3-acetic acid (IAA) in endophytes has been shown to upregulate nitrogen fixation both in bacterial cultures and in inoculated rice plants[68]. Endophytic fungi regulate the root exudation of IAA and abscisic acid (ABA), thereby enhancing nitrogen accumulation in rice by promoting soil nitrogen fixation[69]. CsaV4_4G000713 is a protein containing a glyco_trans_4-like_N domain, while CsaV4_6G003680 is a GRAS domain-containing protein belonging to the GRAS family, which is typically involved in plant growth and development[70]. CsaV4_3G001730 is a TCP domain-containing protein involved in various developmental processes in plants[71]. For CsNAC6.11, one of the predicted interacting proteins was CsNAC1.8, another member of the NAC transcription factor family. Because NAC proteins frequently function as dimers or participate in transcriptional regulatory complexes, this observation raises the possibility that CsNAC6.11 and CsNAC1.8 may be functionally associated. AlphaFold3-based structural prediction suggested a possible interaction between the two proteins, with an ipTM score of 0.66 and a pTM score of 0.65. Several potential hydrogen-bonding sites were identified at the predicted interaction interface. However, these findings were derived solely from computational analyses and should be regarded as preliminary hypotheses. Experimental approaches such as yeast two-hybrid (Y2H), bimolecular fluorescence complementation (BiFC), and co-immunoprecipitation (Co-IP) will be required to verify whether these proteins physically interact in vivo and whether such interactions contribute to nitrogen-responsive pathways.
A limitation of the present study is that the biological functions of CsNAC3.16 and CsNAC6.11 were inferred primarily from transcriptomic analyses, co-expression networks, expression validation, and computational predictions. Although these approaches identified both genes as promising candidates associated with nitrogen-responsive processes, direct functional evidence is still lacking. Future studies involving gene overexpression, knockout, or genome-editing approaches will be necessary to elucidate their specific roles in nitrogen uptake, transport, assimilation, and NUE regulation.
In summary, this study provides an updated genome-wide characterization of the cucumber NAC gene family based on the V4 genome and identifies CsNAC3.16 and CsNAC6.11 as promising nitrogen-responsive candidate genes through transcriptomic, co-expression, and expression validation analyses. Although their molecular functions remain to be experimentally verified, the results provide valuable resources for future investigations of NAC-mediated nitrogen responses and contribute to the identification of candidate genes for improving nitrogen use efficiency in cucumber.
-
In this study, the NAC transcription factor family was systematically re-identified and characterized using the cucumber V4 reference genome. A total of 88 CsNAC genes were identified and analyzed for their evolutionary relationships, gene structures, conserved motifs, chromosomal distribution, cis-regulatory elements, and expression profiles across different tissues.
By integrating transcriptome analysis, WGCNA, biomass evaluation, and qRT-PCR validation, we identified CsNAC3.16 and CsNAC6.11 as nitrogen-responsive NAC genes that showed distinct expression patterns between high- and low-NUE cucumber lines under high-nitrogen conditions. These results suggest that the two genes may be associated with nitrogen response processes and represent promising candidates for future studies of NUE regulation.
Although protein interaction prediction suggested a potential association between CsNAC6.11 and CsNAC1.8, experimental validation will be required to determine whether this interaction occurs in vivo and whether it contributes to the nitrogen response. Collectively, this work provides an updated genomic resource for NAC family research in cucumber and establishes a foundation for future functional studies aimed at elucidating the molecular mechanisms underlying nitrogen use efficiency.
This work was supported by the National Natural Science Foundation of China (Grant No. 32372708), the Basic Scientific Research Project of the National Key Laboratory of Vegetable Biobreeding, and the Seed Industry Innovation Research Project of the Tianjin Academy of Agricultural Sciences.
-
The authors confirm their contributions to this study as follows: writing – original draft: Ma L; funding acquisition: Wei A, Du S; software: Zhang R; methodology: Ma L, Han Y; conceptualization, project administration: Du S; supervision: Wei A, Du S, Han Y; data curation: Ma L, Liu C, Zhang R, Wei L; formal analysis: Ma L, Liu C, Zhang R; investigation: Ma L, Wei L, Liu N; resources: Wei A, Liu N; writing – review and editing: Wei A, Liu C, Du S. All authors reviewed the results and approved the final version of the manuscript.
-
The datasets generated and/or analyzed in the current study are available from the corresponding author upon reasonable request.
-
The authors declare that they have no competing interests.
-
accompanies this paper online at: https://doi.org/10.48130/vegres-0026-0027.
-
# Authors contributed equally: Linhao Ma, Aimin Wei
- Supplementary Table S1 Transcriptomic data of diffenrent tissues.
- Supplementary Table S2 Transcriptomic data of high nitrogen treatment.
- Supplementary Table S3 Primers used for qPCR.
- Supplementary Table S4 Gene id convert.
- Supplementary Table S5 Correlation analysis data.
- Supplementary Fig. S1 Schematic representation of cucumber tissues, developmental stages, and treatment conditions used for transcriptomic analysis.
- Supplementary File 1 The protein sequence.
- Supplementary File 2 The promoter sequence.
- Copyright: © 2026 by the author(s). Published by Maximum Academic Press, Fayetteville, GA. This article is an open access article distributed under Creative Commons Attribution License (CC BY 4.0), visit https://creativecommons.org/licenses/by/4.0/.
-
About this article
Cite this article
Ma L, Wei A, Liu C, Zhang R, Wei L, et al. 2026. Genome-wide identification of the NAC gene family in cucumber based on the V4 genome and the response to high nitrogen. Vegetable Research 6: e036 doi: 10.48130/vegres-0026-0027 

Genome-wide identification of the NAC gene family in cucumber based on the V4 genome and the response to high nitrogen
- Received: 22 April 2026
- Revised: 26 June 2026
- Accepted: 05 August 2026
- Published online: 29 October 2026
Abstract: Nitrogen use efficiency (NUE) in plants significantly affects crop yields and is closely linked to environmental pollution, particularly critical for nitrogen-demanding crops such as cucumbers. The NAC gene family, a group of plant-specific transcription factors, has been associated with NUE in crops like soybeans, rice, and apples. However, its role in cucumber NUE remains unclear. In this study, 88 NAC genes were identified in the cucumber V4 genome. Phylogenetic analysis classified these genes into six subfamilies, each with closely related protein sequences. Promoter analysis revealed abundant cis-acting elements associated with stress responses, hormone signaling, and plant growth and development. Transcriptome data indicated that NAC genes were predominantly expressed in roots, and 62.5% of the family members exhibited co-expression patterns. Two cucumber lines with contrasting responses to high nitrogen supply were used to investigate NAC gene expression dynamics. Under high nitrogen conditions, the whole-plant dry weight increased by 25.6% in the high-NUE line L2 but decreased by 24.6% in the low-NUE line L8. Transcriptome analysis identified 63 NAC genes responsive to high nitrogen treatment. WGCNA grouped the 88 NAC genes into four co-expression modules, among which the blue module showed the strongest association with NUE-related traits. CsNAC3.16 and CsNAC6.11 were identified as hub genes within this module and displayed distinct expression patterns between L2 and L8 during nitrogen treatment. qRT–PCR analysis further confirmed that both genes responded to high nitrogen treatment. CsNAC3.16 showed stronger induction in L2 than in L8, whereas CsNAC6.11 was strongly induced in L2 but showed reduced expression in L8 at the later stage of treatment. Several predicted interacting genes also exhibited differential expression patterns between the two genotypes under high nitrogen conditions. In addition, protein interaction prediction suggested a potential interaction between CsNAC6.11 and CsNAC1.8. Collectively, these results provide an updated genome-wide characterization of the cucumber NAC family and identify CsNAC3.16 and CsNAC6.11 as candidate genes potentially associated with nitrogen responses and NUE-related traits in cucumber.
-
Key words:
- Cucumber /
- NAC gene family /
- Nitrogen use efficiency /
- High nitrate