


-
Diabetic retinopathy (DR) is the leading cause of irreversible blindness in the working-age population[1]. Current treatment options for DR and its complications include intravitreal injection, panretinal photocoagulation (PRP), and pars plana vitrectomy (PPV)[2,3]. However, these interventions impose significant social and economic burdens on patients and their families[4].
Diabetic retinal neurodegeneration (DRN) is now recognized as an early and critical component of DR. Previous studies have shown that DR is associated with retinal neurodegeneration at different stages[5]. Pathophysiologically, DRN involves ganglion cell apoptosis, glial activation, oxidative stress, and chronic inflammation[6]. One quantitative marker of DRN, the thickness of the peripapillary or macular retinal nerve fiber layer, was demonstrated to thin by optical coherence tomography (OCT) in people with diabetes, and this thinning intensifies over time[7]. Clinically, DRN may contribute to functional deficits such as contrast sensitivity loss and delayed visual recovery[8]—factors not adequately addressed by current therapies that primarily target vascular lesions. Despite growing recognition of DRN, most current treatment approaches do not directly target neurodegeneration. Longitudinal research on retinal structure changes following surgical treatment remains limited.
Previous studies have reported that PRP, by inducing thermal damage and inflammatory responses, may contribute to thinning of the inner retina[9]. In contrast, PPV has been hypothesized to improve retinal oxygenation, remove inflammatory cytokines, and reduce metabolic stress, which may help preserve retinal structure. However, research on DRN following PPV is sparse, largely due to complications such as vitreous hemorrhage, preretinal hemorrhage, proliferative membranes, and tractional retinal detachment, which complicate patient assessments before surgery. These challenges make it difficult to evaluate changes in retinal thickness before and after the procedure, thereby limiting our understanding of DRN following vitrectomy.
Severe nonproliferative diabetic retinopathy (sNPDR) is a pivotal stage in DR progression and represents a critical window for intervention. Our research group previously conducted a randomized controlled trial investigating the effects of PRP and PPV on sNPDR progression[10]. This study retrospectively analyzed longitudinal changes in retinal structure following PRP or PPV in sNPDR patients, based on the trial, using a linear mixed-effects (LME) model[11].
-
This study retrospectively included patients with sNPDR from a randomized controlled trial conducted at Zhongshan Ophthalmic Center, Sun Yat-sen University (ZOC), Zhongshan, China between 2019 and 2022 (NCT04103671). The aim was to evaluate the impact of minimally invasive PPV on sNPDR progression and compare it with PRP treatment. Patients were randomly assigned to either PPV or PRP. The PPV group underwent standard 25-gauge vitrectomy without lens removal or intraoperative PRP, with perfusion fluid used to fill the vitreous cavity at the end of the surgery. The PRP group received standard treatment in three sessions over one month. The study was approved by the Ethics Committee of the Clinical Research Center of Zhongshan Ophthalmic Center (2019KYPJ108) and adhered to the tenets of the Declaration of Helsinki. Written informed consent was obtained from all participants before enrollment in the study.
Inclusion criteria
-
Patients attending ZOC with a confirmed diagnosis of sNPDR were invited to participate in this study. The diagnosis of sNPDR was based on seven standard-field fundus photographs from the Early Treatment Diabetic Retinopathy Study[12], with patients being required to meet at least one of the following criteria: more than 20 intraretinal hemorrhages in each of four quadrants; definite venous beading in two or more quadrants; and prominent intraretinal microvascular abnormalities in one or more quadrants. Additionally, patients were required to maintain stable blood glucose levels at baseline which was defined as no use of intensive insulin therapy (using an insulin pump or multiple daily insulin injections) in the past 4 months or no plans for intensive insulin therapy in the next 4 months. High-quality OCT images (based on a signal intensity score of ≥ 6, absence of motion artifacts, and proper segmentation of retinal layers) were obtained at baseline and follow-up visits.
Exclusion criteria
-
Patients were excluded if any of the following applied:
OCT images were unavailable; any concurrent conditions affecting retinal pathophysiology, including other retinal diseases, ocular trauma, or uveitis; and unstable systemic disease control, including a recent acute stroke or coronary stent implantation within the past six months.
Data collection and image processing
-
Demographic data, systemic medical history, general measurements (height, weight, blood pressure), and blood test indicators (fasting blood glucose, glycated hemoglobin, blood lipids, and liver and kidney function) were collected at baseline.
OCT images were obtained at baseline and 1, 3, 6, 9, 12, 18, and 24 months postoperatively using a CIRRUS™ 5000 HD-OCT system (Carl Zeiss Meditec Inc., CA, USA) after mydriasis. The FastTrac™ mode was turned on, and the OCT images included a 200 × 200 volume scan centered on the optic disc and a 512 × 128 volume scan of the macula centered on the fovea with follow-up mode in subsequent follow-up examinations.
Image quality can affect the accuracy of measurements[13,14], therefore, based on the literature, we selected OCT scans with a signal intensity of 6 or higher for analysis. The device’s built-in software was used to analyze the parapapillary retinal nerve fiber layer (pRNFL) thickness based on a 200 × 200 volume scan within a circular range of 3.46 mm in diameter, centered on the optic disc. The pRNFL thickness was measured in four directions: average, temporal, nasal, superior, and inferior. Macular thickness was measured using the built-in software, with a focus on the 512 × 128 volume scan of the macula. The central subfield thickness (CST) was defined as the average thickness from the internal limiting membrane to the retinal pigment epithelial cells within a 1 mm diameter centered on the fovea. The ganglion cell-inner plexiform layer (mGCIPL) thickness was analyzed within an elliptical area of 14.13 mm2 centered on the fovea. The mGCIPL thickness was automatically calculated in six directions: superior, inferotemporal, inferonasal, inferior, superotemporal, and superonasal, as well as average and minimum thickness (Supplementary Fig. S1). Any errors in the identification line were excluded from the statistical analysis.
Statistical analysis
-
Statistical analyses were performed using GraphPad Prism (Version 10.2.0, GraphPad Software, Boston, MA, USA) and R software (Version 4.3). Continuous variables are expressed as the means ± standard deviations. The Shapiro-Wilk test was used to assess the normal distribution of the data. An independent sample t-test was used to compare the data between the two groups that met the normal distribution, whereas the Mann-Whitney test was used for the non normally distributed data.
The LME model is ideal for handling the complexities of repeated measures, individual variability, and the non-independence of observations over time in longitudinal studies, offering greater flexibility and more accurate estimates than traditional methods. Therefore, the LME model was constructed for the pRNFL and mGCIPL thickness. PPV and follow-up time were used as fixed effects, while each patient was treated as a random effect to construct Model 1. Considering that the pRNFL and mGCIPL thicknesses of each patient may have different slopes over time, Model 2 was constructed by adding time as a random effect to Model 1, and Model 3 incorporated the interaction effect of PPV and time as a fixed effect. Model 4 is a combination of Models 1 to 3. At this stage, Models 1 and 2 have the same fixed effects but different random effects, as do Models 3 and 4. In accordance with the restricted maximum likelihood estimation method, the ANOVA function was used for comparison. Models 1 and 3 have different fixed effects but the same random effects, as Models 2 and 4 do. In accordance with the maximum likelihood (ML) estimation method, the ANOVA function was applied for comparison to select the optimal model, which was then calculated using the ML method. To further explore the effects of demographic factors, we built three additional models based on Model 2. Model 5 added age as a fixed effect. Model 6 added gender as a fixed effect and Model 7 included both age and gender as fixed effects. These models were compared using the ANOVA function under ML estimation to determine whether the inclusion of these covariates improved the model fit. The residuals after fitting the model were tested for normality using the QQ plot.
A p-value less than 0.05 was considered statistically significant.
-
A total of 38 eyes from 38 patients (20 males, 18 females) with sNPDRs were included in the study, with 19 eyes each in the PPV and PRP groups. The mean age of the participants was 60.45 years. The duration of diabetes diagnosis was 11.40 ± 7.48 years, and the baseline hemoglobin A1c was 7.79% ± 1.35%. There was no statistically significant difference between the two groups in terms of blood lipids or liver or kidney functions. Detailed demographic information and clinical characteristics are shown in Table 1.
Table 1. Demographics and clinical characteristics of participants at baseline.
All PRP PPV p value N 38 19 19 / Age (years) 60.45 ± 8.80 62.00 ± 8.40 58.89 ± 9.14 0.28 Female (%) 18 (47%) 11 (58%) 7 (37%) 0.33 Pseudophakic eye (%) 16 (42%) 7 (39%) 9 (47%) 0.74 Duration of diabetes (years) 11.40 ± 7.48 11.49 ± 6.35 11.32 ± 8.64 0.989 Insulin therapy (yes, %) 19 (50%) 8 (42%) 11 (58%) 0.52 History of hypertension ( yes, %) 18 (47%) 10 (53%) 8 (42%) 0.75 SBP (mmHg) 131.32 ± 19.13 128.26 ± 16.12 134.37 ± 21.75 0.33 DBP (mmHg) 73 ± 9.82 71.58 ± 10.98 74.42 ± 8.57 0.42 BMI 24.78 ± 4.47 25.21 ± 6.11 24.36 ± 2.92 0.86 Blood biomarker Total cholesterol (mmol/L) 4.95 ± 1.20 5.08 ± 1.44 4.81 ± 0.92 0.51 Triglyceride (mmol/L) 1.77 ± 1.05 1.95 ± 1.27 1.559 ± 0.77 0.54 BUN (mmol/L) 7.33 ± 3.32 7.95 ± 4.24 6.70 ± 1.98 0.51 ALT (U/L) 31.41 ± 18.95 35.29 ± 23.59 27.53 ± 12.22 0.60 AST (U/L) 26.93 ± 12.78 26.85 ± 11.92 27.00 ± 13.92 0.75 Creatinine (μmol/L) 77.96 ± 39.92 83.28 ± 47.47 72.63 ± 31.03 0.17 HbA1c (%) 7.79 ± 1.35 7.87 ± 1.61 7.71 ± 1.07 0.95 DME (yes, %) 16 (42%) 8 (42%) 8 (42%) 1.00 Average pRNFL (μm) 105 ± 18.50 107.79 ± 21.46 103.05 ± 15.21 0.56 Average mGCIPL (μm)a 83.35 ± 9.12 85.45 ± 9.32 81.42 ± 8.89 0.34 PPV, pars plana vitrectomy; PRP, pan-retinal photocoagulation; SBP, systolic blood pressure; DBP, diastolic blood pressure; BMI, body mass index; BUN, blood urea nitrogen; ALT, alanine transaminase; AST, aspartate aminotransferase; HbA1c, hemoglobin A1c; DME, diabetic macular edema, which defined as central subfield thickness ≥ 300 μm; pRNFL, parapapillary retinal nerve fiber layer. mGCIPL, macular ganglion cell inner plexus layer. a, Due to inaccuracies in the identification line, the PPV group included 12 participants and the PRP group included 11 participants in the mGCIPL thickness statistical analysis. Changes in pRNFL thickness
-
As shown in Fig. 1, the pRNFL thickness in the PPV group increased one month, returned to baseline over the next 3−6 months, and gradually decreased between 12 and 24 months postoperatively. The comparison of Models 1−7 indicated that Model 2 was the optimal model (Supplementary Table S1), with time and PPV as fixed effects and individual participants and their slopes at each time point as random effects. Model 2 revealed significant fixed effects for the average pRNFL thickness of sNPDR patients at 1, 18, and 24 months post treatment (p = 0.0001, p = 0.002, and p = 0.003, respectively), as shown in Fig. 2. Although there was no fixed effect of PPV (p = 0.83), the extent of pRNFL thickening and subsequent thinning in the PPV group was less pronounced than that in the PRP group. Superior, inferior, and nasal pRNFL thicknesses followed a similar pattern with significant fixed effects at 1, 18, and 24 months post treatment (superior p = 0.006, p = 0.010, p = 0.007 respectively; inferior p = 0.014, p = 0.001, p = 0.001 respectively; nasal p = 0.049, p = 0.003, p = 0.015 respectively). In contrast, no significant fixed effects at the long-term follow-up point were observed for temporal pRNFL thickness (Table 2). Additionally, PPV had no significant fixed effect on the directional pRNFL thickness.
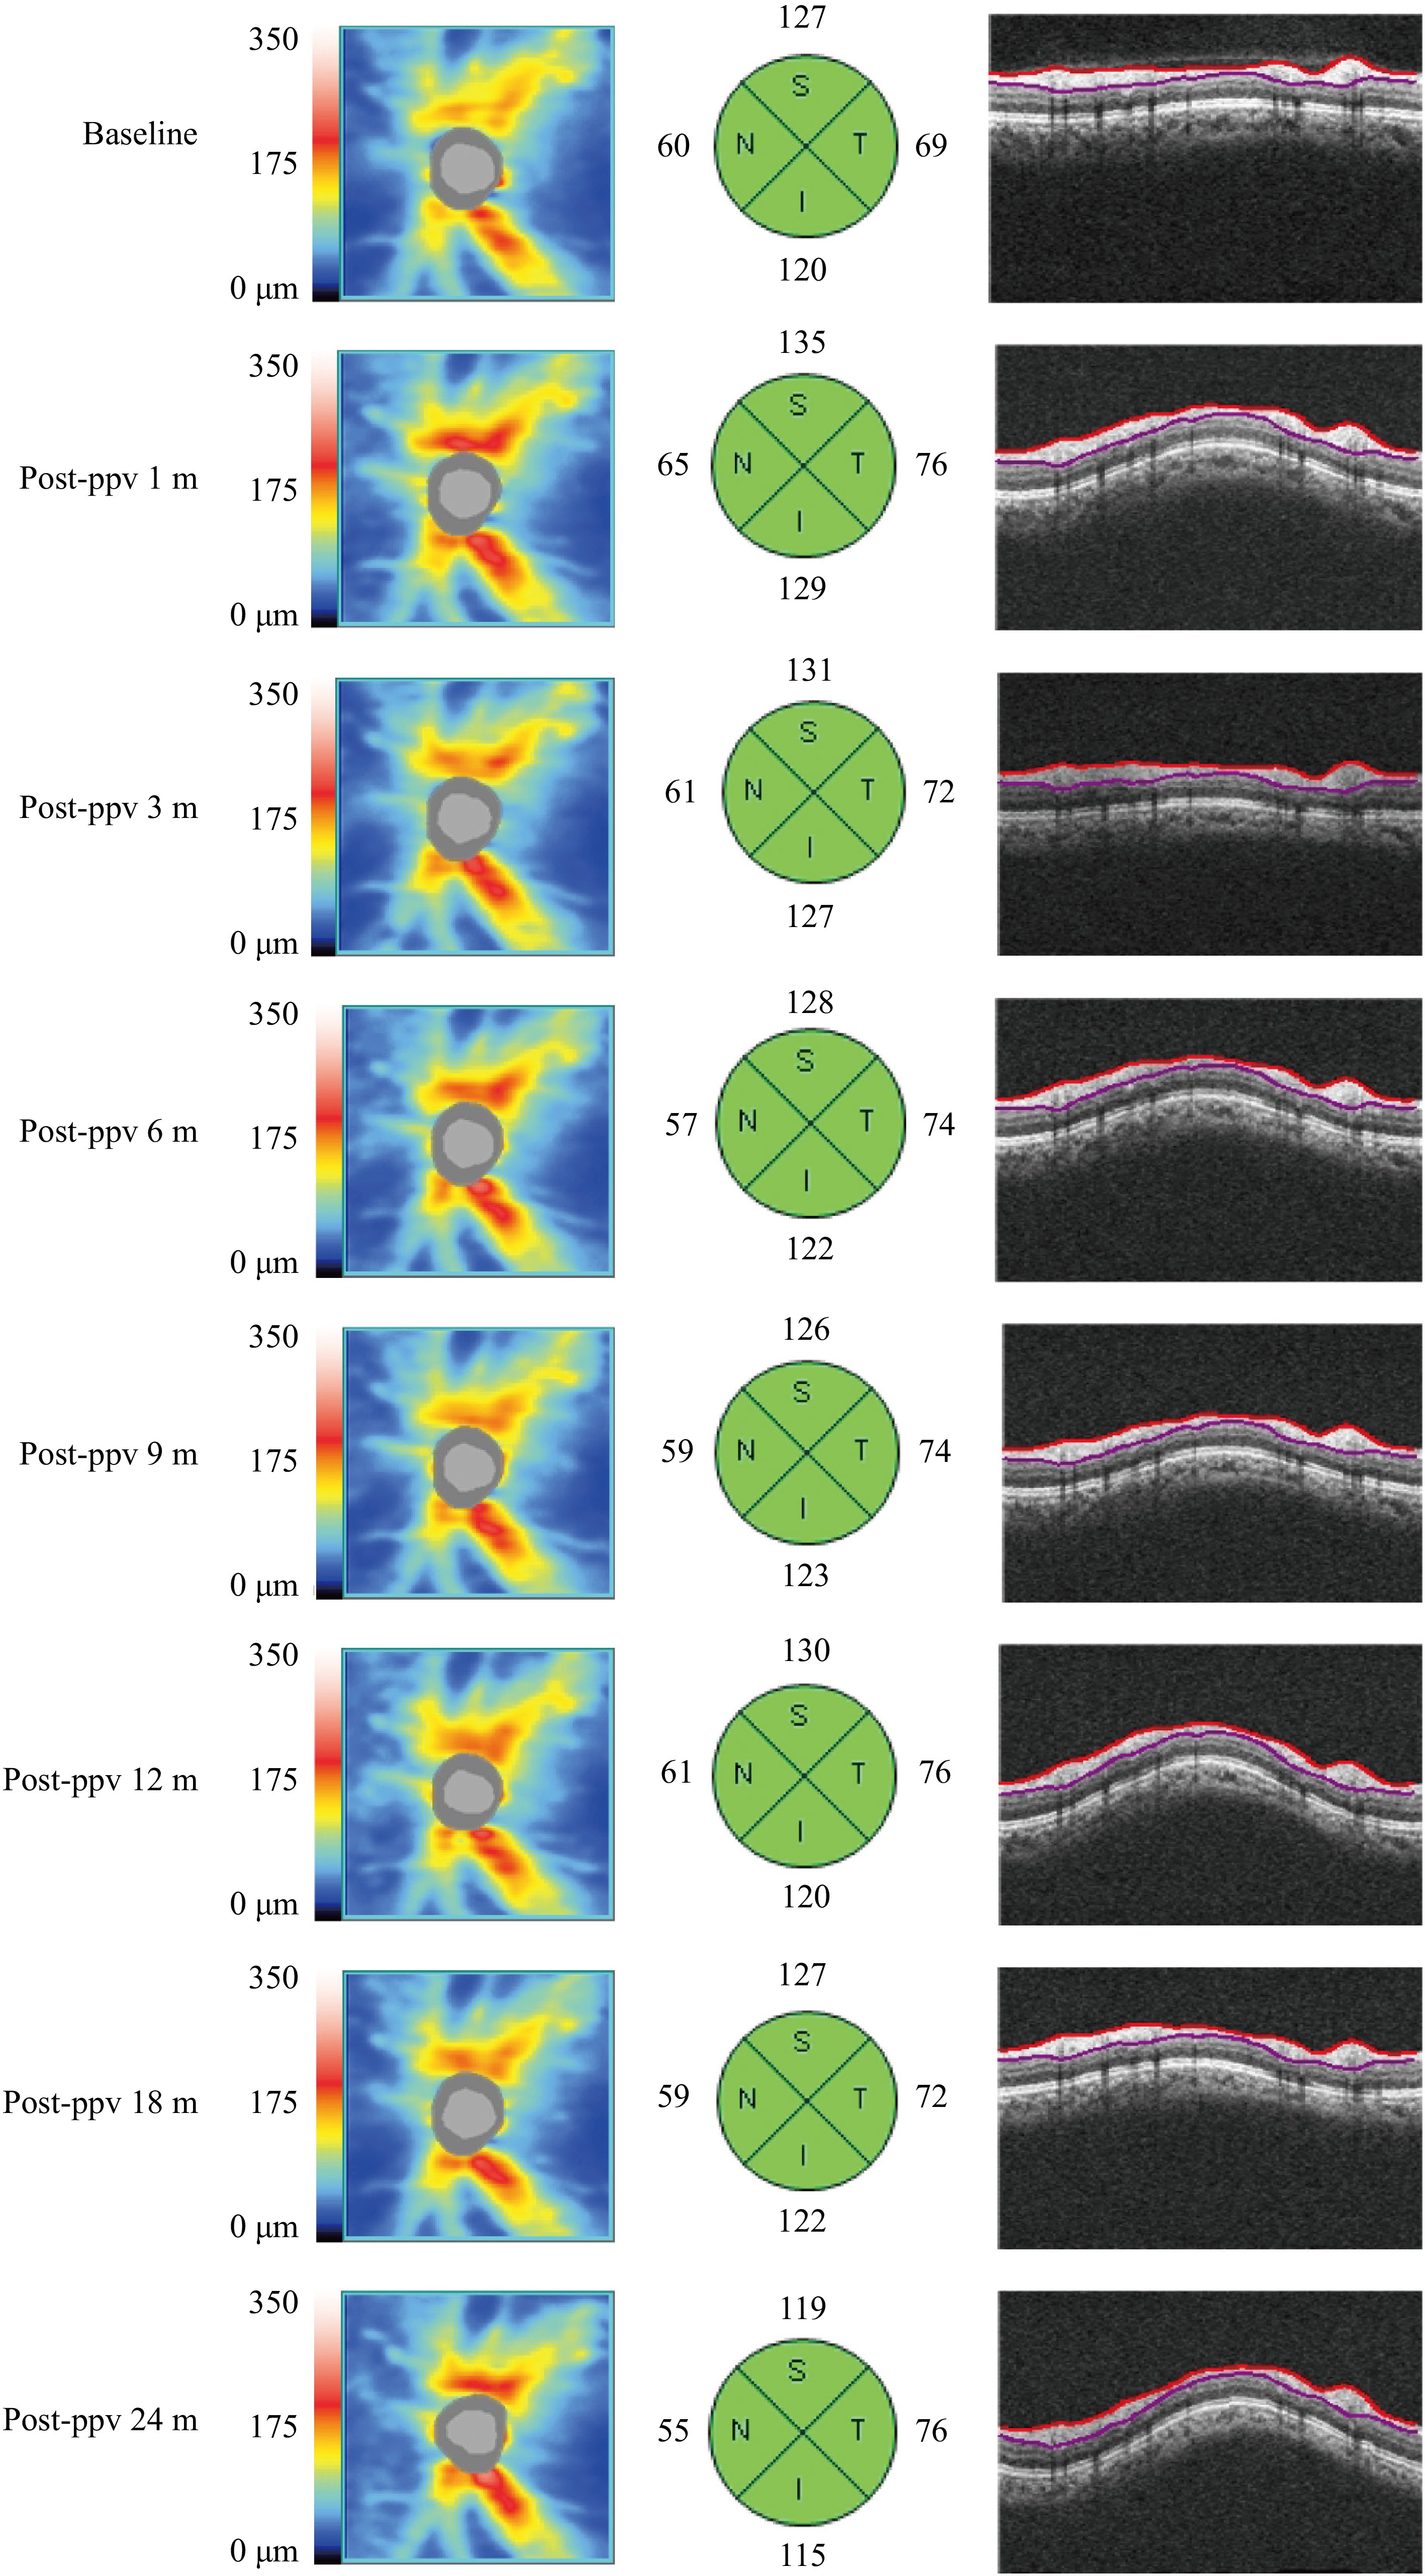
Figure 1.
A typical case of pRNFL changes in the PPV group. In an sNPDR patient, the pRNFL thickness in the superior, inferior, and nasal quadrants increased 1 month after PPV returned to baseline levels between 3 and 6 months, and steadily declined from 12 to 24 months. In contrast, the temporal pRNFL thickness increased 1 month post surgery and remained elevated at the long-term follow-up.
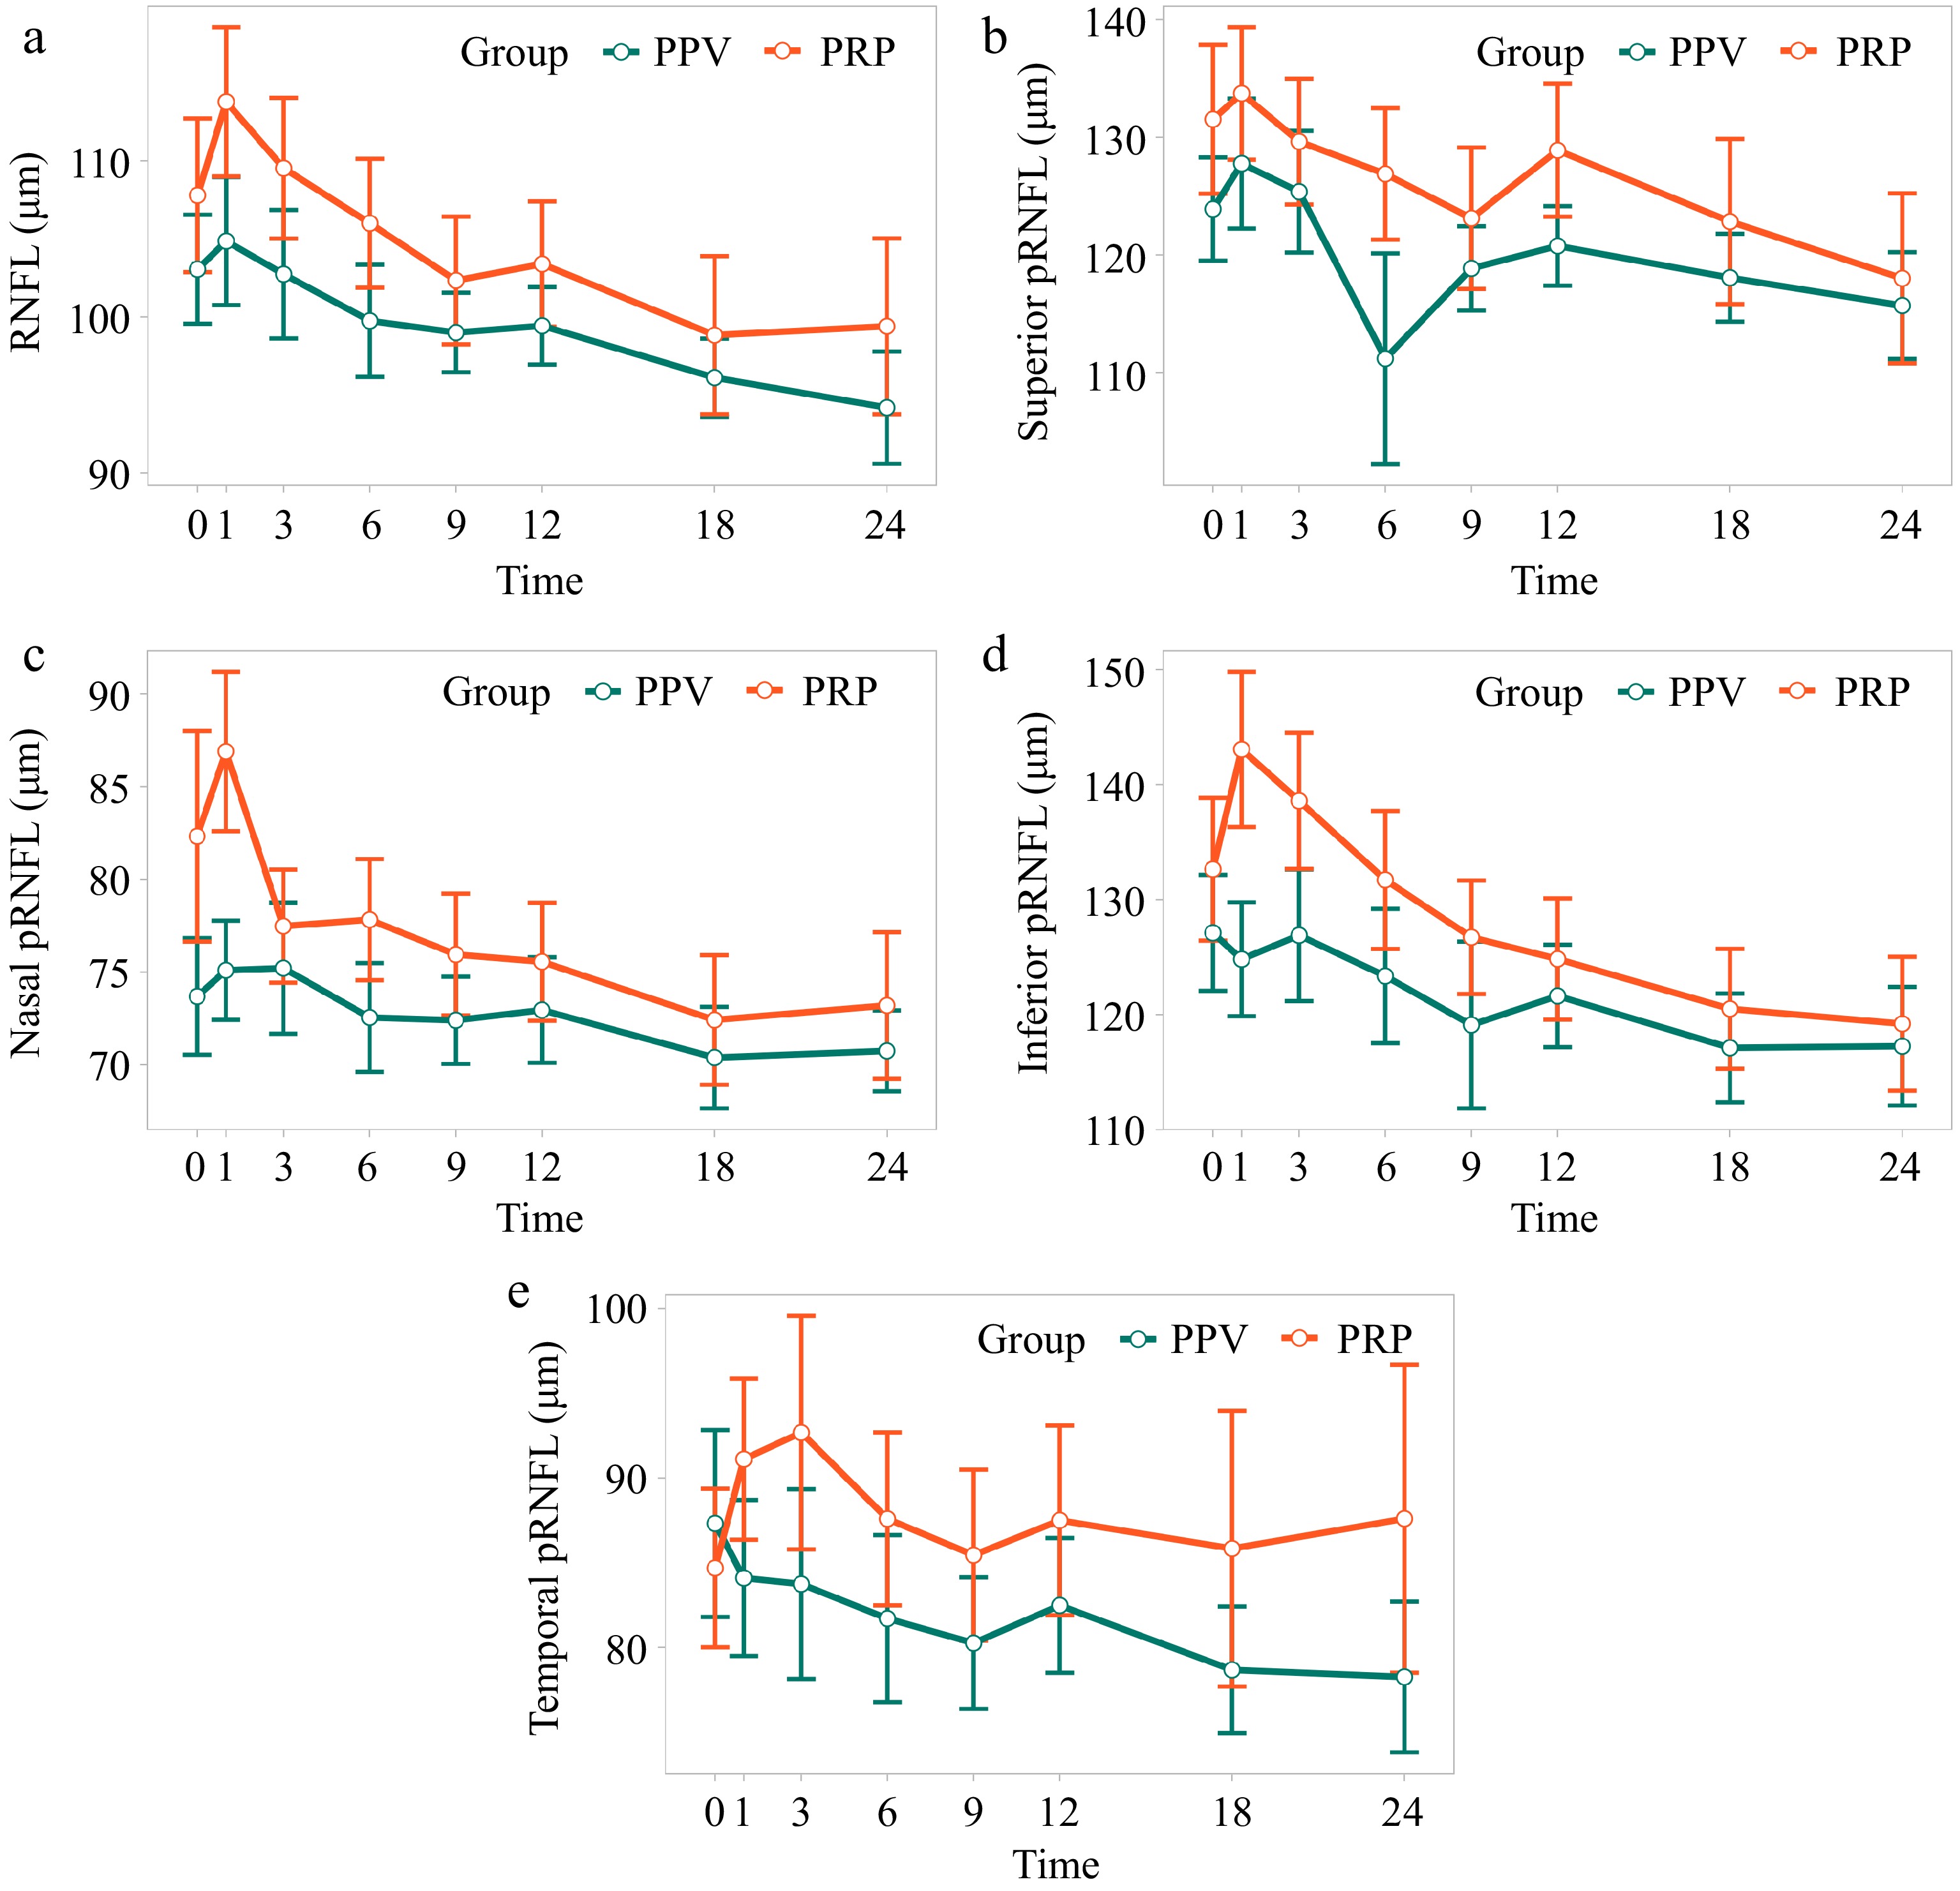
Figure 2.
Changes in pRNFL thickness in sNPDR patients with PRP and PPV. (a) Average pRNFL thickness. (b) Superior pRNFL thickness. (c) Nasal pRNFL thickness. (d) Inferior pRNFL thickness. (e) Temporal pRNFL thickness.
Table 2. Time and group effects on pRNFL thickness in sNPDR patients.
Average pRNFL thickness Temporal pRNFL thickness Nasal pRNFL thickness Superior pRNFL thickness Inferior pRNFL thickness Intercept 105.85 (3.67) *** 86.56 (4.71) *** 78.11 (3.18) *** 128.94 (4.89) *** 129.76 (5.16) *** T0−T1 5.64 (1.42) *** 3.23 (2.28) 3.23 (1.63) * 5.34 (1.92) ** 5.31 (2.14) * T0−T3 1.83 (1.46) 4.44 (2.31) −1.56 (1.66) 0.57 (1.97) 3.99 (2.18) T0−T6 −1.76 (1.63) −0.84 (2.46) −2.81 (1.77) −2.58 (2.15) −0.60 (2.35) T0−T9 −2.97 (1.85) −1.45 (2.65) −3.16 (1.93) −4.55 (2.39) −3.02 (2.58) T0−T12 −3.45 (2.10) −1.11 (2.84) −3.70 (2.09) −3.49 (2.65) −5.40 (2.82) T0−T18 −8.94 (2.85) ** −5.69 (3.64) −8.13 (2.69) ** −9.13 (3.54) * −12.00 (3.70) ** T0−T24 −10.72 (3.62) ** −5.09 (4.46) −8.13 (3.31) * −12.12 (4.45) ** −15.03 (4.60) ** PPV −0.86 (4.00) −1.13 (5.52) −0.23 (3.15) −2.46 (5.97) −0.23 (6.09) Observation 259 259 259 259 259 AIC 1,879.67 2,092.71 1,905.59 2,036.73 2,079.71 BIC 1,925.91 2,138.95 1,951.82 2,082.97 2,125.95 logLik −926.84 −1,033.36 −939.79 −1,005.37 −1,026.86 pRNFL, parapapillary retinal nerve fiber layer; T0, baseline; T1−T24, 1 month to 24 months post-PPV; Observation, the total number of observations included in the mode AIC, Akaike information criterion; BIC, Bayesian information criterion; logLik, log-likelihood. The values in the table represent the estimated effect and corresponding standard error, rounded to two decimal places. * p < 0.05; ** p < 0.01; *** p < 0.001. Changes in mGCIPL thickness
-
As illustrated in Supplementary Fig. S2, the average mGCIPL thickness in the PPV group increased from 1–3 months post treatment, returned to baseline between 6 and 9 months, and slightly fluctuated thereafter. Model 2 analysis revealed significant fixed effects for superotemporal mGCIPL thickness at 1 month post surgery, as well as superior and minimum mGCIPL thickness at 18 months, and superior mGCIPL thickness at 24 months (p < 0.05; Supplementary Table S2). However, no significant differences were found in average, minimum, or directional GCIPL thickness between the PPV and PRP groups (p > 0.05; Supplementary Table S2), suggesting comparable outcomes in terms of GCIPL thickness for patients with sNPDR.
-
The DRN plays a crucial role in the pathophysiology of diabetic retinal diseases. It influences visual outcomes[15], and the rate of initial pRNFL thinning has been confirmed to be associated with DR occurrence in patients with diabetes[16]. In this study, we found that pRNFL thickness in sNPDR patients who underwent PPV initially increased before gradually thinning over time, a trend also observed in patients treated with PRP.
PRP and PPV are vital treatments for DR[3]. PRP utilizes the laser thermal effect to denature retinal pigment epithelial cell proteins, creating scars that reduce overall retinal oxygen demand and prevent neovascularization. According to the ETDRS study, more than 50% of sNPDR patients who did not receive prompt PRP progressed to PDR within one year, with 30% classified as high-risk PDR[17]. Even with prompt PRP treatment, regular follow-up, and supplementary laser treatment when needed, some patients still progressed to PDR within five years, requiring PPV surgery[18]. During PPV, complete posterior vitreous detachment (PVD) is achieved, removing the structural support provided by vitreous collagen, which enhances oxygen diffusion and facilitates the clearance of vascular endothelial growth factor (VEGF)[19,20]. Our study analyzed retinal structural changes observed through OCT following PRP and PPV in sNPDR patients.
Our findings indicate an initial increase in pRNFL thickness among sNPDR patients shortly after PPV, which is consistent with the findings of previous studies on postoperative retinal structural changes. Hwang et al. reported that patients with rhegmatogenous retinal detachment presented a temporary increase in pRNFL thickness in the early postoperative period, independent of detachment characteristics[21]. Similarly, Lim et al. reported that patients with intraocular lens dislocation who underwent PPV presented a transient increase in total retinal thickness in the macular area and pRNFL thickness[22]. Experimental studies suggest that PPV may disrupt the blood-retinal barrier and trigger postoperative inflammation, which can vary depending on the specifications of the surgical instruments used; smaller instruments may reduce associated inflammation[23]. Therefore, we speculate that the initial increase in the PPV group is linked to mechanical traction from the PVD and environmental changes within the vitreous cavity.
In contrast to other conditions following PPV (such as rhegmatogenous retinal detachment[21], macular epiretinal membranes[24], and intraocular lens dislocation[22]), our long-term follow-up revealed a significant decrease in pRNFL thickness in sNPDR patients compared with baseline. Previous studies reported an average pRNFL thickness loss of approximately 1.16 μm per year over a 2-year follow-up in NPDR patients[25], whereas a cross-sectional study indicated that RNFL thickness decreases with the severity of DR[26]. Thus, we hypothesize that the long-term effects of PPV on pRNFL thickness primarily reflect the progression of DRN.
The early increase in pRNFL thickness following PRP may also result from treatment-induced inflammation, as inflammatory factors in the aqueous humor, such as TNF-α, are elevated shortly after PRP and gradually decrease over time[27]. Earlier studies reported similar patterns of the pRNFL thickness changes following PRP intervention[28]. While some studies have indicated continued thickening of pRNFL in sNPDR patients without diabetic macular edema (DME) during one year of follow-up[29], other studies have demonstrated that patients with PDR exhibit thinning at six months after PRP[30]. In a two-year follow-up study of PDR, patients with DME (−9.3 ± 12.4 μm) presented greater pRNFL thinning than did those without DME (−2.5 ± 10.9 μm) and even more significant thinning in patients with DME and visual loss[31]. Differences in baseline DR severity and DME status are likely to influence pRNFL thickness. PRP may have a detrimental effect on photoreceptor cells[32]. The average pRNFL thickness in patients with DR undergoing PRP was significantly lower than that in normal or nonlaser-treated DR eyes[33]. In our study, the extent of pRNFL changes was less pronounced in the PPV group than in the PRP group, although this difference was not statistically significant.
The lack of significant thinning in the temporal quadrant pRNFL during long-term follow-up may be related to the same changes in CST in sNPDR patients[29], reflecting a similar trend observed in average mGCIPL thickness. Notably, during the natural course of DR, the mGCIPL layer thins more rapidly (−0.97 ± 0.97 μm/year) in NPDR patients than in healthy controls of the same age group (−0.04 ± 0.55 μm/year)[34] reinforcing the notion that DRN is a progressive and quantifiable process.
In our study, mGCIPL thickness exhibited a transient increase within the early months posttreatment, followed by a return to baseline and slight fluctuations thereafter. These changes likely reflect a combination of biological and technical factors. The initial thickening may result from short-term inflammation induced by surgical intervention or laser photocoagulation, consistent with prior reports of postoperative retinal edema. Additionally, during the follow-up period, patients were allowed to receive anti-vascular endothelial growth factor (anti-VEGF) therapy based on clinical indications, which could influence macular structure and contribute to mGCIPL variability. From a technical standpoint, automated segmentation algorithms used for OCT may be less reliable in the presence of diabetic macular changes such as edema or hard exudates. These pathological features can lead to segmentation errors and measurement variability, especially in the inner retinal layers. In our study, the exclusion of images with segmentation errors attenuated the observed mGCIPL thickness of some patients with DME. These inaccuracies may contribute to the observed fluctuations in mGCIPL thickness over time. Despite these limitations, our findings observed the complex interplay between neurodegeneration, treatment-induced changes, and imaging artifacts, emphasizing the need for cautious interpretation of inner retinal layer thickness metrics in DR patients. Further prospective studies with standardized imaging protocols and longitudinal functional assessments are warranted to clarify the clinical relevance of mGCIPL changes and their potential role as biomarkers for DRN.
There are several limitations to our study. First, this study was conducted at a single center; thus, the sample size was relatively small. Second, we did not evaluate the effects of axial length, diabetes duration, or glycated hemoglobin on retinal structure[35], which may lead to confounding bias. Future studies with larger sample sizes are necessary to provide more comprehensive insights. Third, a control group without any treatment was not included. Future studies incorporating untreated or observational cohorts (such as delayed-treatment groups) would provide valuable insights into the natural course of DRN and help isolate the specific effects of treatment.
-
Following treatment with PPV and PRP, patients with sNPDR experienced an initial increase in pRNFL thickness, followed by a decrease over time. There was no significant difference in outcomes between PPV and PRP treatment. Thus, PPV did not result in greater retinal damage than PRP.
This work was supported by the National Natural Science Foundation of China (Grant Nos 82070972 and 82271093).
-
The study was approved by the Ethics Committee of the Clinical Research Center of Zhongshan Ophthalmic Center (2019KYPJ108) and adhered to the tenets of the Declaration of Helsinki. Written informed consent was obtained from all participants before enrollment in the study.
-
The authors confirm contribution to the paper as follows: methodology, formal analysis, data curation: Liu Y; conceptualization, validation: Zheng W; software: Liu Y, Lin Z; visualization: Liu Y, Xu Z; investigation: Zheng W, Lin Z, Xu Z, Li J, Ma Y, Chen Z; writing - original draft preparation: Liu Y, Zheng W, Lin Z; writing - review & editing: Xu Z, Tsai C, Li T; supervision, project administration, funding acquisition: Li T. All authors reviewed the results and approved the final version of the manuscript.
-
The data that support the findings of this study are not publicly available because they contain information that could compromise the privacy of research participants but are available from the corresponding author upon reasonable request.
-
The authors declare that they have no conflict of interest.
-
Authors contributed equally: Yaping Liu, Wenbin Zheng
- Supplementary Table S1 Components and parameters candidate models.
- Supplementary Table S2 Time and group effects on mGCIPL thickness in sNPDR patients.
- Supplementary Fig. S1 OCT imaging acquisition and processing.
- Supplementary Fig. S2 Changes of mGCIPL thickness in sNPDR patients with PRP and PPV.
- Copyright: © 2025 by the author(s). Published by Maximum Academic Press, Fayetteville, GA. This article is an open access article distributed under Creative Commons Attribution License (CC BY 4.0), visit https://creativecommons.org/licenses/by/4.0/.
-
About this article
Cite this article
Liu Y, Zheng W, Lin Z, Xu Z, Li J, et al. 2025. Effects of pars plana vitrectomy on retinal structure in severe non-proliferative diabetic retinopathy. Visual Neuroscience 42: e006 doi: 10.48130/vns-0025-0005 

Effects of pars plana vitrectomy on retinal structure in severe non-proliferative diabetic retinopathy
- Received: 24 February 2025
- Revised: 08 April 2025
- Accepted: 18 April 2025
- Published online: 28 April 2025
Abstract: To assess retinal structural changes following pars plana vitrectomy (PPV) and panretinal photocoagulation (PRP) in patients with severe non-proliferative diabetic retinopathy (sNPDR), this retrospective study used data from a previously randomized controlled trial of sNPDR patients, divided into PRP and PPV groups. Retinal structural changes were assessed using optical coherence tomography at baseline and at 1, 6, 9, 12, 18, and 24 months postoperatively. Longitudinal changes in parapapillary retinal nerve fiber layer (pRNFL) and macular ganglion cell-inner plexiform layer (mGCIPL) thickness were analyzed using a linear mixed-effects model. A total of 38 eyes (19 per group) were included. Participants had a mean age of 60.45 ± 8.80 years, with 18 of the 38 patients being female. Significant changes in average pRNFL thickness were observed at 1, 18, and 24 months post treatment compared to baseline (p = 0.0001, p = 0.002, and p = 0.003, respectively). Similar trends were found in quadrant directional pRNFL thickness, except temporal pRNFL thickness. No significant fixed effect of PPV on pRNFL or mGCIPL thickness was observed. Both PPV and PRP resulted in short-term thickening and long-term thinning of the pRNFL in sNPDR patients. In terms of retinal structure, PPV did not lead to greater retinal neurodegeneration than PRP.