


-
Glaucoma is the leading cause of irreversible blindness worldwide[1,2]. It is reported that over 66 million people are affected by glaucoma globally, with at least 6 to 8 million being completely blind in both eyes[3]. Among various types of glaucoma, primary open-angle glaucoma (POAG) is the most common, especially among people of European and African descent[4]. The underlying pathology of POAG involves the impaired function of aqueous humor (AH) drainage through the trabecular meshwork (TM). At present, the treatment of POAG mainly focuses on strategies to lower intraocular pressure (IOP), but the cure rate remains extremely low[5,6]. Therefore, there is an urgent need for further research into the pathogenesis of POAG and the development of new diagnostic and therapeutic approaches.
Since the first genome-wide association study (GWAS) on POAG was published in 2009, numerous studies have identified more than 100 new genetic variants associated with susceptibility to POAG[7,8]. Some of these variations have been confirmed to be associated with endophenotypes such as optic disc parameters and IOP[9]. The genetic loci associated with POAG are involved in a wide range of biological functions, such as cytokine signaling (CDKN2BAS, TGFBR2, FNDC3B), lipid metabolism (ABCA1, CAV1/CAV2, ARHGEF12), regulation of the extracellular matrix (AFAP1), and fucose/mannose metabolic pathways (GMDS, PMM2)[10]. Notably, certain pathways, such as those involving SHs, warrant further investigation.
POAG and steroid hormones (SHs)-induced secondary open-angle glaucoma share a predominantly TM-based pathophysiological mechanism that results in reduced conventional outflow facility and elevated IOP[11]. Glucocorticoids, which belong to the class of SHs, induce a 1,000 to 10,000 fold upregulation of myocilin in the TM[12]. Despite the complexity and significance of SHs in POAG, most of the current research focuses on exogenous SH-induced POAG[13]. POAG patients are also considered a glucocorticoid-sensitive population, suggesting that, compared to healthy individuals, POAG patients may inherently harbor genetic variants associated with heightened sensitivity to SHs[14]. This predisposition could contribute to dysregulated IOP homeostasis and disease progression, implicating shared molecular pathways between SH responsiveness, and POAG pathogenesis[15]. Further investigation into these genetic factors may elucidate novel therapeutic targets or risk stratification strategies[16]. At present, there is still a lack of research and understanding on the genes and pathways related to SH metabolism in the TM tissue of POAG. Understanding the abnormalities of SH-related genes and pathways in the TM tissue of POAG can further explain the pathogenesis of POAG, and the reason for its own abnormal metabolism of glucocorticoids.
In this study, differentially expressed genes (DEGs) associated with SHs were systematically identified by analyzing the GSE27276 dataset, and cross-referencing the results with genes retrieved from GeneCards that are linked to SH functions. Subsequently, using the random forest algorithm, six SHs-related genes derived from the POAG differential expression profile were screened. The AUC values indicate that these genes have excellent sensitivity and specificity in diagnosing POAG. Additionally, publicly available single-cell RNA sequencing (scRNA-seq) data from POAG non-human macaque (Macaca mulatta) samples were re-analyzed, which showed that HSPA8 and PTGDS were significantly overexpressed in the POAG group. To characterize their cellular distribution, the publicly available GSE231749 non-human macaque (Macaca mulatta) scRNA-seq dataset were re-analyzed, which contained TM-enriched outflow tissue from three glaucomatous, and three normal eyes, and performed Harmony-based batch correction followed by Seurat clustering. Using canonical markers from human outflow tissue studies, TM-associated subpopulations, including Beam A, Beam B, Beam C, and smooth muscle cell (SMC)-like Schlemm's canal (SC)/juxtacanalicular cells were annotated. HSPA8 and PTGDS were significantly upregulated in glaucomatous samples, and preferentially localized to these TM structural and contractile cell types. KEGG pathway analysis revealed that DEGs from intergroup comparisons in Beam A, Beam B, Beam C, and SMC clusters were significantly enriched in pathways including TGF-beta signaling, HIF-1 signaling, estrogen signaling, fluid shear stress, and atherosclerosis—pathways associated with SH metabolism disorders and the progression of POAG. These findings deepen our understanding of the complex disease mechanism of POAG and provide an important perspective for the development of more effective diagnostic methods and treatment approaches.
-
The whole-genome expression profile (GSE27276) was obtained from the NCBI GEO database (
www.ncbi.nlm.nih.gov/geo )[17]. This dataset included 17 POAG samples, and 19 control samples from TM tissues. The Limma package in R (version 4.0.2) was used to analyze the DEGs between the control group and the POAG group (p < 0.05, |log2FC| > 0.5). The p-values were corrected using the Wilcoxon rank-sum test procedure. SH-related genes were identified by searching the GeneCards database with the search term 'steroid hormone', relevance score > 5[18].Functional enrichment analysis
-
The R software package 'ClusterProfiler' (version 4.8.3) was utilized to perform Gene Ontology-Biological Process (GO_BP), and Kyoto Encyclopedia of Genes and Genomes (KEGG,
www.kegg.jp ) enrichment analyses on the overlapping genes. Pathways with a p-value less than 0.05 were considered statistically significant. Subsequently, Cytoscape (version 3.10.3) was utilized for the visualization of gene-GO-BP/KEGG associations. In this research, Gene Set Enrichment Analysis (GSEA) was performed utilizing the standard weighted enrichment statistics approach to explore possible effect pathways in POAG (|NES| > 1, p < 0.05).Random Forest algorithm for screening feature genes
-
In this study, the gene expression matrix of KEGG pathways and GO_BP items related to SHs were analyzed using the 'randomForest' R package (version 4.7-1.1). The MeanDecreaseGini metric—which quantifies the total reduction in Gini impurity attributable to a gene across all decision trees—was employed to evaluate gene importance. Parameters included ntree = 500 (number of trees), and mtry = sqrt(p) (number of randomly selected features per split, where p is the total feature count), with model robustness assessed via out-of-bag (OOB) error estimation. The final OOB error rate of the model was 2.7%, and the OOB error convergence curve showed that the error reached a stable plateau after approximately 23 trees, indicating effective training and the absence of overfitting. Based on this importance ranking, the top six hub genes most strongly associated with SHs were selected for further analysis[19]. To further validate the stability of this feature selection process, recursive feature elimination with 5 × 5 repeated cross-validation (RFECV) was performed using a random forest classifier as the estimator, and mean cross-validated accuracy was recorded for each feature subset size (2−14 features).
ROC curve analysis
-
In this study, the 'pROC' package (version 1.18.4) was used to analyze the ROC and AUC. The value of ROC and AUC represents the sensitivity and specificity of the top six genes identified in POAG tissues, compared to the control group.
Correlation analysis of genes and immune-infiltrating cells
-
This study evaluated the abundance of immune cell infiltration in the POAG group samples from the GSE27276 dataset using the ImmunoCellAI platform (
https://guolab.wchscu.cn/ImmuCellAI/#! )[20]. Following this, a Spearman correlation analysis was performed to examine the associations between the expression levels of SH-related genes (HSPA8, KRT14, KLF9, KRT19, PTGDS, ADM), and different types of immune cells.Single-cell RNA sequencing analysis
-
The GSE231749 single-cell dataset was downloaded from GEO, which included 15,809 cells from three glaucomatous, and three normal non-human macaques (Macaca mulatta)[21]. For batch correction using Harmony (version 1.2.1), the algorithm was applied to the top 2,000 highly variable genes following normalization and scaling, utilizing the first 15 principal components (PCs) that collectively explained > 85% of the variance, as determined by Seurat's Elbow Plot, and PC Heatmap. Key parameters included a diversity penalty theta = 2 to enhance batch integration, a regularization parameter lambda = 0.8 to preserve biological signal integrity, max.iter = 20 to ensure convergence, vars.use = 'Sample' to designate individual non-human macaques samples as the batch covariate, and nclust = 50 for initial anchor detection—parameter choices aligned with best practices established in the original Harmony study for robust single-cell data integration. For clustering in Seurat (version 5.1.0), a shared nearest-neighbor (SNN) graph was constructed based on Harmony-corrected embeddings from the 15 PCs, and the Louvain algorithm was applied with a resolution parameter of 0.5, selected after iterative evaluation across a range of values (0.2–1.0). This resolution was chosen to achieve optimal cluster granularity and biological interpretability, supported by a Silhouette score > 0.25, indicating strong intra-cluster cohesion and inter-cluster separation, as well as by marker gene expression exhibiting > 2-fold log-fold change, and adjusted p-value < 0.05 (Wilcoxon rank-sum test). Finally, the data using t-SNE was visualized and marker genes identified for each cell subpopulation. Marker genes for each cluster are listed in Supplementary Table S4.
Statistical analysis
-
All statistical analyses were conducted using R (version 4.3.2). A p-value less than 0.05 was regarded as statistically significant. To evaluate expression differences between two groups, the following methods were employed: the Student's t-test (for normally distributed data with equal variances), Welch's t-test (for normally distributed data with unequal variances), and the Wilcoxon rank-sum test (for non-normally distributed data, acting as a non-parametric option). Statistical significance is represented in figures by: * p < 0.05; ** p < 0.01; *** p < 0.001.
-
Research in genetics and genomics, such as GWAS, has greatly facilitated the discovery of genes linked to glaucoma[22]. To investigate the key genes implicated in POAG, an analysis of the GSE27276 dataset, which comprises 19 normal samples, and 17 POAG samples was conducted. As shown in Supplementary Table S1, no significant difference in age was observed between the control and POAG groups (t-test, p = 0.397 > 0.05), thereby minimizing potential confounding effects of age on gene expression differences. The dataset was normalized using the 'normalizeBetweenArrays' function from the R package to ensure standardization, with comprehensive probe and gene annotations completed (Fig. 1a). Following this, the 'limma' software package in R was utilized to conduct differential expression analysis, which revealed 603 significantly DEGs (up: 278, down: 325) (Fig. 1b, c).
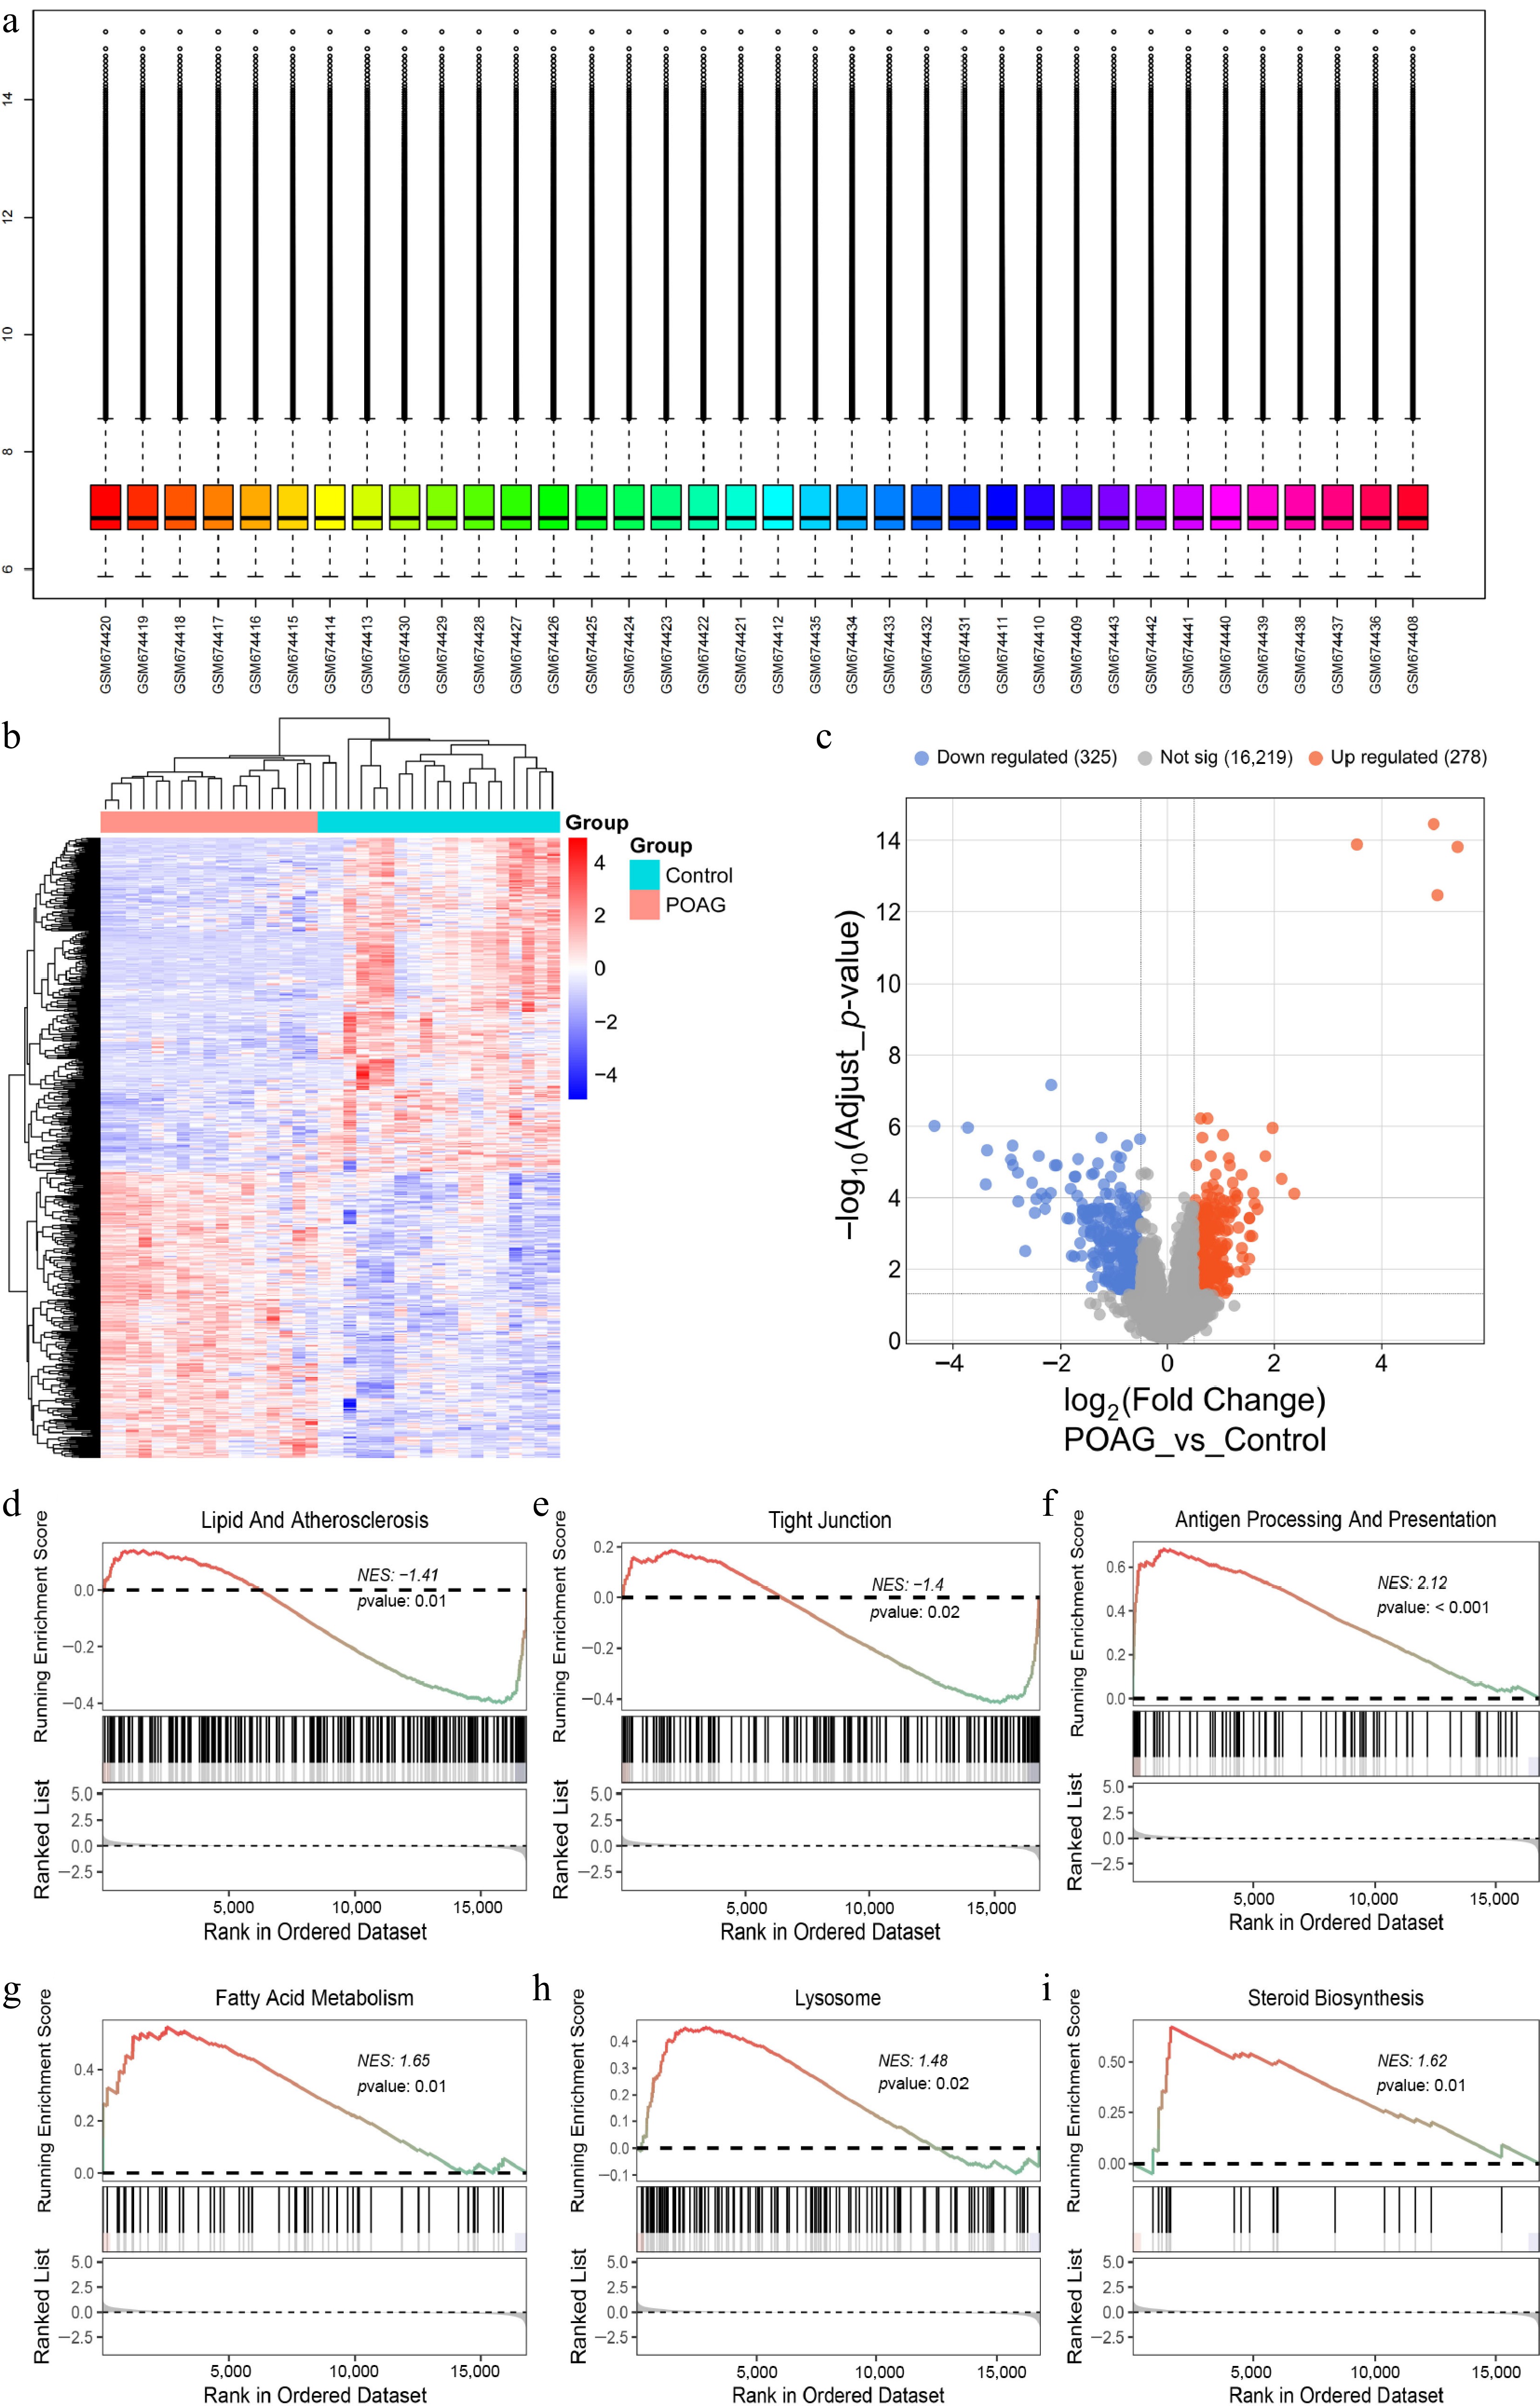
Figure 1.
Screening DEGs in POAG and GSEA analysis. (a) The GSE27276 dataset was normalized using the 'normalizeBetweenArrays' function in R. (b) Heatmap illustrates the 603 DEGs between the POAG group, and the control group (325 downregulated; 278 upregulated, |log2FC| > 0.5, p < 0.05). (c) Volcano plot illustrates the 603 DEGs by comparing the POAG group with the control group (325 downregulated; 278 upregulated, |log2FC| > 0.5, p < 0.05). GSEA of POAG-DEGs mapping to GO pathway, (d) Lipid and atherosclerosis, (e) tight junction, (f) antigen processing and presentation, (g) fatty acid metabolism, (h) lysosome, (i) steroid biosynthesis.
Furthermore, GSEA was employed to detect the key pathways involved in the development of POAG. The results indicate that, in comparison to normal tissues, POAG exhibits multiple significantly dysregulated pathways. These include the down-regulation of pathways such as lipid and atherosclerosis, tight junction, as well as the up-regulation of pathways including antigen processing and presentation, fatty acid metabolism, lysosome, particularly steroid biosynthesis (Fig. 1d−i).
Identification of SH-related DEGs in POAG
-
Evidence from previous studies has demonstrated that the levels of SHs in the plasma and AH of glaucoma patients are higher than those in the control group, suggesting that SHs may play an important role in POAG[23]. To identify SH-related DEGs in POAG, the GeneCards database was utilized, identifying 1,453 genes associated with SHs. The intersection of SH-regulated genes and DEGs from the GSE27276 dataset ultimately revealed 80 significantly differentially expressed genes (upregulated: 35; downregulated: 45) closely related to SHs (Fig. 2a, b).
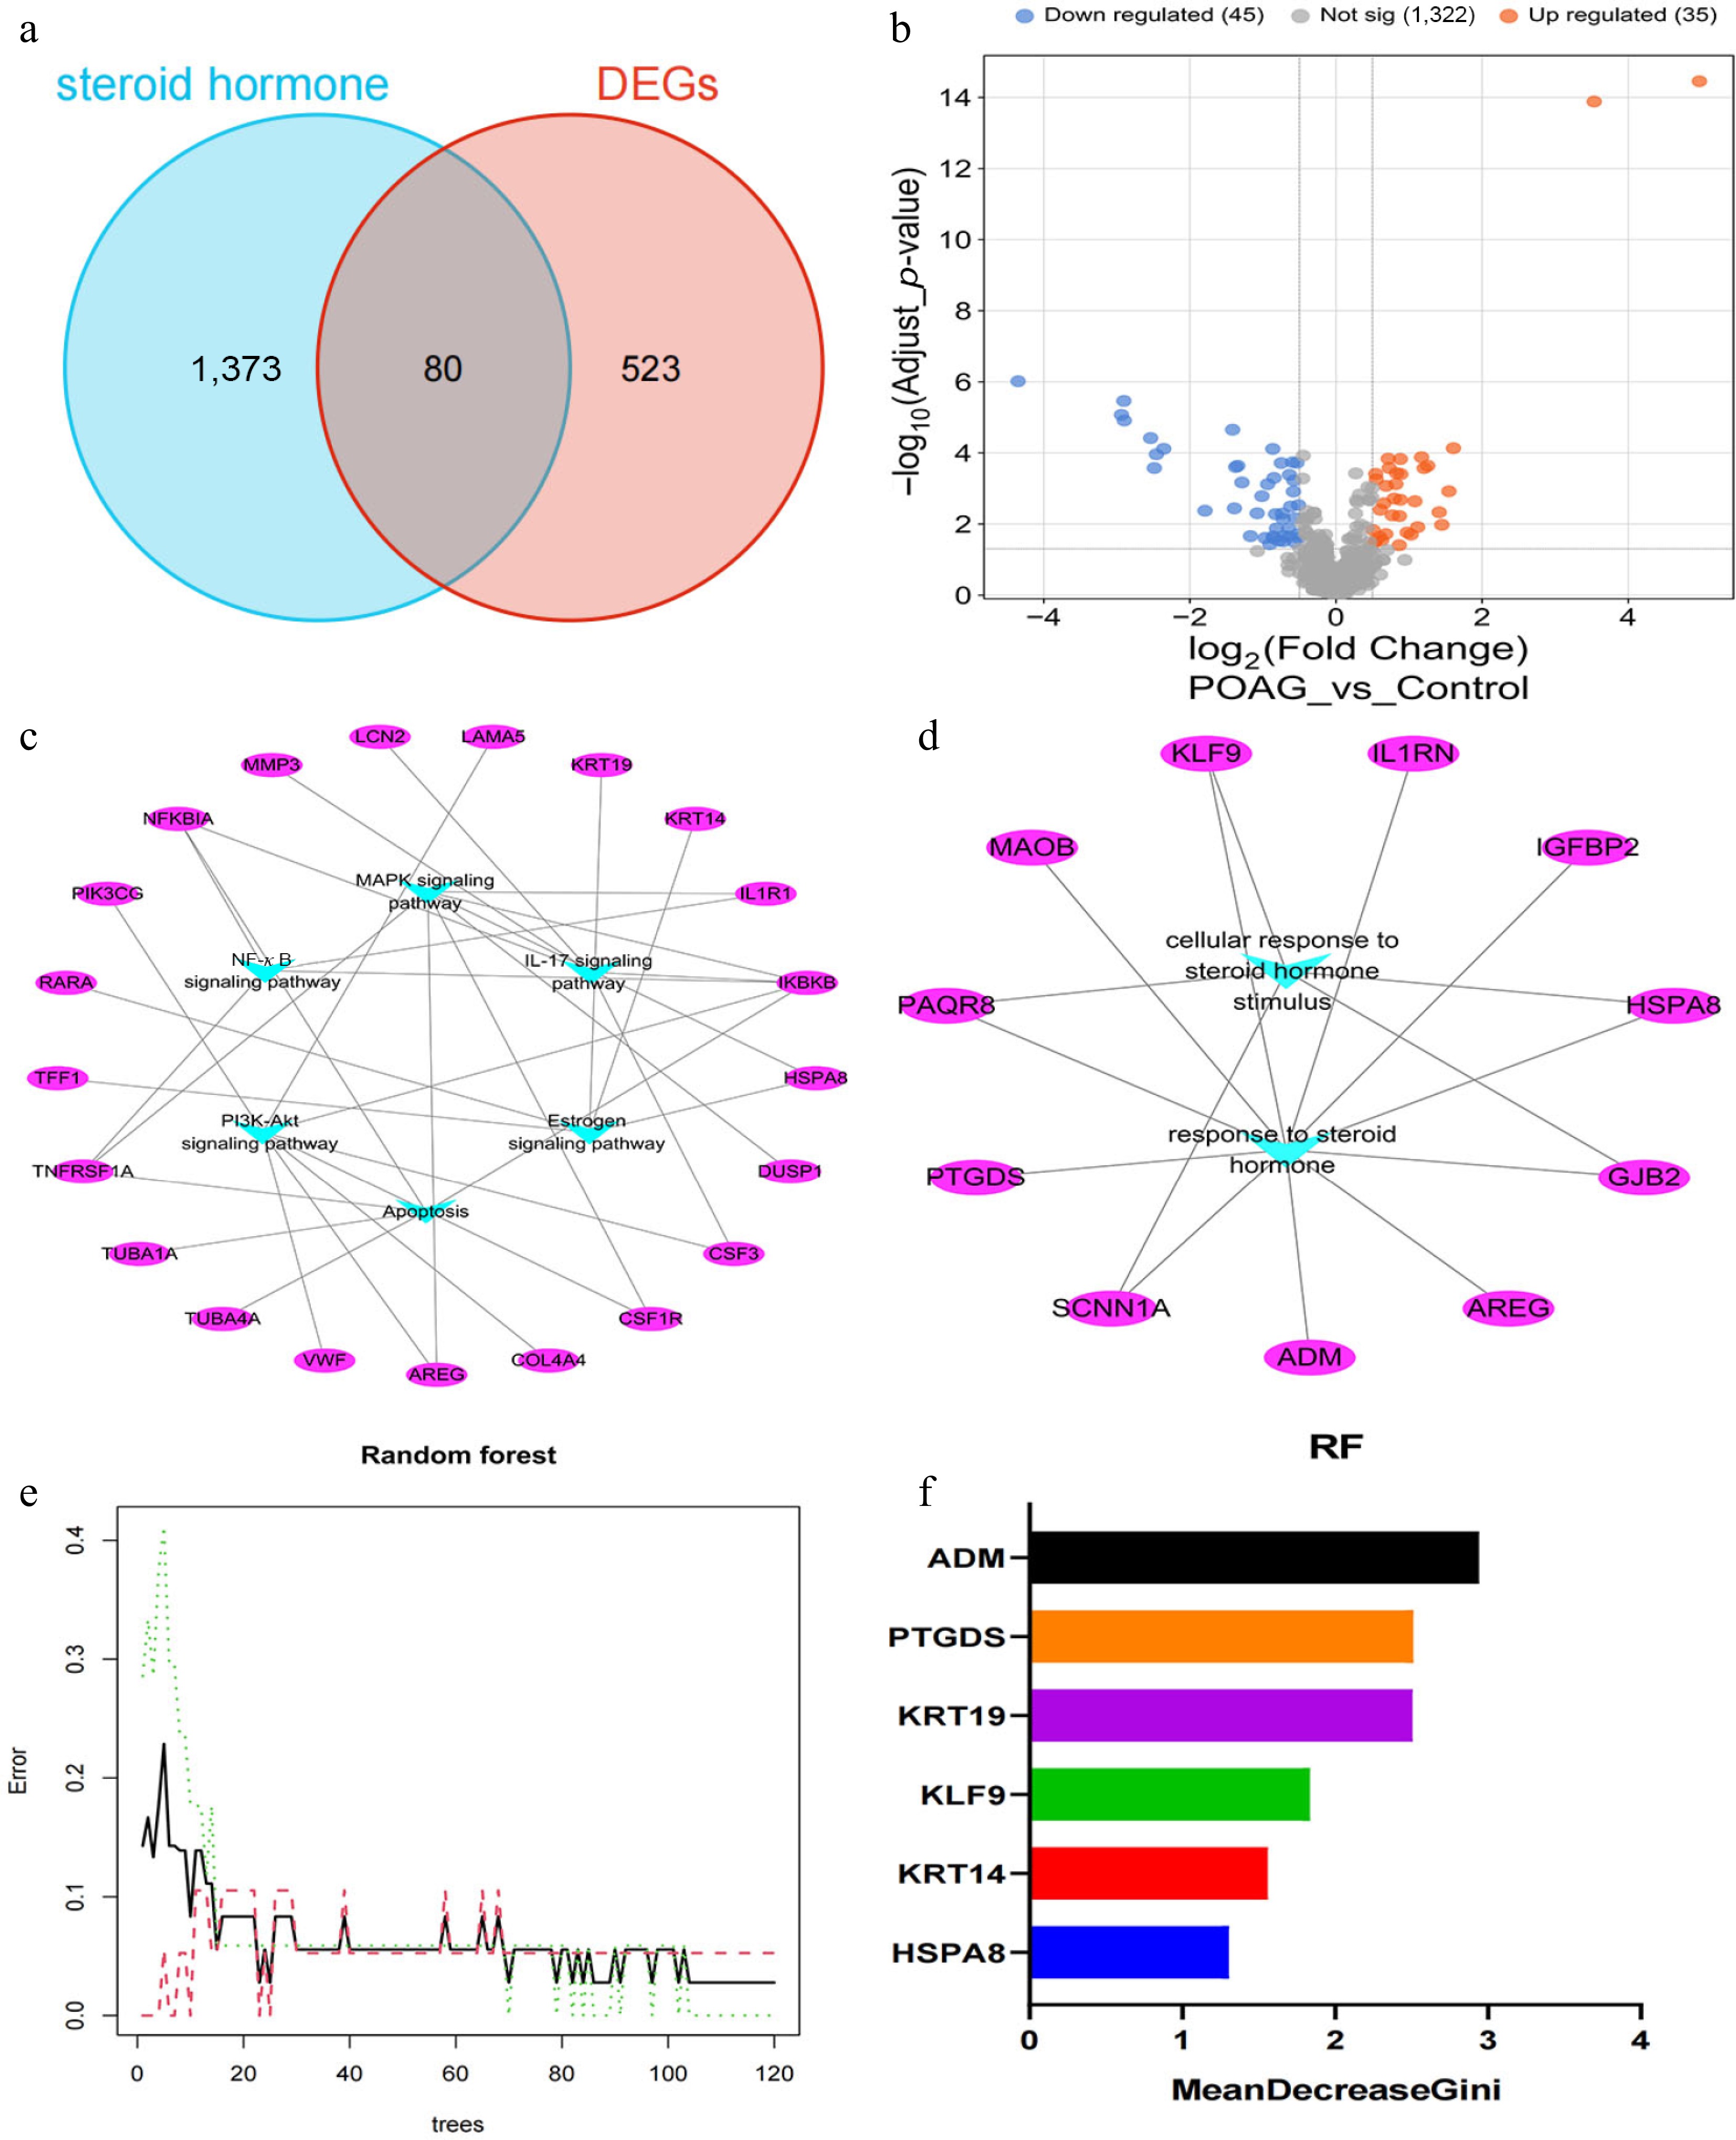
Figure 2.
Identification of SH-related DEGs in POAG. (a) Venn diagram illustrates the intersection of DEGs in POAG and SH-regulated genes. (b) Volcano plot illustrates the SH-related DEGs in POAG (45 downregulated; 35 upregulated). (c) KEGG pathway analysis exhibited that the top six enriched signaling pathways of 80 SH-related DEGs include MAPK, NF-κB, IL-17, PI3K-Akt, apoptosis, and estrogen signaling pathways, with the 21 key genes embedded within these pathways (Supplementary Table S2). (d) GO analysis demonstrated that IGFBP2, ADM, IL1RN, PAQR8, HSPA8, AREG, PTGDS, SCNN1A, GJB2, MAOB, and KLF9 were enriched in the category of response to SHs (Supplementary Table S3). (e) Error plot for random forest model as a function of the number of trees. The black line represents the out-of-bag error, the green dashed line represents the training error, and the red dashed line represents the test error. (f) The bar chart of the MeanDecreaseGini parameters of HSPA8, KRT14, KLF9, KRT19, PTGDS, and ADM.
Subsequently, KEGG pathway analysis of these SH-related genes indicated that they were predominantly enriched in pathways such as MAPK, NF-κB, IL-17, PI3K-Akt, apoptosis, and estrogen signaling (Fig. 2c, Supplementary Tables S2, S3). Furthermore, GO analysis demonstrated that gene modules associated with the response to SHs primarily consist of genes such as IGFBP2, ADM, IL1RN, PAQR8, HSPA8, AREG, PTGDS, SCNN1A, GJB2, MAOB, and KLF9 (Fig. 2d). Next, the gene expression matrix associated with SH-related KEGG pathways and GO_BP terms were extracted. Using the random forest algorithm, and screening based on the MeanDecreaseGini parameter, six top genes associated with SHs (HSPA8, KRT14, KLF9, KRT19, PTGDS, and ADM) were ultimately identified (Fig. 2e, f). To further evaluate the robustness of this feature selection, recursive feature elimination 5 × 5 RFECV was applied, based on a random forest classifier. The RFECV performance curve demonstrated that cross-validated classification accuracy gradually improved with the inclusion of additional features, and reached its highest value when 14 features were retained (Supplementary Fig. S1a). Notably, all six hub genes identified in this study were contained within this larger stable feature subset, indicating that they represent a concise and biologically important role within the broader SH-related gene (Supplementary Fig. S1b). In addition, the low final OOB error rate and its convergence after approximately 23 trees further confirmed stable model training without overfitting (Supplementary Fig. S2).
ROC and pathway analysis in SH-related hub genes
-
Upon identifying six SH-related DEGs in POAG, a comprehensive analysis was conducted to evaluate their expression differences between normal and POAG tissues. The results demonstrated that, in the POAG group, there was a significant decrease in the expression levels of KRT14, KLF9, KRT19, and ADM, while the expression levels of HSPA8 and PTGDS showed a notable increase (Fig. 3a). To evaluate the diagnostic performance and quantify the predictive accuracy, ROC curve analysis was conducted using 'pROC', and the AUC was calculated. The AUC values for PTGDS, HSPA8, KRT14, KLF9, KRT19, and ADM were 0.963, 0.901, 0.920, 0.839, 0.950, and 0.950, respectively, indicating that these genes possess high sensitivity and specificity for the diagnosis of POAG (Fig. 3b). Subsequent GSEA of six SH-related genes revealed enrichment in several key signaling pathways, including cGMP-PKG, ribosome biogenesis, TGF-beta signaling, Wnt/CTNNB1 signaling, and immune-related pathways (Supplementary Fig. S3a, S3b).
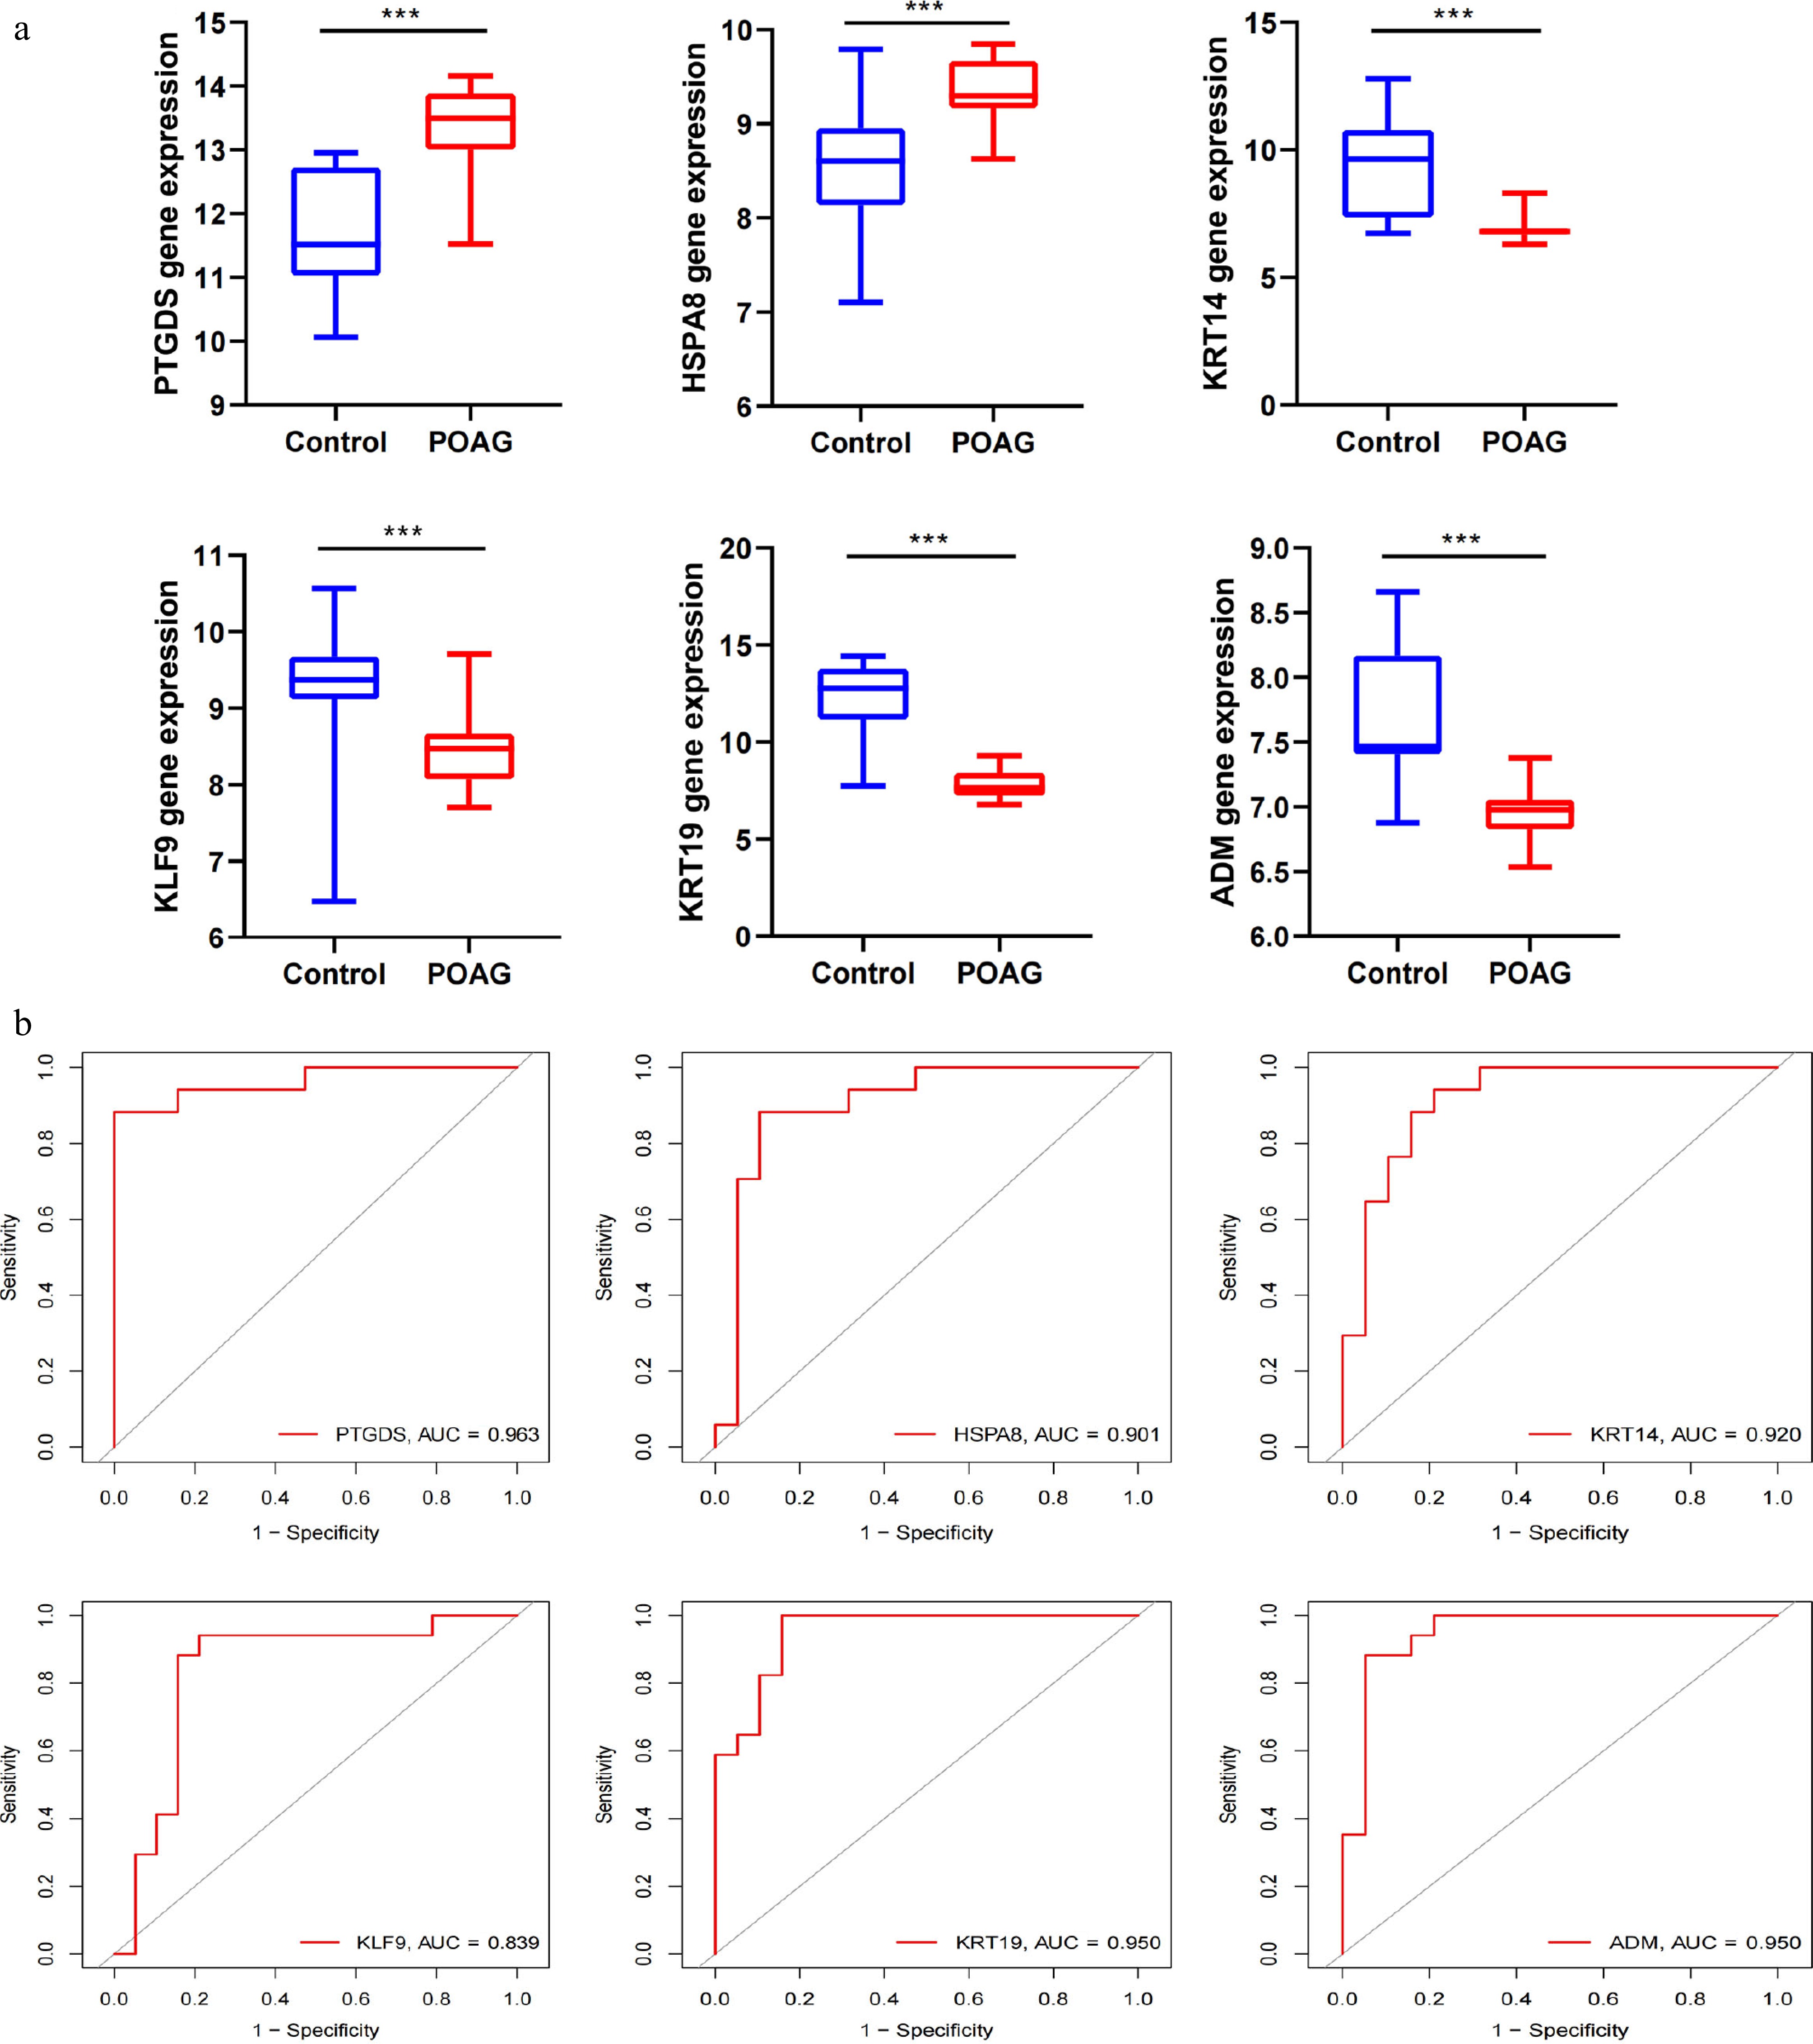
Figure 3.
ROC and pathway analysis in SH-related Hub Genes. (a) Relative expression of PTGDS, HSPA8, KRT14, KLF9, KRT19, and ADM in POAG and control samples in GSE27276 dataset. All p-values are less than 0.001. (b) ROC curve analysis was performed using the R package 'pROC' to estimate the sensitivity and specificity of the identified genes for the diagnosis of POAG (PTGDS: 0.963; HSPA8: 0.901; KTR14: 0.920; KLF9: 0.839; KTR19: 0.950; ADM: 0.950).
Emerging evidence suggests that glaucoma may be classified as an immune-related disorder[24]. Based on this premise, a comprehensive analysis of the correlations between the expression levels of HSPA8, KRT14, KLF9, KRT19, PTGDS, ADM, and various immune cell populations were conducted. The findings indicate that the expression of the KRT19 and KRT14 genes is negatively correlated with macrophage infiltration abundance (p < 0.05). In addition, the expression of HSPA8 was positively correlated with the abundance of monocyte and macrophage infiltration (p < 0.05), KRT19 was positively correlated with neutrophil-macrophage infiltration (p < 0.05), and KRT14 was positively correlated with the infiltration of naive CD4 T cells (p < 0.05); KLF9 was positively correlated with the infiltration of adaptive regulatory T cells and naive CD4 T cells (p < 0.05), but negatively correlated with the abundance of naive CD8 T cell infiltration (p < 0.05) (Supplementary Fig. S3c).
ScRNA-seq identifies key genes related to SH in POAG
-
To further explore the cell types, related genes, and pathways involved in POAG, the scRNA-seq dataset GSE231749 was analyzed, which contained three POAG non-human macaque (Macaca mulatta) samples, and three control samples. After data preprocessing, 10,280 cells with expression detected for 15,809 genes in the POAG group, and 6,595 cells with expression detected for 14,809 genes in the control group were identified. Subsequently, using the FindAllMarkers, nine cell clusters were successfully identified (Fig. 4a−c).
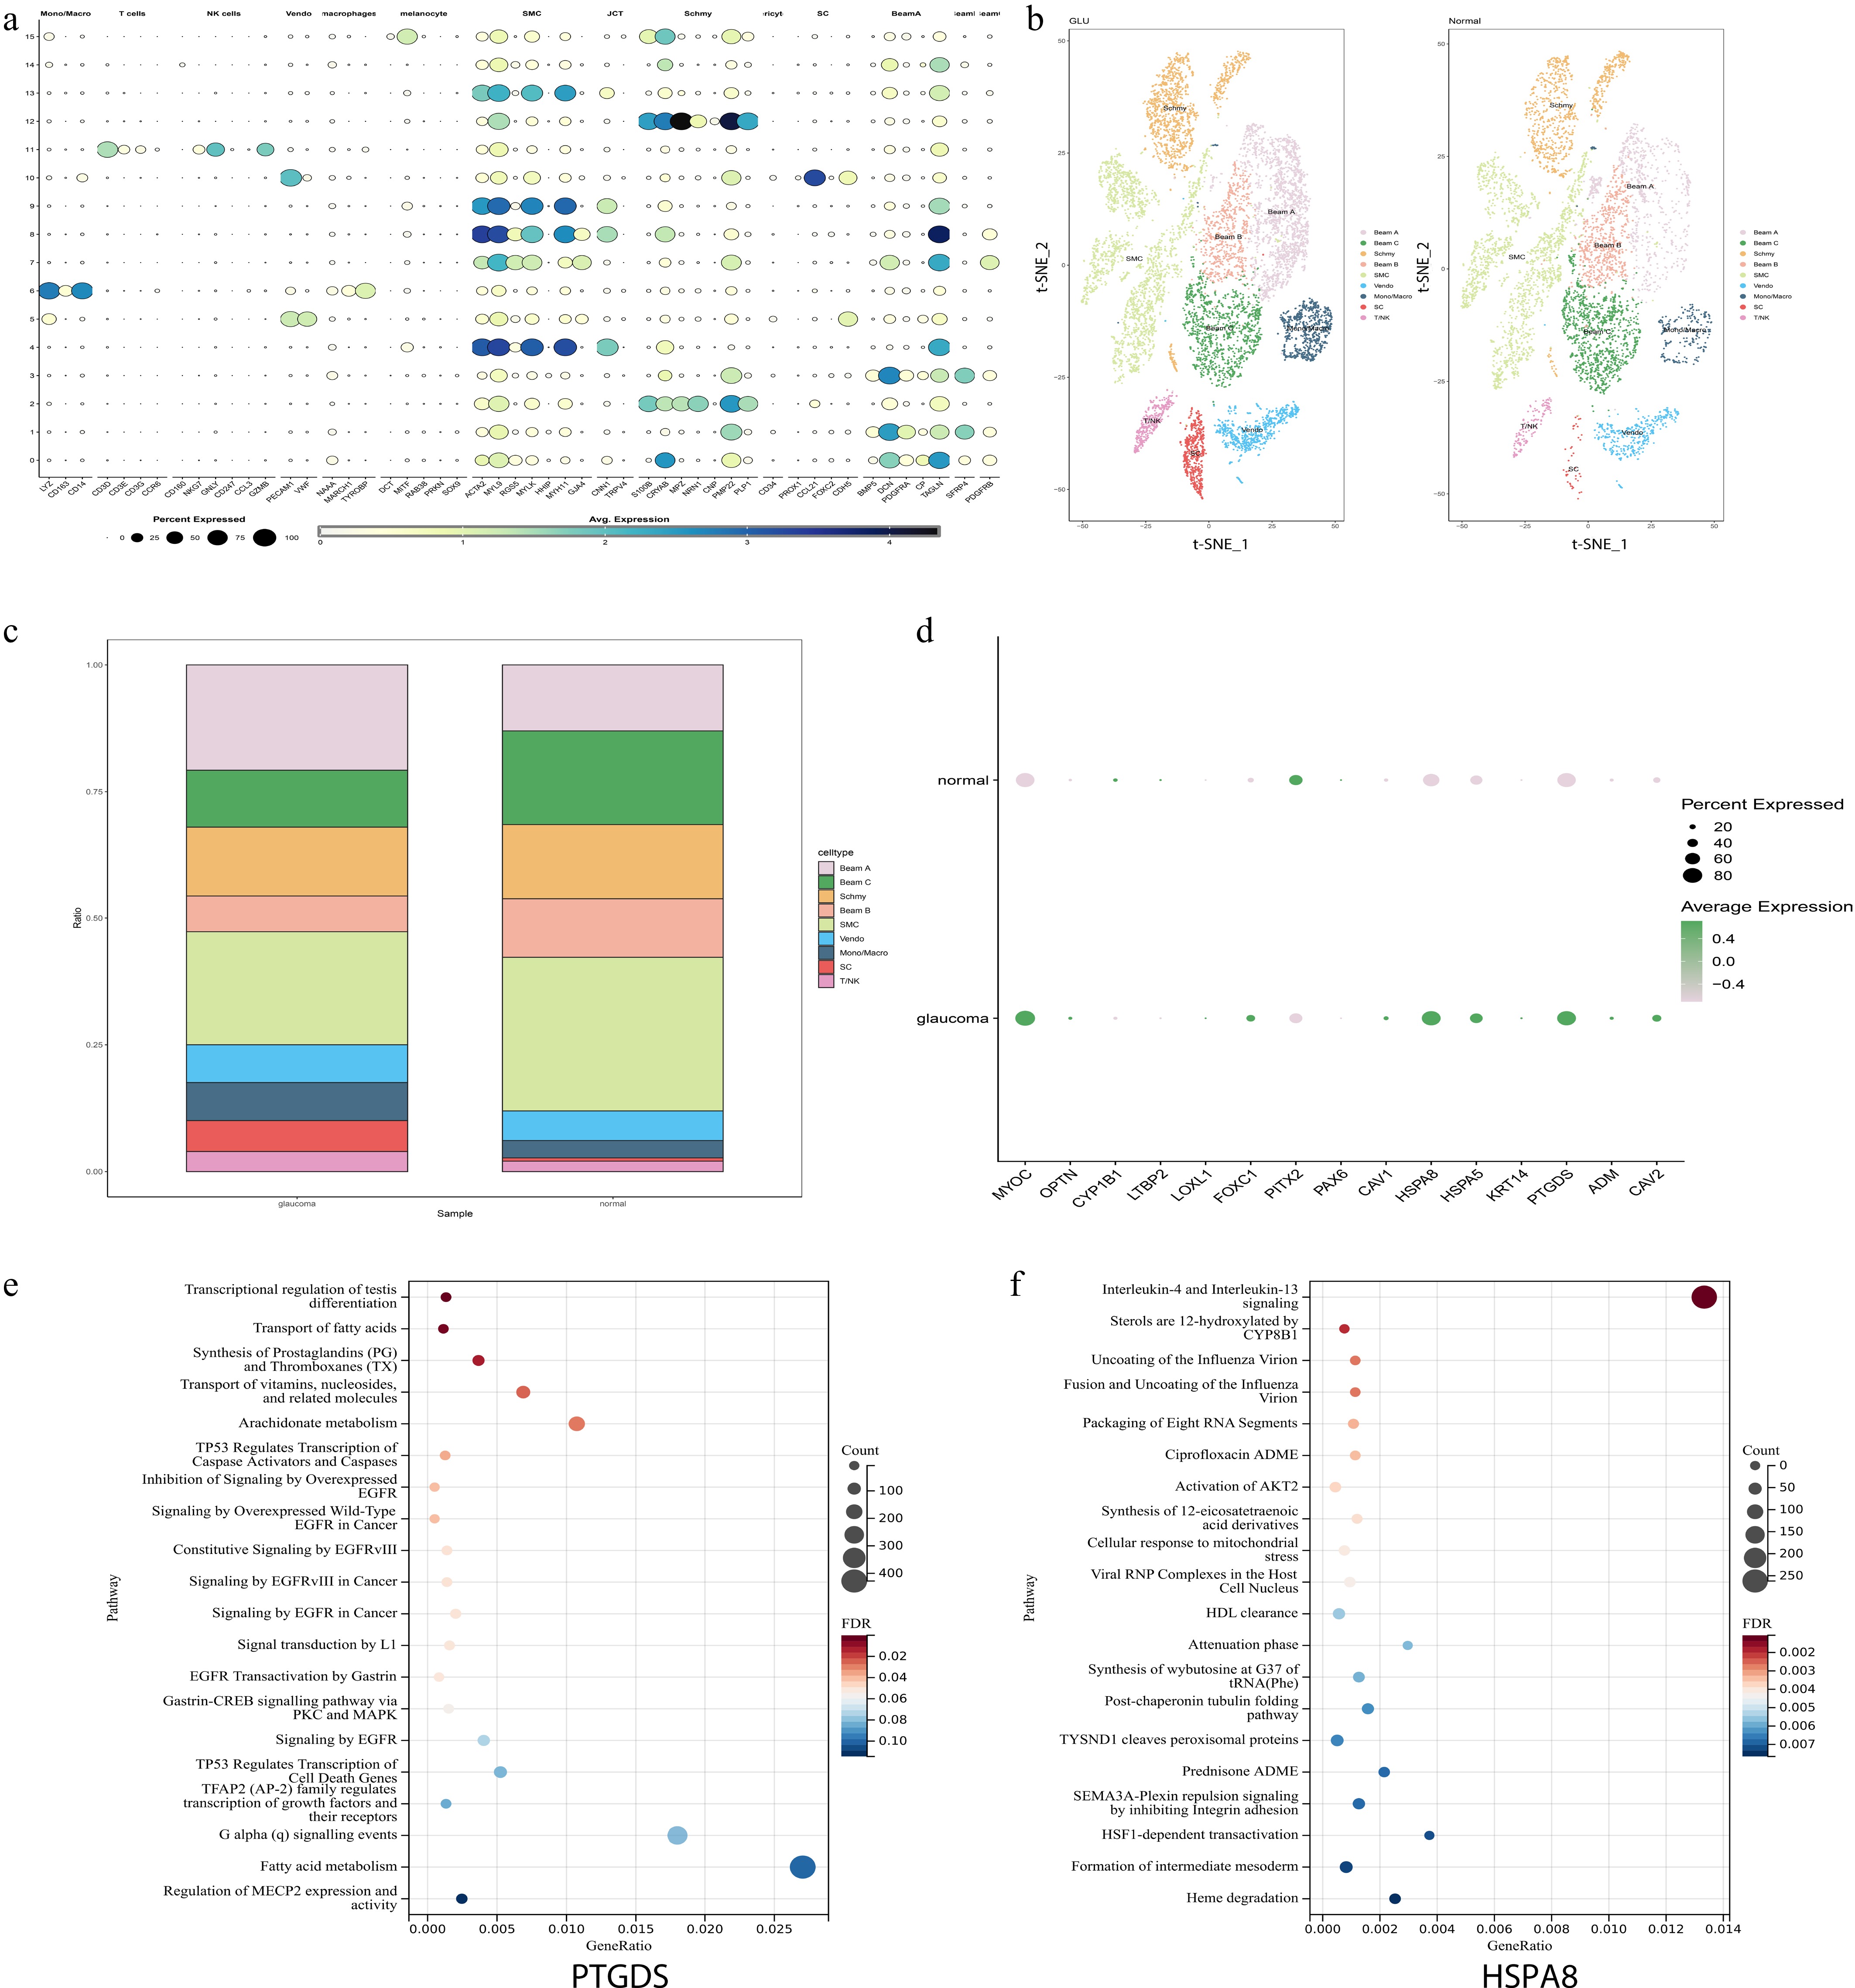
Figure 4.
scRNA-seq identifies key genes related to SH in POAG. (a) The dot plot shows the expression levels of marker genes across each cell types in scRNA-seq analysis. (b) t-SNE visualization of the nine major cell types identified from POAG and normal samples, with clusters color-coded according to their associated cell types. (c) Proportions of different cell types in POAG and normal samples. (d) Dot plot illustrates the expression levels of SH-related genes in both the POAG group and the normal control group. The expressions of the HSPA8 and PTGDS genes were significantly increased in the POAG group. (e), (f) The GSEA enrichment analysis results of PTGDS and HSPA8 are presented. The x-axis represents the gene ratio (proportion of genes in a pathway that are differentially expressed), the y-axis lists the pathways, the bubble size corresponds to the count of genes in the pathway, and the color gradient indicates the false discovery rate (FDR) value (red for lower FDR, blue for higher FDR).
To validate the annotation of TM-related clusters (Beam A−C and SMC), the marker genes in Supplementary Table S4 were systematically compared with cell-type signatures reported in published single-cell atlases of TM and AH outflow tissues in human and non-human primates[25,26]. In the atlas, TM and juxtacanalicular tissue (JCT) stromal cells are characterized by expression of ECM-associated genes such as DCN and growth factor-related genes, which align with the markers enriched in our Beam A cluster. Beam C was identified by enriched expression of PDGFRB, a canonical perivascular/mural cells marker that has been reported in stromal and perivascular tissue adjacent to the TM in primate outflow tissues. The SMC cluster exhibits hallmark smooth-muscle and perivascular genes such as ACAT2, MYH11, MYL9, and RGS5, which closely match the canal-associated mural cell populations described in the primate single-cell atlas.
To explore the pathogenesis of SH metabolism disorder in POAG, the gene expression profiles related to SH metabolism in the POAG group and the control group were further compared. In this analysis, the specific focus was on genes that were significantly linked to SH metabolism as identified in our prior analysis. Notably, it was noticed that the expression levels of genes related to SH metabolism (HSPA8: heat shock cognate protein 70; PTGDS: prostaglandin D synthase) were significantly upregulated in the POAG group. Additionally, it was found that HSPA8 and PTGDS were predominantly expressed in Beam cells (Fig. 4d, Supplementary Fig. S4). The GSEA enrichment analysis of these two genes indicated their involvement in SH signaling pathways, and other pathways that are crucial to the pathogenesis of POAG (Fig. 4e, f).
KEGG enrichment analysis of Beams and SMC clusters in POAG scRNA-seq data
-
In relation to the cell-type enrichment observed in scRNA-seq analyses, these results emphasize possible areas for additional research, focusing on the cell types that could be involved in the development of eye diseases, and the future prospective therapeutic approaches[27]. Notably, the strongest enrichment from previous glaucoma GWAS was detected in juxtacanalicular (cribriform) and Beam A cells within the TM; these are all likely to be crucial in regulating AH outflow[28].
Since the POAG group and the normal group have been divided into nine clusters through single-cell analysis, the Beam cells and SMCs, which possess fibroblast characteristics and exert contractile features among these clusters, have become the focus of subsequent enrichment analysis. As shown in Fig. 4c, the proportion of Beam A cells increased in the POAG group, while the proportion of Beam B, Beam C, and SMC cells decreased. Through KEGG analysis, we found that in the Beam A, Beam B, Beam C, and SMC cell clusters, DEGs were significantly enriched in pathways such as TGF-beta signaling, HIF-1 signaling, estrogen signaling, fluid shear stress, and atherosclerosis. These pathways are closely associated with SH metabolism disorders, and the progression of POAG (Fig. 5a−d).
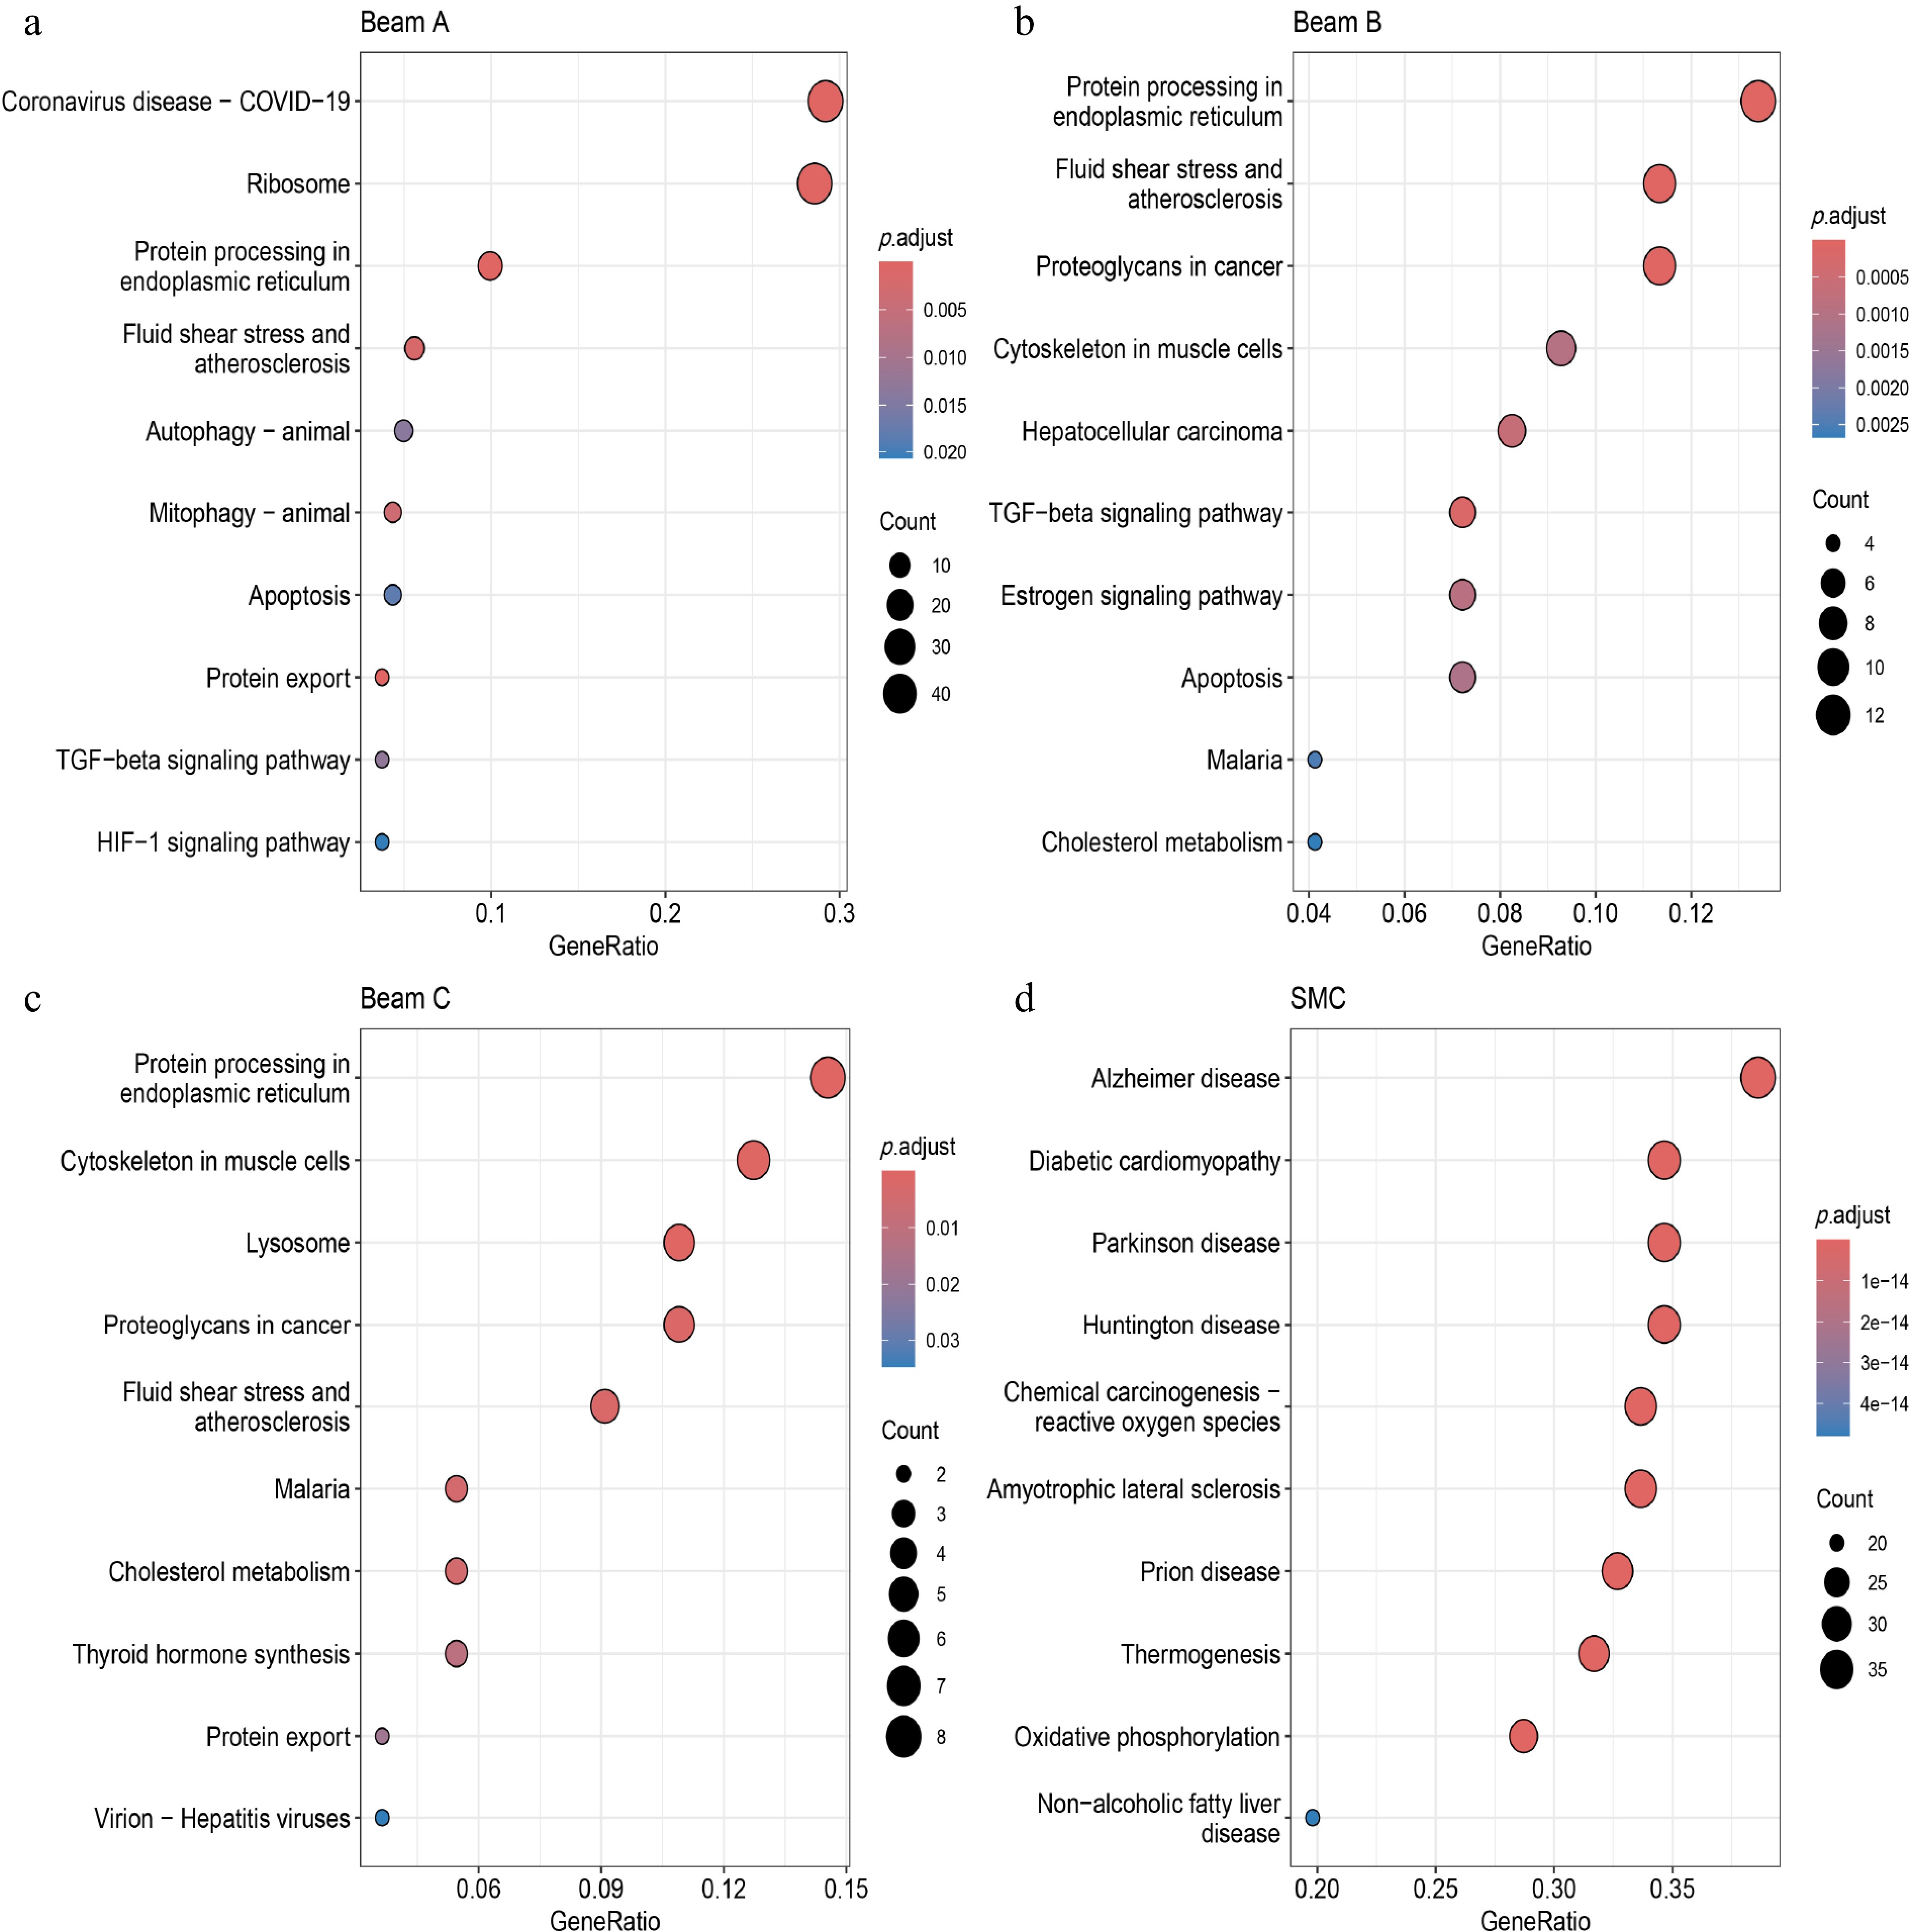
Figure 5.
KEGG enrichment analysis of Beams and SMC clusters in POAG scRNA-seq data. (a)−(d) KEGG enrichment analysis of DEGs in Beams and SMC clusters derived from POAG scRNA-seq data. The x-axis denotes the GeneRatio (proportion of genes in a pathway that are differentially expressed), the y-axis lists the pathways. Bubble size corresponds to the count of genes in the pathway, and the color gradient represents the adjusted p-value (p.adjust), with red indicating lower adjusted p-values, and blue indicating higher adjusted p-values.
-
A growing body of evidence indicates that genetic modifications are closely linked to different forms of glaucoma, such as POAG, congenital glaucoma, developmental glaucoma, and familial normal-tension glaucoma[29]. Multiple genes have been identified as being dysregulated in the TM cells of POAG patients[30]. In genetically susceptible individuals, exposure to SHs can induce a clinical condition similar to POAG. The exact mechanisms underlying SH-induced POAG remain elusive[14]. However, different to the hypothesis of simple Mendelian inheritance, SH-induced glaucoma appears to arise from complex interactions among multiple genetic loci and environmental factors[31].
In this study, a total of 603 DEGs derived from the GSE27276 dataset were intersected with SH-related genes. Subsequently, the random forest algorithm was employed for analysis, and six hub genes (HSPA8, KRT14, KLF9, KRT19, PTGDS, and ADM) were identified through systematic screening. The gene ADM is located at chromosome 11p15.4, overlapping the POAG GWAS locus rs11029955 near TMCO1, and its downregulation in POAG TM affects IOP through calcium signaling and ECM remodeling[32]. PTGDS modulates prostaglandin metabolism, functionally linking to IOP regulation via the ABO GWAS locus (rs687289), with prostaglandin analogs like latanoprost being first-line treatments for POAG[33,34]. HSPA8 interacts with MYOC-related POAG pathogenesis by aiding glucocorticoid receptor (GR) folding[35]. KLF9 influences glucocorticoid responses and TGF-β signaling, pathways that may associate with POAG GWAS loci[36]. KRT14/KRT19 regulate cytoskeletal dynamics in TM, aligning with CAV1/CAV2 GWAS loci involved in cell adhesion and ECM pathways[37]. Further investigation was conducted to assess the potential of these six hub genes as biomarkers for the clinical diagnosis and treatment of POAG. The results indicated that all six genes exhibited significant expression differences in POAG samples, accompanied by excellent AUC values.
A prior investigation revealed significant differences in cell numbers within the AH drainage system across humans and different species. These variations involve a range of cell types that are strongly linked to the development and advancement of POAG[26,38]. Considering that glaucoma stems from the TM network and that the percentage of TM cells displays significant alterations between normal and POAG populations, our study investigates SH-related genes and functional clusters implicated in POAG[39,40]. To support the relevance of the non-human macaque (Macaca mulatta) scRNA-seq analysis, macaque TM-related clusters were compared with transcriptional programs reported in the published human TM single-cell atlas[41]. In this atlas, the TM fibroblast, and JCT cluster shows enrichment of DCN and PDGFRA, which closely matches the DCN and PDGFRA profile of the Beam A cluster. In addition, Patel et al. identified MYH11-positive smooth muscle cells in human outflow tissue[41], which aligns with MYH-expressing SMC cluster in the present dataset. These shared marker profiles indicate that the TM-related cell populations identified in our non-human macaque (Macaca mulatta) dataset exhibit conserved transcriptional features relative to human TM cell types, supporting the biological validity of the present annotations, and the cross-species relevance of the present findings.
Building on these validated TM-related cluster assignment, how SH-related genes are distributed across these cell populations were next evaluated. Through scRNA-seq analysis, key genes (HSPA8 and PTGDS) associated with SH in POAG were identified. Both genes were significantly upregulated in the POAG group. Additionally, enrichment analysis indicated that HSPA8, PTGDS, and DEGs in Beam A, Beam B, Beam C, and SMC clusters were involved in pathways linked to SH metabolism disorders, and the pathogenesis of POAG. Together, these cross-specific transcriptomic correspondences establish a reliable cellular framework for interpreting SH-related gene dysregulation within the TM, thereby providing the necessary context for evaluating how specific genes such as HSPA8 and PTGDS contribute to POAG pathogenesis.
HSPA8, also known as HSC70, functioning as a molecular chaperone, plays an essential role in the folding, stabilization, and activation of the GR[42]. Variability in the IOP response to glucocorticoids exists among individuals, and abnormal expression or function of HSPA8 may disrupt the glucocorticoid signaling pathway[43]. Research indicates that individuals highly sensitive to glucocorticoids are more susceptible to elevated IOP. Long-term glucocorticoid use can continuously activate the GR, leading to ECM deposition in TM cells, increased outflow resistance of AH, and ultimately resulting in glucocorticoid-induced glaucoma[44]. In line with this, our single gene GSEA for HSPA8 showed positive enrichment related to ribosome, oxidative phosphorylation, spliceosome, and allograft rejection, and negative enrichment in sensory-transduction pathways (Supplementary Fig. S3). These changes suggest increased protein synthesis and mitochondrial activity in samples with elevated HSPA8 expression, and are compatible with increased chaperone demand during putative GR-dependent transcriptional responses. This interpretation is supported by mechanistic studies showing that Hsc70/Hsp70, together with Hsp90, form the core chaperone machinery required for GR folding and activation[45]. Moreover, glucocorticoids have been shown to induce ECM accumulation and cytoskeletal reorganization[46−48], processes that are mediated in part through activation of TGF-β signaling, leading to increased synthesis of ECM components. Based on these findings, we hypothesize that elevated HSPA8 may amplify GR signaling, enhance TGF-β-associated ECM deposition, and increase TM cell stiffness that impairs AH outflow and contributes to IOP elevation in POAG.
PTGDS serves as a critical enzyme catalyzing the synthesis of prostaglandin D2 (PGD2), predominantly expressed in the kidneys, hypothalamus, central nervous system, and reproductive organs[49]. The present single gene GSEA for PTGDS showed positive enrichment in ribosome and mineral absorption pathways, and negative enrichment in pathways related to focal adhesion, phosphatidylinositol (PI) signaling, calcium signaling, cGMP-PKG signaling, and cardiac muscle contraction (Supplementary Fig. S3). Importantly, several mechanotransduction-related pathways, such as focal adhesion dynamics, Ca2+-dependent signaling, and muscle contractility have been shown to regulate cytoskeleton tension and cell-matrix interactions in TM and SC cells[50−52]. Because PGD2 can modulate smooth muscle and stromal cell tone in other tissues[53], a similar mechanism may influence the outflow regulation. Elevated PGD2 may alter TM and SC cytoskeletal contractility through Ca2+ flux and reduced focal adhesion stability, thereby modifying cell stiffness and junctional resistance, ultimately affecting outflow facility. Consistent with the model, PGD2 has been shown to influence vascular tone and inflammatory responses, supporting its potential role in TM or SC functional modulation in POAG[54,55]. Furthermore, pharmacologic inhibition of PTGDS with AT-56 (7–10 μM) reduces oxidative stress in TM cells, and may attenuate ECM deposition and IOP elevation, with topical AT-56 formulations (e.g., eye drops) currently under investigation as a potential glaucoma therapy[56].
We propose analyzing AH and TM tissue samples for HSPA8 and PTGDS detection using ultrasensitive platforms like Simoa (Single Molecule Array), which has demonstrated exceptional sensitivity in quantifying neuroinflammatory biomarkers (e.g., NfL, p-tau181) in AH, enabling robust correlations with pathological processes in ocular diseases and offering a feasible diagnostic approach for POAG stratification. From a therapeutic perspective, modulation of the HSPA8-mediated signaling pathway could involve the use of HSPA8 inhibitors such as VER-155008 or pifithrin-μ, which target the nucleotide- and substrate-binding domains of HSPA8 to promote cell death pathways[57]. This approach has demonstrated efficacy in reversing chemoresistance in cancer models and may be repurposed to regulate TM cell survival in POAG.
The present multi-level enrichment analysis identifies SH dysregulation as a primary regulatory factor in POAG pathogenesis, strongly associated with convergent pathway alterations. Enrichment analysis of DEGs from RNA-seq revealed systemic dysregulation in the lipid/atherosclerosis pathway (blood-aqueous barrier damage), and the lysosome/antigen presentation pathway, with SH biosynthesis being the most severely dysregulated node. SH-focused KEGG/GO analysis further clarified the inflammatory microenvironment remodeling axis: the MAPK/NF-κB/IL-17 pathway triggers TM inflammation, while PI3K-Akt/apoptosis dysregulation and estrogen signaling directly link SH fluctuations to AH outflow resistance. In addition, the spatial resolution of scRNA-seq localized SH disruption to Beam cells, where HSPA8 and PTGDS were upregulated, accompanied by Beam A cell expansion, and SMC cell loss. These cellular changes are associated with microenvironment-specific pathway enrichment: Beam A cells drive TGF-β-mediated fibrosis and HIF-1-induced hypoxia, while the reduction of SMC cells impairs fluid shear stress sensing—collectively exacerbating AH drainage obstruction. Specifically, TGF-β activation in Beam A cells enhances ECM deposition (e.g., collagen, fibronectin) via Smad-dependent mechanisms, thereby increasing AH outflow resistance[58]. Concurrently, dysregulated PI3K-Akt signaling in SMCs exacerbates oxidative stress (e.g., elevated 12,13-DiHOME/KODEs), accelerating TM cell senescence and diminishing contractile function[59]. Additionally, HIF-1α upregulation amplifies the secretion of pro-inflammatory mediators (e.g., VEGF, ET-1), perpetuating retinal ganglion cell (RGC) injury within hypoxic niches[60]. Therapeutically, these insights support novel interventions, including TGF-β inhibitors (e.g., neutralizing antibodies) to mitigate ECM accumulation in Beam A cells, metabolic modulators (e.g., PFKFB3 antagonists) to restore glycolytic homeostasis in stressed TM cells, and senolytic agents (e.g., BCL-xL inhibitors) to eliminate p16INK4A-positive senescent cells, and improve AH outflow[61−63]. Together, these findings bridge molecular pathogenesis with clinical translation, underscoring the value of scRNA-seq in identifying cell-type-specific therapeutic vulnerabilities in POAG.
Currently, the management of POAG primarily involves IOP-lowering pharmacotherapies and minimally invasive surgical interventions such as SC incision and TM shunt implantation, which preserve ocular tissue integrity by avoiding resection[6]. However, these approaches constrain the accessibility of viable TM specimens for research purposes. Although non-human primate models and induced pluripotent stem cell-derived RGC systems offer important mechanistic insights, they fail to fully recapitulate the complex pathophysiological environment of human TM and RGCs, particularly with respect to immune-microglial interactions and the chronic disease milieu. Future investigations should focus on refining single-nucleus RNA sequencing (snRNA-seq) techniques for use in archived postmortem tissues and integrating spatial transcriptomic approaches to enable in situ mapping of POAG-specific molecular alterations.
In summary, the identification of SH-related gene modules in POAG was conducted through dual-omics analysis (genome-wide mRNA microarray GSE27276 and scRNA-seq dataset GSE231749). The results offer fresh perspectives on the fundamental molecular processes associated with POAG, which might pave the way for groundbreaking gene-focused treatments. Additional research into the mechanisms of SH-related POAG, genetic factors, and their potential interactions could deepen our comprehension of this vision-endangering condition, thus promoting advancements in both its medical and surgical treatment approaches.
-
This study has several limitations. All findings were derived exclusively from in silico analyses of publicly available bulk RNA-seq and single-cell RNA-seq datasets, and no independent experimental or clinical validation was performed. Therefore, the diagnostic and prognostic value of the identified hub genes requires further confirmation in real-world POAG samples. In particular, analyses of AH and TM tissues are needed to determine whether HSPA8 and PTGDS can distinguish SH-induced secondary open-angle glaucoma from POAG, and to evaluate their association with disease severity or progression.
In addition, the sample sizes of both the bulk TM dataset and the non-human macaque (Macaca mulatta) scRNA-seq dataset were limited, which may affect statistical power. The single-cell analyses were derived from a non-human macaque (Macaca mulatta) model, and although transcriptional profiles were compared with published human TM atlases, cross-species differences may still influence translational relevance. Furthermore, hub gene identification using a random forest approach relied on internal validation combining OOB error estimation and recursive feature elimination with cross-validation. While these methods support feature stability, external validation in independent datasets is required to further reduce potential dataset-specific bias. Finally, as this study is observational, functional experiments are required to determine whether altered HSPA8 and PTGDS expression directly contributes to TM dysfunction or impaired AH outflow.
-
This study used only publicly available, de-identified transcriptomic datasets (GSE27276 and GSE231749), obtained from NCBI Gene Expression Omnibus (GEO). No new human participants, personal genetic information, or animal experiments were involved. All data used in this article were previously generated and accessible in the public domain, institutional ethics approval, and informed consent are therefore not applicable.
-
The authors confirm their contributions to the paper as follows: conceptualization: Deng S, Wen Y, Zhu Y, Zhao J; data curation: Deng S, Zhao J; formal analysis: Deng S, Wen Y, Dai D; funding acquisition, project administration and resources: Deng S, Zhu Y, Zhao J; investigation: Zhao J; methodology: Deng S, Cui Y, Hou Z, Dai D, Zhao J; software: Wen Y, Cui Y, Hou Z; supervision: Zhu Y, Zhao J; validation: Deng S, Wen Y, Cui Y, Hou Z, Zhu Y, Zhao J; visualization: Deng S, Wen Y; writing—original draft: Deng S; writing—review and editing: Deng S, Wen Y, Cui Y, Zhu Y, Zhao J. All authors reviewed the results and approved the final version of the manuscript.
-
This published article and its supplementary files contain all the data generated during this study.
-
This research was financially supported by the National Natural Science Foundation of China, China (Grant No. 82471056), Guangdong Basic and Applied Basic Research Foundation (2024A1515140098 and 2024A1515013058).
-
The authors declare that they have no conflict of interest.
-
Authors contributed equally: Shuifeng Deng, Yuwen Wen
- Supplementary Table S1 Age information of patients in the control group and the POAG group.
- Supplementary Table S2 The KEGG pathway analysis results of 80 DEGs related to SH.
- Supplementary Table S3 GO analysis demonstrated that IGFBP2, ADM, IL1RN, PAQR8, HSPA8, AREG, PTGDS, SCNN1A, GJB2, MAOB, and KLF9 were enriched in the category of response to SHs.
- Supplementary Table S4 scRNA-seq marker genes.
- Supplementary Fig. S1 Related to Figure 2.
- Supplementary Fig. S2 Related to Figure 2.
- Supplementary Fig. S3 Related to Figure 3.
- Supplementary Fig. S4 Related to Figure 4.
- Copyright: © 2026 by the author(s). Published by Maximum Academic Press, Fayetteville, GA. This article is an open access article distributed under Creative Commons Attribution License (CC BY 4.0), visit https://creativecommons.org/licenses/by/4.0/.
-
About this article
Cite this article
Deng S, Wen Y, Cui Y, Hou Z, Dai D, et al. 2026. Steroid hormone-related transcriptomic signatures identify key molecular drivers of primary open-angle glaucoma. Visual Neuroscience 43: e011 doi: 10.48130/vns-0026-0001 

Steroid hormone-related transcriptomic signatures identify key molecular drivers of primary open-angle glaucoma
- Received: 07 July 2025
- Revised: 15 December 2025
- Accepted: 31 December 2025
- Published online: 23 March 2026
Abstract: Primary open-angle glaucoma (POAG) is a complex genetic disorder leading to irreversible vision loss, and emerging evidence indicates that steroid hormones (SHs) are elevated in POAG patients, suggesting a potential regulatory role in disease progression. In this study, two publicly available Gene Expression Omnibus (GEO) transcriptomic datasets from human trabecular meshwork (TM) tissue (GSE27276) and non-human macaque (Macaca mulatta) TM single-cell RNA sequencing (scRNA-seq) (GSE231749) were analyzed. Differentially expressed genes (DEGs) were identified using the limma package, and 603 DEGs were intersected with a curated set of 1,453 SH-related genes obtained from GeneCards to derive SH-related DEGs. A random forest model then identified six hub genes that demonstrate strong diagnostic performance. scRNA-seq showed that HSPA8 and PTGDS were significantly upregulated in POAG and localized to TM-related stromal and smooth muscle-like cell clusters, with pathway enrichment indicating involvement in steroid hormone signaling, extracellular matrix (ECM) regulation, and prostaglandin biosynthesis. Further validation is still needed in clinical aqueous humor and TM tissue samples to determine whether the abnormal expression of HSPA8 and PTGDS in TM tissue is consistent with the diagnosis of POAG, and to evaluate their correlation with disease progression. Predicted drug-gene interaction analysis, including VER-155008 for HSPA8 and AT-56 for PTGDS, identifies potential therapeutic candidates. Overall, the integrated bulk and single-cell transcriptomic analysis defines SH-related molecular signatures in POAG and highlights HSPA8 and PTGDS as potential therapeutic and prognostic biomarkers.