













-
Optical coherence tomography (OCT) has become increasingly important in the diagnosis and assessment of diabetic retinal neurodegeneration (DRN)[1]. Recent studies based on spectral domain OCT (SD-OCT) have found that thinning of the ganglion cell–inner plexiform layer (GCIPL) is an early indicator of DRN, appearing even before clinical microvascular changes in diabetic retinopathy (DR)[2−5]. Although peripapillary retinal nerve fiber layer (pRNFL) thickness is a classic biomarker for glaucoma, macular GCIPL analysis is particularly relevant for diabetes because the cell bodies of retinal ganglion cells (RGCs) are concentrated in the macula and are highly susceptible to metabolic stress and neurodegeneration early in the disease process, potentially preceding the axonal loss measured by pRNFL. Our previous findings indicated a close association between the exacerbation of neurodegenerative changes characterized by GCIPL and the risk of future DR[6,7]. Therefore, insight into the assessment of GCIPL thickness and its damage in clinical practice is crucial for understanding the occurrence and development of DRN. However, before translating GCIPL into a clinically viable indicator, it is necessary to clarify its associated influencing parameters to aid in the early and accurate diagnosis of DRN and prevent the misclassification of GCIPL damage caused by other clinical and biochemical biomarkers.
Currently, there is still a lack of comprehensive research exploring the systemic and ocular factors influencing GCIPL thinning in diabetes mellitus (DM) patients. Previous studies have reported conflicting conclusions, including associations with axial length (AL), spherical equivalent, blood glucose levels, and renal function[8−11]. Thus far, only age, blood pressure, and their correlation with GCIPL have been relatively clear[8,10]. More importantly, large-scale studies assessing these associations have included glaucoma patients or excluded diabetic patients, raising uncertainty about the applicability of these conclusions to diabetic patients. We have summarized the potential reasons for the conflicting conclusions in previous GCIPL studies to draw more reliable conclusions. Factors such as an inadequate sample size, a lack of longitudinal data, the absence of comprehensive systemic and ocular data, and some studies not using multivariate models to correct confounding factors may all contribute to ambiguity in the application value of GCIPL in monitoring DRN. Therefore, a detailed assessment of factors related to GCIPL damage in DM patients in large sample cohorts, along with thorough correction for confounding factors, has the potential to yield reliable conclusions.
Our team established the Guangzhou Diabetic Eye Study (GDES), which includes a large sample of patients with Type 2 DM (T2DM). This study involved SD-OCT imaging and seven-field fundus photography with continuous follow-up over three years, providing an opportunity to explore the independent risk factors for GCIPL. Through a detailed and comprehensive analysis, this study aimed to examine the effect of various demographic and ocular factors on GCIPL thickness measured around the macula and to use three-year longitudinal data from the GDES to investigate the effect of these factors on the rate of GCIPL thinning.
-
This work is an ongoing community-based prospective cohort study (International Standard Randomised Controlled Trial Number [ISRCTN]
www.isrctn.com/search q=15853192; ID: 15853192; Date of Registration: 2020-04-13). The study was conducted at the Zhongshan Ophthalmic Center (ZOC), Sun Yat-sen University, China, and the research protocol was approved by the ZOC Ethics Committee (Approval No. 2017KYPJ094, dated October 25, 2017). The execution of this study strictly followed the principles of the Helsinki Declaration, and all participants provided their written informed consent. The methodology of this cohort study has been detailed in previous publications. In summary, starting in November 2017, annual follow-ups were conducted for individuals with T2DM registered in the Guangzhou Diabetes Registry System. This study analyzed both baseline data and data from continuous follow-up visits for over three years.The inclusion criteria were (1) individuals aged 35–80 years old with a confirmed diagnosis of T2DM and (2) no prior eye treatment (naive eyes). The exclusion criteria were (1) the presence of conditions other than DM that may affect ocular nerve parameters, such as high myopia, choroidal neovascularization, glaucoma, and eyes with tilted or twisted optic discs or eyes with developmental abnormalities[12,13]; (2) intraocular surgery or procedures during the follow-up period, including retinal laser treatment, intraocular anti-vascular endothelial growth factor (VEGF) injections, glaucoma surgery, cataract surgery, laser refractive surgery, vitreoretinal surgery, etc.[14]; (3) AL ≥ 26 mm, astigmatism exceeding 3.00 D, visual acuity ≤ 20/200, and intraocular pressure (IOP) exceeding 21 mmHg[10]; (4) systemic diseases affecting ocular nerve parameters, such as Alzheimer's disease, stroke, obstructive sleep apnea syndrome etc.[15,16]; (5) cognitive impairment, mental disorders, or inability to cooperate with questionnaires and examinations; and (6) an inability to obtain clear OCT images, structural OCT images, or fundus color photographs, such as corneal ulcers, severe cataracts, etc.
OCT imaging and GCIPL measurements
-
After pupil dilation, we used a commercial SS-OCT device (DRI OCT Triton; Topcon, Japan) to perform OCT imaging of the macular region (6 mm × 6 mm). The device's scanning light source has a wavelength of 1,050 nm, with a wavelength tuning range of 100 nm and a maximum scanning speed of 100,000 A-scans/s. It provides tissue axial and lateral resolutions of 8 and 20 µm, respectively. Each OCT scan was performed through the internal fixation target and monitored via the built-in fundus camera. The device's built-in confocal laser and automatic real-time tracking overlay denoising technology ensured the images' clarity. The dual light source dynamic eye-tracking technology avoided artifacts from eye movement, ensuring the images' accuracy. The instrument's built-in software automatically segmented the thickness profile of each retinal layer and reported the thickness of each layer. We followed the OCT research terms and element suggestion protocol (advised protocol for OCT study terminology and elements) and defined the thickness of the macular GCIPL as the macular ganglion cell layer (mGCL) and the macular inner plexiform layer (mIPL). The mGCL consists of ganglion cell bodies, whereas the mIPL is composed of dendrites of retinal ganglion cells (RGCs). Only high-quality scan images were used for analysis, and manual adjustments were made if segmentation errors were present. The exclusion criteria included images with an image quality score < 60, the presence of artifacts (motion or blinking), images with poor contrast caused by the opacity of the refractive media (local signal loss, image blurring, masking), and images with uncorrectable segmentation errors.
General information and laboratory measurements
-
The methodology for this cohort study has been extensively detailed in other articles[17]. In summary, during each subject's visit, a comprehensive questionnaire was used to collect information, including basic details, lifestyle factors, medical history, and relevant treatment history. Basic information encompassed birthdate, education level, occupation, and income, among others. Lifestyle factors included dietary habits, smoking, and alcohol consumption. Medical history included general medical history, long-term medication history, eye diseases, and surgical history, among others. The diagnosis of DM was confirmed through endocrinologists' medical records, insulin treatment, oral hypoglycemic agents, or fasting blood glucose ≥ 7.0 mmol/L and postprandial blood glucose ≥ 11.1 mmol/L on at least two consecutive occasions[18]. The duration of DM was defined as the time from the initial diagnosis by endocrinologists to entry into the study. Following standardized procedures, experienced nurses measured the participants' parameters, such as height, waist circumference, systolic blood pressure, and diastolic blood pressure. Body mass index (BMI) was calculated as weight in kilograms divided by height in meters squared. After collecting urine and blood samples from all study subjects, trained nurses performed standard testing procedures to analyze and obtain biochemical parameters. The parameters obtained included glycated hemoglobin (HbA1c), blood creatinine, total cholesterol, high-density lipoprotein cholesterol (HDL-c), low-density lipoprotein cholesterol, triglycerides, and urinary microalbumin. The estimated glomerular filtration rate (eGFR) was calculated using the Chronic Kidney Disease Epidemiology Collaboration formula[19].
Eye examination and DR evaluation
-
All study participants underwent comprehensive vision and refraction examinations conducted by professional optometrists. The early treatment diabetic retinopathy study (ETDRS) LogMAR E vision chart (Precision Vision, Villa Park, Illinois, USA) was used to measure uncorrected visual acuity, near vision, and best corrected visual acuity (BCVA) at 4 m. Bilateral AL, central retinal thickness, central anterior chamber depth, and lens thickness were measured by experienced technicians using a Lenstar LS900 biometer (HAAG-Streit AG, Koeniz, Switzerland). After dilation, professional optometrists measured refractive power using an auto-refractometer (Topcon KR8800, Topcon Corporation, Tokyo, Japan). IOP measurements were taken before dilation, 30 min after dilation, and 2 h after dilation using a Topcon CT-80 A noncontact tonometer (Topcon, Japan). Three readings were recorded for each measurement, and the average value was calculated. A difference of less than 0.5 mmHg was ensured between the three measurements. If the average noncontact IOP measurement was higher than 21 mmHg, Goldmann applanation tonometry was performed again. Digital fundus photographs (Canon CX-1, Tokyo, Japan) were taken for each eye with seven standard 45° fundus images, including stereoscopic views of the macula and optic disc. DR was defined according to the revised ETDRS grading criteria by a single ophthalmologist at the fundus photograph reading center.
Statistical analysis
-
Data processing and analysis were conducted using Stata statistical software (Stata version 17.0, Stata Corp., College Station, TX, USA). To avoid the confounding effect of inter-eye correlation, only data from the right eye of each participant were included in the primary analysis, ensuring the independence of the observations. The correlation between the candidate factors and GCIPL was considered in the following steps. First, the candidate relevant factors were selected according to the existing literature and experience, and a basic statistical analysis was conducted. Categorical variables are presented as numbers and percentages, normally distributed continuous variables as the means ± standard deviation (SD), and nonnormally distributed continuous variables as the median and interquartile range. The Kolmogorov–Smirnov test was used to assess the normality assumption for continuous variables. When the normality assumption was met, t-tests were used to compare the demographic characteristics and systemic and ophthalmic parameters between the groups. The χ2-test was used for analyzing categorical variables. Second, the associations among the baseline ocular features, systemic factors, and the rate of GCIPL decline were explored using linear regression analysis to identify potential risk factors. Univariate linear regression analysis was performed, with GCIPL as the dependent variable and the factors to be evaluated as the independent variables. The change in GCIPL for every one-unit change in each determinant factor was calculated, and the strength of each association was evaluated. Variables that were statistically significant in the univariate models (p < 0.05), such as AL, baseline BCVA, retinal thickness, GCIPL thickness, HbA1c fluctuation, and renal function parameters, were initially considered. Given the exploratory nature of the analysis, we applied the Benjamini–Hochberg false discovery rate (FDR) procedure to control for multiple comparisons in the univariate analyses. An FDR threshold of q < 0.05 was used to define statistical significance. A stepwise backward selection approach was used to derive the final model. In addition to all variables with p < 0.05 from the univariate analysis, duration of DM was forcibly entered into the initial multivariable model as a clinically important covariate. The significance level for all analyses was set to p < 0.05. The primary outcome was the annualized rate of decline in GCIPL, calculated as (GCIPL thickness at the last follow-up visit – GCIPL thickness at baseline) divided by the follow-up duration in years, expressed in μm/year. In line with previous literature, eyes with a GCIPL thinning rate ≥ 1 μm/year were defined as the "Fast" progression group, whereas those with a rate < 1 μm/year were defined as the "Slow" progression group[20].
-
Data from the right eyes of 1,500 participants were included in the final analysis (Fig. 1). Of the 2,123 initially enrolled participants, 623 were excluded from the final analysis for the following reasons: Loss to follow-up (n = 418), poor OCT image quality (n = 67), development of exclusion criteria during the follow-up period (e.g., cataract surgery, intravitreal injections, or progression to high myopia; n = 85), and incomplete systemic data (n = 53). Compared with the included participants, patients in the excluded group had a higher BMI, more DR cases, higher HbA1c levels, poorer BCVA, greater baseline GCIPL thickness, higher triglyceride levels, and lower HDL-c levels (p < 0.05). There were no statistically significant differences in the remaining parameters (all p > 0.05) (Table 1).
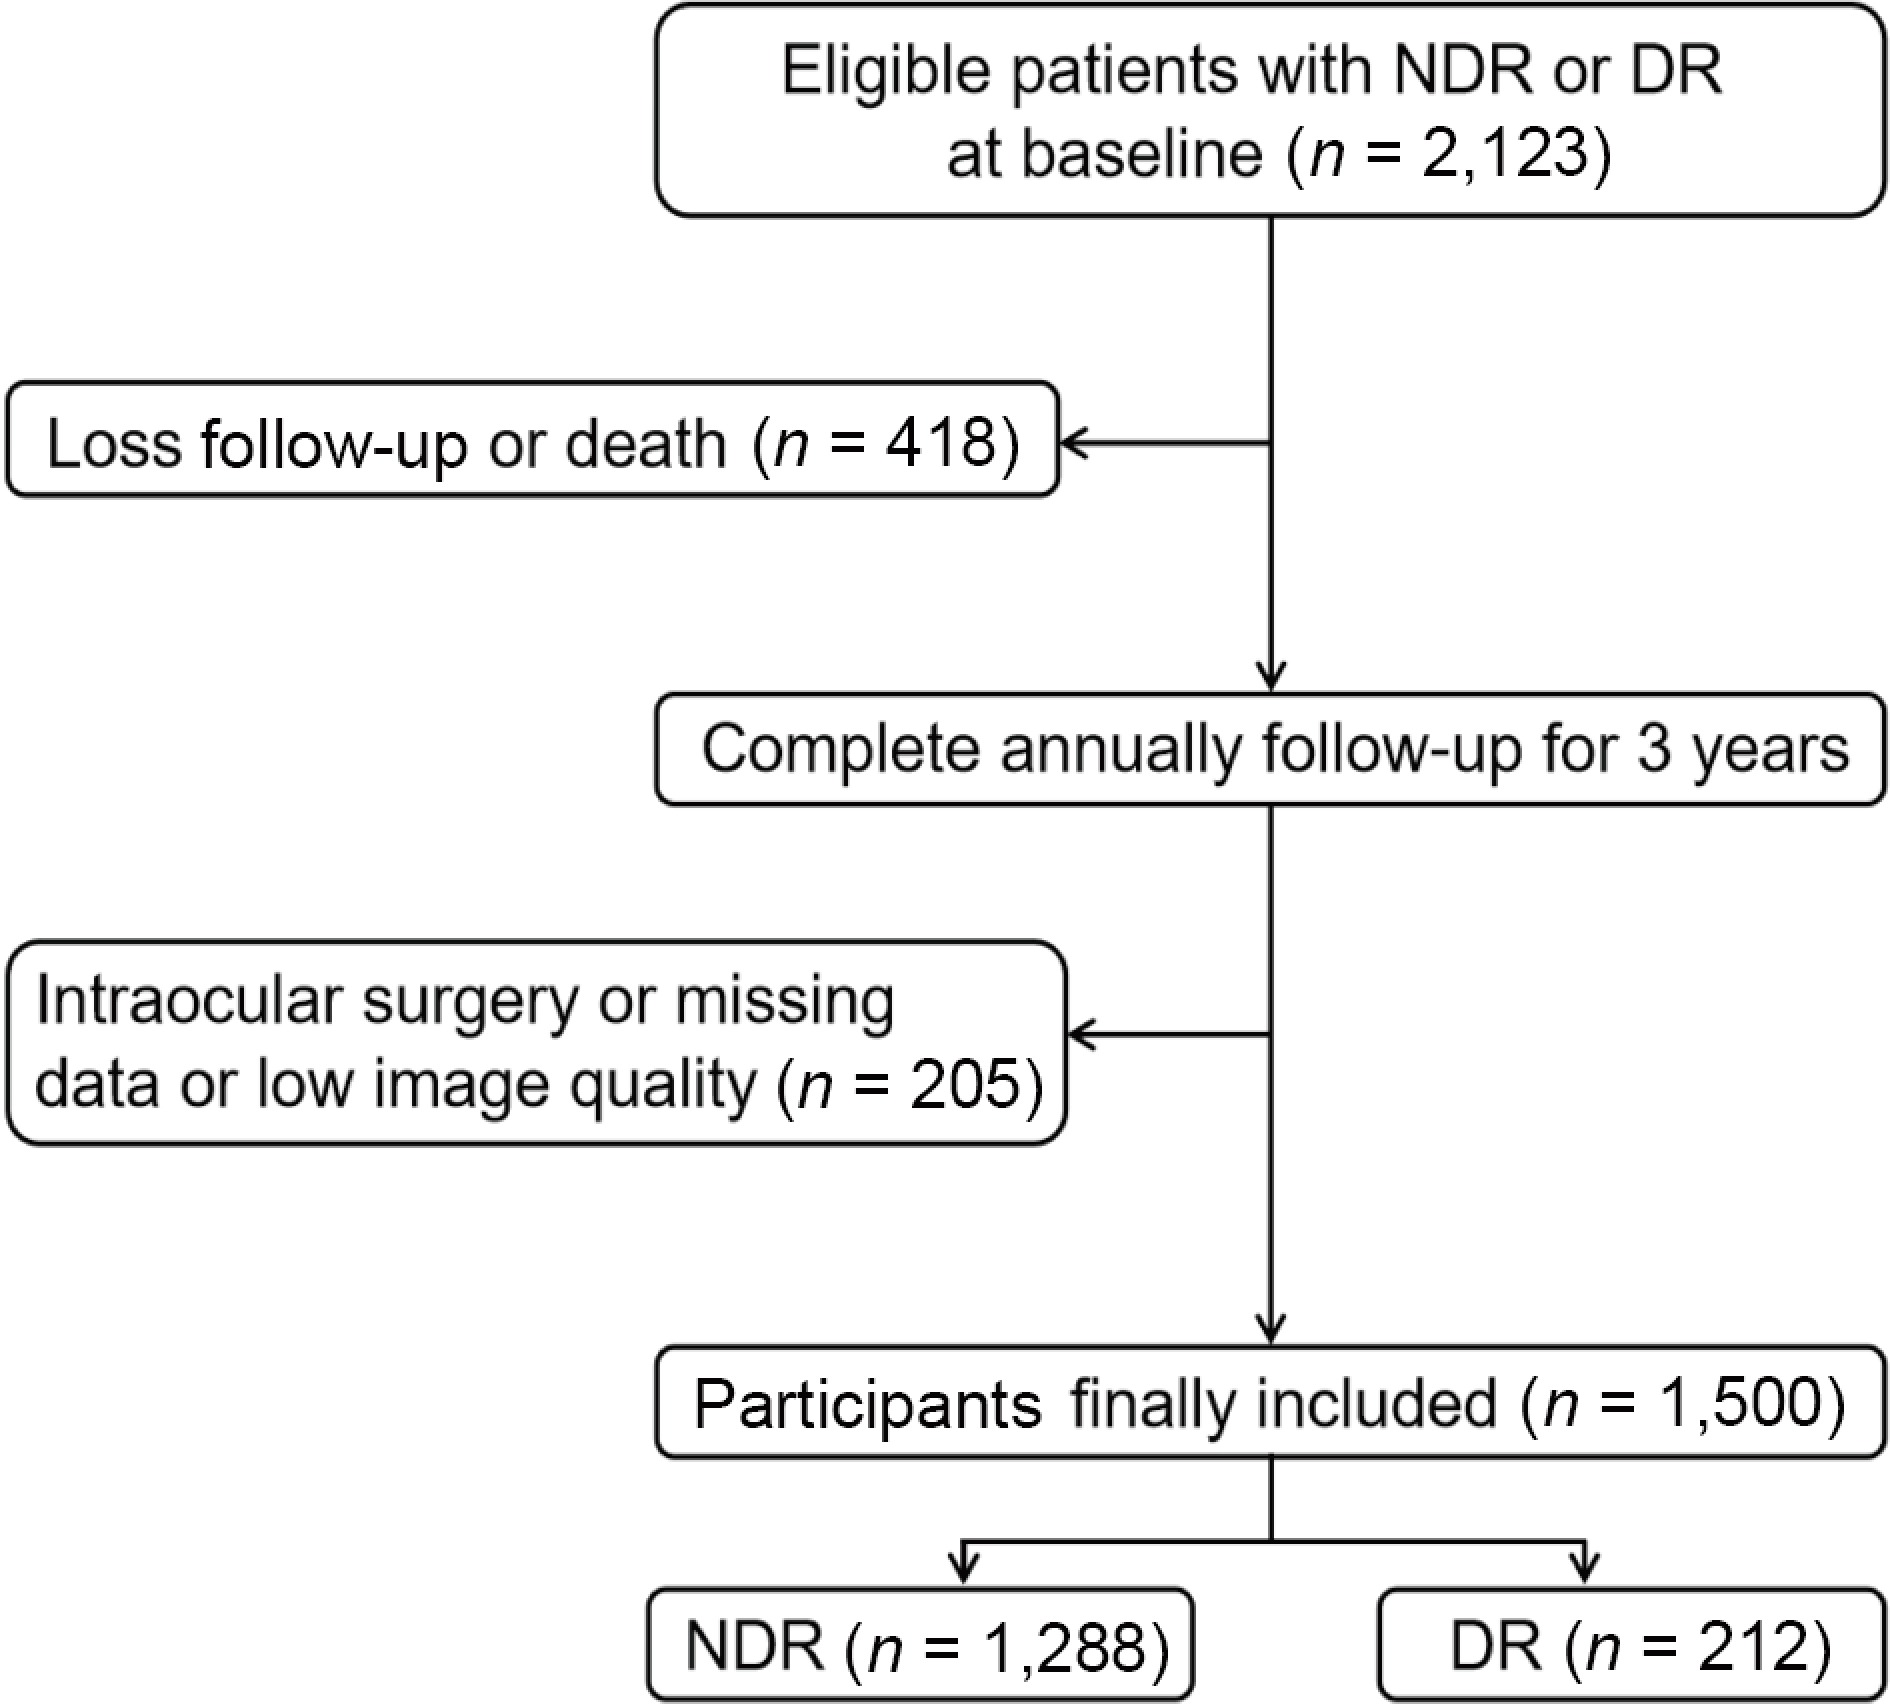
Figure 1.
Overall workflow of the cohort study. NDR, diabetic patients without retinopathy; DR, diabetic retinopathy patients.
Table 1. Baseline characteristics of included and excluded participants.
Characteristic Included
(n = 1,500)Excluded
(n = 623)p-value Age (year) 64.83 (7.35) 64.19 (8.19) 0.069 Female (%) 858 (57.20%) 359 (57.72%) 0.826 Body mass index (kg/m2) 24.65 (9.54) 24.81 (3.62) 0.014 Duration of diabetes (y) 8.93 (6.86) 8.46 (6.99) 0.080 Diabetic retinopathy (%) 212 (14.13%) 126 (20.26%) < 0.001 HbA1c (%) 7.03 (1.38) 7.26 (1.64) 0.015 Systolic blood pressure (mmHg) 133.44 (18.56) 134.64 (18.96) 0.116 Eye examination Axial length (mm) 23.37 (0.83) 23.37 (0.80) 0.859 Spherical 1.05 (1.63) 1.01 (1.30) 0.131 Intraocular pressure (mmHg) 15.77 (2.22) 15.86 (2.41) 0.439 BCVA (logMAR) 0.16 (0.13) 0.19 (0.15) < 0.001 Macular retinal thickness (μm) 246.82 (77.96) 255.10 (68.26) 0.283 Macular GCIPL thickness (μm) 71.64 (5.27) 72.41 (7.42) 0.008 Macular choroidal thickness (μm) 189.93 (73.34) 192.34 (75.16) 0.448 Disc area (mm2) 2.10 (0.40) 2.08 (0.42) 0.605 RNFL thickness (μm) 110.79 (13.97) 111.50 (14.25) 0.153 Blood lipids Total cholesterol (mmol/L) 4.86 (1.07) 4.87 (1.09) 0.928 Triglycerides (mmol/L) 2.32 (1.67) 2.54 (1.94) 0.019 HDL-c (mmol/L) 1.30 (0.40) 1.25 (0.38) 0.004 LDL-c (mmol/L) 3.05 (0.94) 3.07 (0.94) 0.851 Renal function eGFR (mL/min/1.73 m2) 99.07 (18.44) 98.71 (20.59) 0.729 Serum creatinine (mg/L) 71.57 (20.56) 72.98 (25.39) 0.790 Serum uric acid (μmol/L) 370.09 (100.41) 370.16 (101.91) 0.032 Microalbuminuria (mg/mL) 4.44 (25.42) 8.35 (48.98) < 0.001 HbA1c, glycosylated hemoglobin; BCVA, best corrected visual acuity; logMAR, logarithm of the minimal angle of resolution; GCIPL, ganglion cell–inner plexiform layer; RNFL, retinal nerve fiber layer; HDL-c, high-density lipoprotein cholesterol; LDL-c, low-density lipoprotein cholesterol; eGFR, estimated glomerular filtration rate. Data are presented as the mean and standard deviation, or counts and percentages. Data in bold indicate statistically significant differences (p < 0.05). Univariate analysis of factors associated with a decline in GCIPL
-
Shown in Table 2 are the results of the univariate linear regression analysis evaluating factors associated with the rate of GCIPL decline during the three-year follow-up.
Table 2. Clinical characteristics factors contributing to the change in GCIPL thickness over time in DM participants as determined by univariate linear regression analysis.
Variable Univariate model β (95% CI) †p-value Age, per 10-year increase 0.004 (−0.089, 0.098) 0.923 Male versus female −0.078 (−0.217, 0.061) 0.269 Body mass index, per 1-SD increase −0.007 (−0.076, 0.062) 0.848 Duration of diabetes, per 1-year increase −0.004 (−0.014, 0.007) 0.463 Systolic blood pressure, per 1-SD increase −0.047 (−0.116, 0.021) 0.177 Eye examination, per 1-SD increase Axial length −0.176 (−0.244, -0.108) < 0.001 Spherical 0.068 (−0.001, 0.136) 0.054 Intraocular pressure −0.091 (−0.159, –0.022) 0.010 BCVA (logMAR) −0.202 (−0.270, –0.133) < 0.001 Macular retinal thickness −0.231 (−0.298, –0.163) < 0.001 Macular GCIPL thickness −0.343 (−0.410, –0.277) < 0.001 Macular choroidal thickness 0.005 (−0.064, 0.074) 0.889 Disc area 0.079 (−0.079, 0.163) 0.067 RNFL thickness −0.005 (−0.075, 0.064) 0.880 HbA1c, per 1-SD increase Baseline 0.029 (−0.039, 0.098) 0.403 Mean −0.038 (−0.106, 0.031) 0.283 Peak −0.062 (−0.130, 0.007) 0.078 Fluctuation −0.085 (−0.153, -0.016) 0.016 Range −0.091 (−0.160, -0.022) 0.009 Blood lipid, per 1-SD increase Total cholesterol 0.027 (−0.041, 0.096) 0.434 Triglycerides −0.019 (−0.087, 0.050) 0.597 HDL-c −0.022 (−0.091, 0.047) 0.537 LDL-c −0.014 (−0.083, 0.055) 0.689 Renal function, per 1-SD increase eGFR −0.082 (−0.151, -0.013) 0.019 Serum creatinine 0.057 (−0.012, 0.126) 0.104 Serum uric acid 0.031 (−0.038, 0.100) 0.378 Microalbuminuria −0.086 (−0.155, 0.017) 0.015 DM, diabetes mellitus; CI, confidence interval; SD, standard deviation; BCVA, best corrected visual acuity; logMAR, logarithm of the minimal angle of resolution; GCIPL, ganglion cell inner plexiform layer; RNFL, retinal nerve fiber layer; HbA1c, glycosylated hemoglobin; HDL-c, high-density lipoprotein cholesterol; LDL-c, low-density lipoprotein cholesterol; eGFR, estimated glomerular filtration rate. †p-values are from the univariate linear regression analysis. Variables with p < 0.01 remained statistically significant after Benjamini–Hochberg false discovery rate correction (q < 0.05). Data in bold indicate statistically significant differences (p < 0.05). The results indicated that a longer baseline AL (β = −0.176; 95% confidence interval [CI]: −0.244 to −0.108 μm/year; p < 0.001; Fig. 2a), higher baseline intraocular pressure (β = −0.091; 95% CI: −0.159 to −0.022 μm/year; p = 0.01), poorer baseline visual acuity (β = −0.202; 95% CI: −0.270 to −0.133 μm/year; p < 0.001; Fig. 2b), greater baseline macular retinal thickness (β = −0.231; 95% CI: −0.298 to −0.163 μm/year; p < 0.001; Fig. 2c), greater baseline macular GCIPL thickness (β = −0.343; 95% CI: −0.410 to −0.277 μm/year; p < 0.001; Fig. 2d), and a wider HbA1c fluctuation range (β = −0.091; 95% CI: −0.160 to −0.022 μm/year; p = 0.009) were associated with a higher rate of decline in GCIPL. However, ocular factors, such as refractive error, choroidal thickness in the macular region, optic disc area, and baseline peripapillary retinal nerve fiber layer thickness, were not correlated with GCIPL thickness (p > 0.05).
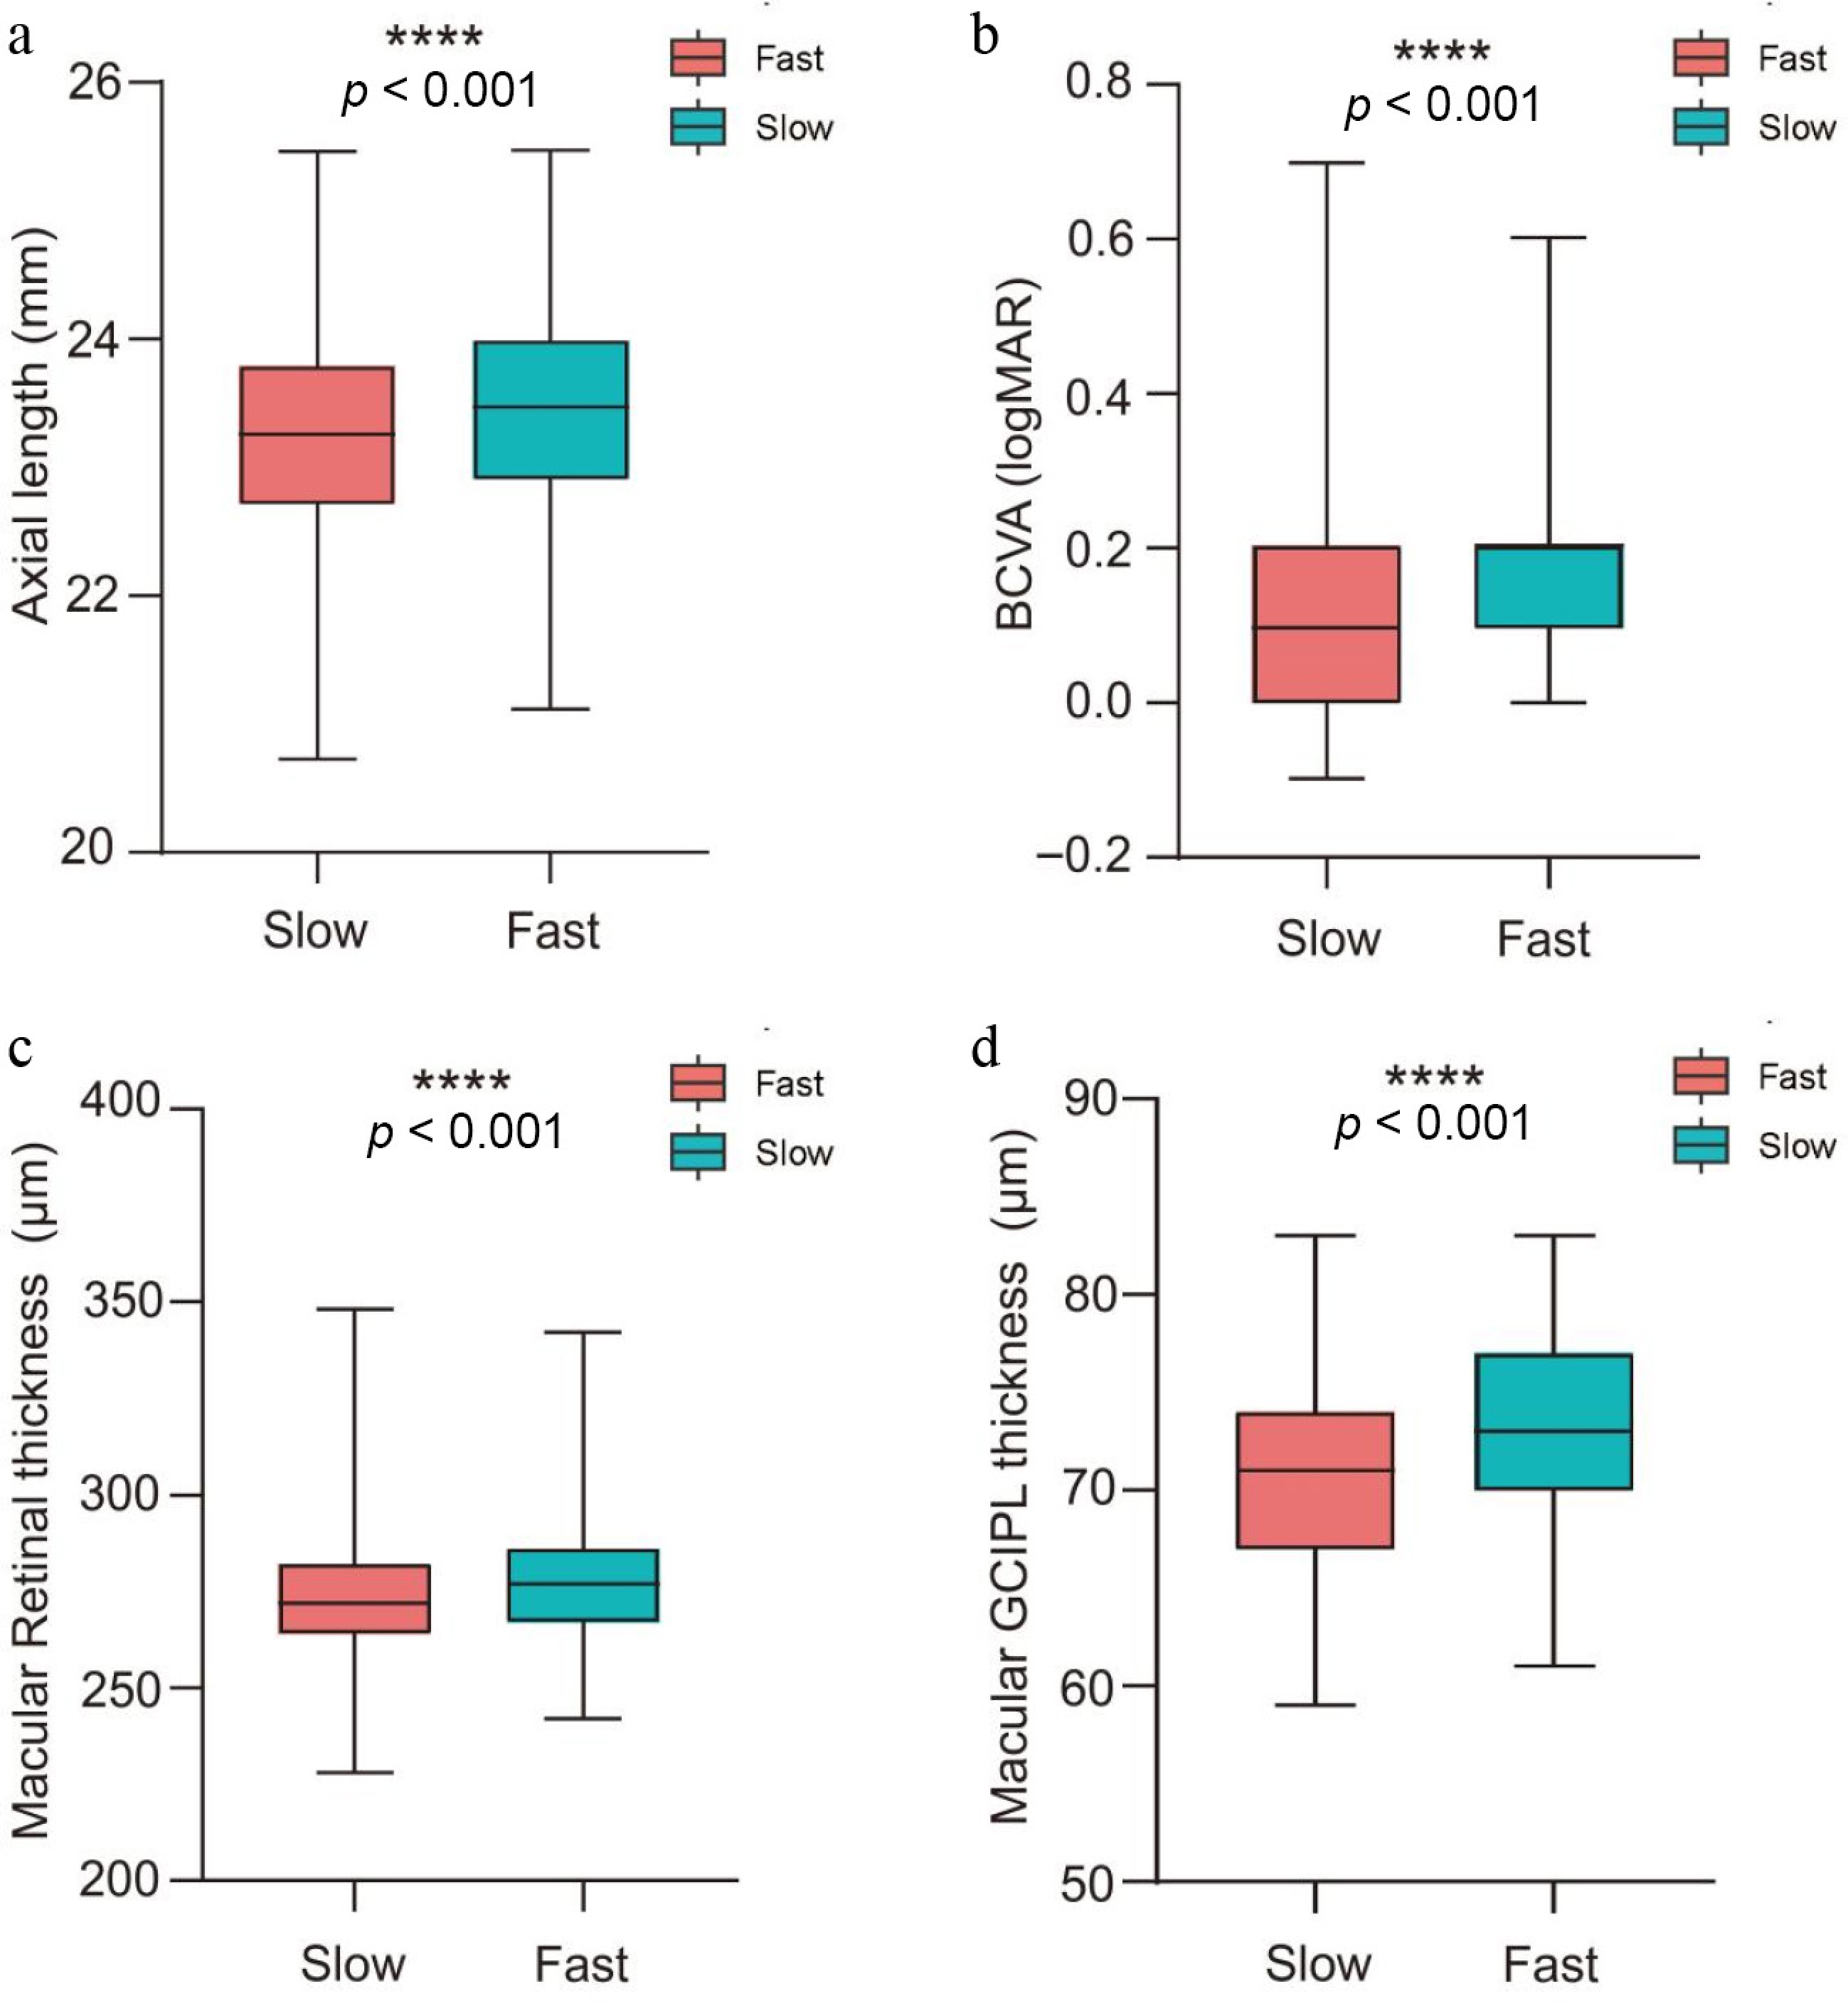
Figure 2.
The box plot of the changes in macular ganglion cell layer–inner plexiform layer thickness over time with (a) axial length, (b) BCVA, (c) macular retinal thickness, and (d) macular GCIPL thickness. The Fast group included eyes whose rate of GCIPL thinning was greater than or equal to –1 μm/year; the Slow group included eyes with a rate slower than −1 μm/year. BCVA, best corrected visual acuity; logMAR, logarithm of the minimal angle of resolution; GCIPL, ganglion cell–inner plexiform layer.
Multivariate analysis: independent predictors of a decline in GCIPL
-
Table 3 presents the initial full multivariate model, which included all variables with p < 0.05 from the univariate analysis plus duration of diabetes (the forced covariate). In the final model adjusting for duration of diabetes, baseline intraocular pressure, HbA1c fluctuation, HbA1c range, and estimated glomerular filtration rate (eGFR), a longer AL (β = −0.187; 95% CI: −0.255 to −0.120 μm/year; p < 0.001), poorer baseline visual acuity (β = −0.201; 95% CI: −0.271 to −0.130 μm/year; p < 0.001), greater baseline macular retinal thickness (β = −0.126; 95% CI −0.198 to −0.054 μm/year; p = 0.001), greater baseline macular GCIPL thickness (β = −0.305; 95% CI: −0.376 to −0.235 μm/year; p < 0.001), and more microalbuminuria (β = −0.069; 95% CI: −0.136 to −0.002 μm/year; p = 0.045) were independently associated with a higher rate of decline in GCIPL. The box plots of these four significantly correlated factors are illustrated in Fig. 2. The Fast group included eyes whose rate of GCIPL thinning was greater than or equal to –1 μm/year; the Slow group included eyes with a rate slower than −1 μm/year[20].
Table 3. Clinical characteristics factors contributing to the changes in GCIPL thickness over time in DM participants as determined by multivariate linear regression analysis.
Variable Multivariate model β (95% CI) p-value Duration of diabetes, per 1-year increase −0.003 (−0.013, 0.007) 0.582 Eye examination, per 1-SD increase Axial length −0.187 (−0.255, −0.120) < 0.001 Intraocular pressure −0.064 (−0.132, 0.004) 0.066 BCVA (logMAR) −0.201 (−0.271, −0.130) < 0.001 Macular retinal thickness −0.126 (−0.198, −0.054) 0.001 Macular GCIPL thickness −0.305 (−0.376, −0.235) < 0.001 HbA1c, per 1-SD increase Fluctuation 0.187 (−0.311, 0.684) 0.462 Range −0.237 (−0.735, 0.262) 0.351 Renal function, per 1-SD increase eGFR −0.057 (−0.128, 0.014) 0.118 Microalbuminuria −0.069 (−0.136, −0.002) 0.045 DM, diabetic retinopathy; CI, confidence interval; SD, standard deviation; BCVA, best corrected visual acuity; HbA1c, glycosylated hemoglobin; logMAR, logarithm of the minimal angle of resolution; GCIPL, ganglion cell–inner plexiform layer; eGFR, estimated glomerular filtration rate. Data in bold indicate statistically significant differences (p < 0.05). Subgroup analysis by DR status
-
To mitigate the effect of DR, the participants with and without DR were analyzed separately. Univariate linear regression was performed separately for patients with no DR (NDR) and those with DR (Table 4). In NDR patients, a longer duration of diabetes; a longer AL; greater refractive error, poorer baseline visual acuity; greater baseline macular retinal thickness; greater baseline macular GCIPL thickness, higher mean, maximum, fluctuation, and range of HbA1c; and more microalbuminuria were associated with a higher rate of decline in GCIPL (all p < 0.05). In DR patients, a longer duration of diabetes; longer AL; greater baseline macular retinal thickness; greater baseline macular GCIPL thickness; and higher baseline, mean, maximum, fluctuation, and range of HbA1c were associated with a higher rate of decline in GCIPL (all p < 0.05). In Supplementary Tables S1, S2, stepwise removal of the parameters lacking statistical significance is conducted in the multivariate regression analysis. In the final model, for the NDR patients, a longer AL (β = −0.183; 95% CI: −0.260 to −0.106 μm/year; p < 0.001), poorer baseline visual acuity (β = −0.255; 95% CI: −0.326 to −0.184 μm/year; p < 0.001), greater baseline macular retinal thickness (β = −0.129; 95% CI: −0.203 to −0.054 μm/year; p = 0.001), greater baseline macular GCIPL thickness (β = −0.289; 95% CI: −0.360 to −0.217 μm/year; p < 0.001), and more microalbuminuria (β = −0.109; 95% CI −0.178 to −0.040 μm/year; p = 0.002) were independently associated with a higher rate of decline in GCIPL. For DR patients, a longer AL (β = −0.252; 95% CI: −0.438 to −0.065 μm/year; p = 0.008), greater baseline macular retinal thickness (β = −0.182; 95% CI −0.363 to −0.001 μm/year; p = 0.018), and greater baseline macular GCIPL thickness (β = −0.223; 95% CI: −0.407 to −0.039 μm/year; p = 0.049) were independently associated with a higher rate of decline in GCIPL (Supplementary Tables S1, S2).
Table 4. Clinical characteristics factors contributing to the rate of thinning of the macular ganglion cell–inner plexiform layer over time in NDR and DR participants as determined by univariate linear regression analysis.
Variable NDR DR β (95% CI) p-value β (95% CI) †p-value Age, per 10-year increase 0.002 (−0.098, 0.104) 0.955 −0.011 (−0.033, 0.011) 0.334 Male versus female −0.114 (−0.260, 0.032) 0.127 −0.034 (−0.405, 0.337) 0.856 Body mass index 0.001 (−0.071, 0.074) 0.969 −0.131 (−0.316, 0.055) 0.167 Duration of diabetes −0.014 (−0.026, −0.003) 0.012 0.039 (0.014, 0.064) 0.003 Systolic blood pressure −0.070 (−0.143, 0.002) 0.055 0.068 (−0.117, 0.253) 0.471 Eye examination Axial length −0.164 (−0.235, 0.092) < 0.001 −0.325 (−0.508, −0.141) 0.001 Spherical 0.087 (0.015, 0.159) 0.018 0.031 (−0.159, 0.221) 0.750 Intraocular pressure −0.056 (−0.128, 0.017) 0.131 −0.072 (−0.266, 0.121) 0.463 BCVA (logMAR) −0.298 (−0.368, −0.228) < 0.001 −0.080 (−0.276, 0.116) 0.422 Retinal thickness −0.238 (−0.309, −0.167) < 0.001 −0.293 (−0.476, −0.110) 0.002 GCIPL thickness −0.327 (−0.397, −0.257) < 0.001 −0.269 (−0.452, −0.086) 0.004 Choroidal thickness 0.014 (−0.059, 0.086) 0.714 −0.038 (−0.220, 0.145) 0.686 Disc area 0.068 (−0.013, 0.149) 0.100 0.204 (−0.108, 0.517) 0.197 RNFL thickness 0.006 (−0.066, 0.079) 0.863 −0.025 (−0.211, 0.160) 0.787 HbA1c Baseline −0.043 (−0.115, 0.029) 0.241 0.403 (0.227, 0.580) < 0.001 Mean −0.129 (−0.201, −0.058) < 0.001 0.449 (0.275, 0.624) < 0.001 Peak −0.154 (−0.226, −0.083) < 0.001 0.461 (0.288, 0.634) < 0.001 Fluctuation −0.144 (−0.216, −0.073) < 0.001 0.306 (0.128, 0.484) 0.001 Range −0.148 (−0.219, −0.076) < 0.001 0.284 (0.106, 0.462) 0.002 Blood lipid Total cholesterol 0.011 (−0.061, 0.083) 0.769 0.072 (−0.111, 0.254) 0.439 Triglycerides −0.016 (−0.089, 0.056) 0.658 0.060 (−0.124, 0.244) 0.519 HDL-c −0.025 (−0.098, 0.047) 0.490 −0.084 (−0.288, 0.119) 0.415 LDL-c −0.038 (−0.110, 0.034) 0.299 0.048 (−0.136, 0.232) 0.609 Renal function eGFR −0.037 (−0.110, 0.035) 0.310 −0.072 (−0.263, 0.119) 0.458 Serum creatinine 0.007 (−0.065, 0.080) 0.840 0.090 (−0.098, 0.279) 0.347 Serum uric acid 0.009 (−0.064, 0.081) 0.813 0.081 (−0.104, 0.265) 0.390 Microalbuminuria −0.135 (−0.207, −0.063) < 0.001 0.177 (−0.076, 0.430) 0.169 NDR, diabetic patients without retinopathy; DR, diabetic patients; CI, confidence interval; SD, standard deviation; BCVA, best corrected visual acuity; logMAR, logarithm of the minimal angle of resolution; GCIPL, ganglion cell–inner plexiform layer; RNFL, retinal nerve fiber layer; HbA1c, glycosylated hemoglobin; HDL-c, high-density lipoprotein cholesterol; LDL-c, low-density lipoprotein cholesterol; eGFR, estimated glomerular filtration rate. †p-values are from the univariate linear regression analysis. Within each subgroup (NDR and DR), all variables with p < 0.05 remained statistically significant after Benjamini–Hochberg false discovery rate correction (q < 0.05). Data in bold indicate statistically significant differences (p < 0.05). -
Clearly defining GCIPL thickness and its associated factors is crucial for understanding the occurrence and development of DRN. This study provides new longitudinal evidence by identifying baseline GCIPL thickness, baseline macular retinal thickness, baseline visual acuity, AL, and baseline microalbuminuria as important predictive factors for the progression of GCIPL thinning. We followed 1,500 Chinese adults with T2DM for three years, measured GCIPL using SD-OCT, and found that increased GCIPL and retinal thickness, poor baseline visual acuity, elongated AL, and increased microalbuminuria were significant predictors of its decline. It is noteworthy that the rate of loss was unrelated to systemic factors, such as age and gender, that were mentioned in previous studies, and was not affected by ocular conditions, such as intraocular pressure or the presence of DR. To date, this is the first prospective study to identify the systemic and ocular determinants of GCIPL thickness in the diabetic population, laying the foundation for its future clinical applications and exploring its association with DR.
This study elucidates the potential causal effect of AL on the thinning of the GCIPL, while also explaining the reasons for conflicting conclusions in previous studies. Regarding the potential influence of AL on GCIPL thickness, some studies have suggested a negative correlation between GCIPL thickness and AL[8,21,22]. Koh et al., using High-Definition OCT to explore 623 samples, found that each millimeter of change in AL resulted in less than a 0.5% change in GCIPL thickness[8]. This minimal change is unlikely to reflect any practical clinical significance. Therefore, some theories have proposed that the effect of AL on measured GCIPL thickness is caused by the axial magnification effect. In other words, patients with longer ALs will have an actual scanning area larger than the "standard" retinal scanning area (1,024 pixels), leading to the inclusion of a thinner peripheral GCIPL in the calculation of average thickness[21,23]. To confirm whether the correlation between AL and GCIPL is caused by the axial magnification effect, this study used a rigorous experimental design: Excluding highly myopic patients, correcting for the effect of field magnification during image analysis, and adjusting for potential confounding factors during the statistical analysis. The study found that AL still had statistically significant effects on the thinning of the GCIPL, even with these corrections, clarifying the effect of AL on neurodegenerative changes. These conclusions can be explained by the mechanical stretching mechanism. This study also provides a direction for clinical prevention and treatment, suggesting that further research is needed to explore whether inhibiting axial growth can delay the onset of neurodegenerative changes.
The conclusion that there is no significant linear correlation between baseline age and macular GCIPL thickness is not surprising. Xu et al., in their study of 225 healthy Chinese subjects, found that the change in GCIPL thickness with age was nonlinear. The GCIPL thickness in young and middle-aged individuals increases slowly with age, reaching a peak at 40–49 years of age. Afterward, it rapidly declines with increasing age[24]. This may be because the variability in GCIPL thickness measured by OCT does not completely correspond to the variability in age-related changes among the subjects. This phenomenon is significant, even in the normal population. In diabetic retinas, displaced amacrine cells show degeneration, the microglia migrate into the ganglion cell layer, and Müller cells undergo reactive gliosis[25−27]. Therefore, the correlation between age and RGC loss may be more unpredictable in vivo. Further investigation through histopathology is still needed to explore the correlation between age and RGC damage.
The effect of past blood glucose levels on neurodegenerative changes is a subject of controversy. Van Dijk et al. reported that the ganglion cell layer was significantly thinner in patients with Type 1 DM with NDR and nonproliferative DR compared with the control group[28]. However, some scholars have argued that DM has a protective effect on neurodegenerative changes. An experiment in rats with experimental glaucoma found that short-term hyperglycemia could delay axonal degeneration, eliminate RGC apoptosis, and alleviate axonal damage[29]. A longitudinal study with a median follow-up of 5.7 years suggested that compared with nondiabetic patients, primary open-angle glaucoma patients with well-controlled diabetes had a slower rate of retinal nerve fiber layer (RNFL) thinning[30]. In addition, in a cross-sectional study of 623 nonglaucomatous individuals, HbA1c was found to be unrelated to macular GCIPL thickness[8]. Another study involving 4,464 individuals from various ethnicities also found no association between HbA1c and GCIPL thickness[11]. In the context of T2DM, we observed that the rate of decline in GCIPLdecline was not influenced by HbA1c levels. This may be attributed to well-managed blood glucose control following health education interventions for diabetic patients. In our multivariate analysis, the fluctuation and range of HbA1c were significant in univariate models but did not remain in the final model after adjusting for stronger predictors such as AL, baseline GCIPL thickness, and microalbuminuria. This suggests that although glycemic variability may contribute to neurodegeneration, its effect is overshadowed by other structural and systemic factors in this cohort. The results suggest the importance of identifying other significant risk factors other than blood glucose levels in controlling the progression of diabetic retinal neurodegeneration.
To the best of our knowledge, no large-scale longitudinal study has investigated the correlation between kidney function and DRN. Previous studies on the correlation between kidney function and GCIPL have been cross-sectional and have lacked research on GCIPL and kidney function in diabetic patients without glaucoma. A study involving 1,657 participants in the UK Twins Cohort confirmed a positive correlation between the estimated glomerular filtration rate (eGFR) and the thickness of the macular ganglion cell complex after adjusting for age, diabetes, and hypertension. However, this study did not explore whether this association exists in diabetic patients. Similarly, Yih-Chung Tham et al. confirmed in nondiabetic patients that chronic kidney disease was associated with a thinner GCIPL[10]. Brandolt et al. found that 24 diabetic patients with microalbuminuria had a thinner ganglion cell layer than 19 diabetic patients without microalbuminuria[31]. Our team previously found that poor renal function was significantly associated with a faster rate of decline in Chinese participants[32]. We investigated 1,408 individuals with T2DM and found a positive correlation between eGFR and RNFL thickness, and an increased risk of DRN with the presence of microalbuminuria[33]. All of these studies suggest that kidney function may exacerbate DRN and its progression. For the first time, this study confirms the independent association between microalbuminuria and the progressive thinning rate of GCIPL in diabetic patients. The conclusion of this study suggests that the effect of kidney function should be considered in the clinical diagnosis of DRN.
Our study concludes that baseline GCIPL thickness, AL, visual acuity, and microalbuminuria are important predictive factors for the progression of GCIPL damage, holding significant implications for the early diagnosis and prevention of DRN. Before using GCIPL as a parameter for diagnosing DRN, it is important to clarify whether the damage is caused by other clinical and biochemical biomarkers, such as glaucoma and high myopia. The findings of this study suggest that when using the GCIPL method to diagnose DRN, whether or not the damage is caused by abnormal renal function should be considered. Furthermore, this study provides a novel perspective on the prevention and treatment of DRN. High blood sugar is known to lead to irreversible optic nerve damage and subsequent vision loss. However, some patients, despite good blood sugar control, still cannot delay the progression of DRN, indicating the involvement of other important risk factors. This study confirms that renal function and AL are also crucial risk factors in the progression of DRN, aside from blood sugar levels. Therefore, future clinical research should further explore the protective efficacy of controlling AL and renal function against DRN.
The strength of this study that it is—to the best of our knowledge—the largest-scale investigation of factors related to DRN to date. We conducted a comprehensive analysis of ocular and systemic confounding factors and, for the first time, longitudinally confirmed the causal relationship between previously identified risk factors and GCIPL damage.
These findings have important clinical implications. Axial length and microalbuminuria are routinely measured in ophthalmic and diabetic care, respectively. Our results suggest that diabetic patients with a longer AL or the presence of microalbuminuria should be monitored more closely for early neurodegenerative changes, even in the absence of clinically detectable retinopathy. These factors could be incorporated into a risk stratification algorithm to identify individuals at high risk for accelerated GCIPL thinning who may benefit from neuroprotective interventions or stricter metabolic control. Future interventional studies should investigate whether strategies to slow axial elongation (e.g., optical interventions) or treat microalbuminuria (e.g., with angiotensin-converting enzyme inhibitors) can mitigate the decline in GCIPL and prevent or delay DRN.
However, there are some limitations to our research that need to be considered. First, this study included only community-dwelling patients with T2DM, mostly without DR, and the DR subgroup was relatively small. Therefore, caution is warranted when generalizing our findings to Type 1 DM, hospital-based populations, or patients with more severe retinopathy. Second, the attrition rate was 29.3%, and excluded participants had worse metabolic control and more advanced DR than those included (Table 1), which may have introduced selection bias and underestimated the true rate of decline in GCIPL. Third, our dataset lacked information on several potential confounders, including specific hypoglycemic agents, detailed DR staging, and history of intravitreal injections, which may introduce residual confounding effects. Fourth, the definition of fast progression (a GCIPL thinning rate ≥ 1 μm/year) was adapted from glaucoma studies[20]; its clinical applicability to diabetic cohorts without glaucoma requires validation in future studies. Finally, the inverse association between baseline GCIPL thickness and its rate of decline may be influenced by regression to the mean, though its consistency across subgroups and biological plausibility suggest that it is not purely a statistical artifact.
-
In conclusion, this study represents the largest investigation to date of the factors associated with DRN. A comprehensive analysis of both ocular and systemic confounding elements reveals a causal relationship between the previously identified risk factors and the damage observed in the GCIPL. These findings underscore the importance of considering baseline GCIPL thickness, AL, visual acuity, and microalbuminuria as crucial predictive factors for the progression of GCIPL damage in DRN.
-
The study followed the principles of the Declaration of Helsinki and was approved by the Ethics Committee of Zhongshan Ophthalmic Center, Sun Yat-sen University (Approval ID: 2017KYPJ094, date of approval: October 25, 2017). Written informed consent was obtained from all participants.
-
The authors confirm their contributions to the paper as follows: designed the study and performed the statistical analysis: Guo X, Yang H; interpreted the data: Gong X, Zhang Y; interpreted the findings and drafted the manuscript: Zhang Y, Liu K, Chen Z, Xu Z; supervised the study: Yang H, Huang W, Guo X. All authors reviewed the results and approved the final version of the manuscript.
-
The data that support the findings of this study are available from the corresponding author upon reasonable request.
-
This research was supported by the National Natural Science Foundation of China (82171084, 82000901, 81900866, 81870656), the Guangzhou Science & Technology Plan of Guangdong Pearl River Talents Program (202102010162), the Natural Science Foundation of Guangdong Province of China (2017A030313610), and the Fundamental Research Funds of the State Key Laboratory of Ophthalmology (303060202400362, 91017-32030001).
-
All authors declare no conflicts of interest related to this study.
-
accompanies this paper online at: https://doi.org/10.48130/vns-0026-0027.
-
# Authors contributed equally: Yurong Zhang, Kaiqun Liu, Zitong Chen
- Supplementary Table S1 Clinical characteristics factors contributing to the changes in macular ganglion cell layer-inner plexiform layer thickness over time in NDR participants by multivariable linear regression analysis.
- Supplementary Table S2 Clinical characteristics factors contributing to the changes in macular ganglion cell layer-inner plexiform layer thickness over time in DR participants by multivariable linear regression analysis.
- Copyright: © 2026 by the author(s). Published by Maximum Academic Press, Fayetteville, GA. This article is an open access article distributed under Creative Commons Attribution License (CC BY 4.0), visit https://creativecommons.org/licenses/by/4.0/.
-
About this article
Cite this article
Zhang Y, Liu K, Chen Z, Xu Z, Gong X, et al. 2026. Changes in the ganglion cell–inner plexiform layer in diabetic patients imaged by optical coherence tomography: a three-year prospective cohort study. Visual Neuroscience 43: e032 doi: 10.48130/vns-0026-0027 

Changes in the ganglion cell–inner plexiform layer in diabetic patients imaged by optical coherence tomography: a three-year prospective cohort study
- Received: 28 October 2025
- Revised: 03 April 2026
- Accepted: 10 April 2026
- Published online: 10 July 2026
Abstract: This prospective observational cohort study aimed to identify predictive factors for the progression of ganglion cell–inner plexiform layer (GCIPL) thinning in patients with Type 2 diabetes mellitus (T2DM). In total, 2,123 consecutive patients with T2DM were included and followed up for three years. All participants underwent 3 mm × 3 mm optical coherence tomography (OCT) imaging centered on the macula. After image quality control, data from 1,500 patients (1,500 eyes) were analyzed. Longer baseline axial length (AL), higher baseline intraocular pressure, poorer baseline best corrected visual acuity (BCVA), greater baseline macular retinal thickness, greater baseline macular GCIPL thickness, and a wider glycated hemoglobin (HbA1c) fluctuation range were associated with a higher rate of decline in GCIPL (p < 0.001). In the final multivariate regression model, longer AL (β = −0.187; 95% confidence interval [CI]: −0.255 to −0.120 mm/year; p < 0.001), poorer baseline BCVA (β = −0.201; 95% CI: −0.271 to −0.130; p < 0.001), greater baseline macular retinal thickness (β = −0.126; 95% CI: −0.198 to −0.054 μm/year; p = 0.001), greater baseline macular GCIPL thickness (β = −0.305; 95% CI: −0.376 to −0.235 μm/year; p < 0.001), and more microalbuminuria (β = −0.069; 95% CI: −0.136 to −0.002 mg/ml/year; p = 0.045) were independently associated with a higher rate of GCIPL decline. These factors are major predictors of GCIPL loss in T2DM and should be considered when interpreting GCIPL measurements in clinical practice and research.