













-
The mitochondria are the "powerhouse" of higher plant cells, supplying adenosine triphosphate (ATP) via oxidative phosphorylation while regulating reactive oxygen species (ROS) metabolism, participating in stress signaling, and mediating nucleo-cytoplasmic genetic exchange[1]. Compared with animals, plants' mitochondrial genomes (mitogenomes) are highly complex, often forming multibranched circular structures mediated by long repeats, accompanied by frequent homologous recombination and dynamic rearrangements. Mitochondrial–plastid transfer fragments (MTPTs) can integrate plastid-derived tRNAs or functional genes into mitogenomes, increasing genomic heterogeneity and potentially providing a basis for enhanced energy metabolism and functional innovation[2−4]. However, early short-read sequencing and conventional polymerase chain reaction (PCR) could not fully cover long repeats and structural heterogeneity, making comprehensive resolution of these complex features challenging. Recent advancements in PacBio high-fidelity (HiFi) sequencing have enabled the complete assembly of complex plant mitogenomes, including the single circular chromosome of Arabidopsis thaliana[5] and the multichromosomal genome of Angelica biserrata[6]. Analyses based on this technology have revealed that reported Fabaceae mitogenomes exhibit high complexity: Most species contain abundant repeats and MTPTs and can adopt single or multiple circular conformations. In particular, MTPTs occur frequently in Papilionoideae, facilitating gene acquisition and functional innovation[7,8]. For example, Astragalus membranaceus displays a dual circular structure, whereas Lotus corniculatus exhibits a single circular genome. Nevertheless, the number of sequenced Fabaceae mitogenomes remains limited, preventing comprehensive elucidation of their structural evolution and functional diversity.
The genus Sophora (Fabaceae) comprises over 70 shrubs or small trees distributed across temperate to subtropical regions. S. alopecuroides occurs in Central Asia (Pakistan, Iran) and the northwestern arid regions of China[9] and represents a perennial species of both ecological and medicinal significance. Its whole plant and seeds, rich in quinolizidine alkaloids and flavonoids, exhibit heat-clearing, antitumor, anti-inflammatory, and antimicrobial activities through the NF-κB/ROS/mitochondrial apoptosis pathways[10−13]. However, its mitochondrial genome has not yet been characterized[14,15].
Here, we used PacBio Sequel II Circular Consensus Sequencing (CCS) sequencing to generate the first complete mitogenome of S. alopecuroides. Our objectives included: (1) characterizing the long-repeat architecture (long terminal repeats [LTRs], tandem repeats) with MISA/REPuter/Tandem Repeats Finder to resolve the multibranched genome topology; (2) identifying MTPTs via BLASTn to assess the effects of plastid gene transfer on energy metabolism (e.g., tRNA dosage effects); (3) analyzing codon usage bias using EMBOSS(CUSP&CHIPS)/MEGA to associate AT-enriched patterns with drought-adaptive translational efficiency; and (4) performing a collinearity analysis with MCScanX/TBtools-II on closely related species to locate rearrangement hotspots (e.g., atp4–rps1) and detect positive selection in stress-related genes (atp4, ccmB) using Ka/Ks_Calculator v2.0. This work aimed to provide insights into the role of the mitochondria in plants' adaptive evolution and Fabaceae's phylogeny.
-
Fresh leaves were collected from Alar City, Xinjiang (40°5′6″ N, 81°5′3″ E), rapidly frozen in liquid nitrogen, and stored at −80 °C until DNA extraction. Voucher specimens (Collection ID: Lbb2020-ale01) were deposited at the Molecular Ecology Lab, Institute of Loess Plateau, Shanxi University. Total DNA was extracted using a modified cetrimonium bromide (CTAB) method[16] with 2% β-mercaptoethanol added to the buffer to inhibit polyphenol oxidation. The purity, integrity, and concentration of DNA were evaluated with a Qubit Fluorometer and via agarose gel electrophoresis. High-quality DNA samples were sent to Biomarker Technologies Co., Ltd. for Illumina short-read and PacBio long-read sequencing.
For Illumina short-read sequencing, DNA was randomly fragmented into 200–500 bp inserts by ultrasonic sonication (Covaris M220, USA), and libraries were constructed using the NEBNext Ultra II DNA Library Prep Kit (New England Biolabs, Ipswich, MA, USA), including end repair, poly-A tailing, adapter ligation, and 12 cycles of PCR amplification with index primers for multiplexing. The libraries were sequenced on an Illumina NovaSeq 6000 platform (San Diego, CA, USA) with 150 bp paired-end reads, yielding 22.8 Gb of raw data. After quality filtering with fastp v0.19.5, 22.3 Gb of clean reads was retained, providing an average genome coverage of 250×.
For PacBio long-read sequencing, genomic DNA was sheared to 15–18 kb fragments, end-repaired, and ligated with stem-loop adapters. After circularization, the library was sequenced on a PacBio Revio platform (one 25M SMRT cell, 24 h). Raw data were processed via SMRT Link v12.0 to generate 1.9 million HiFi reads (mean length: 18.7 kb, Q32), totaling ~35 Gb (~35× coverage). These HiFi reads were used for genome assembly and variant calling.
Mitochondrial and chloroplast genome assembly and annotation
-
HiFi reads were used to assemble the mitogenome of S. alopecuroides via PMAT software (version 1.5.3)[17] with the "autoMito" model, using the parameters as "-st HiFi -g 1200M". The genome size was estimated by k-mer analysis of the Illumina clean reads. The initial assembly sequence was visualized using Bandage software (version 0.8.1)[18] to detect repetitive regions, which were manually adjusted to produce a circular contig. The chloroplast genome was assembled separately from the Illumina clean reads using Getorganelle software (version 1.7.7)[19]. Mitogenome annotation was performed using PMGA (
http://47.96.249.172:16084/index.html ) and GeSeq tools (MPI-MP CHLOROBOX - GeSeq), with the mitogenomes of Arabidopsis thaliana and eight Fabaceae species downloaded from National Center for Biotechnology Information (NCBI) as the reference sequences. The chloroplast genome was annotated with GeSeq. Transfer RNA (tRNA) and ribosomal RNA (rRNA) were annotated using tRNAscan-SE (version 1.4)[20] and BLASTN software (version 2.16.0)[21], respectively. Annotation information was visualized with Geneious Prime software (version 2025.0.2)[22] for manual correction. The mitogenome map was generated using GeSeq tools (MPI-MP CHLOROBOX - OGDRAW), including both cis- and trans-splicing genes. The accession number for the S. alopecuroides mitogenome has been deposited in GenBank (Table 1).Table 1. General features of nine Fabales mitogenomes.
Species Accession no. Size (bp) GC% GC1 GC2 GC3 ENC Genes tRNAs rRNAs Protein-coding
genesEchinosophora koreensis NC_072933.1 519,841 44.49% 44.37% 44.45% 44.66% 58.08% 56 16 3 37 Glycine soja NC_039768.1 402,545 45.03% 44.84% 45.32% 44.93% 58.20% 49 14 2 33 Lupinus albus MW448461.1 405,579 44.67% 44.92% 44.44% 44.64% 57.99% 51 15 3 33 Robinia pseudoacacia MW448465.1 396,058 45.24% 45.20% 45.38% 45.15% 58.23% 53 17 3 33 Sophora alopecuroides PV765881.1 528,911 44.92% 44.95% 44.98% 44.84% 58.07% 55 19 3 33 Sophora flavescens NC_043897.1 494,369 44.86% 45.00% 44.74% 44.85% 58.02% 51 16 3 32 Styphnolobium japonicum cv. 'JinhuaiJ2' NC_039596.1 484,916 45.45% 45.52% 45.24% 45.58% 58.36% 56 21 3 32 Suriana maritima NC_081511.1 458,738 43.47% 43.67% 43.51% 43.22% 57.81% 61 20 3 38 Trifolium pratense NC_048499.1 301,823 45.20% 45.07% 45.42% 45.12% 58.63% 50 15 3 32 Comparison and analysis of nine Fabales species' mitogenomes
-
To evaluate the selective pressure on protein-coding genes (PCGs) in S. alopecuroides and eight related species (Echinosophora koreensis, Glycine soja, Lupinus albus, Robinia pseudoacacia, Sophora flavescens, Styphnolobium japonicum cv. 'JinhuaiJ2', Trifolium pratense, and Suriana maritima), homologous PCGs were extracted using PhyloSuite software (version 1.2.3)[23], yielding 25 shared genes (atp1, atp4, atp6, atp8, atp9, ccmB, cox1, cox2, cox3, cob, matR, nad1, nad2, nad3, nad4, nad5, nad6, nad7, nad9, rpl5, rpl16, rps4, rps10, rps12, and rps14). The sequences were then aligned with MEGA (version 11.0.13)[24]. Nonsynonymous/synonymous (Ka/Ks) ratios for each gene were calculated with KaKs_calculator (version 2.0)[25] using the following parameters: Genetic code Table 11 (bacterial and plant plastid code) and the YN method (the method proposed by Yang and Nielsen). In cases where Ks = 0 (i.e., no substitutions or 100% identity), resulting in a Ka/Ks value of "not applicable" (NA), we replaced NA with 7.0 for visualization purposes. The final results were plotted as a boxplot using Origin 2024 software[26].
Analysis of codon usage bias
-
Protein-coding sequences were extracted using Phylosuit v1.2.3[23]. Codon usage bias was assessed in MEGA v11.0.13[24] by calculating the relative synonymous codon usage (RSCU) for mitogenomic protein-coding genes. GC content and the effective number of codons (ENC), which measures deviation from random codon usage[27], were computed using the online tools EMBOSS CUSP (
www.bioinformatics.nl/cgi-bin/emboss/cusp ) and CHIPS (www.bioinformatics.nl/cgi-bin/emboss/chips ). A two-dimensional scatter plot was generated in Microsoft Excel 2021, with ENC on the y-axis and GC3 (guanine–cytosine content at the third codon position) on the x-axis, overlaid with a standard curve of ENC = 2 + GC3 + 29/[GC32 + (1 − GC3)2]. Each gene was plotted to visualize the relationship between codon bias and the genomic base composition: Points above or near the curve indicate mutation-driven bias, whereas points below suggest the influence of selection or other factors[28].Analysis of repeat fragments and prediction of RNA editing sites
-
Simple sequence repeats (SSRs) were identified using the MISA online tool (
https://webblast.ipk-gatersleben.de/misa )[29] with minimum repeat thresholds of 10 for mononucleotides, 5 for dinucleotides, 4 for trinucleotides, and 3 for tetra-, penta-, and hexanucleotides. Dispersed repeats, including forward, palindromic, reverse, and complementary repeats, were detected using REPuter (https://bibiserv.cebitec.uni-bielefeld.de/reputer )[30] (minimum = 30 bp, Hamming distance = 3). Tandem repeats were detected by Tandem Repeats Finder (https://tandem.bu.edu/trf/trf.html )[31] with the alignment parameters set to 2 (match) and 7 (mismatches/indels). The results were visualized using Origin 2024[26]. To identify RNA editing sites, we employed DeepRed-Mt[32], a convolutional neural network (CNN)-based tool for predicting C-to-U RNA editing, on all mitochondrial protein-coding genes extracted from the mitogenome. High-confidence editing sites were defined as those with predicted probabilities > 0.9, and these were subsequently integrated with PREPACT3[33] (E-value cutoff = 0.001;www.prepact.de ) for comprehensive analysis.Identification of homologous fragment and collinear analysis
-
Following mitogenome analysis, the interorganellar homology between the chloroplast (previously assembled using GetOrganelle (version 1.7.7)[19] and annotated via GeSeq) and the mitogenomes of S. alopecuroides was analyzed using BLASTN with the parameters as "-evalue 1e-6". Homologous fragments were visualized using TBtools-II (version 2.210)[34]. For evolutionary analysis, BLASTN results were used to generate a multiple synteny plot of S. alopecuroides against closely related species using MCscanX software[35].
Construction of maximum likelihood tree based on the PCGs
-
Twenty-six complete mitogenome sequences from four orders (Fabales, Malpighiales, Malvales, Rosales) were retrieved from NCBI, including Echinosophora koreensis (NC_072933.1), Eriobotrya japonica (NC_045228.1), Fragaria orientalis (NC_057524.1), Geum urbanum (NC_065221.1), Glycine soja (NC_039768.1), Gossypium hirsutum (NC_027406.1), Hibiscus cannabinus (NC_035549.1), Hippophae salicifolia (PQ653489.1), Lupinus albus (MW448461.1), Malus sieversii (PP873258.1), Photinia serratifolia (NC_065220.1), Populus tomentosa (PP977548.1), Potentilla anserina (ON478170.1), Prunus pseudocerasus (PP968944.1), Prunus salicina (OK563724.1), Pyrus betulifolia (NC_054332.1), Robinia pseudoacacia (MW448465.1), Rosa laevigata (PQ149012.1), Rosa rugosa (PQ474155.1), Rubus chingii (NC_065238.1), Salix variegata (PQ178861.1), Sophora flavescens (NC_043897.1), Sorbus aucuparia (NC_052880.1), Styphnolobium japonicum cv. 'JinhuaiJ2' (NC_039596.1), Suriana maritima (NC_081511.1), and Trifolium pratense (NC_048499.1), with Populus tomentosa (PP977548.1) and Salix variegata (PQ178861.1) designated as outgroups. These, together with the newly sequenced S. alopecuroides mitogenome, were used to construct a phylogenetic tree. PhyloSuite extracted 15 conserved PCGs (atp1, atp4, atp8, atp9, ccmB, cox1, cox2, cox3, cob, matR, nad3, nad4, nad6, nad7, and nad9). These sequences were aligned using MAFFT software (version 7.520) with the default settings[36], after which, the aligned sequences were merged and trimmed using trimAl software (version 1.5.revo) with the "-automated1" parameter[37]. A maximum likelihood tree was inferred using IQ-TREE v2.3.6[38], with 1,000 bootstrap replicates and visualized via FigTree v1.4.4 (
http://tree.bio.ed.ac.uk/software/figtree ). -
On the basis of the HiFi reads' sequencing data, we assembled the S. alopecuroides mitogenome, which formed a "master circle" structure comprising 19 contigs, including six repetitive fragments (Contig 2, Contig 3, Contig 5, Contig 8, Contig 10, Contig 15), wherein four fragments (Contigs 2, 5, 8, and 15) were duplicated twice, one (Contig 10) triplicated, and one (Contig 3) quadruplicated, ultimately forming five distinct sequence circles (pink, yellow, green, blue, purple; Fig. 1a) which were merged into a single "master circle" (Fig. 1b) measuring 528,911 bp with a 44.92% GC content (Table 1). Genomic annotation identified 55 genes: 33 PCGs, 19 tRNA genes, and three rRNA genes (Fig. 1c), with 24 PCGs categorized as core genes, encompassing five ATP synthase (atp1, atp4, atp6, atp8, and atp9), nine nicotinamide adenine dinucleotide (NADH) dehydrogenase (nad1, nad2, nad3, nad4, nad4L, nad5, nad6, nad7, and nad9), four ubiquinol cytochrome c reductase (ccmB, ccmC, ccmFc, and ccmFN), three cytochrome c oxidase (cox1, cox2, and cox3) genes, mttB, matR, and cob, plus nine noncore genes comprising two large (rpl5 and rpl16) and six small (rps1, rps3, rps4, rps10, rps12 and rps14) ribosomal subunits and sdh4 (Table 2). Intron analysis revealed single introns in ccmFc, rps10, rps3, trnG-UCC, trnI-GAU, and trnQ-UUG; three introns in nad4 and nad7; and four introns in nad1, nad2, and nad5. Additionally, the genome harbored two copies of atp1, atp6, trnC-GCA, and trnfM-CAU and three copies of trnQ-UUG.
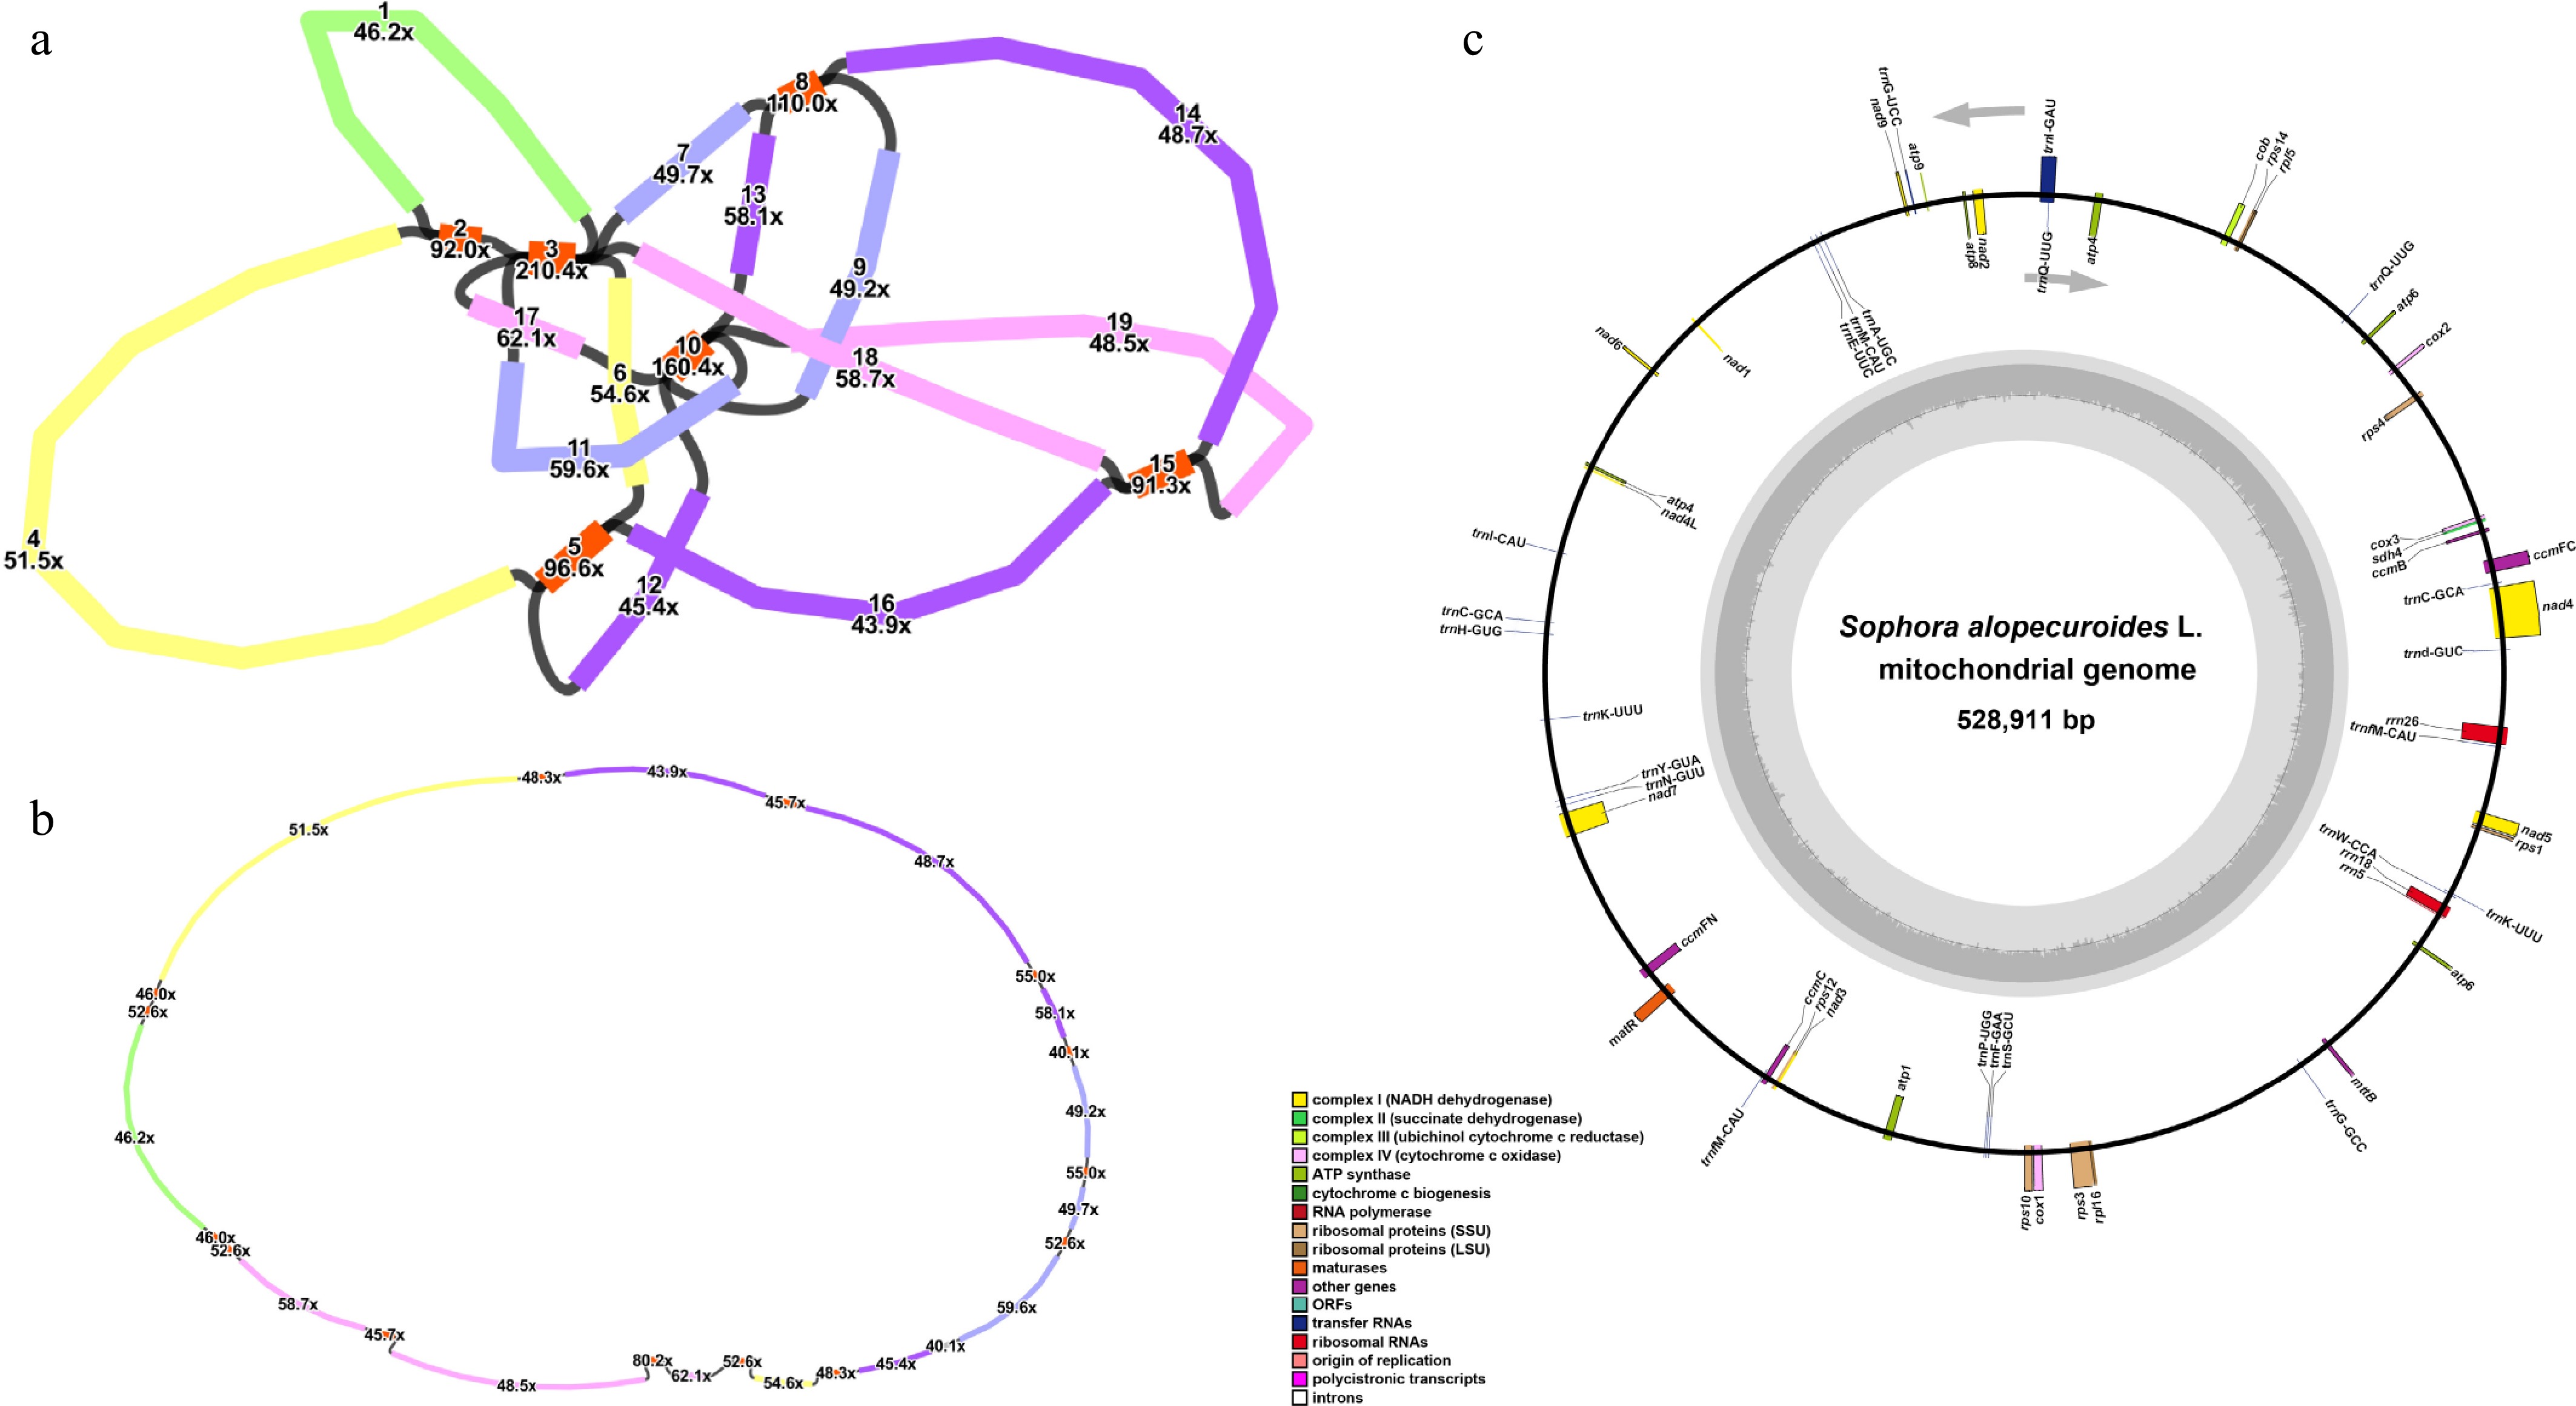
Figure 1.
Assembly and annotation of S. alopecuroides mitogenome. (a) The preliminary assembly graph of the mitogenome, with the contigs numbered separately. The red contigs indicate the repetitive fragments. (b) The structure of the "master circle" after debranching the initial assembly. (c) Mitogenomic annotation. Genes from different functional categories are shown in different colors.
Table 2. Annotated genes in the mitogenome of S. alopecuroides.
Group of genes Name of genes ATP synthase atp1(x2), atp4, atp6(x2), atp8, atp9 NADH dehydrogenase nad1****, nad2****, nad3, nad4***, nad4L, nad5****, nad6, nad7***, nad9 Cytochrome b cob Cytochrome c biogenesis ccmB, ccmC, ccmFc*, ccmFN Cytochrome c oxidase cox1, cox2, cox3 Maturase matR Transport membrane protein mttB Large subunit of ribosome rpl5, rpl16 Small subunit of ribosome rps1, rps3*, rps4, rps10*, rps12, rps14 Succinate dehydrogenase sdh4 Ribosome RNA rrn5, rrn18, rrn26 Transfer RNA trnA-UGC, trnG-UCC*, trnI-GAU*,
trnQ-UUG(x3)*, trnC-GCA(x2), trnD-GUC, trnE-UUC, trnF-GAA, trnG-GCC, trnH-GUG, trnK-UUU, trnI-CAU, trnfM-CAU(x2),
trnM-CAU, trnN-GUU, trnP-UGG, trnS-GCU, trnW-CCA, trnY-GUAGenes with introns are denoted with *. The numbers in brackets represent the copy number of the gene. Comparison of the S. alopecuroides mitogenome with the other eight Fabales species
-
To further explore the evolutionary characteristics of the S. alopecuroides mitogenome, we compared it with eight other Fabales species (E. koreensis, G. soja, L. albus, R. pseudoacacia, S. flavescens, S. japonicum cv. 'JinhuaiJ2', S. maritima, and T. pratense). The coding-region GC content of the nine species ranged from 43.47% (S. maritima) to 45.45% (S. japonicum cv. 'JinhuaiJ2'), with GC1, GC2, and GC3 contents spanning 43.67%–45.52%, 43.51%–45.42%, and 43.22%–45.58%, respectively (Table 1). Notable variations emerged in both the GC content and gene count: S. maritima harbored the highest number of genes (61), whereas G. soja had the fewest (49), with GC content being inversely correlated (lowest in S. maritima, highest in S. japonicum cv. 'JinhuaiJ2'). To assess the impact of environmental stress on mitogenomic evolution, we analyzed nonsynonymous/synonymous mutation ratios (Ka/Ks) for 25 shared PCGs, revealing positive selection (Ka/Ks > 1) in atp4, atp8, ccmB, nad9, rps10, and rps14 (Fig. 2; Supplementary Table S1), which may reflect adaptive evolution in response to distinct ecological pressures.
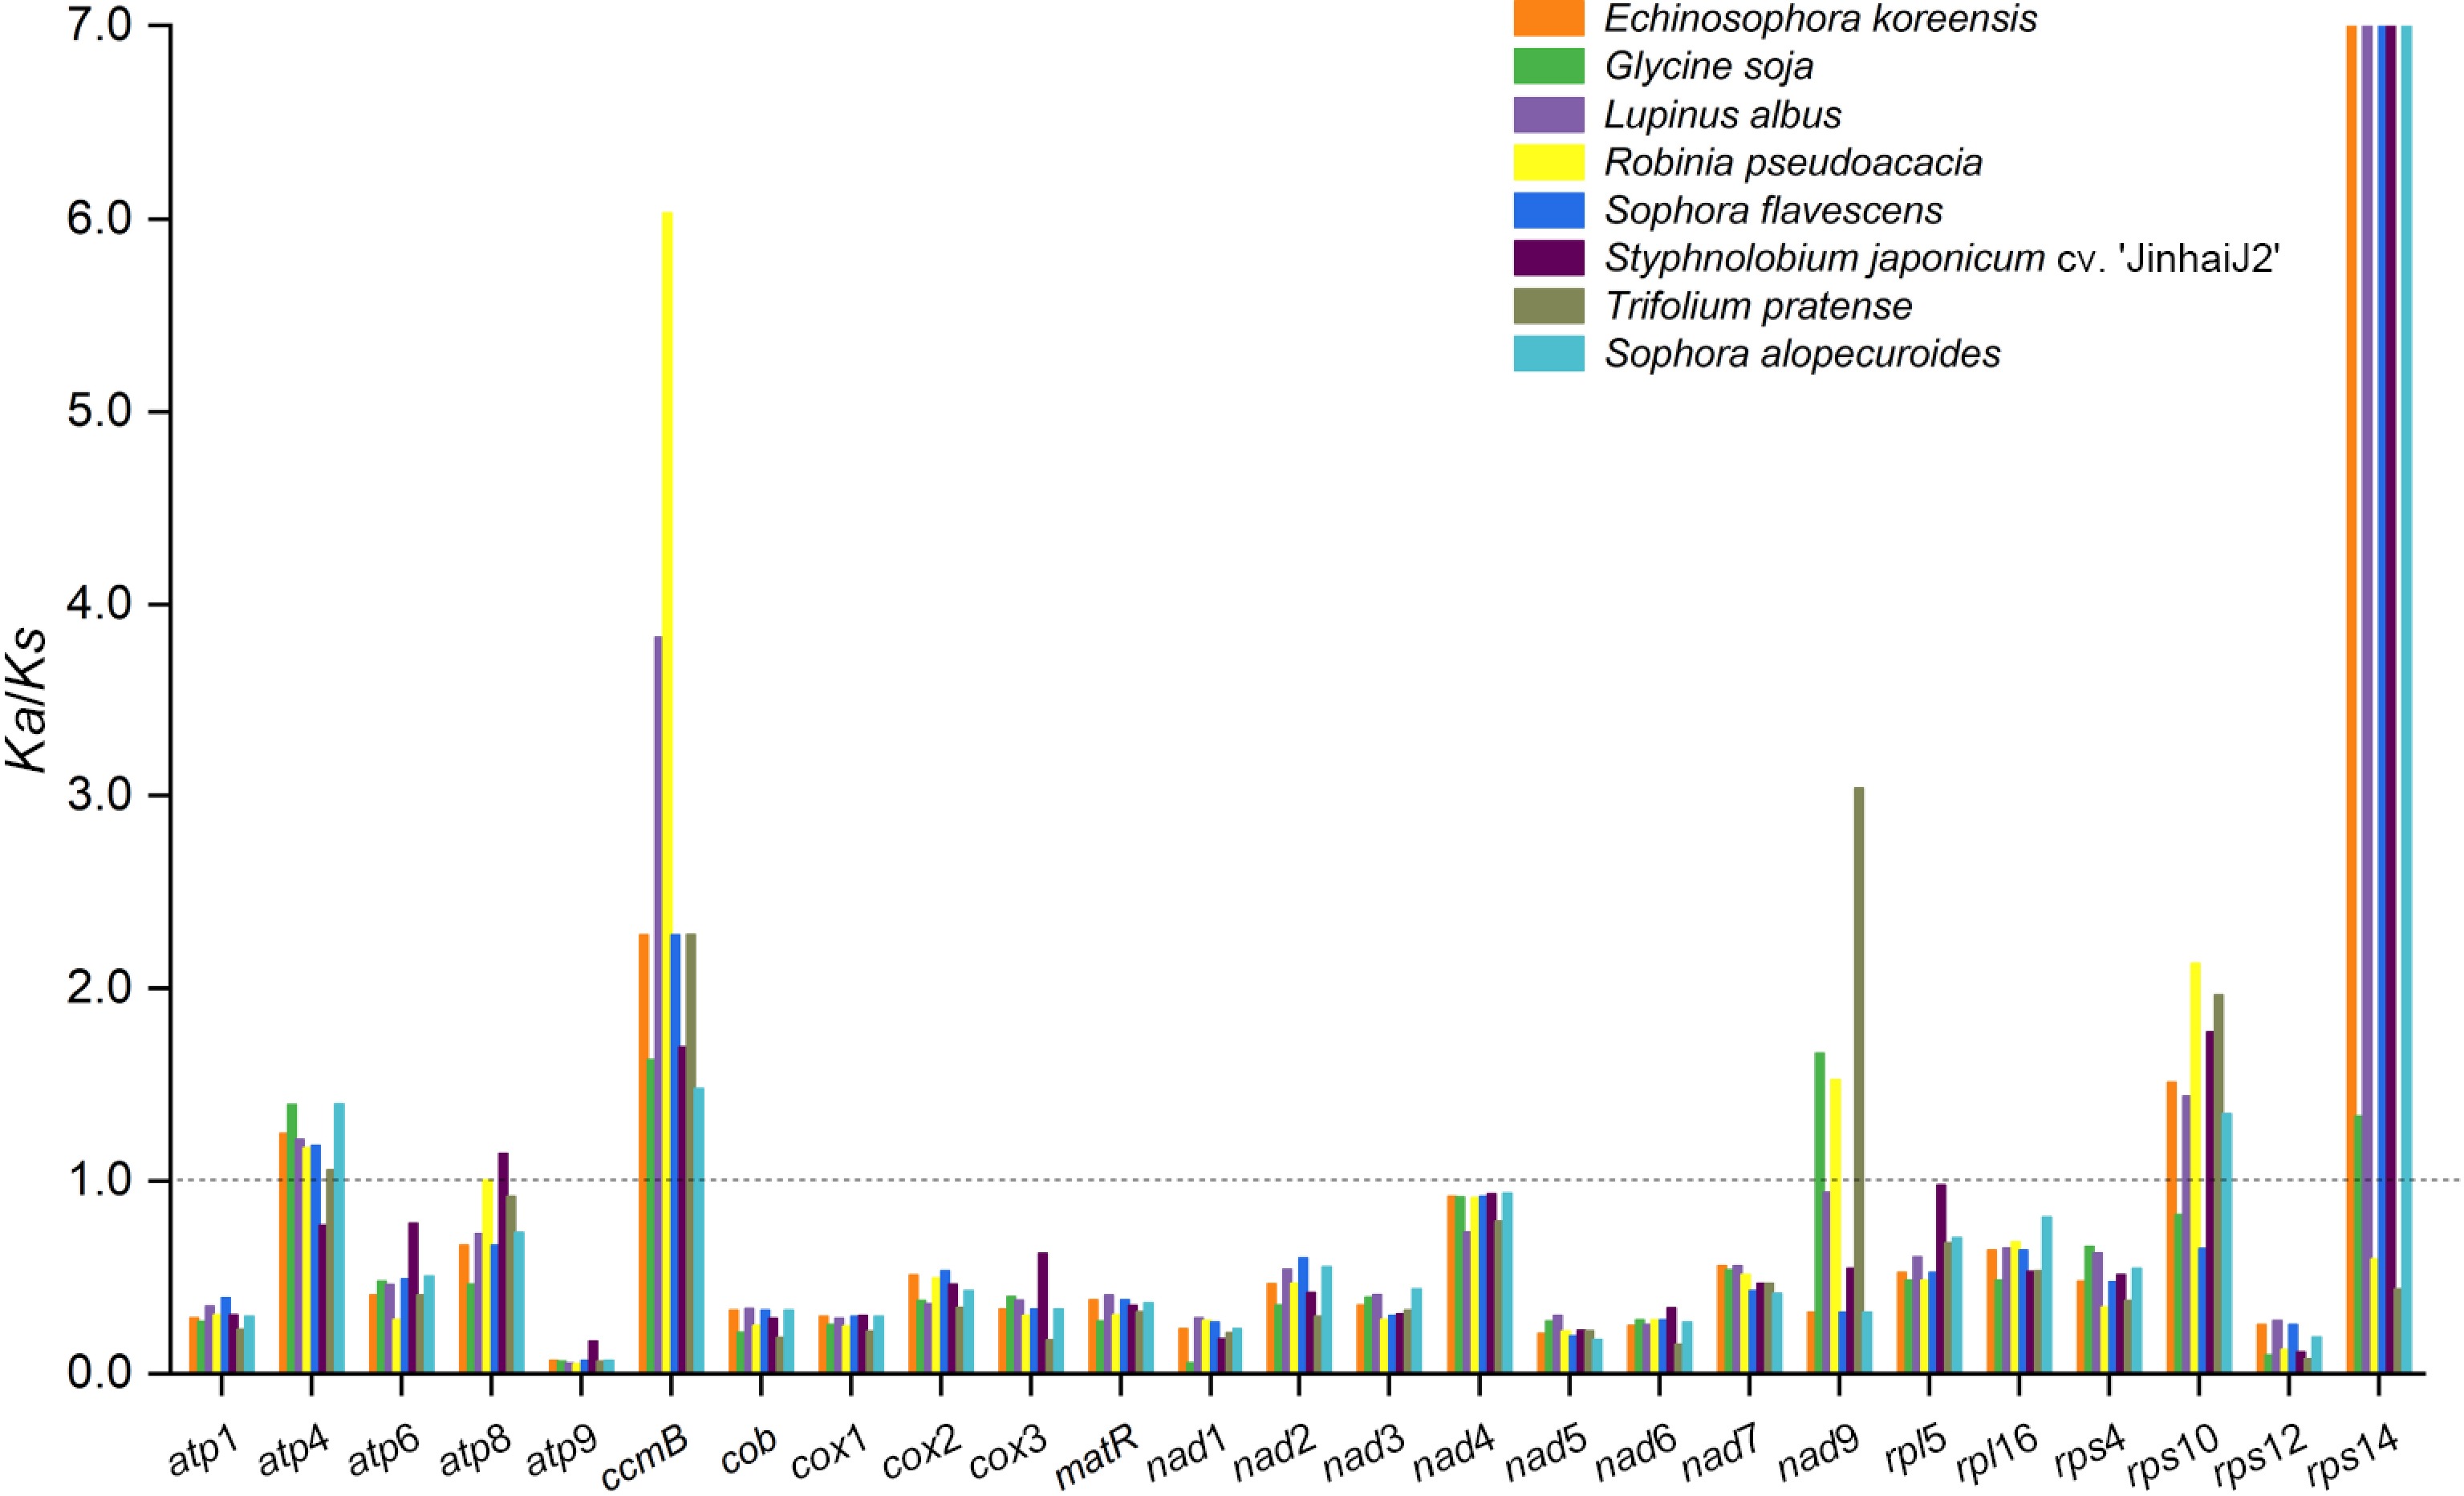
Figure 2.
Ka/Ks ratio calculated for the 25 shared genes from the mitogenome of nine Fabales species. Different species are represented by different colors.
Analysis of relative synonymous codon usage
-
In the S. alopecuroides mitogenome, we identified 10,679 codons in the PCGs (Supplementary Table S2), encoding all 20 amino acids with 61 codons, where UUU was the most frequent (Supplementary Table S3). Leucine had the highest codon count (1,164, ~10.90%), followed by serine (926, ~8.67%), and tryptophan had the lowest (150, ~1.40%). Relative synonymous codon usage (RSCU) analysis revealed 30 codons with RSCU > 1 (higher than expected use), 32 with RSCU < 1, and no bias in methionine (AUG) or tryptophan (UGG) (RSCU = 1), indicating that most amino acids exhibited codon usage bias (Fig. 3). Arginine, leucine, and serine each had six codons. Further analysis of codon usage bias revealed that the GC content at the first, second, and third positions of 33 genes ranged across 35.40%–57.48%, 31.22%–55.17%, and 29.70%–57.25%, respectively (Supplementary Table S4), with all positions averaging < 50% GC, indicating A/T bias and A/T-ending codons. The effective number of codons (ENC) (44.90–61, average: > 35) suggested weak codon bias, consistent with the eight related species (Table 1). ENC-Plot analysis using the ENC and GC3 values (Supplementary Fig. S1) showed that most genes fell below the standard curve, with only six genes (atp4, ccmB, nad9, rpl5, rpl16, and rps3) above it, indicating that selection pressure strongly shapes codon preference in the S. alopecuroides mitogenome.
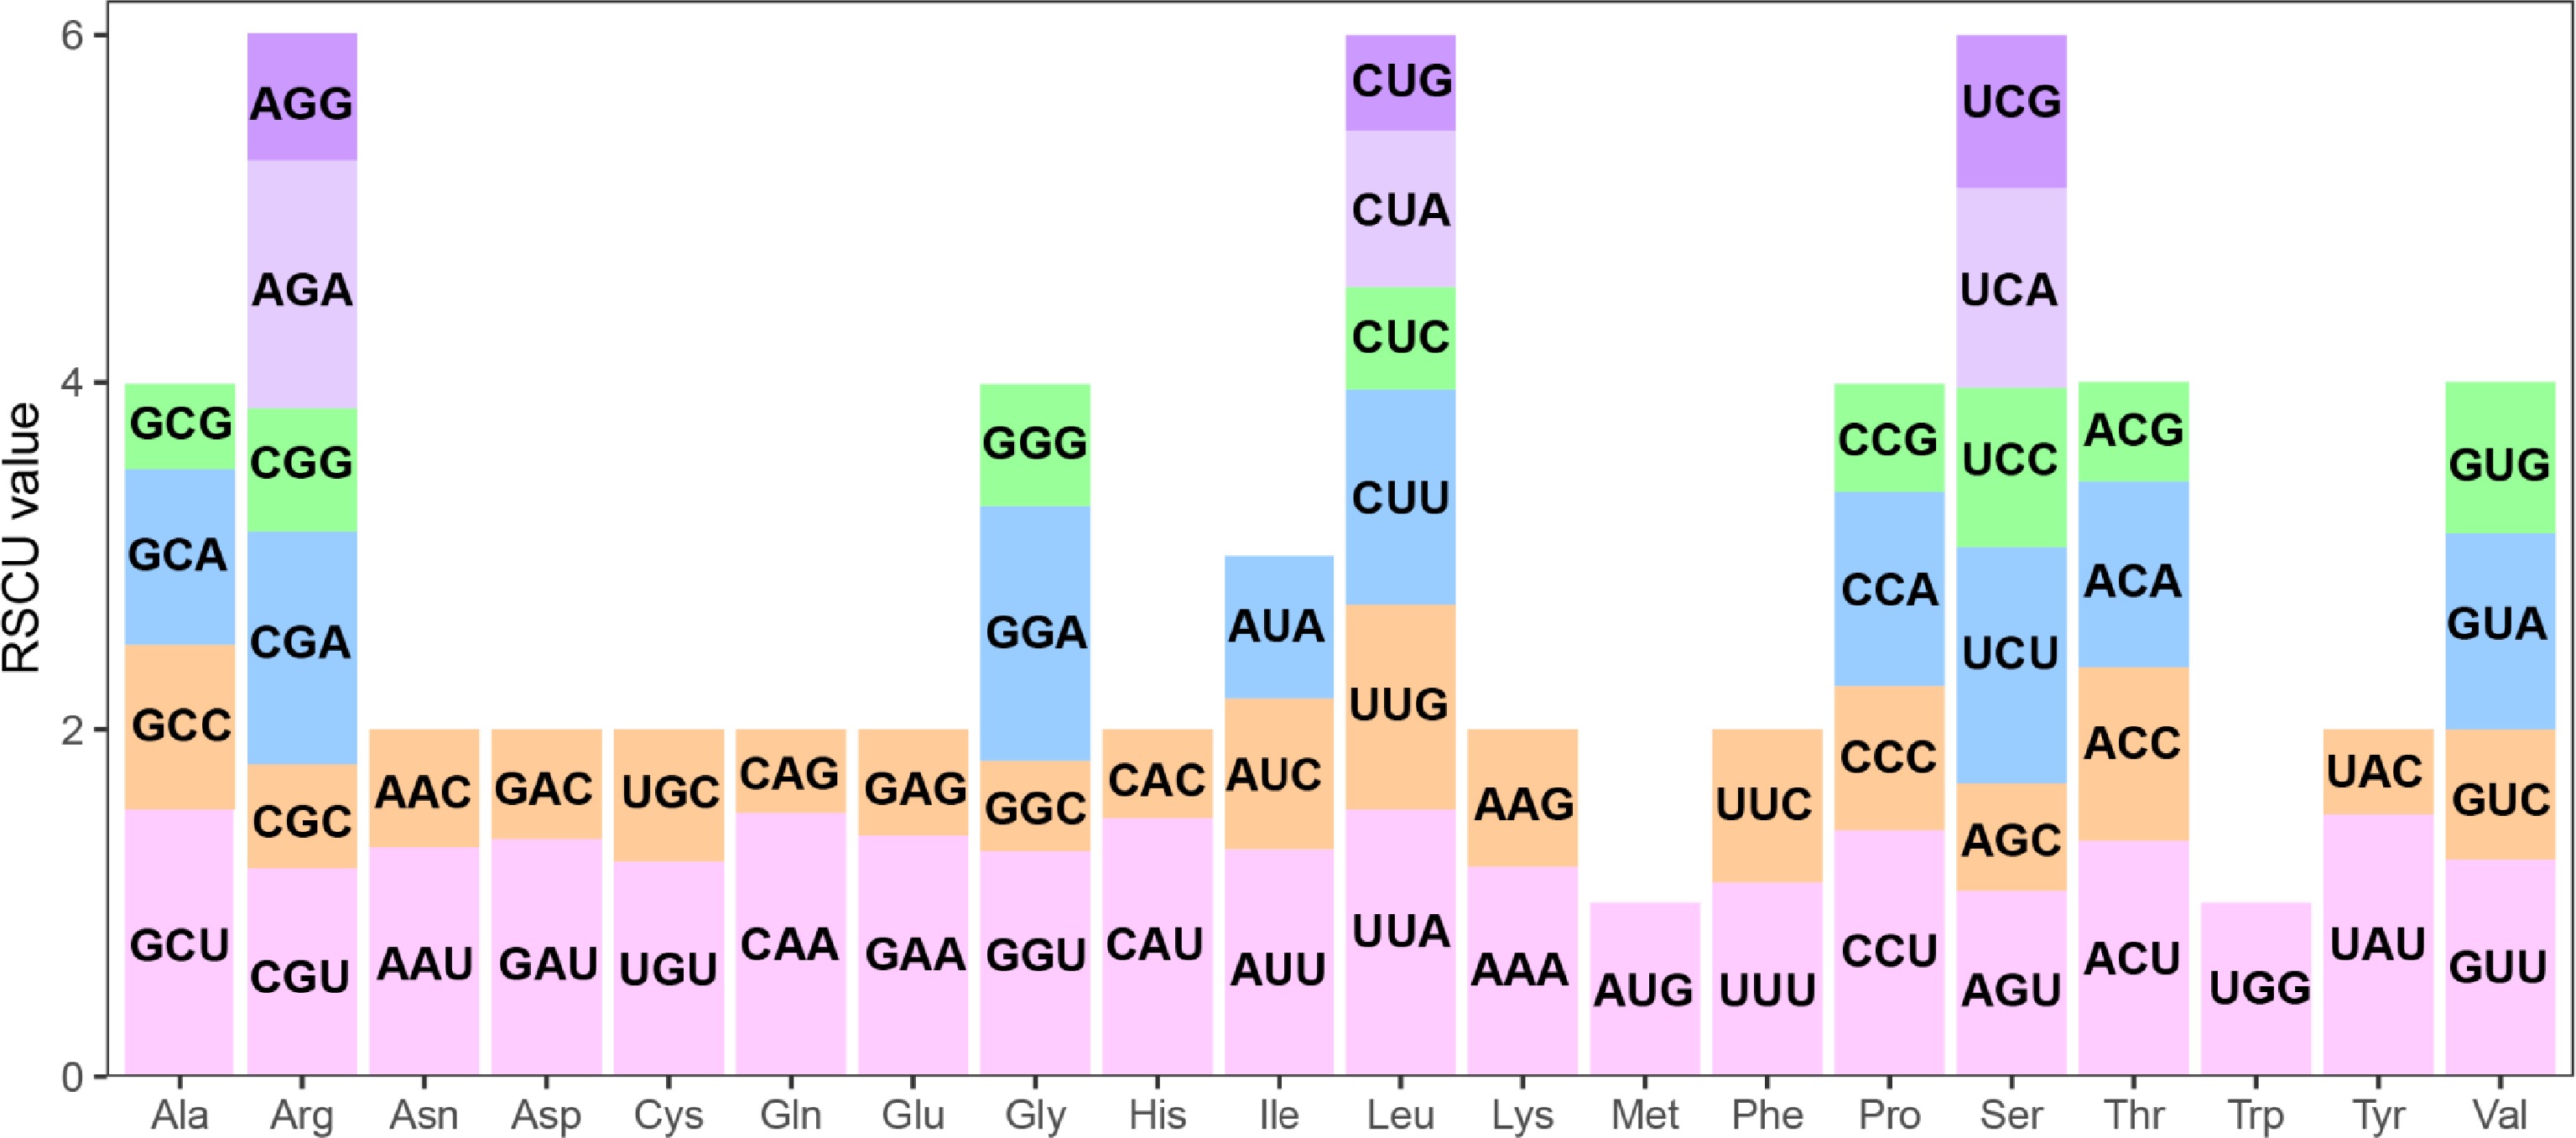
Figure 3.
The relative synonymous codon usage (RSCU) in the S. alopecuroides mitogenome. The x-axis represents the type of amino acid. The y-axis represents the RSCU value. Each amino acid is encoded by multiple codons, represented by differently colored bars in the histogram.
Repeat fragments and prediction of RNA editing events
-
Repetitive sequences are crucial for mitogenome evolution in plants[39]. In S. alopecuroides, 172 SSRs (1–6-bp tandem motifs) were identified, with mononucleotide repeats being the most abundant (59 loci, ~34.30%), followed by tetranucleotides (50 loci, ~29.07%), dinucleotides (33 loci, ~19.19%), trinucleotides (21 loci, ~12.21%), pentanucleotides (8 loci, ~4.65%), and hexanucleotides (1 loci, ~0.58%) (Fig. 4a). Mononucleotide SSRs were dominated by adenine (A, ~50.85%) and thymine (T, ~45.76%) repeats, whereas AT dinucleotide repeats comprised ~33.33% of the dinucleotide SSRs (Supplementary Table S5). Across the nine Fabales species, SSR counts ranged from 87 (G. soja) to 172 (S. alopecuroides), with mono- and tetranucleotides being predominant in all; notably, L. albus contained 26 hexanucleotide repeats, the highest among these species (Fig. 4a; Supplementary Table S6)
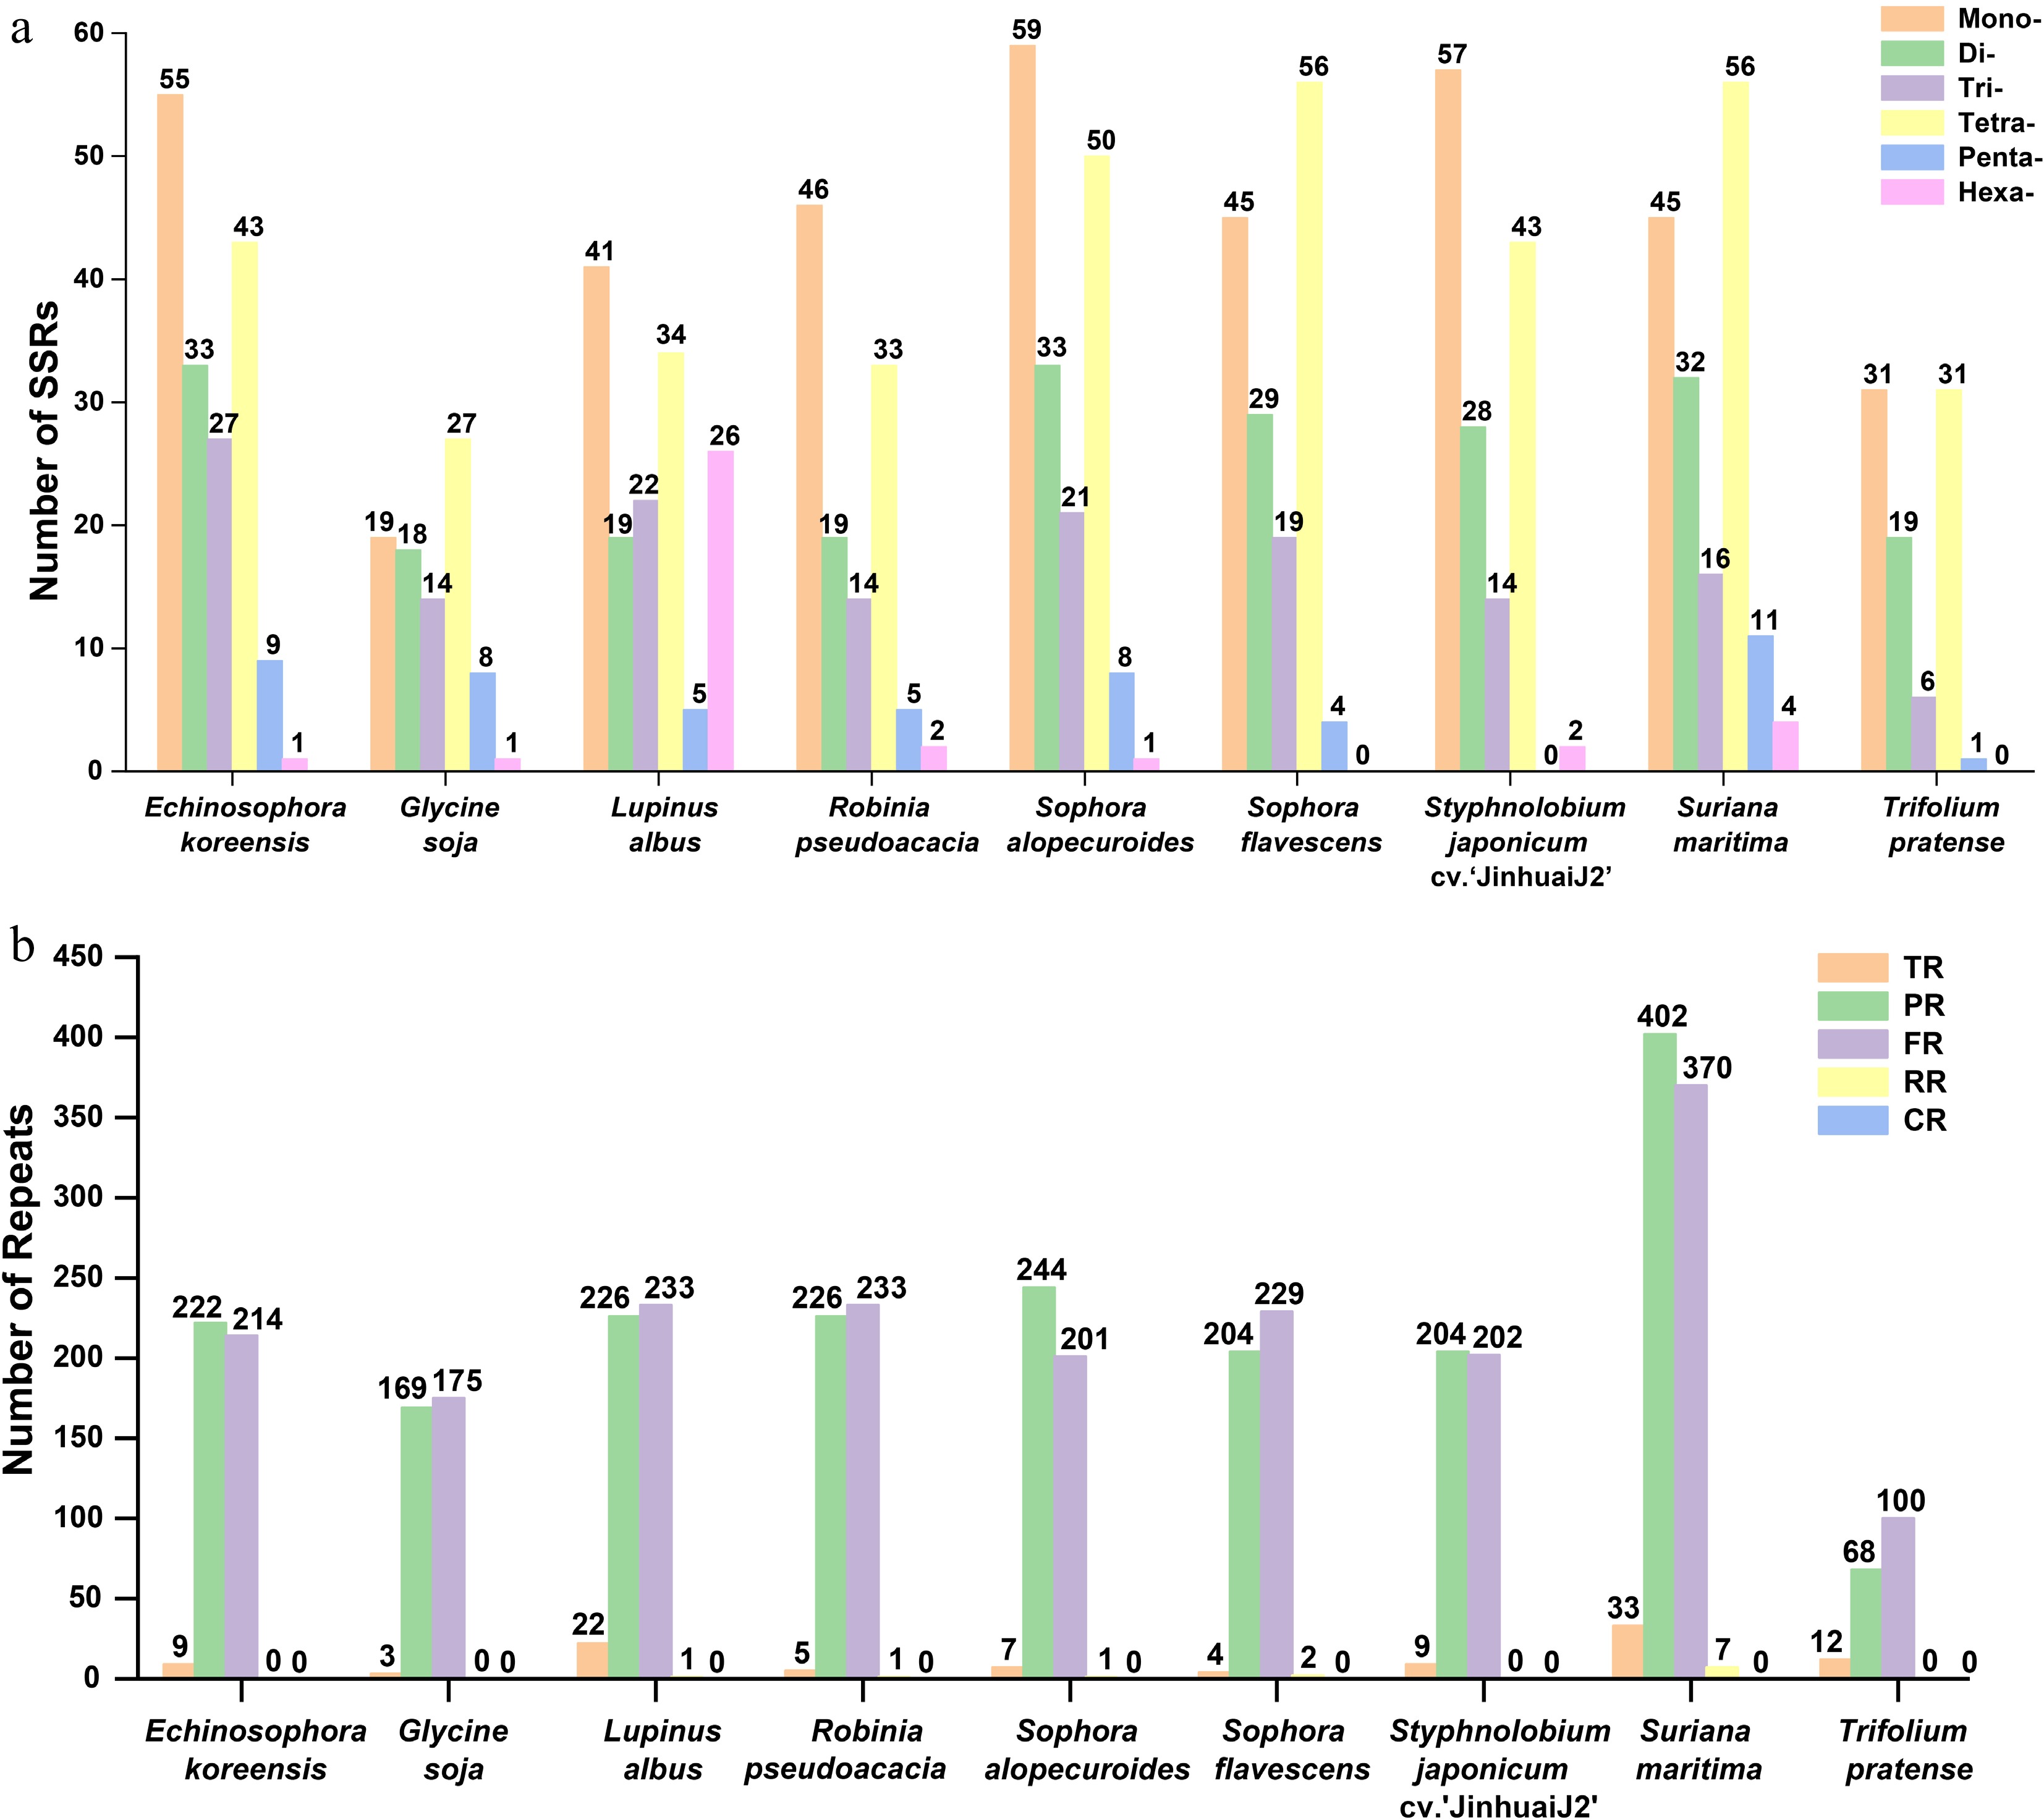
Figure 4.
The simple sequence repeats (SSRs), tandem repeats, and dispersed repeats of the nine Fabales plants. (a) Comparison of the numbers of SSRs among the nine Fabales plants. (b) Comparison of the numbers of tandem repeats and dispersed repeats of the nine Fabales plants. The x-axis shows the different species. Columns with different colors represent different types of repeat units. The number of a particular type of repeat is shown above the corresponding column.
Tandem and dispersed repeats were also analyzed. Tandem repeats counts ranged from 3 to 33, correlating with SSRs' abundance (Supplementary Tables S7 and S8), whereas dispersed repeats counts spanned 168–779. Forward repeats (100–370) were the most frequent, followed by palindromic repeats (68–402); reverse repeats were rare, detected only in L. albus, R. pseudoacacia, S. alopecuroides (1 each), S. flavescens (2) and S. maritima (7), with no complementary repeats identified (Fig. 4b; Supplementary Table S9).
For RNA editing, 506 events were detected in 33 PCGs, predominantly C-to-U conversions (476, ~94.07%; Supplementary Tables S10 and S11). Nad4 had the most editing sites (45), followed by ccmB (35), with ccmC, mttB, nad2, and nad5 each exceeding 30; whereas atp1, atp9, rpl16, rps1, and rps14 had the fewest, with only two or three events (Fig. 5). Editing sites were most frequent at the second codon position (301, ~59.49%), followed by the first (187, ~36.96%), and finally the third position (18, ~3.56%). Edited amino acids showed 40.99% hydrophilic-to-hydrophobic transitions, 9.11% hydrophobic-to-hydrophilic changes, and 36.44% conserved hydrophobicity, potentially contributing to protein stability (Supplementary Tables S10–S12).
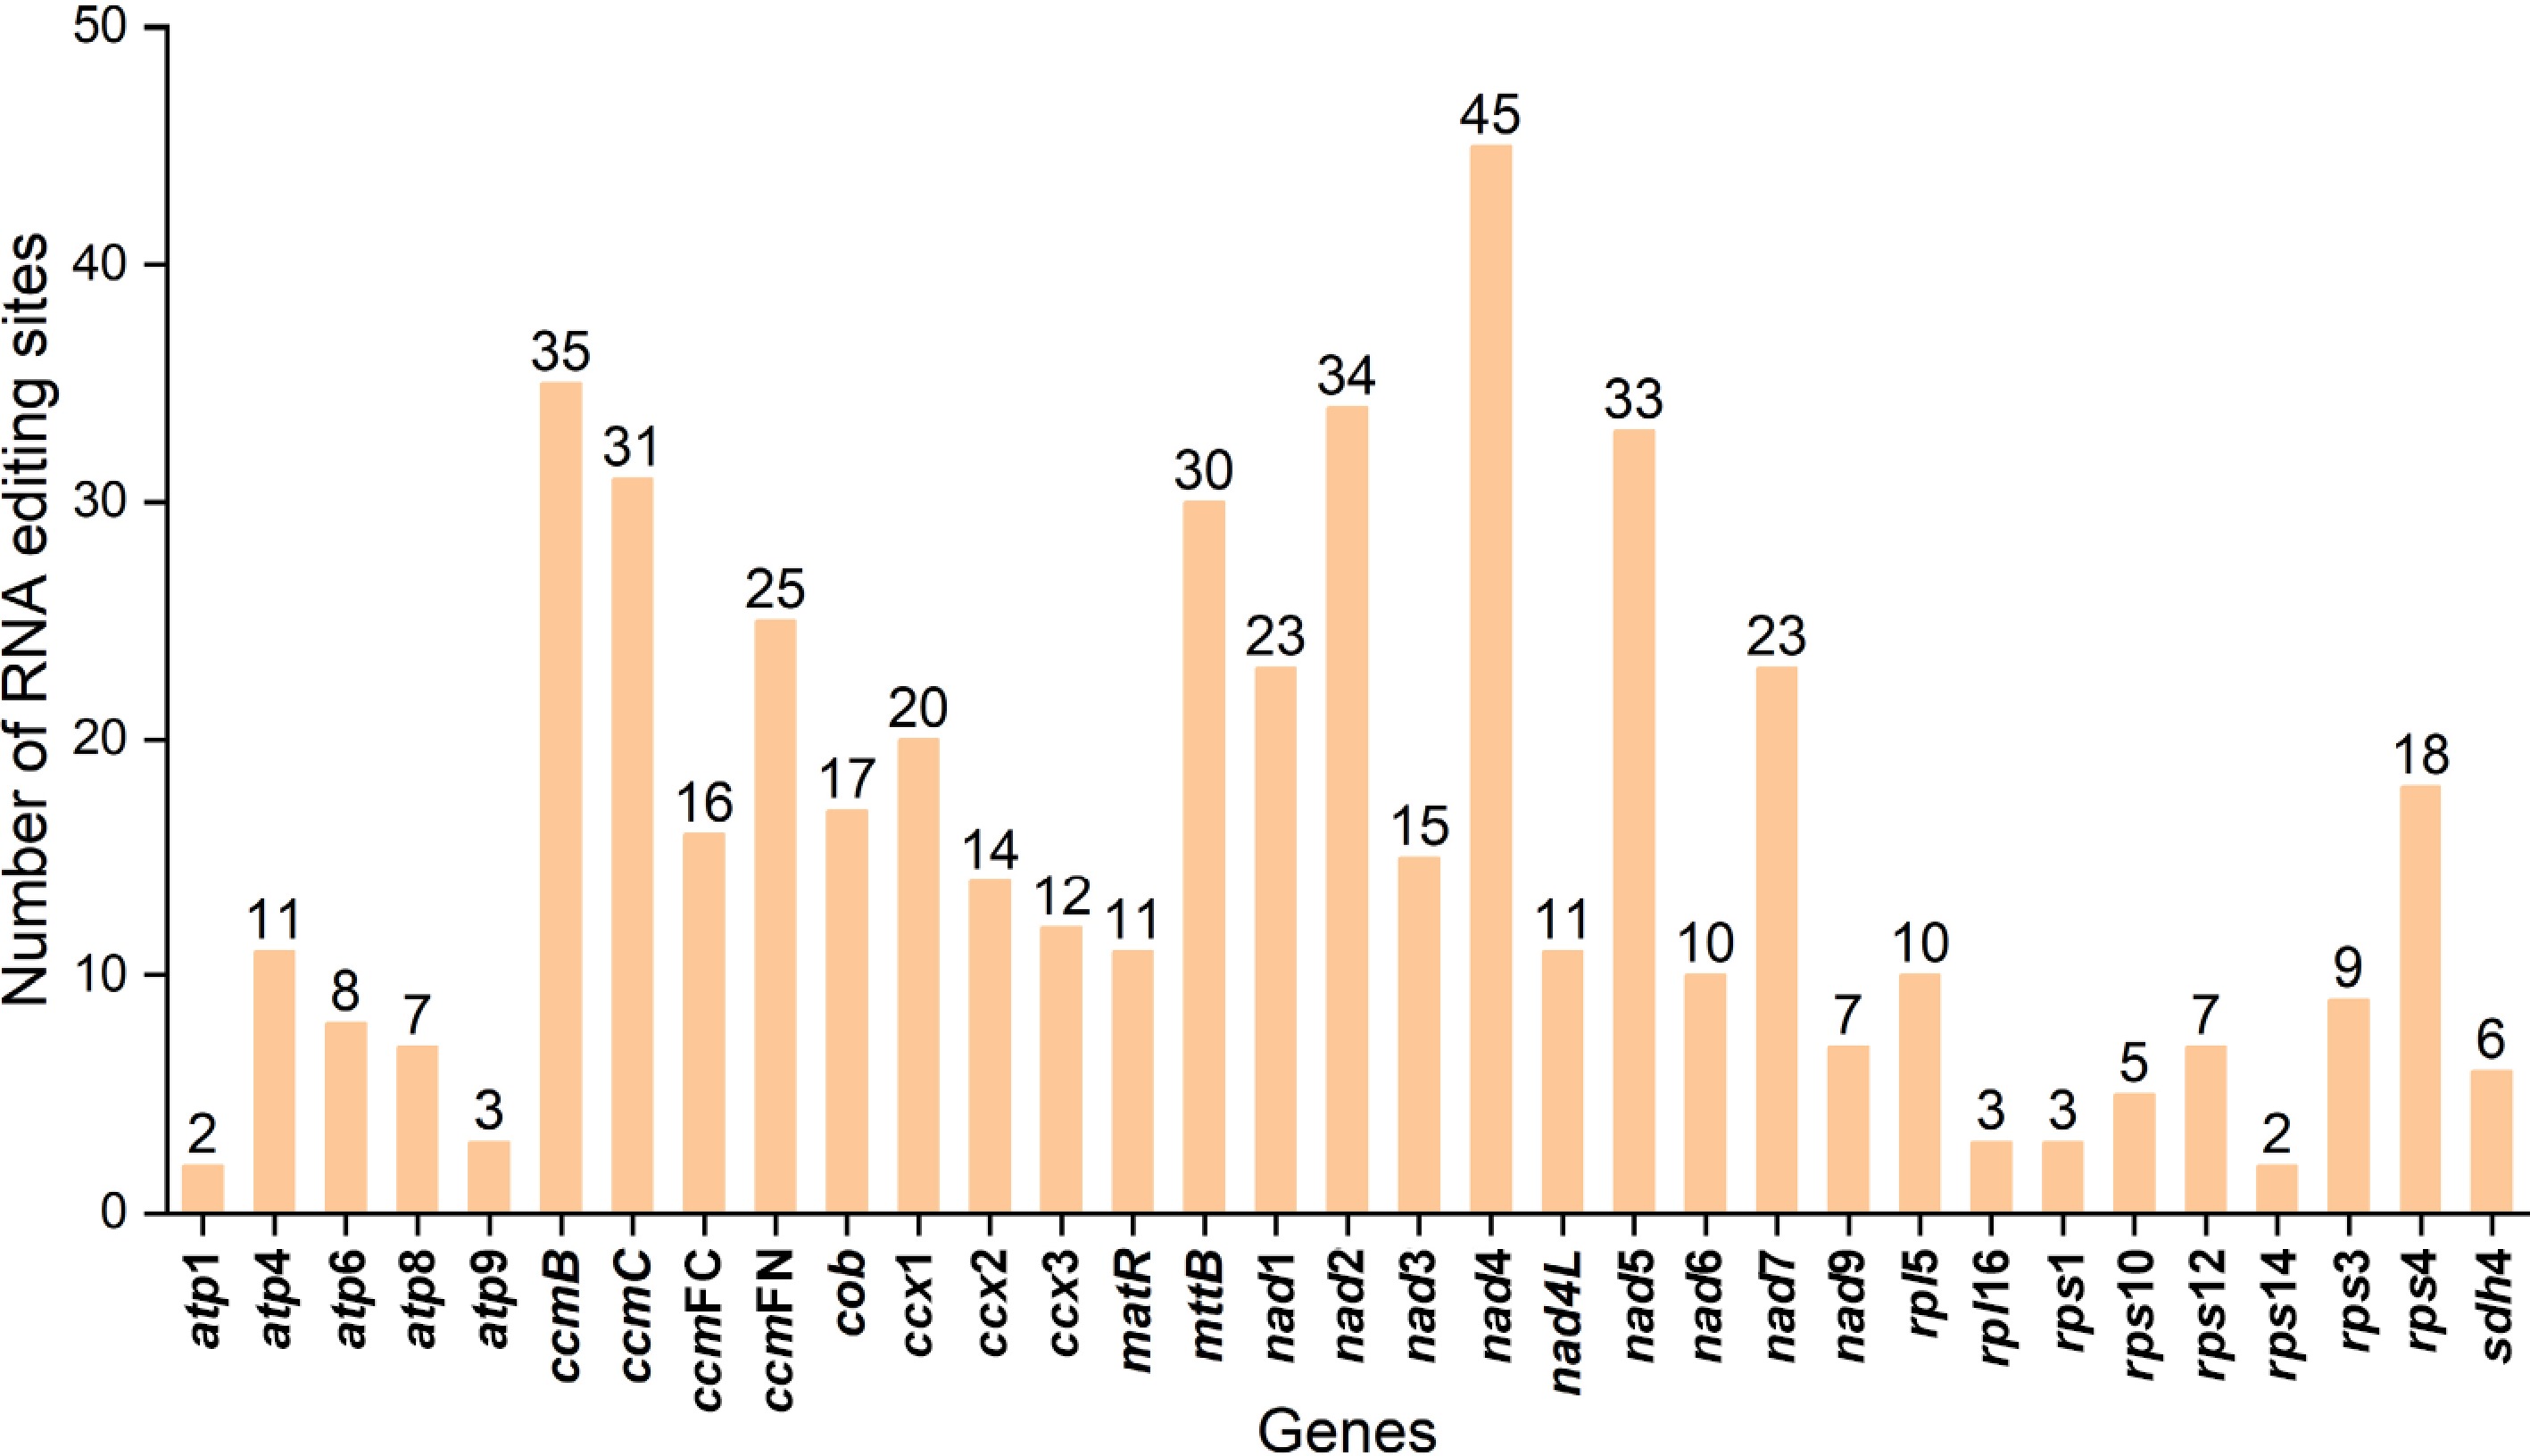
Figure 5.
Prediction of RNA editing sites in the PCGs.
Intracellular gene transfer events in the mitogenome of S. alopecuroides
-
In higher plants, interorganellar gene transfer from the chloroplasts to the mitochondria is well-documented but often yields low-conservation sequences[40]. In S. alopecuroides, we identified 12 homologous chloroplast-to-mitochondria transfer fragments (MTPTs) via sequence similarity analysis (Fig. 6a), spanning 79–2,151 bp (0–184 mismatches; Supplementary Table S13) and collectively comprising 7,482 bp (~1.41% of the mitogenome). These fragments harbor six fully matched chloroplast genes (trnD-GUC, trnH-GUG, trnM-CAU, trnN-GUU, ndhB, and rps7) and five partially matched genes (trnW-CCA, rrn18, psaA, petG, and rbcL), with the two largest fragments (MTPT1/2, 2,151 bp each) likely containing multiple transferred elements, highlighting the dynamic nature of interorganellar gene transfer in plant mitogenomes.
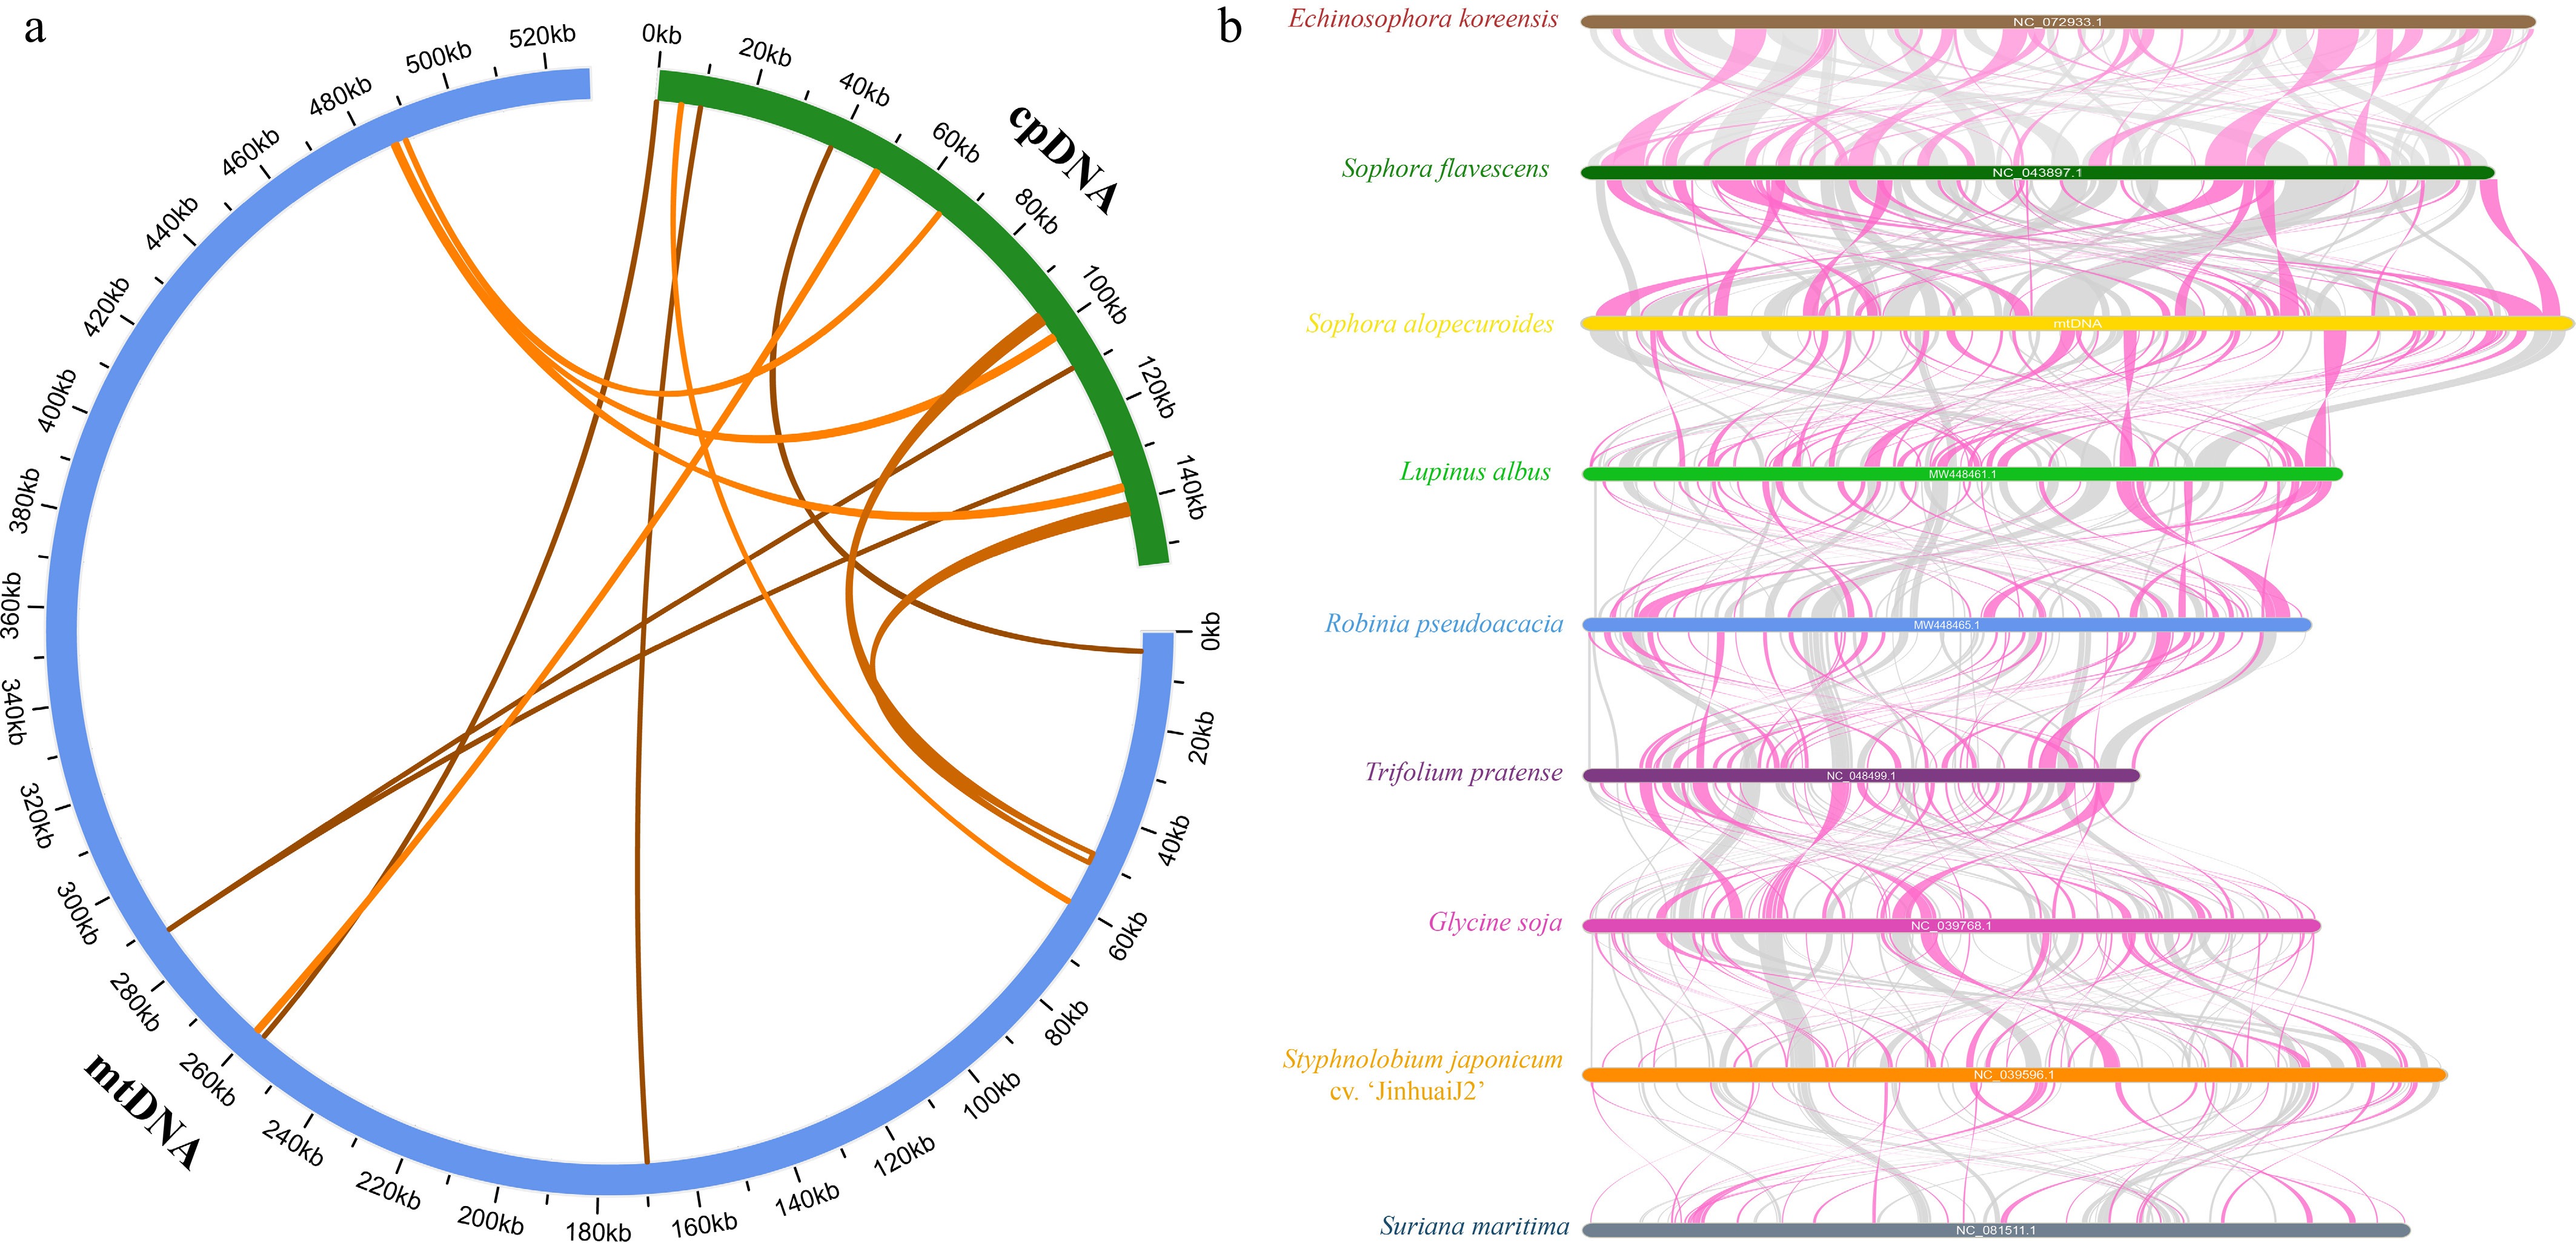
Figure 6.
Analysis of homology based on the different organelles and collinear analysis of nine Fabales species. (a) The blue arc represents the mitogenome. The green arc represents the chloroplast genome. The homologous fragments are indicated by yellow lines connecting the blue and green arcs. (b) Red arcs indicate inverted regions, and gray arcs indicate well-conserved homologous regions.
Analysis of collinearity among S. alopecuroides and eight other Fabales species
-
To further evaluate the evolutionary relationships among the S. alopecuroides mitogenome and the eight other Fabales species, we performed multiple collinearity analyses, selecting conserved collinear blocks ≥ 500 bp in length to assess their genomic similarity and sequence arrangement (Fig. 6b). The results revealed extensive collinear blocks between S. alopecuroides and all eight species, with that shared with S. flavescens (519–33,586 bp) being the longest and accounting for ~67.41% of the S. alopecuroides mitogenome. In contrast, collinear blocks with the remaining species were shorter. For instance, the collinear block shared with L. albus (521–9,839 bp) accounted for only ~37.16% of the S. alopecuroides mitogenome, indicating that closer phylogenetic relationships correlate with longer conserved collinear blocks. S. maritima exhibited the shortest blocks, reflecting its more divergent evolutionary position. It is worth noting that S. flavescens shares an extremely long collinear block with E. koreensis (554–23,437 bp), which accounts for ~68.21% of the S. flavescens mitogenome. This suggests that S. alopecuroides and E. koreensis appear to share a relatively close phylogenetic relationship. Despite harboring numerous conserved genes, these blocks displayed substantial genomic rearrangement across species, suggesting that although the nine species have undergone frequent mitogenomic rearrangements (leading to shorter collinear blocks), their protein-coding regions remain highly conserved. These findings highlight the structural instability of plant mitogenomes juxtaposed with the conservation of their functional coding sequences.
Construction of a phylogenetic tree based on the PCGs
-
We constructed a maximum likelihood tree using the DNA sequences of 15 conserved PCGs (atp1, atp4, atp8, atp9, ccmB, cox1, cox2, cox3, cob, matR, nad3, nad4, nad6, nad7, and nad9) from 27 angiosperm species across four orders (Fabales, Malpighiales, Malvales, Rosales) (Fig. 7). The mitogenome-based phylogeny closely mirrored the phylogenetic relationships, with Malpighiales species forming a well-supported outgroup and the overall structure aligning with APG's (Angiosperm Phylogeny Group, APG) latest phylogenetic classification. S. alopecuroides was clearly placed within Fabales, indicating a relatively recent divergence, whereas E. koreensis clustered closely with S. flavescens. These discrepancies highlight how differences in the gene set's composition and taxon sampling can affect influence phylogenetic inference, underscoring the importance of multilocus datasets in resolving complex evolutionary relationships.
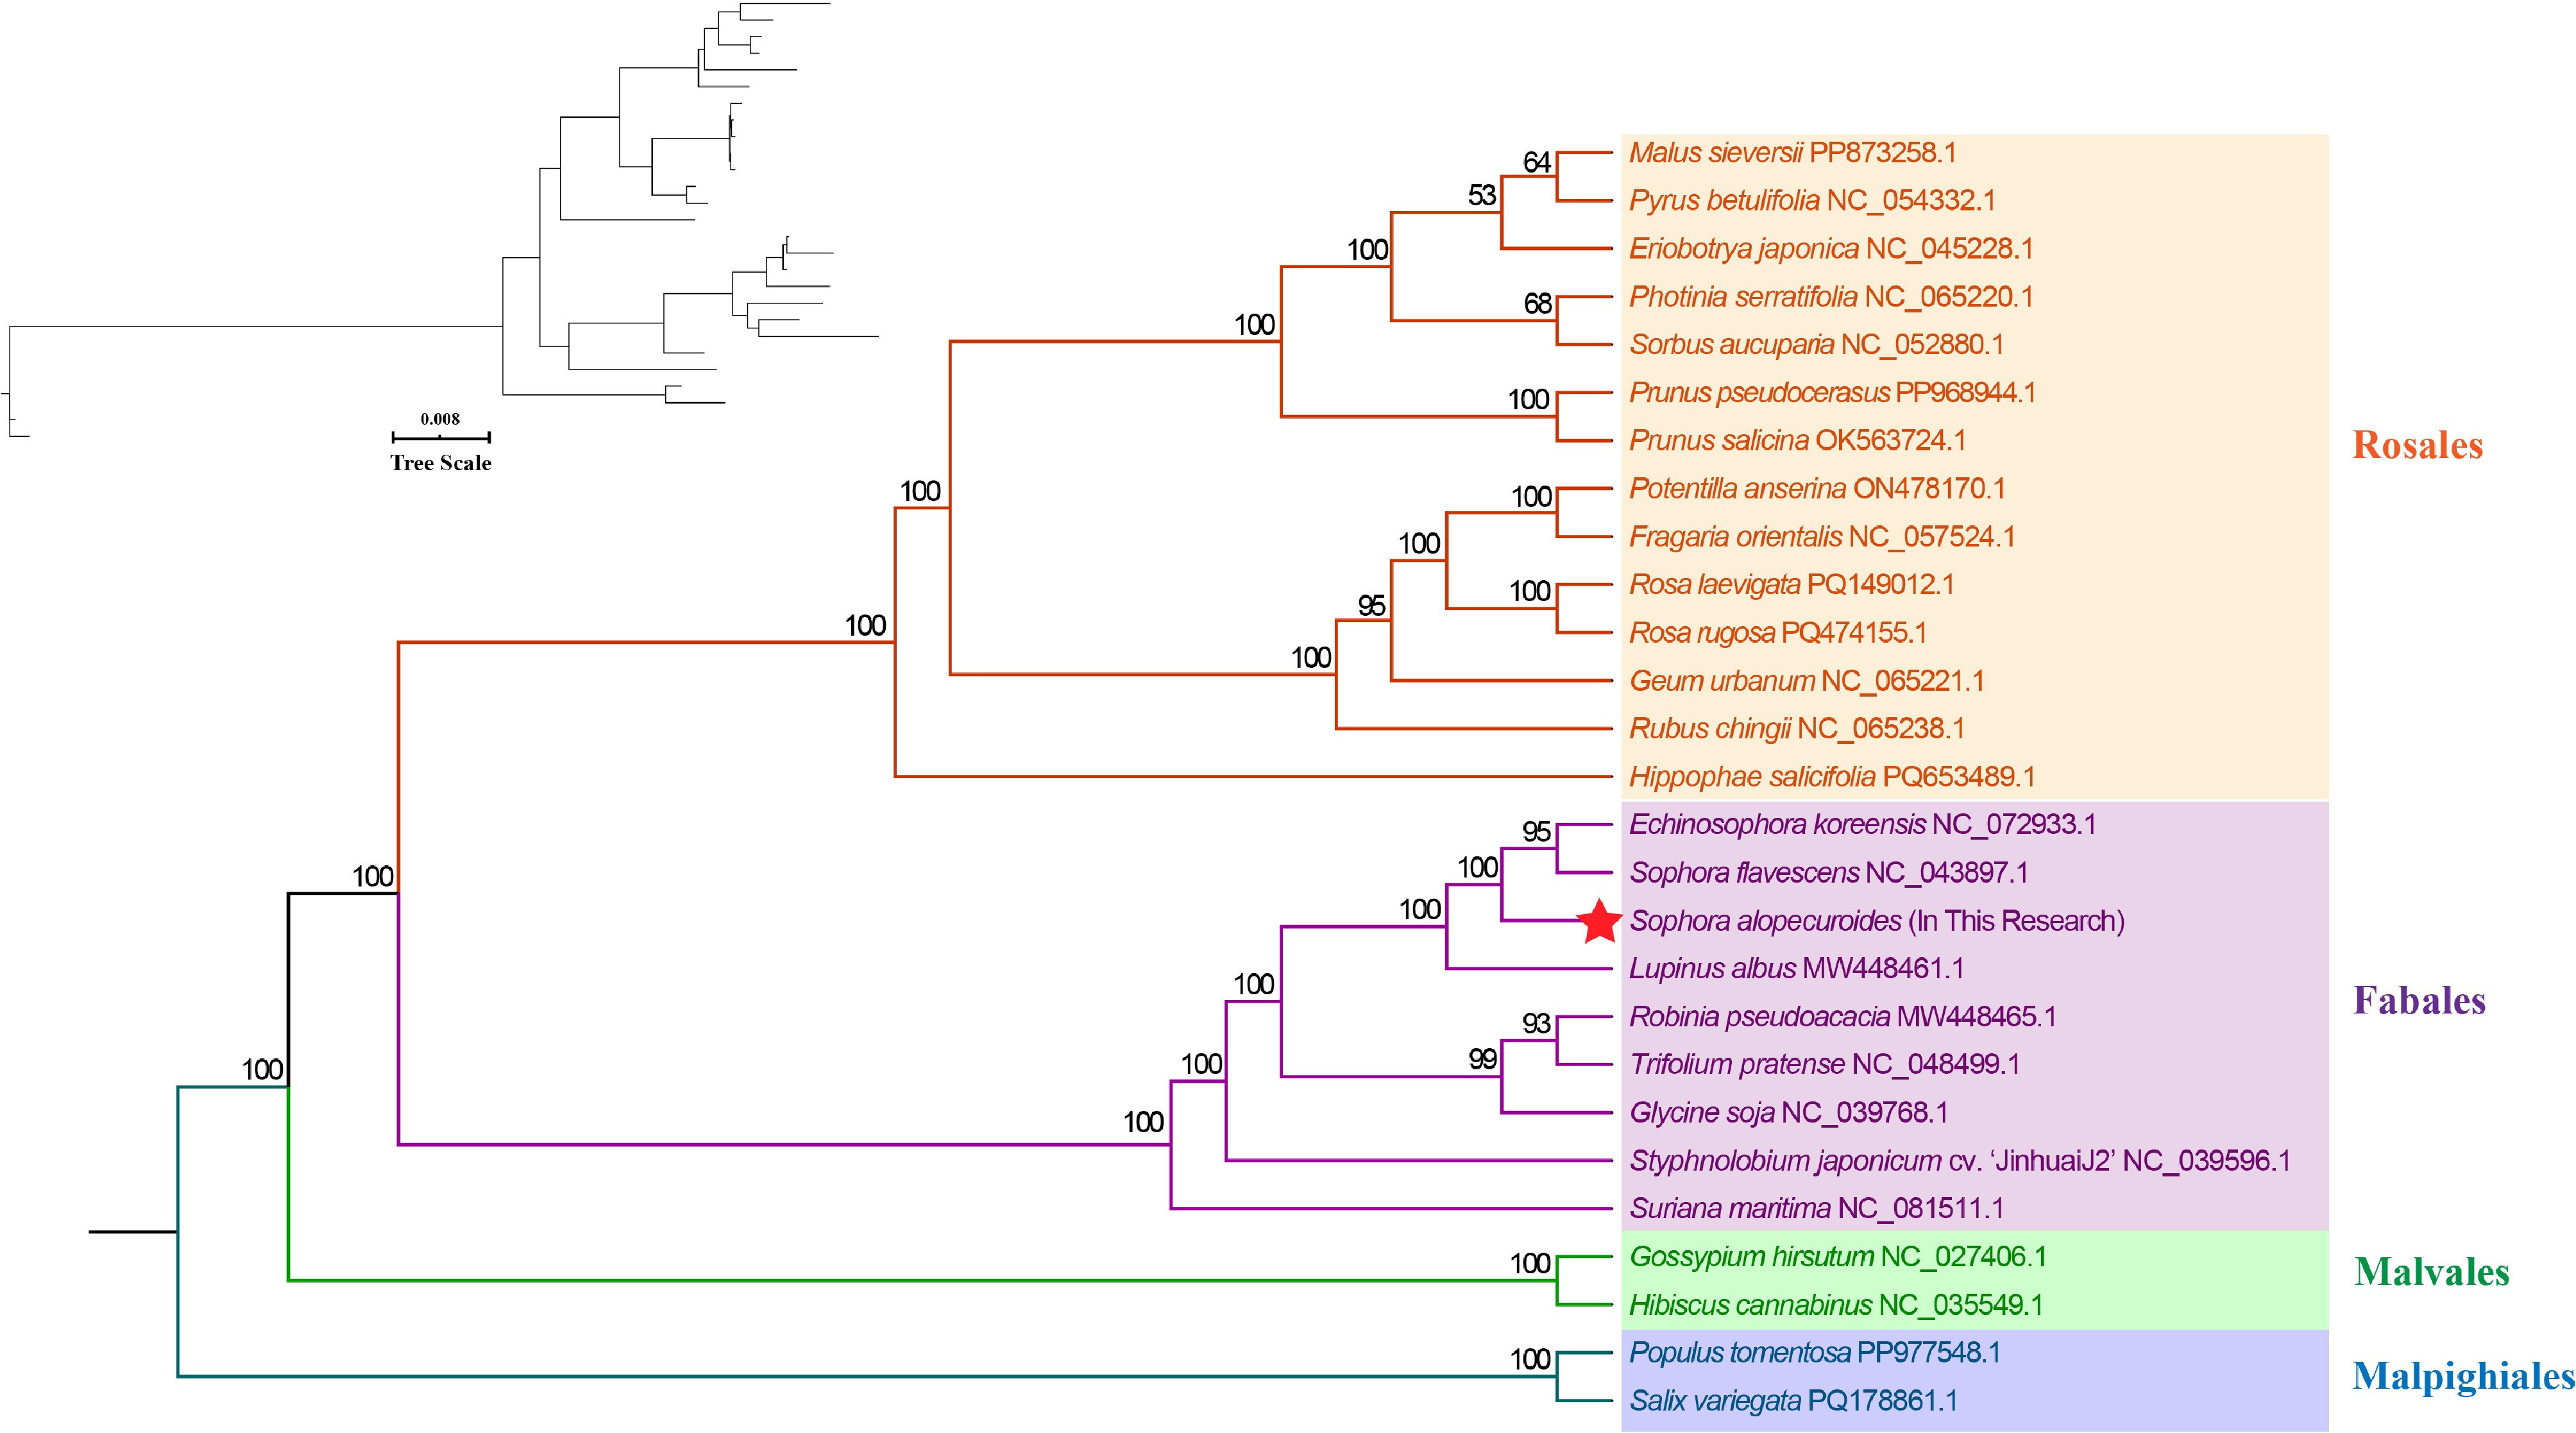
Figure 7.
Maximum likelihood tree constructed using 27 species.
-
Most higher plant mitogenomes exhibit dynamic circular or linear structures, largely driven by abundant repetitive sequences that mediate recombination and generate subgenomic molecules[41]. Our assembly of S. alopecuroides reveals a "master circle" comprising multiple contigs and extensive duplications, consistent with the structural heterogeneity observed in other Fabales species[42−44]. These complex structures, including tandem repeats, dispersed repeats, and SSRs, likely facilitate genomic flexibility, providing a basis for intragenomic recombination and evolutionary innovation.
RNA editing in the mitogenome of S. alopecuroides is widespread, predominantly C-to-U, affecting key energy metabolism genes such as ccmB, ccmC, nad2, and nad4 (Supplementary Tables S10 and S11). Such modifications can introduce start or stop codons, fine-tuning protein functions under stress[45−48]. Codon usage analysis also indicates a bias towards A/T-ending codons, suggesting selective pressures for translational efficiency. Together, RNA editing and codon preferences enhance the plant's capacity to maintain respiratory function and redox balance in arid environments, complementing its structural genome plasticity.
Comparative analysis with eight Fabales relatives identified six positively selected genes (atp4, atp8, ccmB, etc.). Notably, ccmB exhibited significant signals of positive selection across all species, whereas the other genes showed positive selection only in some species, reflecting species-specific adaptive processes[49−50]. This positive selection in genes involved in ATP synthesis, NADH dehydrogenase, and cytochrome c biogenesis highlights adaptive responses to water-limited environments. Additionally, 12 homologous chloroplast-to-mitochondria fragments (~1.44% of the mitogenome) were identified, including pseudogenized ndhB and rps7 as well as functional tRNA genes (trnD-GUC, trnH-GUG, etc.), further confirming the role of intracellular gene transfer in shaping mitogenomic function. These findings, together with phylogenetic evidence showing the close relation to S. flavescens, provide genomic insights into legumes' evolution and stress resilience.
-
Using PacBio HiFi sequencing, we assembled the mitogenome of S. alopecuroides (528,911 bp, 44.92% GC), which exhibits a complex "master circle" architecture with extensive rearrangements. This highlights the dynamic nature of mitochondrial genomes in plants. RNA editing was frequent in key energy metabolism genes (ccmB, ccmC, nad2, and nad4), suggesting an important role in maintaining respiratory function and redox balance under drought stress. Together with the observed gene redundancy and intron diversity, these features underscore the regulatory plasticity of the mitogenome. Intracellular gene transfer (12 chloroplast-derived fragments) and 6 positively selected genes [atp4, atp8, ccmB, etc.] indicated multiple evolutionary strategies contributing to adaptation in arid environments. The codon usage patterns further hint at translational optimization, albeit to a lesser extent. Phylogenetic analysis confirmed a close relationship with S. flavescens. Overall, this study provides key genomic insights into legumes' evolution and drought adaptation.
This work was supported by the National Natural Science Foundation of China (41601055). We thank Prof. Wang Zefu's team members, Nanjing Forestry University, for their technical guidance in assembling the mitochondrial genome.
-
The authors confirm their contributions to the paper as follows: conceptualization, funding acquisition, resources, supervision, writing − review and editing, and formal identification of plant specimens: Liu B; writing − original draft, data curation, and methodology: Li X; data curation, methodology, and investigation: Liu Y, Ma L. All authors contributed to data analysis, manuscript editing, and approved the final version of the manuscript.
-
The sequence and annotation of the S. alopecuroides mitogenome have been deposited in GenBank under the accession number PV765881.1 (www.ncbi.nlm.nih.gov/nuccore/PV765881.1).
-
The authors declare that they have no conflict of interest.
- Supplementary Table S1 Ka/Ks ratios of 25 shared mitochondrial protein-coding genes in pairs of nine Fabales species.
- Supplementary Table S2 Frequency of 20 amino acids in the mitogenome of S. alopecuroides.
- Supplementary Table S3 Relative synonymous codon usage of each amino acid in the mitogenome of S. alopecuroides.
- Supplementary Table S4 Analysis of codon usage bias in 33 protein-coding genes of S. alopecuroides.
- Supplementary Table S5 Simple sequence repeats (SSRs) in the mitogenome of S. alopecuroides.
- Supplementary Table S6 Number of simple sequence repeats in the mitogenomes of nine Fabales species.
- Supplementary Table S7 Tandem repeats in the mitogenomes of nine Fabales species.
- Supplementary Table S8 Summary of tandem repeats in the mitogenomes of nine Fabales species.
- Supplementary Table S9 Summary of dispersed repeats in the nine Fabales mitogenomes.
- Supplementary Table S10 RNA editing sites (C→U) identified in the mitogenome of S. alopecuroides.
- Supplementary Table S11 RNA editing sites (U→C) identified in the mitogenome of S. alopecuroides.
- Supplementary Table S12 Analysis of RNA editing sites and types in the mitogenome of S. alopecuroides.
- Supplementary Table S13 Homologous DNA segments between plastid and mitogenomes of S. alopecuroides.
- Supplementary Fig. S1 ENC-plot against GC3 of mitochondrial genome of S. alopecuroides. The solid lines represented the expected curve of positions of genes when the codon usage was only determined by the GC3 composition.
- Copyright: © 2025 by the author(s). Published by Maximum Academic Press, Fayetteville, GA. This article is an open access article distributed under Creative Commons Attribution License (CC BY 4.0), visit https://creativecommons.org/licenses/by/4.0/.
-
About this article
Cite this article
Li X, Liu Y, Ma L, Liu B. 2025. PacBio HiFi sequencing reveals a complete circular mitogenome and frequent intracellular gene transfer in Sophora alopecuroides L. (Fabaceae). Genomics Communications 2: e023 doi: 10.48130/gcomm-0025-0023 

PacBio HiFi sequencing reveals a complete circular mitogenome and frequent intracellular gene transfer in Sophora alopecuroides L. (Fabaceae)
- Received: 07 July 2025
- Revised: 15 September 2025
- Accepted: 22 October 2025
- Published online: 20 November 2025
Abstract: Sophora alopecuroides L. (Fabaceae), a key perennial herb of the desert steppes in Northwest China, is valued for medicinal alkaloids (e.g., sophocarpine), drought-resistant forage, and ecosystem restoration. Given the critical functions of the mitochondrial genome (mitogenome) in energy metabolism and stress responses in extreme environments, elucidating its mitogenome is essential for understanding adaptive mechanisms. Here, we used PacBio high-fidelity (HiFi) sequencing to assemble the mitogenome of S. alopecuroides for the first time. The mitogenome exhibited a "master circle" structure (528,911 bp, 44.92% GC content) and encoded 55 genes, including 33 protein-coding genes, 19 tRNA genes, and 3 rRNA genes. Comprehensive analysis of protein-coding sequences from nine closely related Fabales species identified 25 shared mitochondrial genes. Notably, six genes (atp4, atp8, ccmB, nad9, rps10, and rps14) displayed nonsynonymous/synonymous ratios (Ka/Ks) of > 1, suggesting positive selection and adaptive evolution to extreme environments such as drought and salinity. Additionally, 12 homologous fragments (79–2,151 bp) were detected between the chloroplast and mitochondrial genomes, indicating frequent intracellular gene transfer (IGT) events. Phylogenetic analysis based on mitogenomic data further revealed a close relationship between S. alopecuroides and S. flavescens. Collectively, these findings provide valuable insights and foundational data for future studies on population genetics and evolutionary mechanisms in Sophora and other legume species.