


-
The global shift toward healthier dietary patterns has increased consumer interest in functional foods. Functional food provides nutritional benefits beyond basic sustenance[1−3]. This trend, combined with rising healthcare costs and increased awareness of diet-related diseases, has driven significant growth in the functional food market0[4−6]. Plant-based diets, characterized by reduced consumption of animal products, have gained prominence due to their association with reduced cardiovascular disease risk, improved metabolic health outcomes, and greater environmental sustainability through lower resource use and carbon footprint[7,8].
Tigernut (Cyperus esculentus L.) is a promising but underutilized crop, largely due to limited industrial processing and consumer awareness, despite its high nutritional and functional potential. It is widely distributed across tropical and subtropical regions[9,10]. This nutrient-dense tuber has gained attention for its exceptional nutritional profile. It contains approximately 20%–30% dietary fibre, 25%–30% healthy fats, and substantial amounts of essential minerals and vitamins[11,12]. The commercial value of tigernut and its derivatives has generated substantial economic interest, with the Spanish horchata industry alone valued at over three million euros[13]. Beyond their nutritional attributes, tigernuts are associated with therapeutic properties. Traditional medicine has utilized these tubers for treating various ailments, including digestive disorders and metabolic imbalances[14]. The presence of bioactive compounds such as phenolic compounds, flavonoids, and resistant starch contributes to their antioxidant and potential antidiabetic properties[9].
Bread is a staple food globally. It therefore serves as an ideal vehicle for nutritional fortification[15]. The incorporation of tigernut flour into bread formulations presents an opportunity to develop functional bakery products that combine palatability with enhanced nutritional and health-promoting properties. However, the effects of tigernut flour substitution on bread quality parameters require systematic investigation to determine optimal incorporation levels, as excessive inclusion may lead to technological challenges such as reduced loaf volume, denser crumb texture, and altered dough handling. Therefore, this study evaluated the impact of tigernut flour supplementation at various substitution levels (5%, 10%, 15%, and 20%) on wheat bread. The parameters assessed included proximate composition, mineral content, antidiabetic activity, antioxidant properties, phytochemical profile, and sensory characteristics. While previous studies have explored tigernut flour in food formulations, this study is novel in simultaneously assessing its antioxidant and antidiabetic activities in bread, alongside nutritional composition, phytochemicals, and sensory quality. In the future, tigernut-based bread could play an important role in promoting healthier, plant-based diets, and supporting the development of functional bakery products that address both nutritional and sustainability goals.
-
Fresh tigernuts (Cyperus esculentus) were purchased from Shasha Market, Akure, Ondo State, Nigeria. Commercial wheat flour, butter, granulated sugar, powdered milk, fresh eggs, table salt (NaCl), and active dry yeast (Saccharomyces cerevisiae) were bought from Oja Oba Market, Akure, Ondo State, Nigeria. All ingredients were stored under appropriate conditions (dry, cool environment at 18–25 °C) until the time of usage.
Tigernut flour preparation
-
Fresh tigernuts were sorted manually to remove damaged tubers, stones, and foreign materials. The selected tubers were thoroughly washed with potable water to remove adhering soil and debris. The clean tigernuts were then oven-dried using a forced-air oven (Model DHG-9070A, Shanghai Yiheng Scientific Instruments Co., China) at 60 °C for 24 h, to achieve a moisture content below 10%. The dried tubers were milled using a laboratory hammer mill (Model FW100, Taisite Instrument Co., China) fitted with a 2.0 mm screen, then further ground and sieved through a 0.5 mm mesh to obtain fine tigernut flour. The flour was stored in airtight polyethylene containers at room temperature (25 ± 2 °C) until usage.
Bread formulation and preparation
-
Five bread formulations were prepared using different wheat flour to tigernut flour ratios: 100:0 (control, Sample A), 95:5 (Sample B), 90:10 (Sample C), 85:15 (Sample D), and 80:20 (Sample E). The basic bread recipe consisted of flour blend (500 g), granulated sugar (50 g), table salt (10 g), butter (30 g), active dry yeast (7 g), and lukewarm water (250 mL). The bread preparation followed standardized procedures with slight modifications[16]. Dry ingredients (flour blend, sugar, salt) were mixed thoroughly in a large stainless-steel bowl using a wooden spoon. Softened butter was then incorporated by hand until evenly distributed. Yeast was activated separately in lukewarm water (35–37 °C) containing dissolved sugar (5 g) and allowed to foam for 5 min to confirm viability. The activated yeast mixture was gradually incorporated into the flour mixture and kneaded by hand for 10 min until a smooth and elastic dough was formed. The dough was placed in a greased bowl, covered with a damp cloth, and allowed to proof for 60 min at room temperature (25 ± 2 °C) until it doubled in size (first proofing). The dough was then punched down, shaped into loaves, and placed in greased aluminium baking pans (20 cm × 10 cm × 8 cm). A second proofing period of 40 min was allowed before baking in a preheated convection oven (Model YXD-20B, Guangzhou Hongling Electric Heating Equipment Co., China) at 180 °C for 30 min. The baked loaves were cooled on wire racks for 2 h before analyses.
Determination of proximate composition
-
Proximate composition was determined according to official methods[17]. Moisture content was determined by oven drying at 105 °C to constant weight. Crude protein was analysed using the Kjeldahl method with a nitrogen conversion factor of 6.25. Fat content was ascertained by Soxhlet extraction using petroleum ether (40–60 °C boiling point) for 6 h. Ash content was determined by incineration in a muffle furnace at 550 °C for 6 h. Crude fibre was analysed by acid-base digestion method using 1.25% H2SO4 and 1.25% NaOH solutions. Carbohydrate content was calculated by difference using the formula: % Carbohydrate = 100 − (% Moisture + % Protein + % Fat + % Ash + % Fibre).
Determination of mineral composition
-
Mineral content of samples was determined using atomic absorption spectrophotometry after wet acid digestion, according to a previously described method[17]. Bread samples (2 g) were dried, ground, and digested with a mixture of nitric acid and perchloric acid. The concentrations of calcium, iron, zinc, potassium, magnesium, and phosphorus were determined using standards. Results were expressed as mg/g on a dry weight basis.
Extraction of samples
-
The extracts used for the biochemical analyses were prepared from the dry composite flours. A concentration of 10 mg/mL was obtained by weighing the appropriate amount of sample into 2 mL microcentrifuge tubes. Distilled water was added, and the mixture was vortexed for about 1 min, then allowed to hydrate for 10 min. The suspension was vortexed again for approximately 15 s and centrifuged at 10,000 × g for 10 min at room temperature (25 °C) (Model KX3400C; KENXIN International Co.). The resulting supernatant was collected and used for the analyses.
Determination of total phenolic contents
-
Total phenolic content was determined using the Folin-Ciocalteu method as previously described[18]. Bread extracts (0.5 mL) were mixed with Folin-Ciocalteu reagent (2.5 mL), and sodium carbonate solution (2 mL, 7.5% w/v). The mixture was incubated at room temperature for 30 min, and absorbance was measured at 765 nm using a UV-visible spectrophotometer. Results were expressed as mg gallic acid equivalent per gram (mg GAE/g).
Determination of total flavonoid contents
-
Total flavonoid content was determined using the aluminium chloride colorimetric method[19]. Sample extracts (1 mL) were mixed with aluminium chloride solution (0.3 mL, 10% w/v), and incubated for 30 min. Absorbance was measured at 415 nm, with results expressed as mg quercetin equivalent per gram (mg QE/g).
Determination of α-amylase inhibition
-
Bread extracts were prepared by homogenizing 5 g of bread samples in 50 mL phosphate buffer (pH 6.9), followed by centrifugation at 3,000 rpm for 10 min at room temperature (25 °C). The supernatant was used as the enzyme inhibitor source. The α-amylase inhibitory activity of the sample's extract was assessed using a modified method[20]. Sample extract or distilled water (100 μL) was mixed with enzyme solution (100 μL), and incubated at 28 °C for 10 min. Then, 200 μL of 1% starch solution was added, and the mixture was incubated for another 10 min at 28 °C. The reaction was stopped with dinitrosalicylic acid reagent, heated, and cooled. After dilution (1:5), absorbance was measured at 540 nm. Percentage inhibition was calculated using the formula:
$ \mathrm{Percentage\; inhibition}=\left[\dfrac{\left(Abs_{control}-Abs_{samples}\right)}{Abs_{control}}\right]\times100 $ Determination of α-glucosidase inhibition
-
The inhibitory effect of the extracts on α-glucosidase activity was evaluated using a recently reported method[20], with slight modifications. Briefly, a substrate solution was prepared using p-nitrophenyl-α-D-glucopyranoside (pNPG) in 20 mM phosphate buffer (pH 6.9). To initiate the assay, 100 μL of α-glucosidase enzyme solution (0.3 U/mL) was pre-incubated with 50 μL of the extract sample at 37 °C for 10 min. Following this, 50 μL of 3.0 mM pNPG (also in phosphate buffer, pH 6.9) was added to start the reaction. The reaction mixture was incubated at 37 °C for 20 min and then terminated by the addition of 2 mL of 0.1 M sodium carbonate (Na2CO3). The release of p-nitrophenol, indicative of enzymatic activity, was measured spectrophotometrically at 405 nm. Percentage inhibition was calculated using the formula:
$ \mathrm{Percentage\; inhibition}=\left[\dfrac{\left(Abs_{control}-Abs_{samples}\right)}{Abs_{control}}\right]\times100 $ Determination of 2,2-Diphenyl-1Ppicryhydrazyl (DPPH)
-
The ability of the extract to scavenge DPPH free radicals was determined following a previously reported method[21]. In this procedure, 1 mL of the extract was combined with an equal volume of a 0.4 mM methanolic solution containing DPPH. The resultant mixture was shielded from light and allowed to incubate for 30 min, after which the absorbance was measured at 517 nm, and the percentage scavenging ability calculated as:
$ \text{%}\mathrm{\; DPPH\; Inhibition}=\dfrac{A_{control}-A_{sampl\mathrm{e}}}{A_{control}}\times100 $ Determination of 2,2-azinobis (3-ethylbenzothiazoline-6-sulfonate) (ABTS)
-
The capacity of the extract to scavenge ABTS radicals was determined following the procedure outlined previously[20]. ABTS radicals were generated through designated reactions, which involved reacting 7 mM ABTS aqueous solution with 2.45 mM potassium persulfate and allowing the solution to stand in the dark for over 16 h. The solution's absorbance was adjusted to 0.7 with ethanol. Then, 200 μL of ABTS solution was mixed with 20 μL of extract, and absorbance was measured at 734 nm. The percentage of ABTS radical scavenging ability of the extract was calculated using the following formula:
$ \text{%}\; \mathrm{ABTS\; Inhibition}=\dfrac{A_{control}-A_{sampl\mathrm{e}}}{A_{control}}\times100 $ Determination of hydroxyl radical scavenging ability
-
The ability of the sample to scavenge hydroxyl radical was determined using a previously reported method[22]. Briefly, freshly prepared sample extract (0–100 μL) was pipetted to a reaction mixture. Thereafter, 400 μL, 0.1 M phosphate buffer (pH 7.4), 120 μL, 20 mM deoxyribose, 40 μL, 20 mM hydrogen peroxide, and 40 μL, 500 μM FeSO4 were added and the volume was made to 800 μL with distilled water. After incubating for 30 min at 37 °C, the reaction was stopped by the addition of 0.5 mL of 2.8% trichloro acetic acid. This was followed by the addition of 0.4 mL of 0.6% thiobarbituric acid solution. Then the tubes were incubated for 20 min in boiling water. The absorbance was measured at 532 nm, and the hydroxyl radical scavenging ability was calculated using:
$ \text{%}\; \mathrm{OH\; inhibition}=\dfrac{A_{control}-A_{sampl\mathrm{e}}}{A_{control}}\times100 $ Determination of ferric reducing antioxidant power (FRAP)
-
The ferric reducing property was assessed following the method outlined recently[21]. A mixture consisting of 0.25 mL of the extract, 0.25 mL of 200 mM sodium phosphate buffer, pH 6.6, and 0.25 mL of 1% potassium ferricyanide was incubated at 50 °C for 20 min. Following incubation, 0.25 mL of 10% TCA was added, followed by centrifugation at 2,000 rpm for 10 min at room temperature (25 °C). Thereafter, 1 mL of the supernatant was mixed with 1 mL of distilled water and 0.1% FeCl3, and the absorbance was measured at 700 nm. A standard curve was generated with ascorbic acid, and the results were expressed as milligrams of ascorbic acid equivalent per gram of sample.
Sensory evaluation
-
Sensory evaluation was conducted using a 9-point hedonic scale (1 = extremely dislike, 9 = extremely like) by a trained panel of 20 evaluators (aged 25–45 years, 60% female, 40% male) as previously described[23]. Panel members were selected based on their familiarity with bread products and trained in sensory evaluation techniques. Parameters assessed included crust colour, crumb colour, taste, aroma, and overall acceptability. Samples (2 cm × 2 cm × 2 cm cubes) were presented in randomized order on white ceramic plates under fluorescent lighting conditions. Panelists were provided with water and unsalted crackers for palate cleansing between samples. The evaluation was conducted as a single sensory session, and the mean scores of all 20 panelists were used for data analysis.
Statistical analysis
-
All analyses were performed in triplicate, and the results were expressed as mean ± standard deviation. Data were analysed using one-way analysis of variance (ANOVA) and Duncan's Multiple Range Test for mean separation at p ≤ 0.05 significance level. Statistical analyses were performed using SPSS version 26.
-
The proximate composition of tigernut–supplemented bread (expressed on a wet-weight basis) is presented in Table 1. The results showed that moisture content decreased significantly (p ≤ 0.05) from 13% in the control sample to 10.17% in bread containing 20% tigernut flour. Moisture content is an important quality attribute of baked products because it affects microbial growth and therefore, influences shelf stability. The lower values observed in tigernut–based bread may be linked to the relatively low water-holding capacity of tigernut flour compared to wheat flour, which is likely attributed to differences in protein structure and starch gelatinization properties[24]. This decrease is desirable since a reduction in moisture content may enhance the storage stability of the bread, as has also been reported for orange peel–supplemented bread[25]. Protein content followed a downward trend as substitution with tigernut flour increased, decreasing from 12% in the control bread, to 10% at the 20% substitution level. This is expected because tigernut flour has lower protein content (6%–8%) when compared with wheat flour (10%–14%)[14]. While this reduction is a limitation from the standpoint of total protein, it should be noted that tigernut provides a complementary amino acid profile, being relatively rich in lysine and arginine, which may improve the overall protein quality of the composite bread.
Table 1. Proximate composition of tigernut-supplemented wheat bread (%).
Sample Moisture Protein Fat Ash Fibre Carbohydrate A 13.00 ± 0.56a 12.00 ± 0.48a 5.00 ± 0.32e 2.00 ± 0.09d 2.00 ± 0.26e 69.00 ± 0.35a B 11.55 ± 0.65b 11.50 ± 0.02b 5.50 ± 0.06d 2.10 ± 0.02cd 2.20 ± 0.42d 68.20 ± 0.56ab C 11.20 ± 0.37c 11.00 ± 0.48bc 6.00 ± 0.31c 2.18 ± 0.12c 2.40 ± 0.32c 67.40 ± 0.24b D 10.50 ± 0.01d 10.50 ± 0.02c 6.50 ± 0.04b 2.30 ± 0.06b 2.60 ± 0.58bc 66.60 ± 0.26c E 10.17 ± 0.66e 10.00 ± 0.04d 7.00 ± 0.26a 2.40 ± 0.02a 2.80 ± 0.62a 65.80 ± 0.47d Values are mean ± standard deviation. Means with different superscripts within columns are significantly different (p ≤ 0.05). Key: A (100% wheat flour), B (95% wheat flour, 5% tigernut flour); C (90% wheat flour, 10% tigernut flour); D (85% wheat flour, 15% tigernut flour); E (80% wheat flour, 20% tigernut flour). All values are expressed on a wet-weight basis. Fat content, on the other hand, increased progressively and significantly (p ≤ 0.05) with tigernut flour inclusion, ranging from 5.00% in the control to 7.00% in bread with 20% substitution. This can be attributed to the naturally high oil content of tigernuts (25%–30%)[12]. The oil fraction of tigernut is particularly rich in monounsaturated fatty acids, mainly oleic acid (60%–70%), and linoleic acid (15%–20%), which are known to be beneficial for cardiovascular health[7,8]. The higher fat content also contributes positively to the mouthfeel and sensory quality of bread, making it more appealing to consumers. Ash content, which is an indication of mineral composition, also increased gradually with substitution, rising from 2.00% in the control to 2.40% at 20% substitution. This suggests that tigernut flour enhanced the mineral density of the bread, in agreement with earlier reports on its mineral richness[10,11]. Fibre content showed a similar trend, with values increasing from 2.00% in the control to 2.80% in the 20% substitution level. Dietary fibre is important for maintaining digestive health and has been associated with improved glycemic control and reduced risk of chronic diseases[26]. The enrichment of the bread with fibre therefore adds functional value beyond basic nutrition.
Mineral composition
-
The mineral composition of the bread samples is presented in Table 2, and an interesting observation was the gradual decline in all measured minerals as the level of tigernut flour substitution increased. The control sample (100% wheat flour) had the highest mineral values: calcium (23.40 mg/g), iron (2.10 mg/g), zinc (1.40 mg/g), potassium (180 mg/g), magnesium (80.00 mg/g), and phosphorus (120 mg/g). These values decreased progressively with substitution up to 20% tigernut flour, where calcium was reduced to 19.80 mg/g, iron to 1.70 mg/g, zinc to 1.00 mg/g, potassium to 144.00 mg/g, magnesium to 64.00 mg/g, and phosphorus to 96.00 mg/g. Although this declining trend may appear counterintuitive, it can be explained by a number of factors. A likely reason is that the commercial wheat flour used as the base may have been fortified with minerals, which is a standard practice in many countries to address micronutrient deficiencies[15]. If this is the case, the fortification would naturally elevate the mineral content of the control bread above that of the tigernut–supplemented samples. Another factor could be the presence of anti-nutritional compounds in tigernuts, such as phytates, tannins, and oxalates, which are known to form insoluble complexes with minerals, thereby reducing their extractability and analytical recovery. Although antinutritional factors were not measured in the current study, processing methods such as soaking, fermentation, or germination have been reported to mitigate their effects[11,12]. Additionally, minerals in tigernuts may occur predominantly in bound forms, making them less accessible when standard AOAC procedures are applied[27]. Thermal processing during baking can also alter mineral–protein and mineral–fibre interactions, and this might further lower the extractability of minerals from tigernut components compared to wheat flour.
Table 2. Mineral composition of tigernut-supplemented wheat bread (mg/g).
Sample Calcium Iron Zinc Potassium Magnesium Phosphorus A 23.40 ± 0.41a 2.10 ± 0.39a 1.40 ± 0.69a 180.00 ± 0.89a 80.00 ± 0.05a 120.00 ± 0.05a B 22.50 ± 0.02ab 2.00 ± 0.48ab 1.30 ± 0.00b 171.00 ± 0.74b 76.00 ± 0.25b 114.00 ± 0.09b C 21.60 ± 0.10b 1.90 ± 0.15b 1.20 ± 0.01c 162.00 ± 0.84c 72.00 ± 0.40c 108.00 ± 0.32c D 20.70 ± 0.31c 1.80 ± 0.24bc 1.10 ± 0.10c 153.00 ± 0.42d 68.00 ± 0.71d 102.00 ± 0.04d E 19.80 ± 0.11d 1.70 ± 0.50c 1.00 ± 0.07d 144.00 ± 0.86e 64.00 ± 0.36e 96.00 ± 0.07e Values are mean ± standard deviation. Means with different superscripts within columns are significantly different (p ≤ 0.05). Key: A (100% wheat flour), B (95% wheat flour, 5% tigernut flour); C (90% wheat flour, 10% tigernut flour); D (85% wheat flour, 15% tigernut flour); E (80% wheat flour, 20% tigernut flour). Despite the decline, the mineral contents of the composite breads remain nutritionally meaningful. For instance, iron content ranged from 1.70 to 2.10 mg/g across the samples, which is significant because iron plays an essential role in oxygen transport and preventing iron deficiency anaemia, particularly among children and women of reproductive age. Calcium, which declined from 23.40 to 19.80 mg/g with substitution, is vital for bone and teeth development, while magnesium is involved in enzyme activation and energy metabolism. Similarly, potassium values, although reduced, remain relatively high (144–180 mg/g), which is important for maintaining fluid balance and regulating blood pressure[28]. Zinc is also essential for immune function and growth, while phosphorus is necessary for bone mineralization and energy metabolism[29,30]. Taken together, although substitution with tigernut flour reduced the absolute mineral concentrations compared with the control bread, this does not diminish the fact that tigernut still contributes valuable nutrients. The slightly lower mineral content can be balanced by the other nutritional advantages of tigernut flour, particularly its healthy fat and fibre content, while the overall contribution to essential micronutrients remains relevant for daily dietary intake.
Phytochemical content
-
The phytochemical composition of the bread samples is shown in Fig. 1a & b. Both total phenolic and flavonoid contents decreased progressively as tigernut flour substitution increased. The control bread recorded the highest values with total phenolic content of 12.30 mg GAE/g, and total flavonoids of 10.20 mg QE/g. These values declined steadily with substitution, reaching 10.30 mg GAE/g, and 8.20 mg QE/g at 20% substitution, respectively. Contrary to expectations, this observation does not align with previous reports of tigernuts containing significant phenolic compounds and flavonoids[12]. The observed trend may be due to the thermal effect on the phytochemicals. Thermal processing during baking may affect phenolic compounds differently depending on their source. Heat treatment can lead to degradation of free phenolics, or alternatively to changes in their binding to proteins and fibres, which may alter their extractability in the analytical procedures used[18]. Interactions between the bioactive compounds of wheat and tigernut during dough formation and baking could also affect how readily phenolics and flavonoids are released and detected.
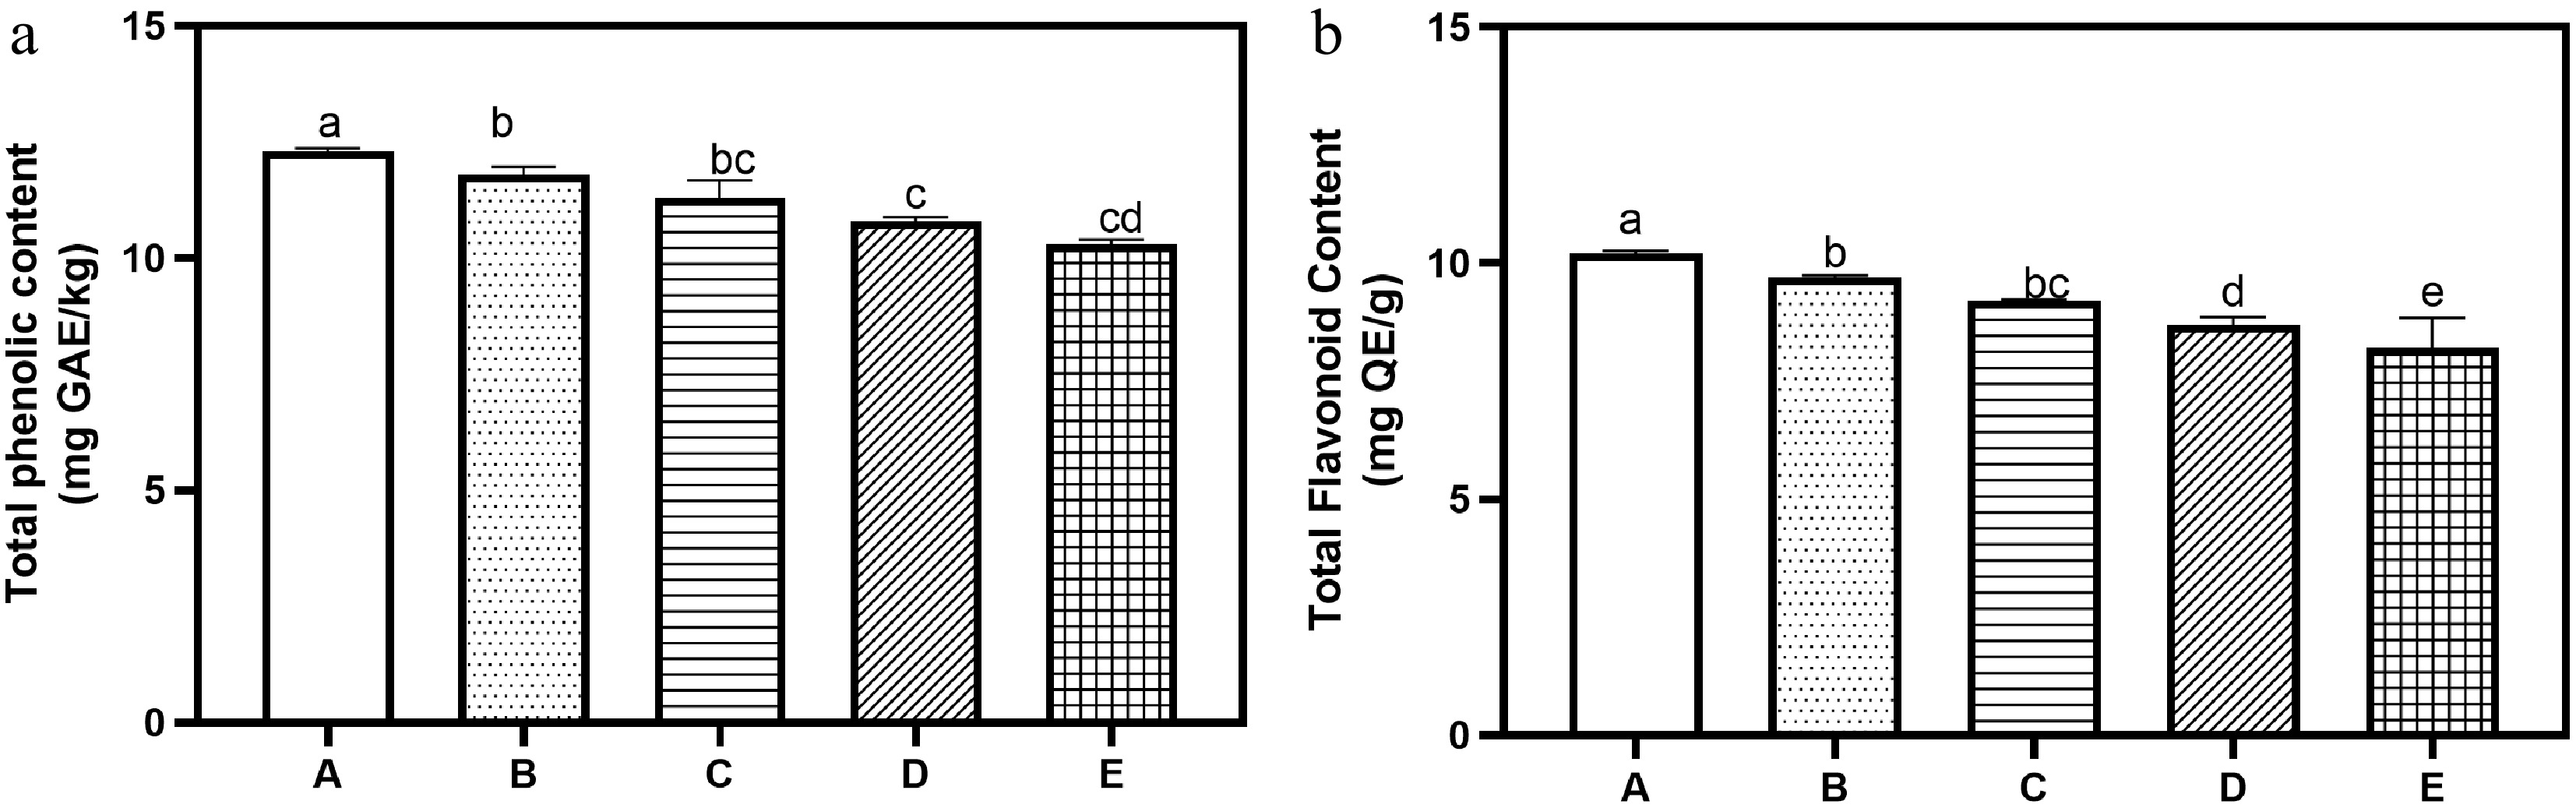
Figure 1.
(a) Total phenolic and (b) total flavonoid contents of bread with tigernut flour supplementation. Values are mean ± standard deviation. Bars with different superscripts are significantly different (p ≤ 0.05). Key: A (100% wheat flour), B (95% wheat flour, 5% tigernut flour); C (90% wheat flour, 10% tigernut flour); D (85% wheat flour, 15% tigernut flour); E (80% wheat flour, 20% tigernut flour).
Interestingly, despite the declining trend in measured phenolics and flavonoids, the antioxidant results showed consistent improvements across all assays. This suggests that phenolics and flavonoids, though important, are not the only contributors to antioxidant capacity in tigernut–supplemented bread. Other compounds such as tocopherols, sterols, and unsaturated fatty acids present in tigernut may be playing a significant role, possibly in synergy with the phenolics that remain stable during baking[9]. From a nutritional perspective, phenolics and flavonoids are important because they act as natural antioxidants with protective roles against oxidative stress and related chronic conditions[2]. Therefore, even though their measured values decreased in this study, the overall functional benefits of tigernut supplementation remain evident from the strong antioxidant activity observed. This highlights the complexity of phytochemical interactions in food systems, and suggests that extractable phenolics alone may not fully capture the functional value of bioactive compounds in food formulations.
Antioxidant activity
-
The antioxidant activity of the bread samples, presented in Fig. 2a–d, clearly highlights one of the most promising effects of tigernut flour substitution. All the measured antioxidant parameters—ABTS, DPPH, FRAP, and hydroxyl radical scavenging activity—showed steady and significant increases as the level of tigernut flour increased. ABTS values increased from 45.00 to 65.00 µM TE/g, and DPPH activity, which measures the capacity to donate hydrogen atoms and neutralize free radicals, increased from 60.00 to 80.00 µM TE/g. These progressive increases confirm that tigernut flour contributed additional antioxidant compounds to the bread and that these compounds remained stable even after baking. Similarly, FRAP values rose from 50.00 µM TE/g in the control bread to 85.00 µM TE/g at 20% substitution, which represents an appreciable improvement in reducing power. Hydroxyl radical scavenging activity, which is important because hydroxyl radicals are among the most reactive and damaging free radicals in biological systems, increased consistently from 30.00 to 55.00 µM TE/g across the samples.
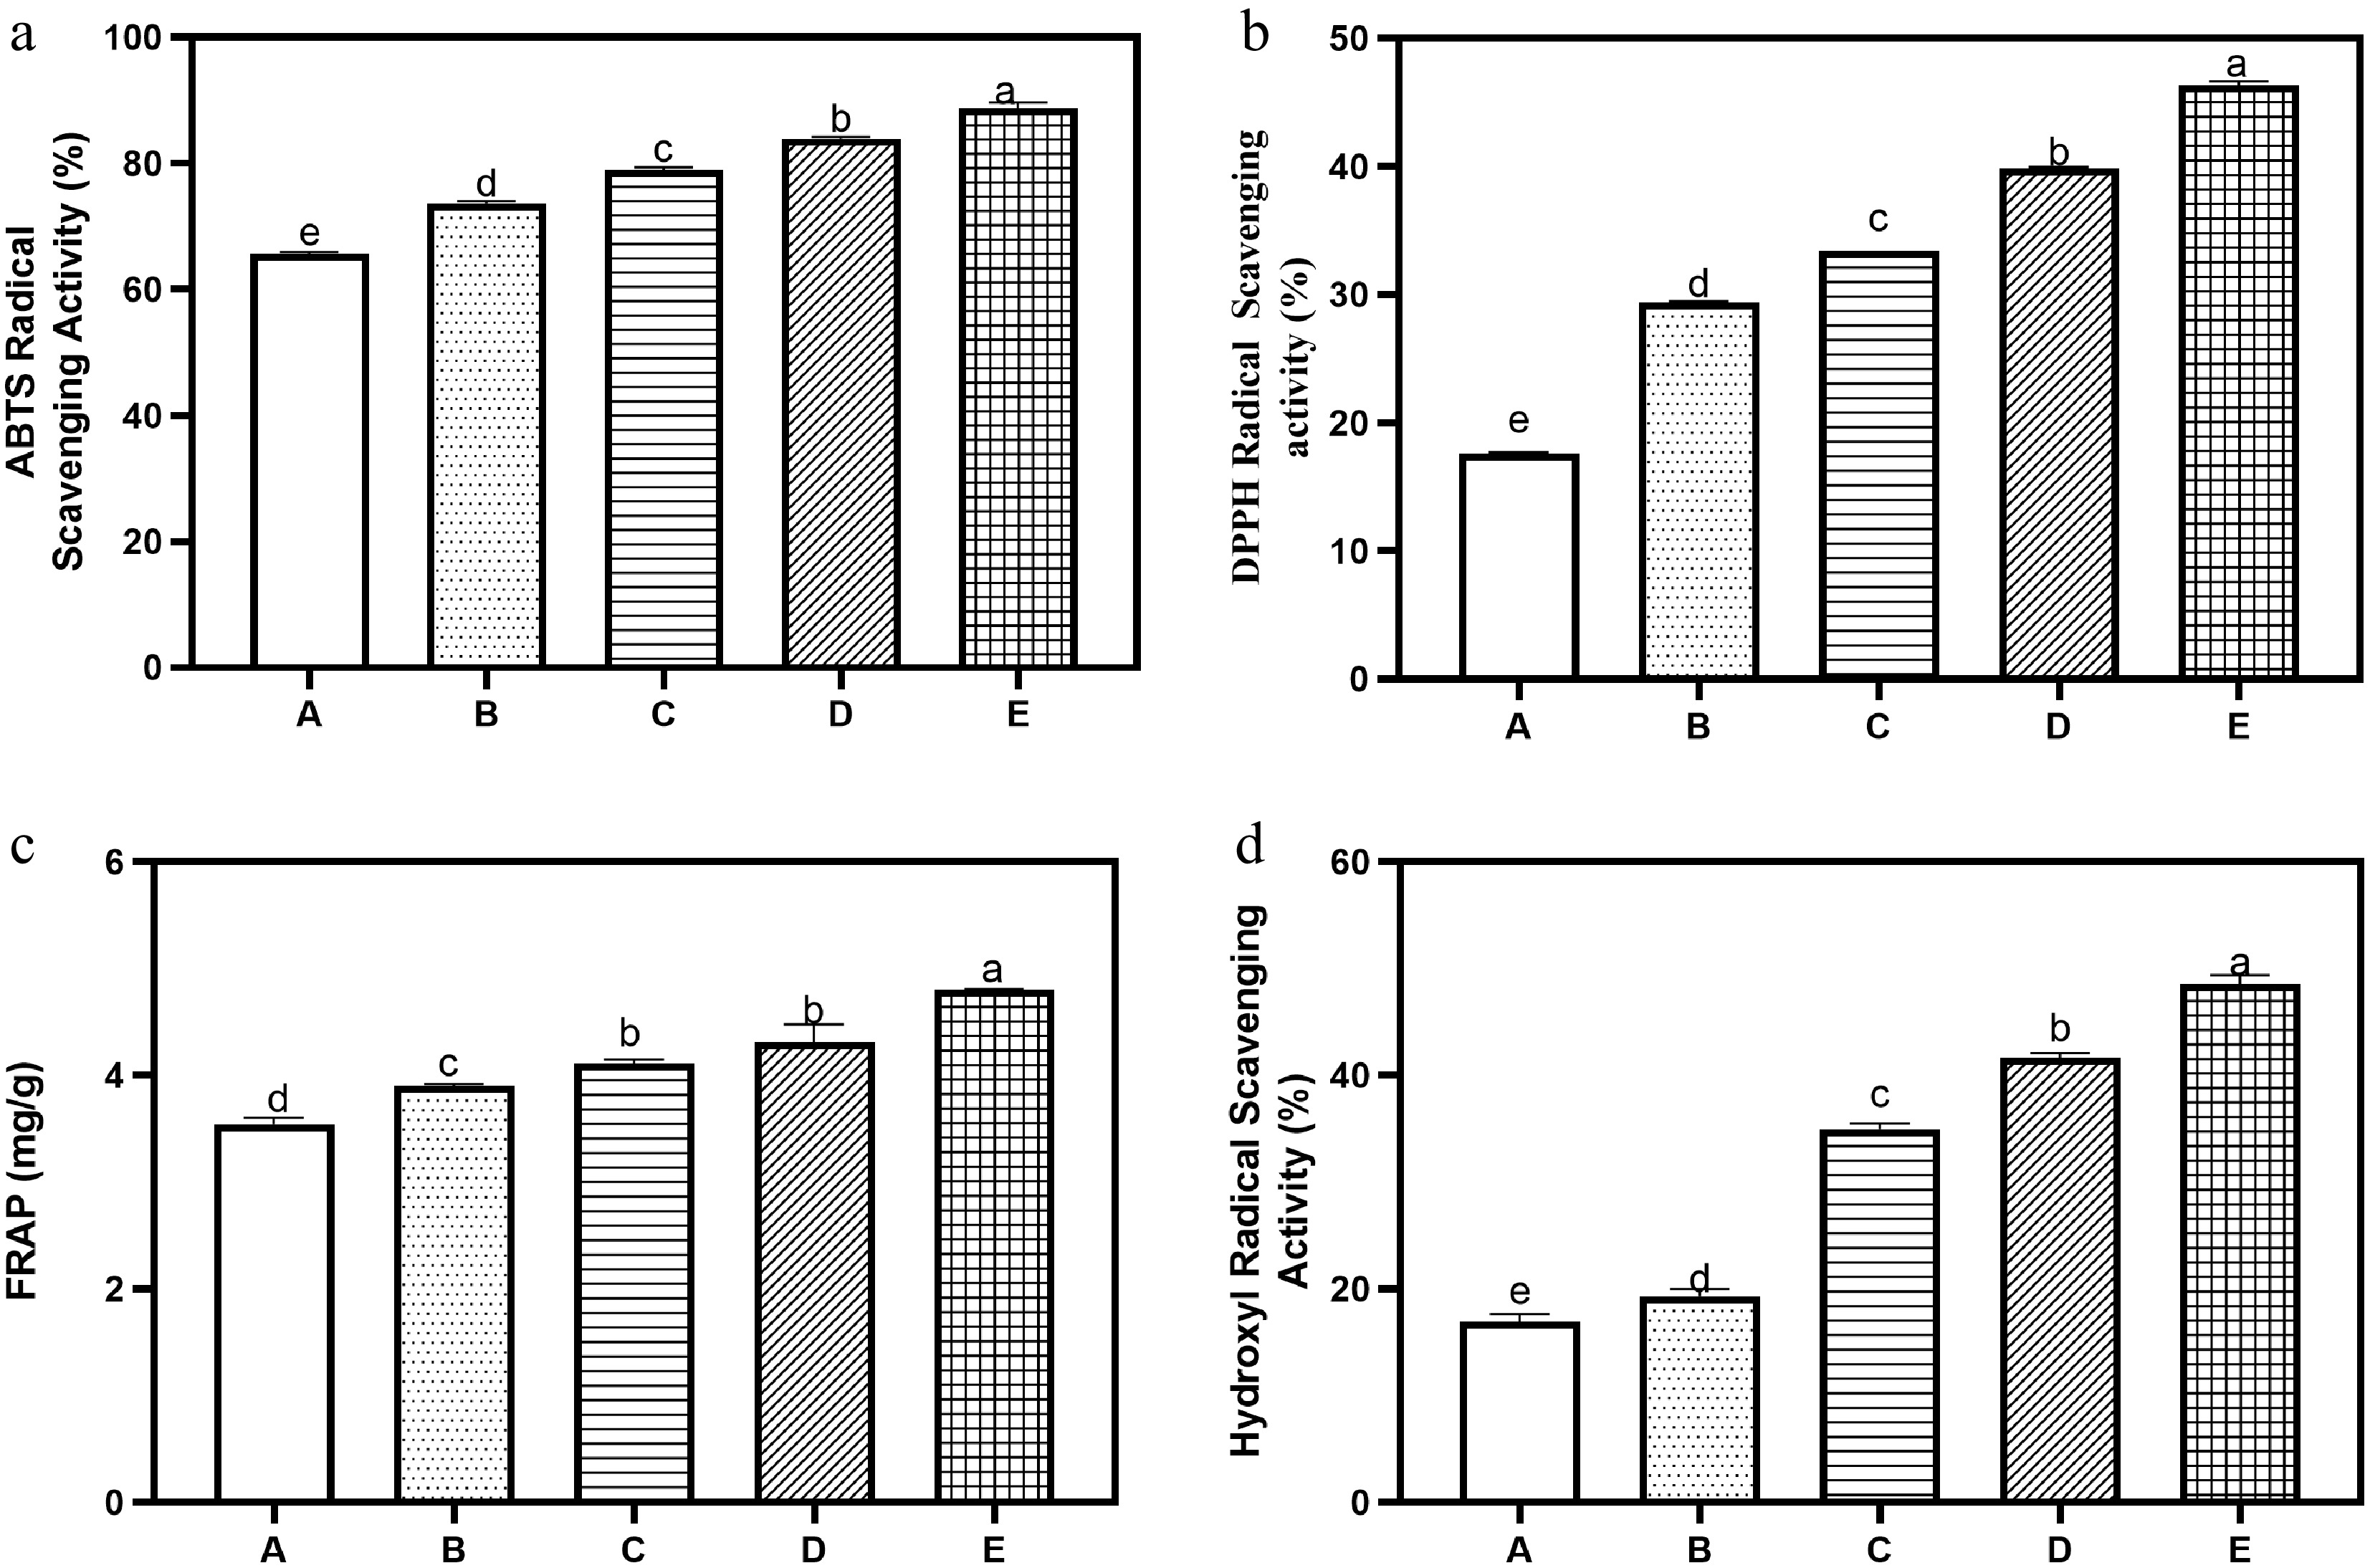
Figure 2.
Antioxidant properties of bread with tigernut flour supplementation: (a) ABTS, (b) DPPH, (c) FRAP, and (d) hydroxyl radical scavenging. Values are mean ± standard deviation. Bars with different superscripts are significantly different (p ≤ 0.05). Key: A (100% wheat flour), B (95% wheat flour, 5% tigernut flour); C (90% wheat flour, 10% tigernut flour); D (85% wheat flour, 15% tigernut flour); E (80% wheat flour, 20% tigernut flour).
The improved antioxidant activity can be attributed to the presence of phenolic compounds, flavonoids, and tocopherols naturally abundant in tigernuts[9,12]. The fact that all assays consistently showed improvement indicates that tigernut flour provides a wide spectrum of antioxidant molecules with different mechanisms of action—metal ion reduction (FRAP), radical scavenging (ABTS and DPPH), and hydroxyl radical neutralization (OH assay). This suggests that tigernut supplementation does not just enhance one type of antioxidant activity but strengthens the overall antioxidant defense potential of the bread. The nutritional relevance of this enhancement cannot be overlooked. Antioxidants in the diet help reduce oxidative stress, which is implicated in the development of chronic diseases such as cardiovascular disorders, cancer, and neurodegenerative diseases[2]. Therefore, incorporating tigernut flour into bread not only diversifies the nutrient profile but also adds functional value by improving the antioxidant potential of a commonly consumed staple food. It is also worth noting that although extractable phenolic and flavonoid contents showed a declining trend with substitution (Fig. 1a & b), the antioxidant activity still increased consistently. This suggests that other bioactive compounds in tigernut, such as tocopherols, sterols, and unsaturated fatty acids may contribute significantly to the observed antioxidant capacity, possibly in synergy with the remaining phenolic compounds[9,12].
In-vitro antidiabetic properties
-
The antidiabetic potential of the bread samples, as presented in Fig. 3a & b, revealed two contrasting trends for the enzymes studied. The inhibitory activity against α-amylase (Fig 3a) was highest in the control bread (75.76%), and declined steadily as tigernut flour substitution increased, reaching 16.88% at the 20% substitution level. This suggests that components inherent in wheat flour, such as resistant starch and certain heat-stable compounds, likely contributed to α-amylase inhibition. As substitution with tigernut flour increased, these inhibitory factors were progressively diluted, which may explain the sharp decline observed. On the other hand, α-glucosidase inhibitory activity (Fig. 3b) showed a distinctly positive trend with tigernut flour inclusion. The control sample recorded the lowest inhibition at 29.6%, while bread with 20% substitution reached 67.00%. This represents a 126% improvement and is particularly significant because inhibition of α-glucosidase delays carbohydrate digestion and glucose absorption in the small intestine, leading to a more gradual rise in postprandial blood glucose levels. This mechanism is clinically relevant for type 2 diabetes management, as it helps reduce hyperglycemia after meals[31,32].
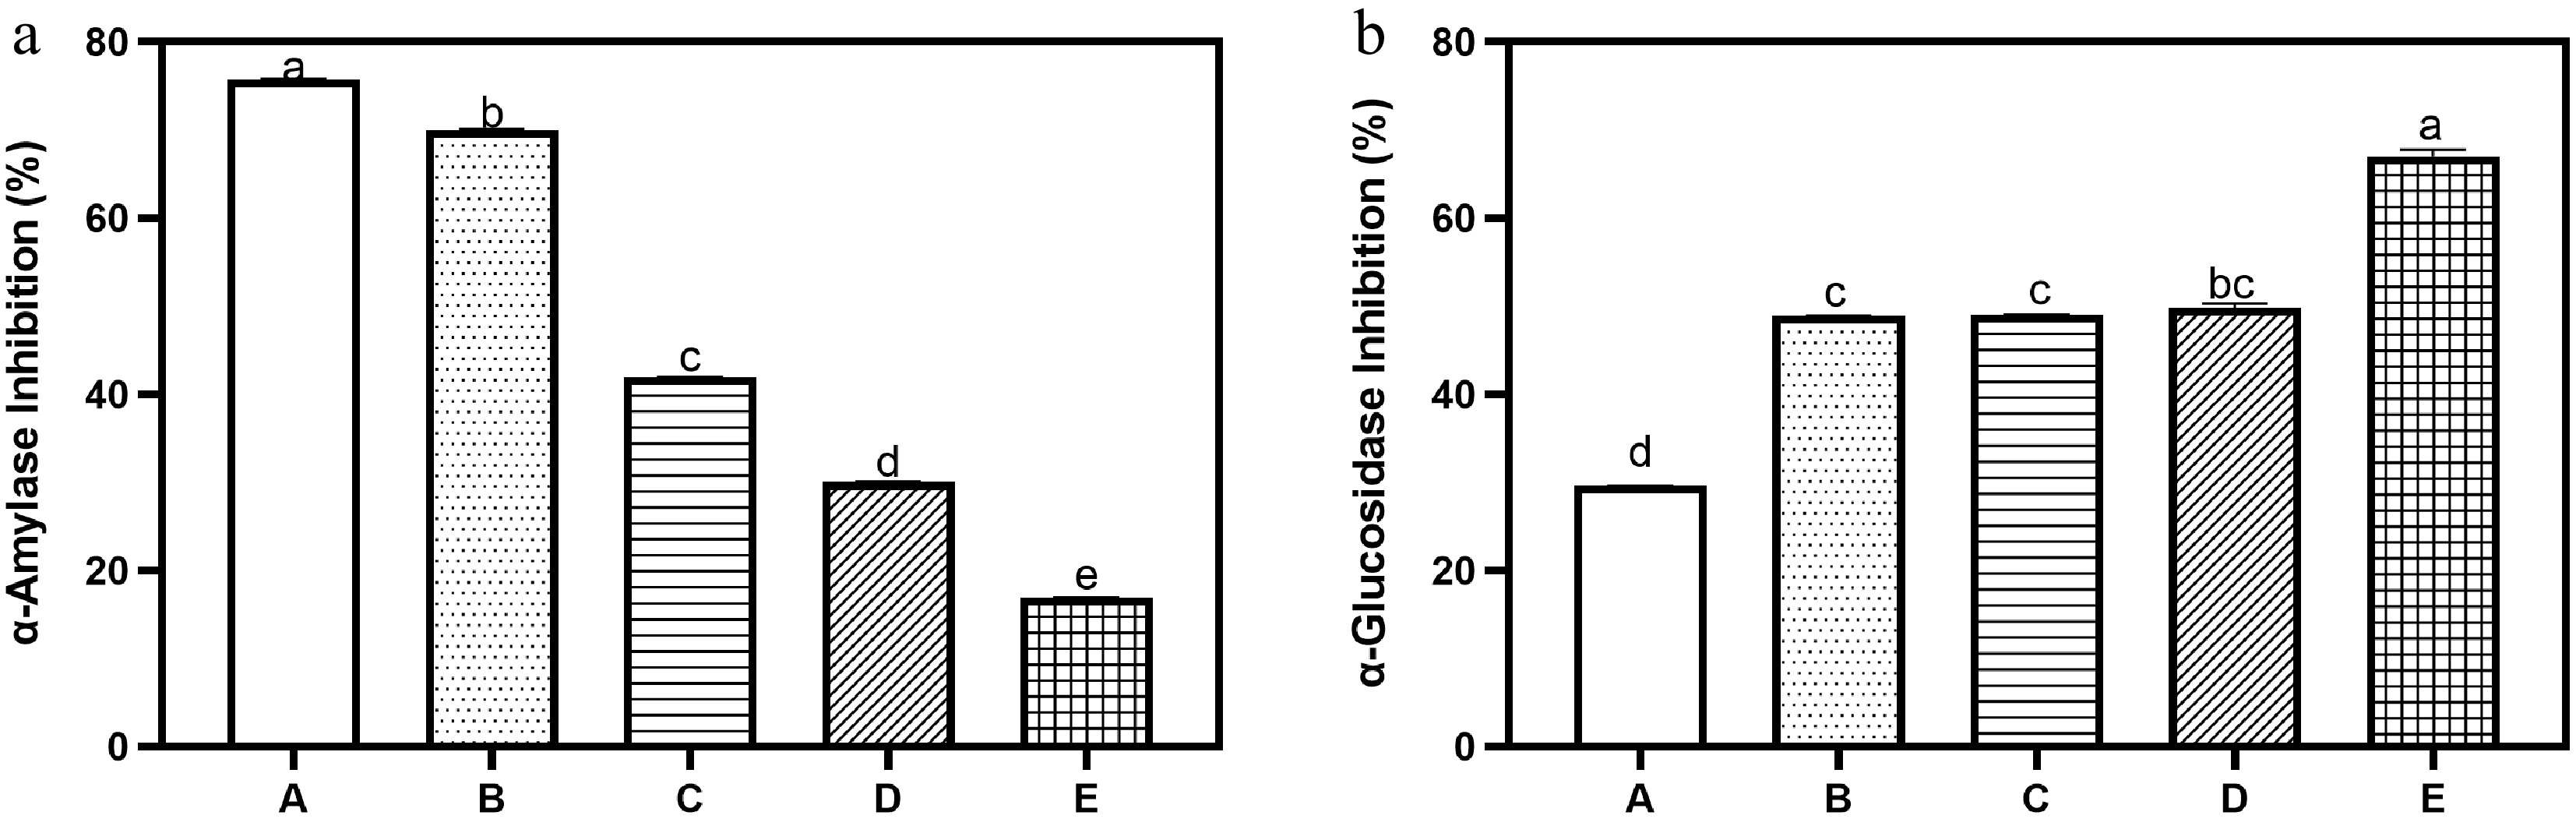
Figure 3.
Inhibition of (a) α-amylase, and (b) α-glucosidase potential of bread with tigernut flour supplementation. Values are mean ± standard deviation. Bars with different superscripts are significantly different (p ≤ 0.05). Key: A (100% wheat flour), B (95% wheat flour, 5% tigernut flour); C (90% wheat flour, 10% tigernut flour); D (85% wheat flour, 15% tigernut flour); E (80% wheat flour, 20% tigernut flour).
The contrasting patterns between the two enzymes may again confirm that different bioactive compounds are likely responsible for each type of inhibition. Tigernuts contain phenolic acids, flavonoids, and fibre-bound antioxidants, which may be more effective in inhibiting α-glucosidase than α-amylase[9,10]. This explains why α-glucosidase inhibition increased with substitution despite the fall in α-amylase inhibition. Such selective inhibition is valuable because excessive α-amylase inhibition can sometimes lead to undesirable gastrointestinal side effects, whereas α-glucosidase inhibition is the more clinically desirable target for regulating postprandial glycemia[21,31,32].
Sensory evaluation
-
The sensory evaluation results of the bread samples are presented in Table 3. The table provides important insights into consumer acceptance and the potential commercial viability of tigernut–supplemented bread. Crust colour scores remained fairly stable across all substitution levels, ranging from 6.40 in the control to 5.20 at 20% substitution. This stability indicates that tigernut flour did not greatly alter the external appearance of the bread. This is an important factor since visual appeal often influences first impressions of consumers[23]. Crumb colour, however, showed a progressive decline from 6.00 in the control to 4.50 at 20% substitution. The darker hue reflects the inherent colour of tigernut flour and its influence on the internal crumb. While darker crumbs may be acceptable in certain specialty breads, they can sometimes be perceived as less desirable compared to the lighter appearance of conventional wheat bread.
Table 3. Sensory evaluation of tigernut-supplemented wheat bread (n = 20).
Sample Crust colour Crumb colour Taste Aroma Overall acceptability A 6.40 ± 1.32a 6.00 ± 1.71a 5.80 ± 1.60a 5.50 ± 1.48a 5.90 ± 1.40a B 6.30 ± 1.42ab 5.85 ± 1.68a 5.75 ± 1.87a 5.00 ± 1.65ab 5.65 ± 1.38ab C 5.92 ± 1.44ab 5.71 ± 1.52ab 5.68 ± 1.39b 5.00 ± 1.65ab 5.58 ± 1.40a D 5.64 ± 1.29b 4.68 ± 1.40b 4.70 ± 1.46c 5.20 ± 1.74a 5.05 ± 1.50b E 5.20 ± 1.89b 4.50 ± 1.80c 4.50 ± 1.42d 4.80 ± 1.55a 4.75 ± 1.58b Values are mean ± standard deviation. Means with different superscripts within columns are significantly different (p ≤ 0.05). Key: A (100% wheat flour), B (95% wheat flour, 5% tigernut flour); C (90% wheat flour, 10% tigernut flour); D (85% wheat flour, 15% tigernut flour); E (80% wheat flour, 20% tigernut flour). Taste scores also decreased from 5.80 in the control to 4.50 at 20% substitution. The nutty and slightly sweet flavour of tigernut, although rich in nutritional appeal, may be unfamiliar to consumers accustomed to the neutral taste of wheat bread. Despite this, samples with 5% and 10% substitution maintained 5.75 and 5.68 scores, respectively. These scores were comparable to the control (5.80), suggesting that lower substitution levels strike an optimal balance between enhanced nutrition and acceptable flavour. These findings align with earlier reports where moderate levels of non-wheat flour inclusion were found to preserve taste acceptability, while still enriching nutritional value[15]. Aroma scores were relatively stable across the samples (5.50 in the control to 4.80 at 20% substitution), suggesting that the nutty aroma contributed by tigernut flour was generally well tolerated by panelists and did not negatively affect sensory acceptance. Overall acceptability followed a similar pattern to taste, with the highest scores recorded for the control (5.90), and the 5% substitution level (5.65), while significant reductions were noted at higher substitution levels. In summary, tigernut flour substitution at 5%–10% provided the best compromise between nutritional enhancement and sensory quality, supporting its potential for partial replacement of wheat flour in bread formulation.
-
The findings from this study suggest that tigernut flour can improve the functional and nutritional qualities of wheat bread. Tigernut was observed to reduce the amount of total extractable minerals, and decrease the amount of moisture and protein. It raised the amount of fat, ash, and dietary fibre. Additionally, the study showed that bread supplemented with tigernuts might have health benefits, especially for people with diabetes or prediabetes. At substitution levels of 5%–10%, the sensory benefits of tigernut-supplemented bread were at their peak. Higher substitution levels recorded very low overall acceptability and taste. The results lend credence to tigernut flour's potential as a useful component in bread recipes. This study provides insight into the nutritional and sensory properties of tigernut-supplemented wheat bread, but several limitations should be noted. Only a limited range of substitution levels was tested, and anti-nutritional factors were not measured. Shelf-life stability and extended sensory attributes were not evaluated, and results may differ under industrial-scale production or with a broader consumer panel. Future studies should address these aspects to strengthen practical applications. Overall, the development of tigernut-supplemented bread offers a practical opportunity to produce healthier, fibre-rich bakery products with potential benefits for blood glucose regulation and strong appeal to health-conscious consumers.
No funding was received for this study.
-
The authors confirm contribution to the paper as follows: study conception and design: Aderinola TA; data collection: Adewoye OO, Aderinola TA, Kareem BR, Adeboye A; draft manuscript preparation: Adewoye OO. All authors reviewed the results and approved the final version of the manuscript.
-
All data generated or analyzed during this study are included in this published article.
-
The authors declare that they have no conflict of interest.
- Copyright: © 2025 by the author(s). Published by Maximum Academic Press on behalf of Nanjing Agricultural University. This article is an open access article distributed under Creative Commons Attribution License (CC BY 4.0), visit https://creativecommons.org/licenses/by/4.0/.
-
About this article
Cite this article
Aderinola TA, Kareem BR, Adewoye OO, Adeboye A. 2025. Optimizing tigernut flour inclusion in wheat bread for enhanced nutritional, functional, and sensory quality. Food Materials Research 5: e024 doi: 10.48130/fmr-0025-0024 

Optimizing tigernut flour inclusion in wheat bread for enhanced nutritional, functional, and sensory quality
- Received: 06 September 2025
- Revised: 04 November 2025
- Accepted: 15 December 2025
- Published online: 30 December 2025
Abstract: This present study evaluated the effects of tigernut (Cyperus esculentus) flour supplementation on the proximate composition, mineral content, antioxidant activity, antidiabetic properties, and sensory attributes of wheat-tigernut bread. Composite breads were formulated using wheat flour substituted with tigernut flour at ratios of 95:5, 90:10, 85:15, and 80:20 (wheat : tigernut), with 100% wheat flour serving as the control. Results showed that tigernut supplementation significantly (p ≤ 0.05) increased fat content (5%–7%), ash content (2.00%–2.40%), and fibre content (2.00%–2.80%). Moisture content decreased (13.00%–10.17%), and mineral concentrations showed a declining trend with increased substitution. Antioxidant activity increased significantly, reaching maximum values of 88.72% for 2,2'-azino-bis(3-ethylbenzothiazoline-6-sulfonic acid) (ABTS), 46.33% for 2,2-diphenyl-1-picrylhydrazyl (DPPH), and 48.58% for hydroxyl radical scavenging activity (OH) at 20% substitution. The α-glucosidase inhibitory activity increased from 29.6% to 67.00% with higher tigernut flour inclusion, indicating enhanced antidiabetic potential. Sensory evaluation revealed that substitution levels up to 10% were well-accepted, with overall acceptability scores declining significantly at higher inclusion rates. These findings demonstrate that tigernut flour can be successfully incorporated into bread formulations at 5%–10% substitution levels to enhance nutritional and functional properties while maintaining acceptable sensory characteristics.