


-
Retinal vein occlusions (RVOs) are one of the most common vascular disorders caused by the obstruction of retinal veins. RVOs usually affect the retina and potentially lead to significant visual impairment. RVOs can be classified into branch retinal vein occlusions (BRVOs) and central retinal vein occlusions (CRVOs), and would result in the progression of nonperfusion areas (NPAs, regions lacking adequate blood flow)[1,2]. For patients with RVO, NPA progression is a critical determinant of visual prognosis, as it drives retinal hypoxia, neovascularization, and subsequent complications, all of which increase the risk of irreversible vision loss[3−6]. Despite the clinical importance of NPA progression, current approaches for early detection and longitudinal monitoring remain suboptimal, underscoring the need for advanced prognostic tools to guide therapeutic decision-making.
Traditional imaging techniques like Fluorescein Angiography (FA) and Indocyanine Green Angiography (ICGA) have been used to visualize NPAs, which, unfortunately, are invasive and have limited capabilities to characterize these areas[7]. Optical Coherence Tomography Angiography (OCTA) has emerged as a non-invasive alternative that enables high-resolution 3D mapping of retinal perfusion. Parameters such as foveal avascular zone (FAZ) area, vessel density (VD), and fractal dimension (FD) derived from OCTA have shown associations with NPA severity[8−12]. However, these metrics lack validated longitudinal predictive utility for NPA progression. Current studies predominantly rely on cross-sectional analyses, failing to account for dynamic vascular remodeling over time[11]. Furthermore, conventional radiomics approaches in RVO research are constrained by 2D image analysis, which overlooks the spatial complexity of 3D microvascular networks and limits feature extraction to planar textures[4]. Although Carrera-Escalé et al. and Meng et al. applied 2D radiomics to OCTA for diabetic retinopathy diagnosis[13,14], these methods remain limited for RVO prognostication due to their inability to capture depth-resolved capillary changes that are essential to characterize ischemia progression.
Notably, the Swept-Source OCTA (SS-OCTA) has the ability to visualize microvasculature with advancing depth and high resolution, so as to visualize the deep vascular plexus (DVP) and choriocapillaris as key sites of RVO-related pathology[15−17]. Despite these advancements, existing prognostic models for NPA progression remain limited by two factors: (1) reliance on isolated clinical biomarkers (e.g., FAZ metrics) with poor generalizability across heterogeneous RVO subtypes; and (2) lack of use of 3D spatial information in radiomics frameworks[13,14]. While recent work by Kar et al. presents a 3D-based radiomics method for macular edema classification[18], their study focused on using standard OCT images, rather than more advanced SS-OCTA data. In addition, the use of traditional radiomics methods means that the method cannot fully leverage the complementary multimodal features within SS-OCTA data.
Given the current limitations, our study introduced the first hybrid framework, named SS-OCTA-omics, where we propose to integrate 3D SS-OCTA radiomics with a ConvNeXt-tiny-based deep learning architecture for predicting NPA progression in RVO. Our approach aimed to quantify microvascular heterogeneity through radiomics and also contextualize it within 3D anatomical structures via deep learning, as such, offering a quantitative, non-invasive solution to enhance RVO management and prognostication.
-
The overall flow diagram of the proposed SS-OCTA-omics framework is shown in Fig. 1. SS-OCTA images and clinical data were retrospectively collected from 87 RVO patients. Data were randomly divided into training (0.68) and testing (0.32) datasets. To further assess the generalizability and robustness of the proposed framework, an additional external validation dataset consisting of 109 patients was included from a remote branch of our hospital located in Song Jiang District, Shanghai. After that, the flood fill algorithm was implemented for automated regions of interest (ROI) selection, which had been applied in the previous studies[19,20]. A detailed pipeline for preprocessing the original data and ROI selection has been included in Supplementary Fig. S1. Radiomics features, including shape, first-order, and texture features, were extracted using PyRadiomics from the ROIs. The Minimum Redundancy-Maximum Relevance (mRMR) feature selection algorithm was applied to identify the top 50 predictive features. For the SS-OCTA-omics fusion (Fig. 1c), 3D SS-OCTA volumes were input into a ConvNeXt-tiny model, and deep learning-derived features were concatenated with the selected radiomics features. This fused approach was benchmarked against conventional machine learning models (e.g., SVM, AdaBoost) for NPA progression prediction. Figure 1d shows the evaluation, where our models were evaluated using several commonly used metrics. A Grad-CAM heatmap was also implemented to enhance model interpretability[21].
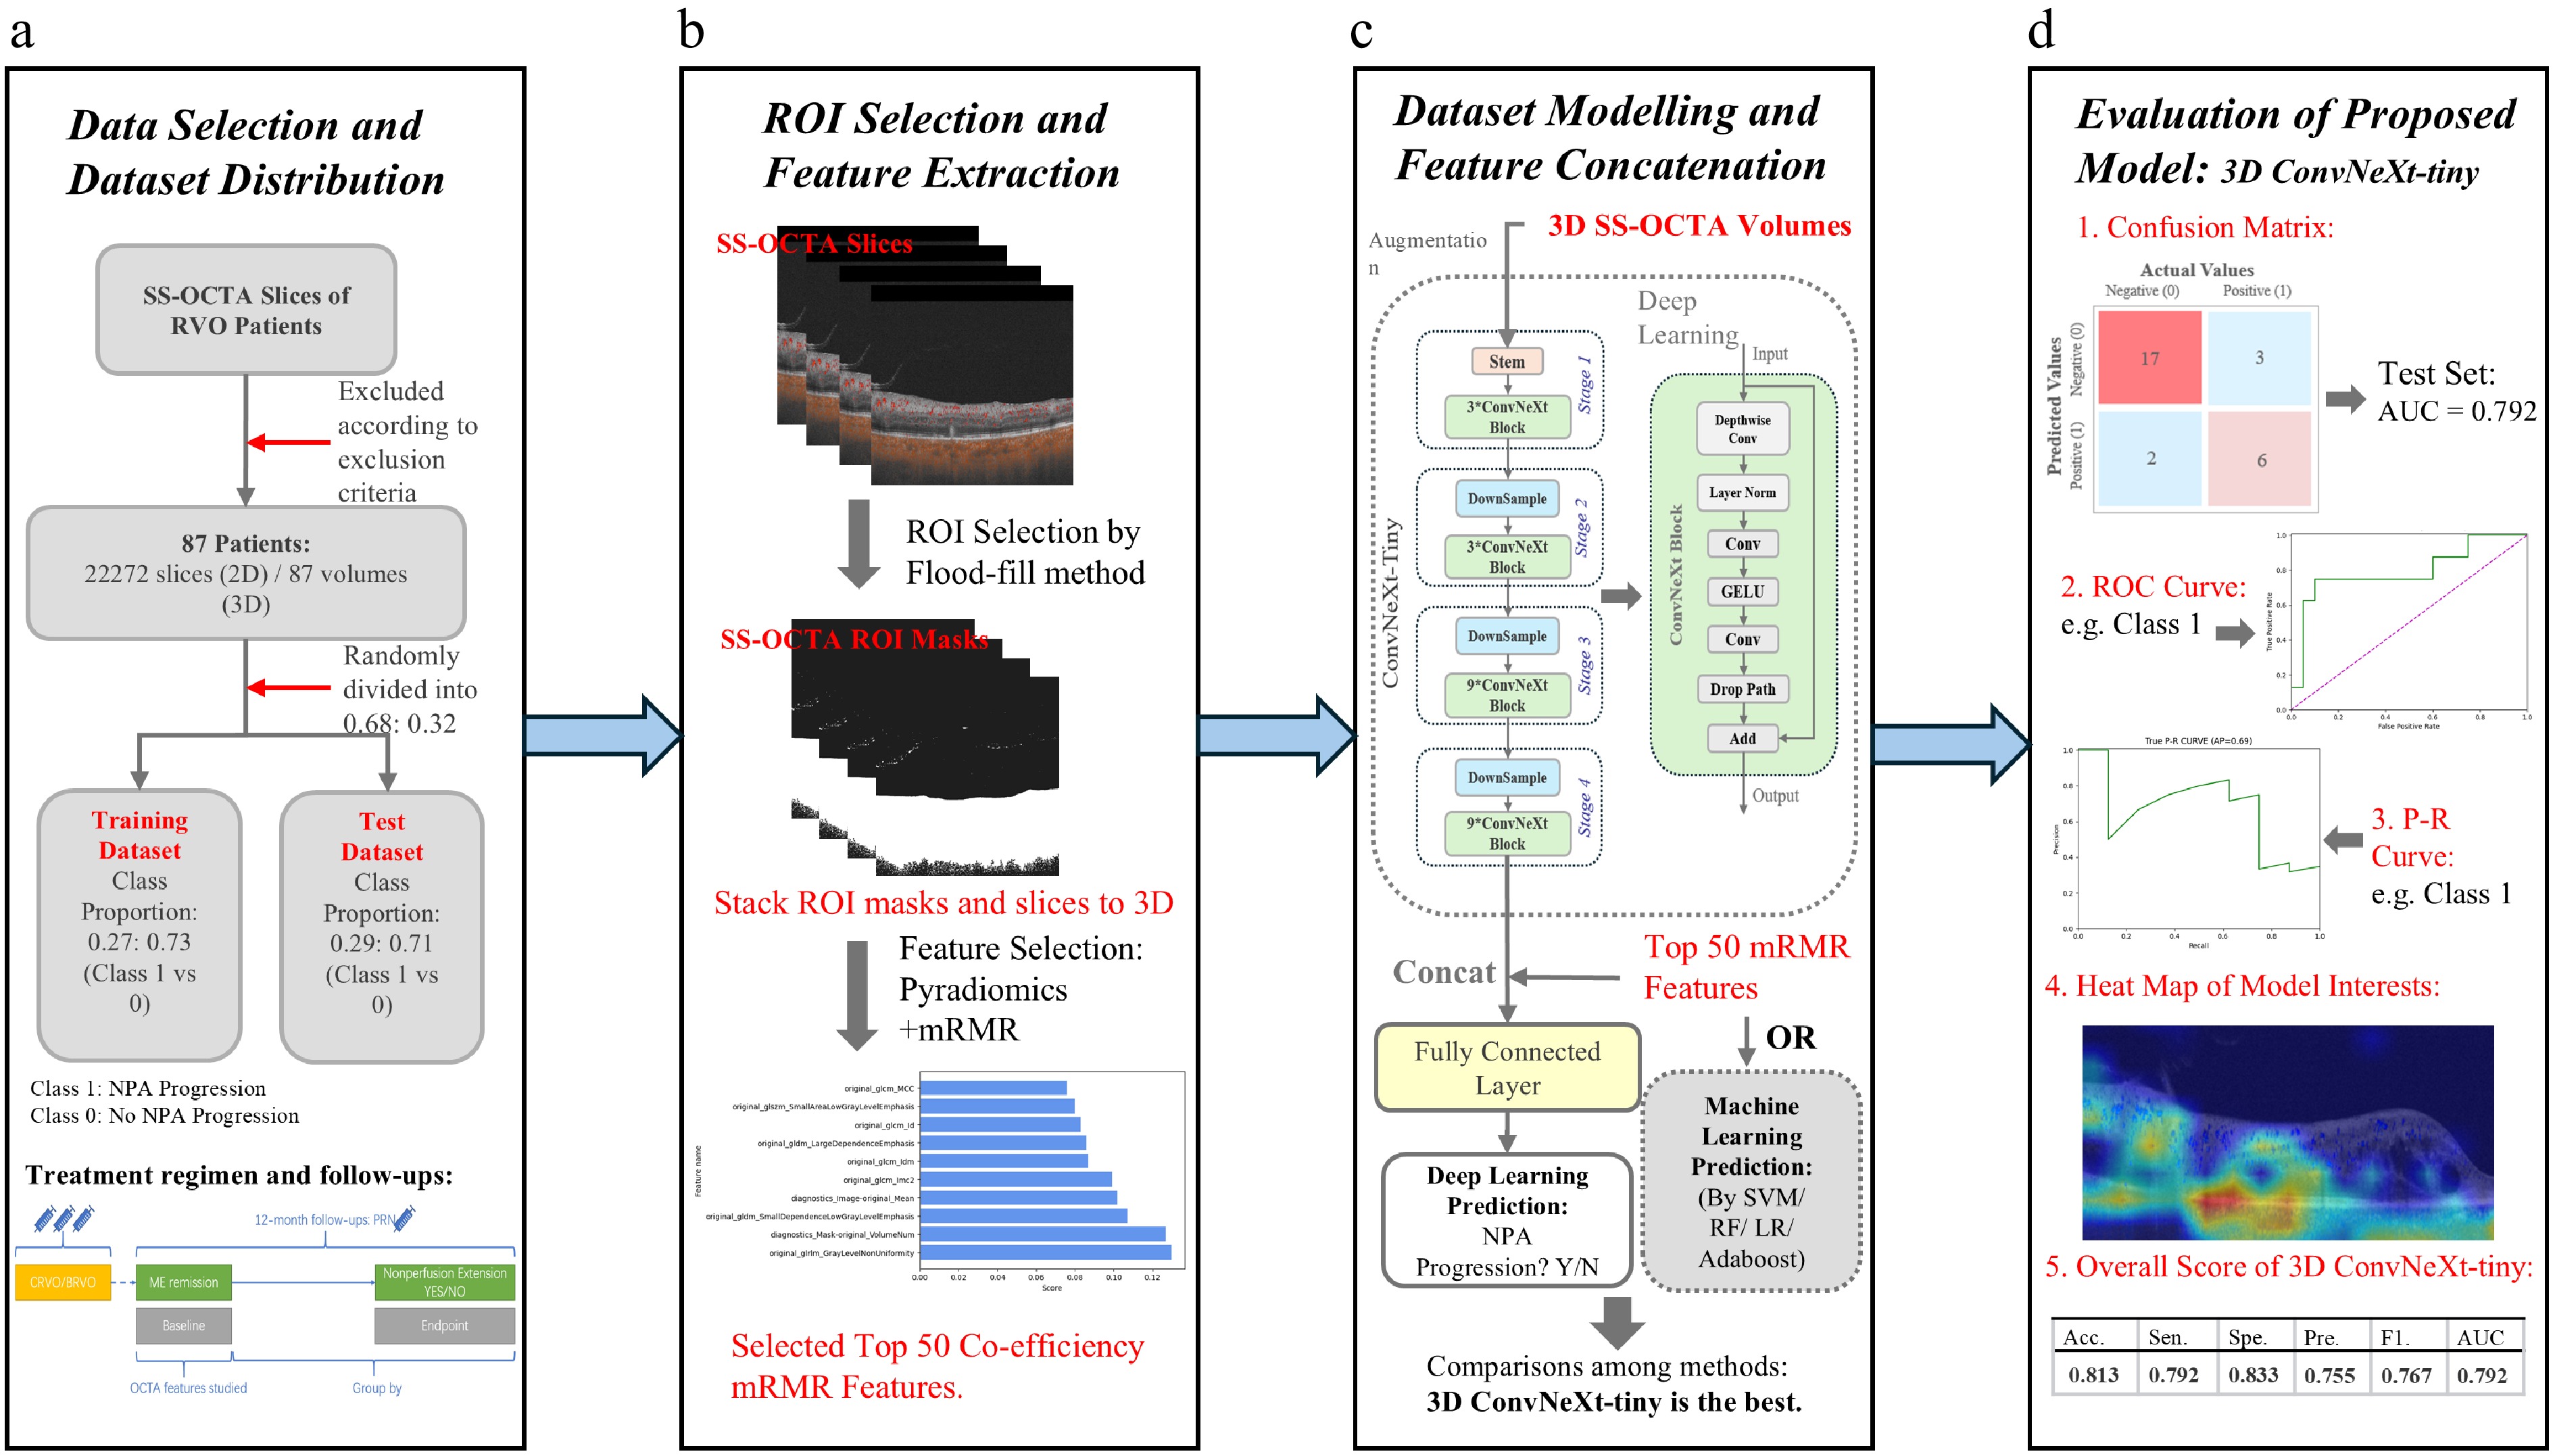
Figure 1.
The flow diagram of our proposed SS-OCTA-omics. (a) Indicates the screening method regarding the selection criteria of the clinical data and acquisition of original SS-OCTA images. The acquired dataset is divided into a training dataset and a test dataset at a ratio of 0.68:0.32. (b) Shows the Regions of interest (ROI) selection and feature selection. (c) Shows the integration of deep learning features with the selected radiomics features. (d) Shows the evaluation results together with an example heatmap visualization.
Patient cohort
-
Electronic medical records of macular edema patients with a history of CRVO or BRVO at the Department of Ophthalmology, Shanghai General Hospital, from May 25th, 2020 to January 12th, 2023, were reviewed. The diagnosis of CRVO or BRVO was confirmed by a retinal specialist (SY) using multimodal images, including color fundus photography (Clarus 500, Carl Zeiss), spectral domain OCT (Spectralis HRA, Heidelberg), and widefield swept-source OCTA (SS-OCTA) examination (VG200D, Intalight [former SVisionImaging]). All patients underwent three loadings of anti-VEGF (ranibizumab, Lucentis) intravitreal injections followed by pro re nata (PRN) regimen. This study was conducted in accordance with the tenets of the Declaration of Helsinki and was approved by the Ethics Committee of Shanghai General Hospital (YLK2023-415). All included participants provided informed consent before their inclusion in the study. Patient data were anonymized and treated confidentially to ensure privacy and comply with data protection regulations.
All patients were followed up for at least 12 months. The OCT/OCTA was performed together with slit-lamp and indirect ophthalmoscopy at each visit. Detailed treatment regimen and follow-up can be found in Supplementary Fig. S2. The first visit for the PRN regimen was defined as the baseline visit. The intervals from the last loading of anti-VEGF injection to enrollment were 1 to 2 months.
The eligibility criteria for patient selection are as follows: PRN baseline visit shows a macular central subfield thickness (CST) of less than 320 μm on OCT and aged over 18 years old[22]. Eyes that received intravitreal steroid injection/implant, or were resistant to anti-VEGF treatment, were excluded. Other exclusion criteria are: (1) macular edema (ME), including intra- or subretinal fluid, silting in the macular region, which is the secondary to diabetic macular edema (DME), and age-related macular degeneration, and postsurgical macular edema (e.g., cataract surgery, epi-macular membrane surgery); (2) significant media opacity (e.g., corneal opacity, cataract) which is interfering OCTA examination; (3) history of ocular trauma or surgery for the last 6 months before the inclusion; (4) uncontrolled glaucoma, i.e., progressive visual field loss and/or intraocular pressure (IOP) > 25 mmHg, despite maximal antiglaucoma treatment in the study eye; (5) bilateral RVO; (6) eyes with RVO-induced vitreous hemorrhage or pre- or intraretinal hemorrhage that could impair visualization of the retinal and choroidal vasculature; (7) patients with poor-quality OCTA images or incomplete medical records; (8) NPA is more than 10 PD in the posterior pole of CRVO and more than 5 PD in the posterior pole of BRVO; and (9) the presence of any ocular disease or media opacity in the fellow eye[3].
SS-OCTA scan
-
Each of the SS-OCTA scans consists of 256 slices. The included vision area varies from a wider area of 12 × 12 mm2 (76 patients), 9 × 9 mm2 (6 patients), to 6 × 6 mm2 (5 patients). Automatic layer segmentation and measures were reviewed by two primary graders (YX and HW), manually adjusted when necessary, with all corrections secondarily adjudicated by a senior retinal specialist (SY), following previously described OCTA grading workflows in RVO[23]. The Foveal Avascular Zone (FAZ) parameters (including area, perimeter, circularity and total retinal VD 300 µm around the FAZ perimeter)[24], and the VD of the DVP, as well as the superficial vessel plexus (SVP) and in the widefield were automatically generated by the OCTA built-in algorithm shown in Fig. 2. The VD included the mean VD of the general early treatment diabetic retinopathy study rings and the sectional VD, i.e., the superior, temporal, inferior, or nasal section sectional VD. NPA and Papillary Disc area (PD) were also automatically generated by the OCTA built-in algorithm and manually adjusted using the same workflows.
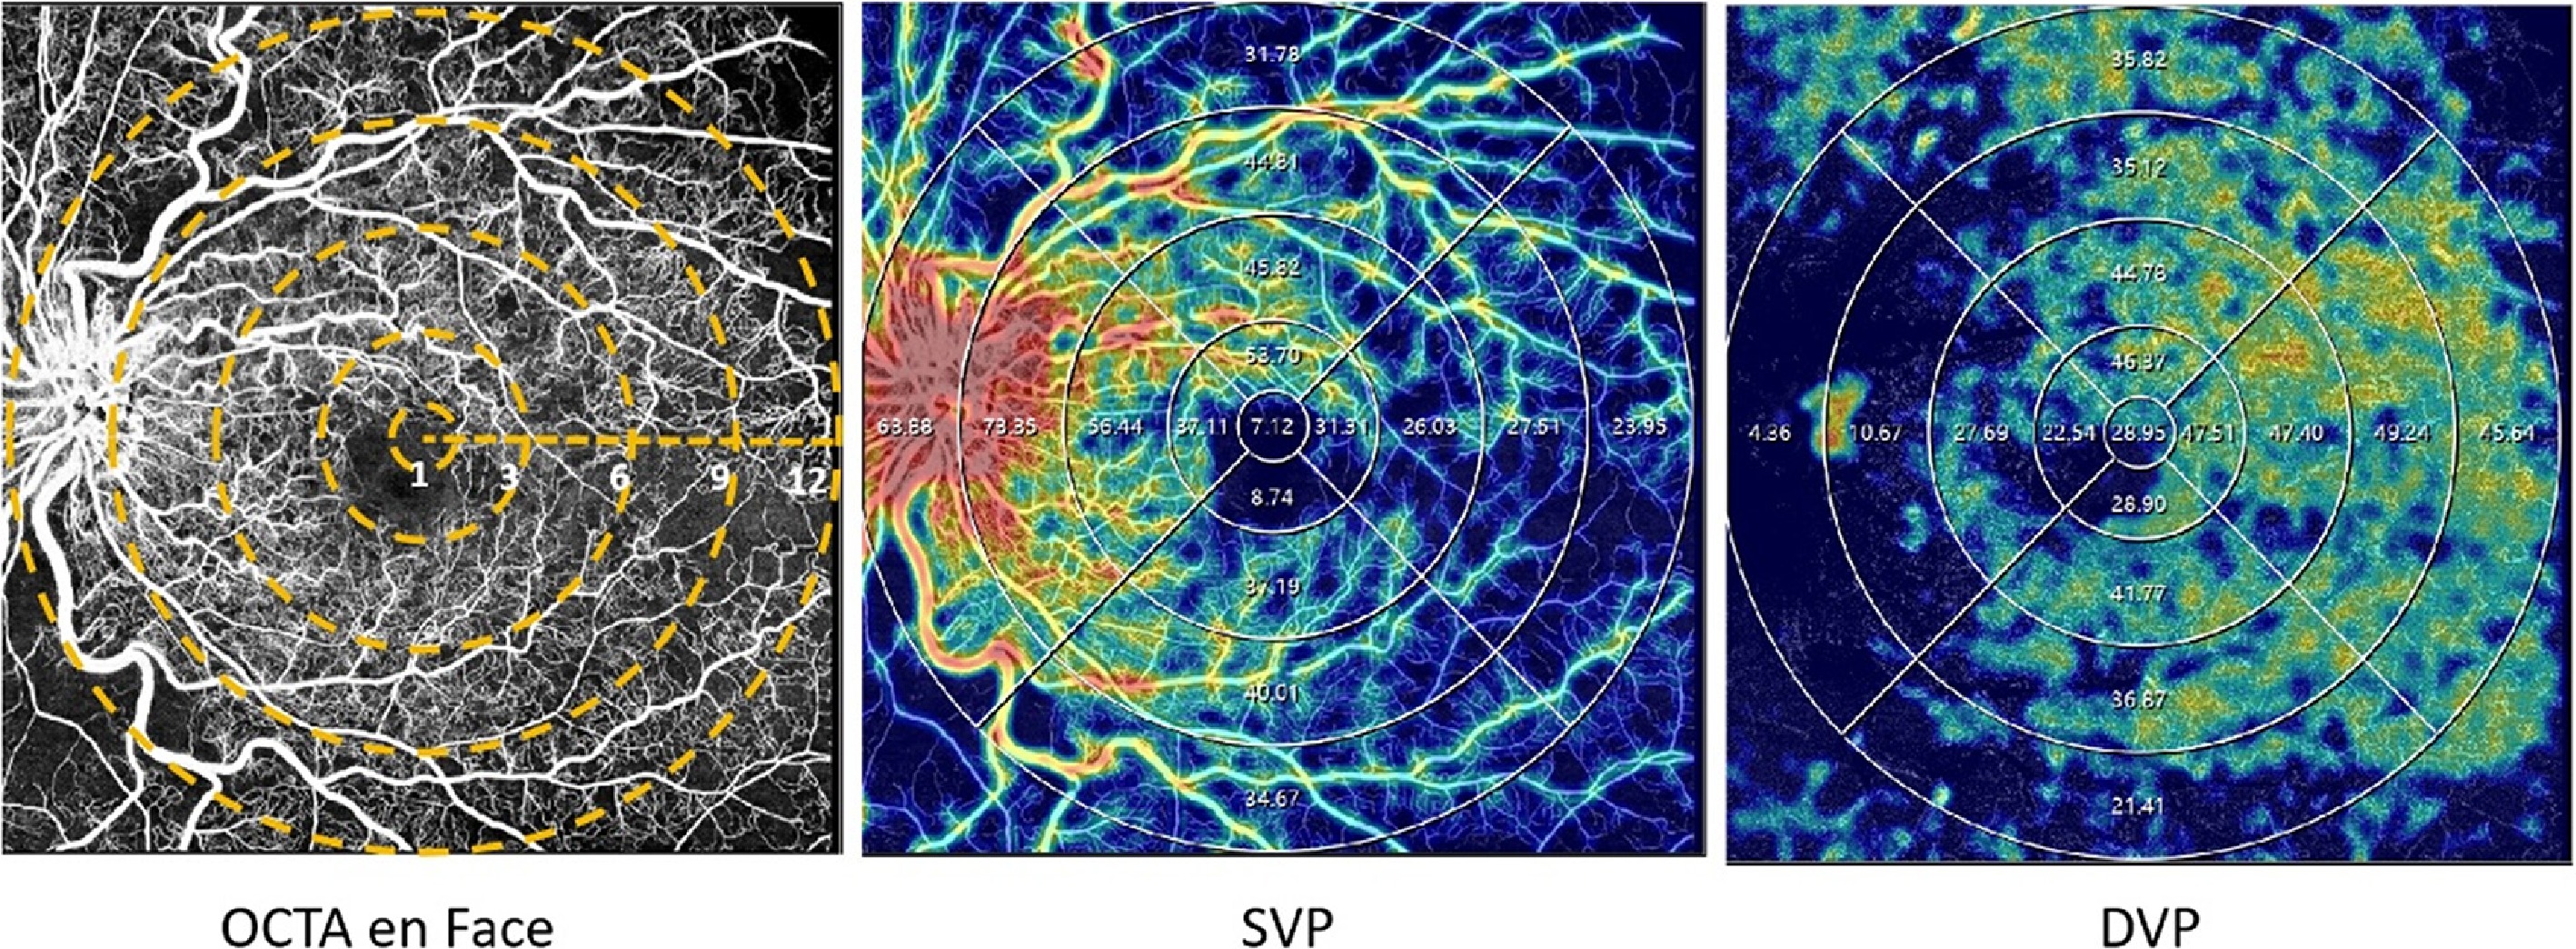
Figure 2.
Examples of quantitative measurement using OCTA. The left column represents the en face images (12 × 12 mm2) of color maps for vessel density. The middle and right columns represent the en face images of the corresponding layer of the SVP, and DVP of color perfusion maps. The vessel density of the SVP, and DVP were separately calculated in the whole area (diameter of 12 mm) and concentric rings with different radii (0–1,1–3, 3–6, 6–9, and 9–12 mm2). DVP refers to deep vascular plexus; SVP represents superficial vascular plexus.
Quantification of angiographic parameters and dataset establishment
-
NPA progression was defined as an increase in the total nonperfusion area of more than one Papillary Disc area between baseline and the follow-up OCTA scans (ΔNPA > 1 PD)[25]. Eyes with ΔNPA > 1 PD were classified as the progression group (Class 1), whereas eyes with ΔNPA ≤ 1 PD were classified as the non-progression group (Class 0).
Fractal dimension (FD) referred to vascular complexity and was calculated via ImageJ (
https://github.com/imagej ), generated by 2 selected OCTA vessel images at the SVP and DVP level. 116 clinically measured features were processed, which include two fractal dimension features, four FAZ-related parameters, 55 SVP features, and 55 DVP features[26]. Collateral vessel formation was identified on the en face OCTA images of the whole retinal layer. The boundaries of the SVP extended from 3 μm below the internal limiting membrane to the inner ⅔–inner plexiform layer (GCIPL), and the boundaries of DVP were from the inner ⅔ border of the GCIPL to 25 μm below the outer plexiform layer. The DVP includes the deep capillary plexus as well as the intermediate capillary plexus (usually noted as the deep capillary plexus in the previous study)[27].We first established the 2D/3D dataset, which has 87 volumes in total, and each volume belongs to one patient (one eye/the more serious one if both eyes had diseases), and each volume consists of 256 slices. All the enrolled slices for the 87 volumes were used to form the 2D dataset, which consists of 22,272 images (slices). Each image is a B-scan combined with Angio-flow. The patient allocation in the training and test datasets was kept the same for both 3D and 2D datasets. Supplementary Fig. S3 shows two example studies.
An additional external validation 2D/3D dataset that consists of 109 patients was included to further evaluate the generalizability and robustness of the proposed framework. Each 3D volume from the external dataset belongs to one patient (one eye), and each volume consists of 256 slices; the 2D dataset consists of 27,904 images (slices). All preprocessing and radiomic feature extraction procedures were performed identically to those on the internal dataset. For each comparative model (including classical 2D/3D radiomics-based machine learning methods and deep learning models such as ResNet, ViT, and ConvNeXt-tiny), external validation was conducted without re-training to ensure a fair evaluation of cross-domain performance. The proposed 3D ConvNeXt-tiny + 3D mRMR feature fusion model from SS-OCTA-omics was also evaluated on this external dataset to validate its cross-modality generalization and robustness against patient-level variations.
2D and 3D feature extraction and selection
-
Following the pipeline in Supplementary Fig. S1, we processed the original data acquired from different FOVs (12 × 12 mm2, 9 × 9 mm2, and 6 × 6 mm2) by explicitly computing the physical-to-pixel mappings to keep the cropped regions corresponding to the same anatomical size in physical space. Then, images were resized into 256 × 256 pixels, and we further used the flood fill algorithm to extract ROIs masks for all the slices, where the ROIs were used for feature extraction. We used the PyRadiomics package (
https://github.com/AIM-Harvard/pyradiomics ) algorithm to extract the first-order, shape, filtered, and texture-based radiomics features, Gray-level run length matrix (GLRLM), Gray-level co-occurrence matrix (GLCM), Gray-level size zone matrix (GLSZM), Gray-level dependence matrix (GLDM), Neighborhood gray-tone difference matrix (NGTDM) features[28]. The 3D dataset was made by stacking 256 2D slices for each patient and has not performed any further resizing operation, and the corresponding ROI masks were also made 3D by stacking related 256 slices. We also applied Radiomics feature extraction to 3D voxels with ROI masks.The extracted radiomics features were fed into the mRMR algorithm with mutual information difference (MID) criterion to select a set of 50 optimal features[29]. The MRMR-MID method was used as it outperformed other feature selection methods, such as the Least Absolute Shrinkage and Selection Operator (LASSO) and Principal Component Analysis (PCA). The selected features were standardized by z-score normalization to form a standard normal distribution (mean value equals 0 and the standard deviation is 1).
Development of machine learning and SS-OCTA-omics models
-
Machine learning models based on SVM, Logistic Regression (LR), and Adaboost were trained with selected features. A grid search pipeline was used to find the optimal parameter combinations. Detailed parameters for each method are shown in Supplementary Table S1.
Clinically defined biomarkers, including FAZ area, vessel density (VD), fractal dimension (FD), superficial vascular plexus (SVP) features, and deep vascular plexus (DVP) features, have demonstrated correlations with the NPA progression. A total of 117 biomarkers were adopted for evaluation.
A random four-fold cross-validation was used inside the training dataset to develop the deep learning model. Within our SS-OCTA-omics, we leveraged ConvNeXt-tiny as a feature extractor for the 2D and 3D datasets[30], which is based on the Convolutional Neural Network (CNN) architectures for depthwise convolutions[31]. We evaluated different variants of ConvNeXt, which include ConvNeXt-base, ConvNeXt-small, and ConvNeXt-tiny, and chose ConvNeXt-tiny as the backbone for its better performance on the RVO dataset. To fit the 3D SS-OCTA volumes, the ConvNeXt-tiny extractor was modified into 3D. Moreover, our SS-OCTA-omics fusion strategy concatenated 3D radiomics features with deep learning-based features (extracted from 3D ConvNeXt-tiny). These fused features were fed into fully connected layers to predict NPA progression, which allows for the integration of handcrafted radiomic textures with the learned spatial semantic information. Data augmentation, including random 3D rotations and intensity perturbations (brightness and contrast jittering), was applied to effectively enlarge the training data and reduce memorization of subject-specific patterns. Dropout and early-stopping were adopted to prevent overfitting on a small dataset. To address the class imbalance without amplifying noise in the minority class, we adopted a conservative strategy on the training stage that combines label smoothing with a mild class weighting factor (1.2 for the NPA progression class).
The commonly used evaluation metrics were included for comparison, which are Accuracy (Acc. given by
$ \dfrac{True\ Positive+True\ Negative}{True\ Positive+True\ Negative+False\ Positive+False\ Negative} $ $ \dfrac{True\ Positive}{True\ Positive+False\ Negative} $ $ \dfrac{True\ Negative}{True\ Negative+False\ Positive} $ $ \dfrac{True\ Positive}{True\ Positive+False\ Positive} $ $ \dfrac{2\ True\ Positive}{2\ True\ Positive+False\ Positive+False\ Negative} $ -
Demographics of enrolled eyes are presented in Table 1. A total of 87 patients were enrolled in the internal cohort, and an independent cohort of 109 patients was used for external validation. The internal cohort included 36 CRVO patients and 51 BRVO patients. Sixty-three (72.41%) had no NPA progression while 24 (27.59%) eyes had NPA progression during the follow-ups, respectively. No statistically significant differences were observed between the progression group (Class 1) and the stable group (Class 0) in gender, age, RVO duration, and BCVA. The NPA progression was more common in BRVO than CRVO (p = 0.031). In the external validation dataset, 68 patients had BRVO and 41 patients had CRVO. The average age was 66 years. Most patients had hypertension (75%), while none had diabetes. The average best-corrected visual acuity (BCVA) was 0.95 LogMAR, and the mean disease duration was around 10 months. No statistically significant differences were observed between the progression group (Class 1) and the stable group (Class 0) in the external validation dataset. Baseline NPA averaged 3.62 PD in the internal cohort and 3.66 PD in the external cohort. The mean time to NPA progression was 6.58 months (BRVO: 6.84; CRVO: 5.60) internally, and 6.08 months (BRVO: 6.32; CRVO: 5.59) externally. The meanΔNPA was 1.79 PD (BRVO: 1.54; CRVO: 2.71) in the internal cohort and 2.06 PD (BRVO: 1.62; CRVO: 2.94) in the external cohort.
Table 1. Demographics of enrolled patients.
Characteristics Internal cohort External validation cohort Overall Stable Progressed p-value Overall Stable Progressed p-value Number of patients 87 63 24 109 58 51 Age (years) 65.17 (14.19) 64.83 (15.53) 66.08 (10.09) 0.714 66.35 (13.30) 66.17 (13.64) 66.55 (13.03) 0.782 Number of images 2D: 22272; 3D: 87 2D: 16128; 3D: 63 2D: 6144; 3D: 24 2D: 27904; 3D: 109 2D: 14848; 3D: 58 2D: 13056; 3D: 51 RVO duration (months) 9.91 (4.62) 10.06 (4.73) 9.50 (4.39) 0.614 10.11 (1.45) 10.00 (1.33) 10.24 (1.58) 0.326 IOP (mmHg) 14.84 (2.93) 14.81 (2.74) 14.92 (3.43) 0.875 14.75 (4.02) 14.66 (3.05) 14.84 (4.93) 0.640 DM (%) N/A N/A No 87 (100.00) 63 (100.00) 24 (100.00) 109 (100.00) 58 (100.00) 51 (100.00) Yes 0 0 0 0 0 0 Hypertension (%) 0.908 0.242 No 28 (32.18) 21 (33.33) 7 (29.17) 27 (24.77) 17 (29.31) 10 (19.61) Yes 59 (67.82) 42 (66.67) 17 (70.83) 82 (75.22) 41 (70.69) 41 (80.39) Hyperlipidemia (%) 1.000 0.198 No 74 (85.06) 54 (85.71) 20 (83.33) 73 (66.97) 42 (72.41) 31 (60.78) Yes 13 (14.94) 9 (14.29) 4 (16.67) 36 (33.03) 16 (27.59) 20 (39.22) BCVA, LogMAR 0.60 (0.38) 0.57 (0.36) 0.68 (0.44) 0.224 0.95 (0.66) 0.90 (0.57) 1.01 (0.76) 0.744 Disease (%) 0.031 0.387 BRVO 51 (58.62) 32 (50.79) 19 (79.17) 68 (62.39) 34 (58.62) 34 (66.67) CRVO 36 (41.38) 31 (49.21) 5 (20.83) 41 (37.61) 24 (41.38) 17 (33.33) Gender (%) 0.797 0.191 Female 47 (54.02) 33 (52.38) 14 (58.33) 50 (45.87) 30 (51.72) 20 (39.22) Male 40 (45.98) 30 (47.62) 10 (41.67) 59 (54.13) 28 (48.28) 31 (60.78) Baseline NPA(PD) 3.62 (1.37) 3.61 (1.46) 3.64 (1.10) 0.921 3.66 (1.15) 3.64 (1.15) 3.68 (1.16) 0.677 12 months NPA (PD) 4.36 (1.72) 4.01 (1.68) 5.29 (1.52) 0.002 4.65 (1.61) 3.93 (1.23) 5.47 (1.60) < 0.001 12 months ΔNPA (PD) 0.74 (0.70) 0.39 (0.37) 1.65 (0.55) < 0.001 0.99 (0.86) 0.29 (0.24) 1.79 (0.54) < 0.001 NPA Progression Total (n = 24) BRVO CRVO Total (n = 51) BRVO CRVO NPA (PD) 5.42 (1.57) 4.67 (0.33) 8.30 (0.83) < 0.001 5.74 (1.76) 4.57 (0.32) 8.09 (0.82) < 0.001 Time 6.58 (1.56) 6.84 (1.61) 5.60 (0.89) 0.090 6.08 (0.89) 6.32 (0.84) 5.59 (0.80) 0.004 ΔNPA (PD) 1.79 (0.62) 1.54 (0.27) 2.71 (0.71) 0.001 2.06 (0.73) 1.62 (0.23) 2.94 (0.58) < 0.001 * The results are presented in the format of mean (std). Abbreviation: BCVA: Best Corrected Visual Acuity; BRVO: Branch Retinal Vein Occlusion; CRVO: Central Retinal Vein Occlusion; DM: Diabetes Mellitus; IOP: Intraocular Pressure; NPA: Nonperfusion Area; RVO: Retinal Vein Occlusion; PD: Papillary Disc Area; ΔNPA: changes of NPA between follow-up visit and baseline. Comparisons of machine learning methods with SS-OCTA-omics
-
The partition strategies of our datasets are as follows: 28 patients (~32%) were used as the external independent test dataset, and the remaining 59 patients (~68%) were used as the training dataset. In total, 107 2D OCT-omics features were extracted. As for the 3D OCT-omics features, despite common first-order, filtered, and texture features, extra features, in particular for 3D images, were obtained with a total feature number of 118. Each patient has 256 sets of 2D features and one set of 3D volume features. The top ten features with their coefficient scores based on the 3D dataset, which achieved the best overall performance, are visualized and shown in Fig. 3a.
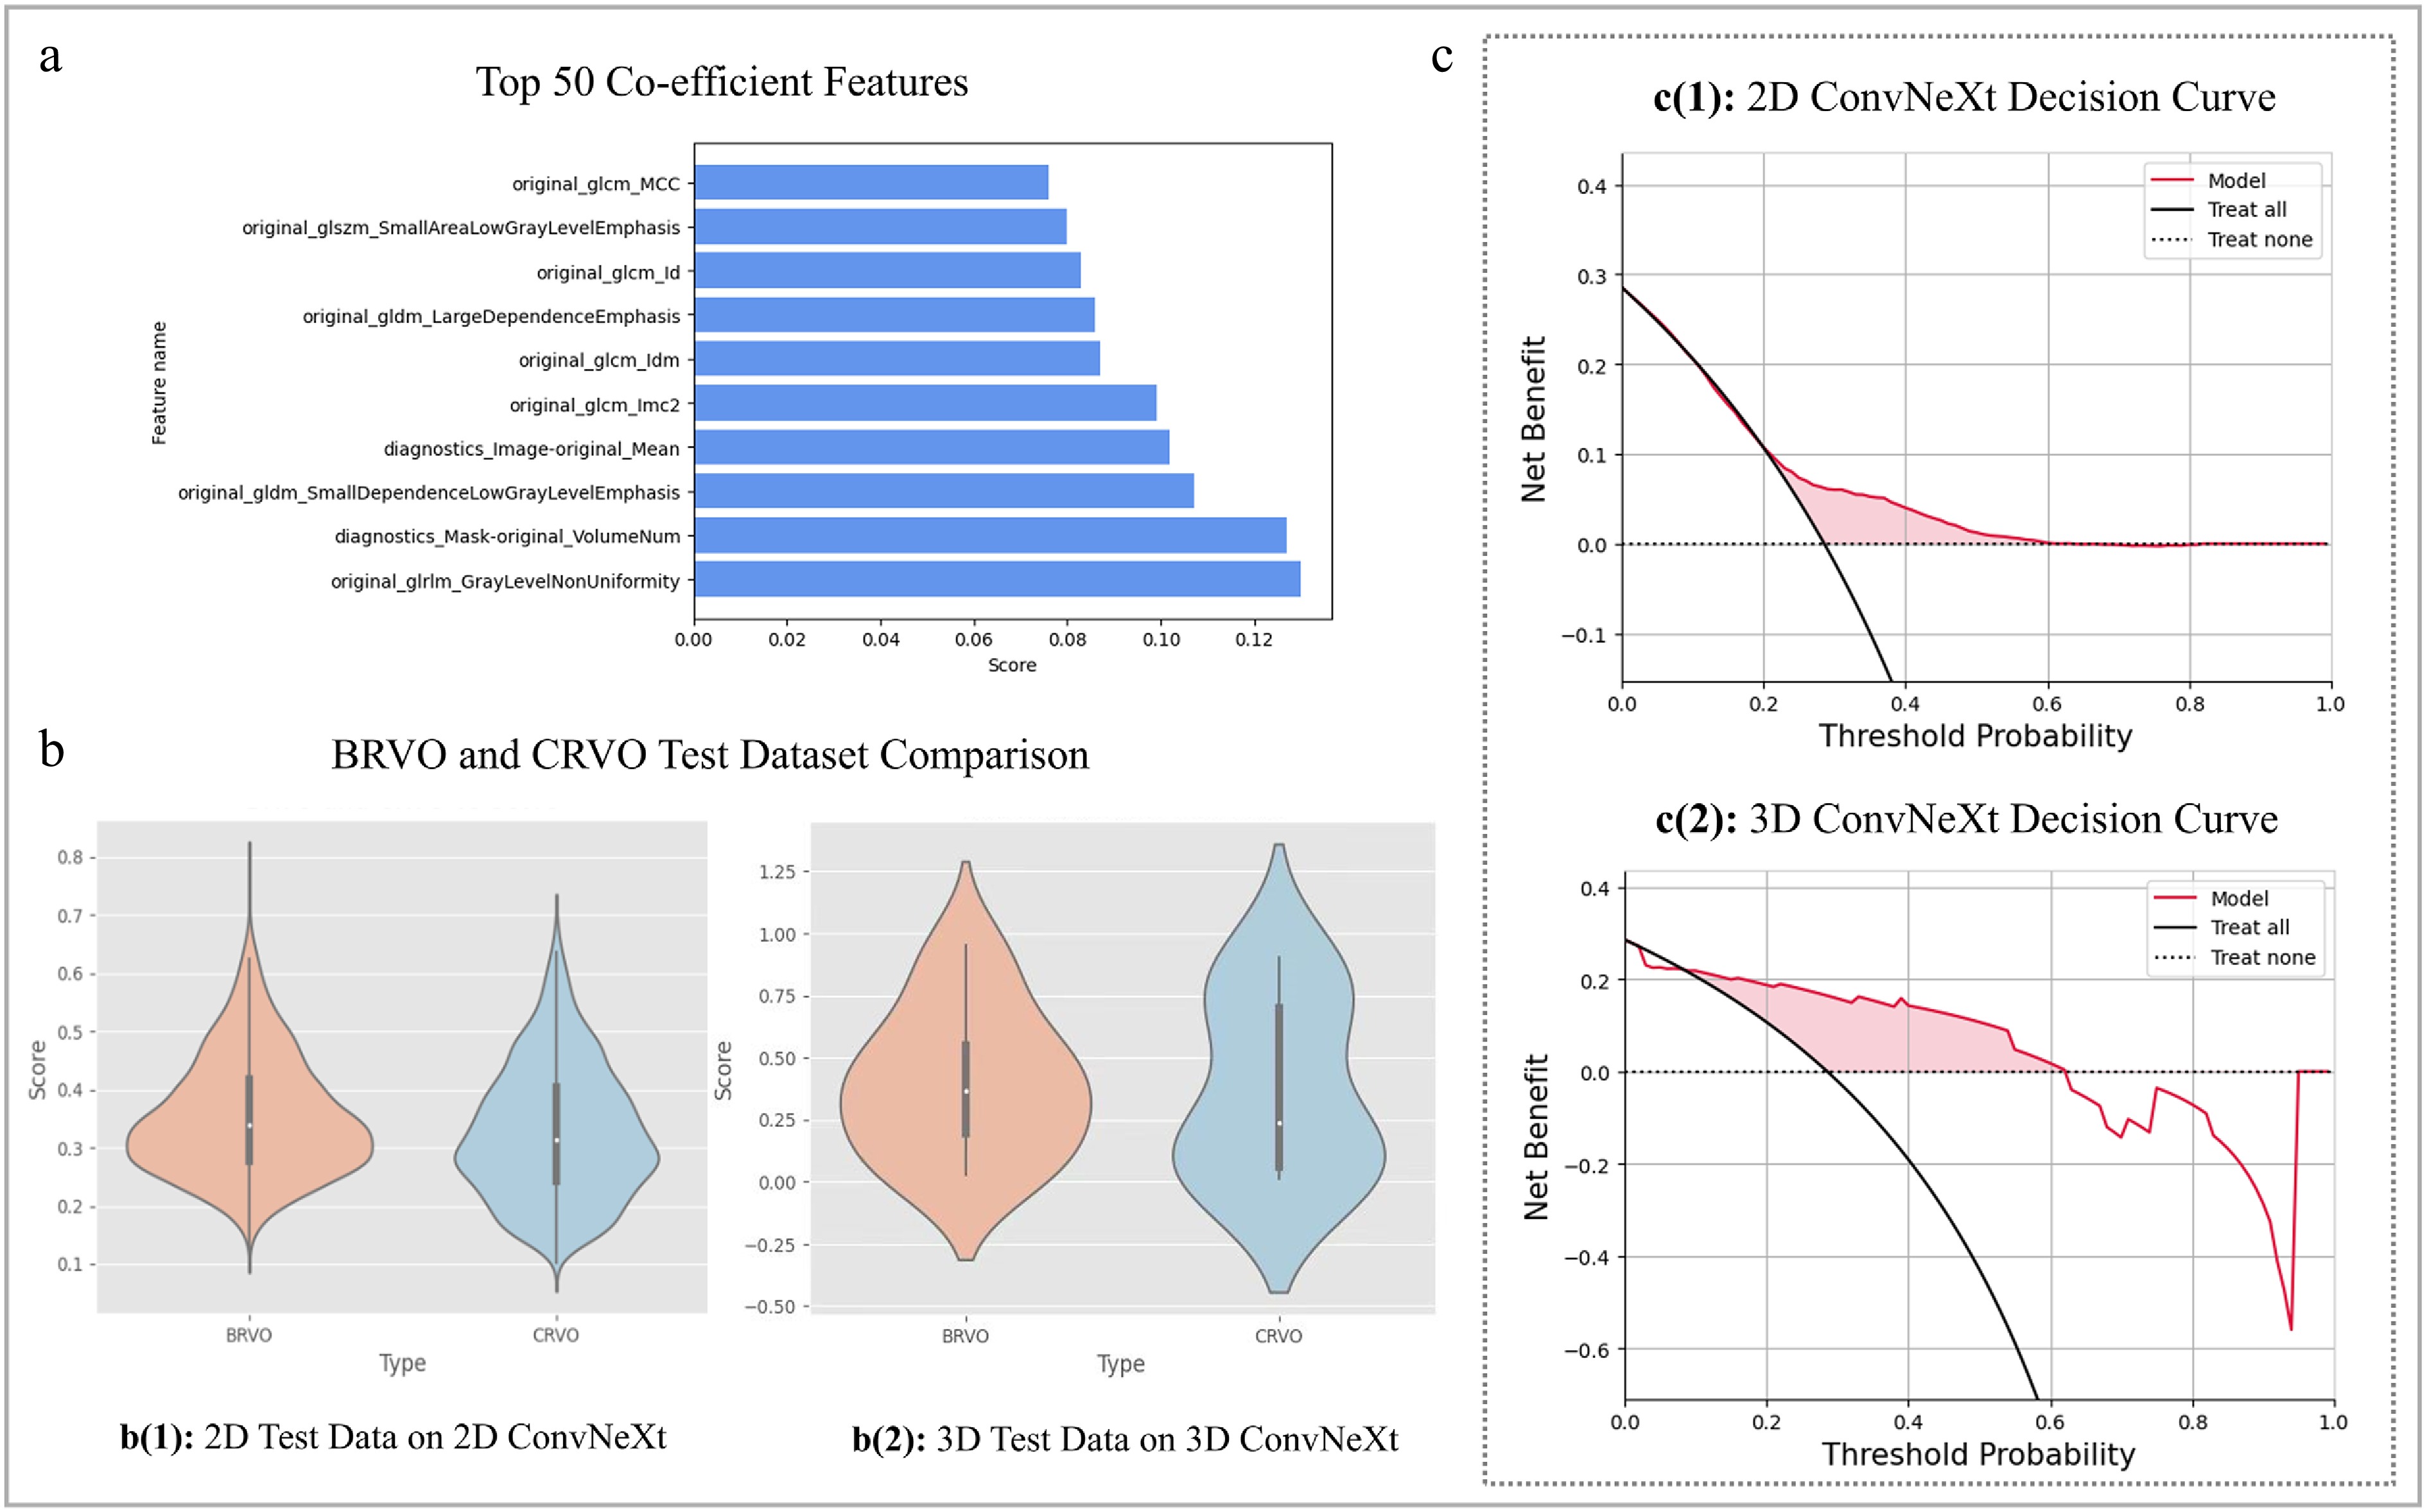
Figure 3.
SS-OCTA-omics model evaluation results and feature correlation plot. (a) Visualizes the top ten out of 50 radiomics features processed by mRMR. (b) Depicts the violin plots on external test dataset for the 2D and 3D ConvNeXt-tiny model with prediction confidence score distributions by performing the comparison of BRVO and CRVO types. (c) Shows the decision curves for the best 2D and 3D prediction models on an external test dataset.
Figure 3c shows the net benefits of our deep learning models via the Decision Curve, and the performances are superior to the 'Treat all' strategy, mostly across the range of the threshold. To be specific, each model is better across a threshold probability less than 0.6 for the 2D decision curve and 0.62 for the 3D decision curve, which means the model is beneficial between the thresholds within the red zone. Overall, the red zone beneath the 'Treat none' and restricted by the 'Treat all' and 3D SS-OCTA-omics model benefits curve is significantly larger than the red zone of 2D ConvNeXt-tiny-based curve, which indicates 3D SS-OCTA-omics model can produce a higher net benefit over a given range of thresholds (e.g., 0.2~0.6), indicating a better ability for balancing the benefits and risks of assessment.
To select the best model, the ConvNeXt-base model, ConvNeXt-small model, and ConvNeXt-tiny model were evaluated. The best accuracy of 0.728 (95% Confidence Interval (CI): 0.717–0.738) and AUC of 0.645 (95% CI: 0.634–0.656) was achieved by ConvNeXt-tiny. Detailed evaluation results are shown in Supplementary Table S2.
The results of both machine learning methods and 2D ConvNeXt-tiny-based models on 2D datasets are presented in Table 2. Among the conventional machine learning methods, 2D mRMR + SVM gained the overall better performance on the 2D dataset with an AUC of 0.580 (95% CI: 0.565–0.595). On the contrary, deep learning-based methods outperformed the traditional machine learning methods, notably, the 2D ConvNeXt-tiny substantially gained higher scores than all traditional machine learning approaches, achieving an accuracy of 0.728 (95% CI: 0.717–0.738) and AUC of 0.645 (95% CI: 0.634–0.656). The integration of 3D mRMR radiomics features with the 2D ConvNeXt-tiny model (which formed the 2D SS-OCTA-omics) further improved accuracy to 0.730 (95% CI: 0.718–0.741) while dramatically increasing specificity to 0.967 (95% CI: 0.955–0.979), indicating exceptional performance in correctly identifying negative cases.
Table 2. Comparisons among machine learning methods and deep learning methods on 2D and 3D dataset (with 95% confidence interval).
Evaluation model Acc. Sen. Spe. Pre. F1. AUC. 2D mRMR + RF 0.610
(0.597−0.621)0.220
(0.208−0.233)0.760
(0.749−0.770)0.310
(0.298−0.323)0.230
(0.218−0.243)0.510
(0.498−0.522)2D mRMR + LR 0.540
(0.526−0.552)0.430
(0.417−0.442)0.590
(0.577−0.601)0.340
(0.327−0.352)0.330
(0.317−0.343)0.520
(0.508−0.531)2D mRMR + SVM 0.560
(0.546−0.572)0.640
(0.628−0.651)0.610
(0.598−0.621)0.450
(0.438−0.462)0.530
(0.517−0.542)0.580
(0.568−0.591)2D mRMR + Adaboost 0.570
(0.555−0.584)0.520
(0.504−0.535)0.680
(0.667−0.693)0.400
(0.385−0.415)0.390
(0.371−0.409)0.580
(0.565−0.595)2D ResNet 0.701
(0.689−0.712)0.524
(0.510−0.536)0.477
(0.464−0.489)0.686
(0.675−0.697)0.473
(0.460−0.485)0.621
(0.610−0.632)2D ViT 0.699
(0.688−0.710)0.524
(0.513−0.533)0.612
(0.601−0.623)0.648
(0.638−0.658)0.540
(0.536−0.555)0.638
(0.626−0.651)2D ConvNeXt-tiny 0.728
(0.717−0.738)0.573
(0.560−0.585)0.621
(0.609−0.633)0.675
(0.664−0.686)0.565
(0.552−0.577)0.645
(0.634−0.656)2D ConvNeXt-tiny + 3D mRMR 0.730
(0.718−0.741)0.552
(0.540−0.564)0.967
(0.955−0.979)0.681
(0.669−0.693)0.530
(0.508−0.551)0.552
(0.540−0.562)3D mRMR + RF 0.660
(0.459−0.828)0.170
(0.010−0.450)0.880
(0.676−0.973)0.330
(0.100−0.651)0.220
(0.080−0.480)0.520
(0.315−0.725)3D mRMR + LR 0.540
(0.345−0.727)0.430
(0.177−0.711)0.590
(0.329−0.816)0.340
(0.137−0.612)0.380
(0.181−0.580)0.520
(0.315−0.725)3D mRMR + SVM 0.610
(0.406−0.789)0.620
(0.316−0.861)0.600
(0.323−0.837)0.400
(0.191−0.640)0.480
(0.280−0.680)0.610
(0.405−0.815)3D mRMR + Adaboost 0.630
(0.424−0.806)0.540
(0.251−0.808)0.670
(0.384−0.882)0.390
(0.173−0.643)0.450
(0.255−0.645)0.600
(0.395−0.805)3D ResNet 0.688
(0.487−0.849)0.605
(0.333−0.837)0.750
(0.476−0.927)0.610
(0.360−0.820)0.614
(0.410−0.790)0.655
(0.450−0.860)3D ViT 0.706
(0.505−0.862)0.613
(0.340−0.842)0.740
(0.466−0.919)0.636
(0.380−0.840)0.619
(0.415−0.795)0.750
(0.560−0.940)3D ConvNeXt-tiny 0.750
(0.551−0.893)0.778
(0.501−0.950)0.722
(0.442−0.910)0.714
(0.450−0.900)0.745
(0.550−0.880)0.779
(0.594−0.963)3D ConvNeXt-tiny + 3D mRMR 0.821
(0.631−0.939)0.800
(0.519−0.957)0.833
(0.545−0.981)0.781
(0.484−0.945)0.788
(0.595−0.915)0.794
(0.613−0.975)* The 95% Confidence Interval values of proportion-based metrics were calculated using the Clopper-Pearson exact method, the Bootstrap method were used for calculating f1-score, the DeLong method was utilized for AUC. The methods highlighted in bold represent the best models among the compared 2D and 3D methods; the bolded data for each metric represents the best result point estimate of each metric. The evaluation on the 3D dataset consistently showed the performance differences between conventional machine learning approaches and deep learning methods (Table 2). Within the conventional methods, the 3D mRMR + SVM obtained the overall better performance, achieving an Acc of 0.610 (95% CI: 0.406–0.789) and an AUC of 0.610 (95% CI: 0.405–0.815). The 3D ConvNeXt-tiny model substantially outperformed all conventional methods, achieving superior performances across all metrics, with an accuracy of 0.750 (95% CI: 0.551–0.893) and an AUC of 0.779 (95% CI: 0.594–0.963). Most notably, the fusion of 3D ConvNeXt-tiny with 3D radiomics features yielded the best overall performance, reaching an Acc of 0.821 (95% CI: 0.631–0.939) and an AUC of 0.794 (95% CI: 0.612–0.975), representing a 9.5% average improvement in accuracy over the standalone 3D ConvNeXt-tiny model. Figure 4a, b shows the ROC and P-R curves of SVM with mRMR (the best of 2D methods and 3D methods) in 2D and 3D. The P-R curves also indicate that a 3D-based model can achieve higher APs. Figure 4c, d also represented the performance of 2D ConvNeXt-tiny and the 3D SS-OCTA-omics. The result shows that the 3D version of the SS-OCTA-omics framework has achieved an overall better performance on ROC and P-R Curves and a higher proportion of True Negatives and True Positives.
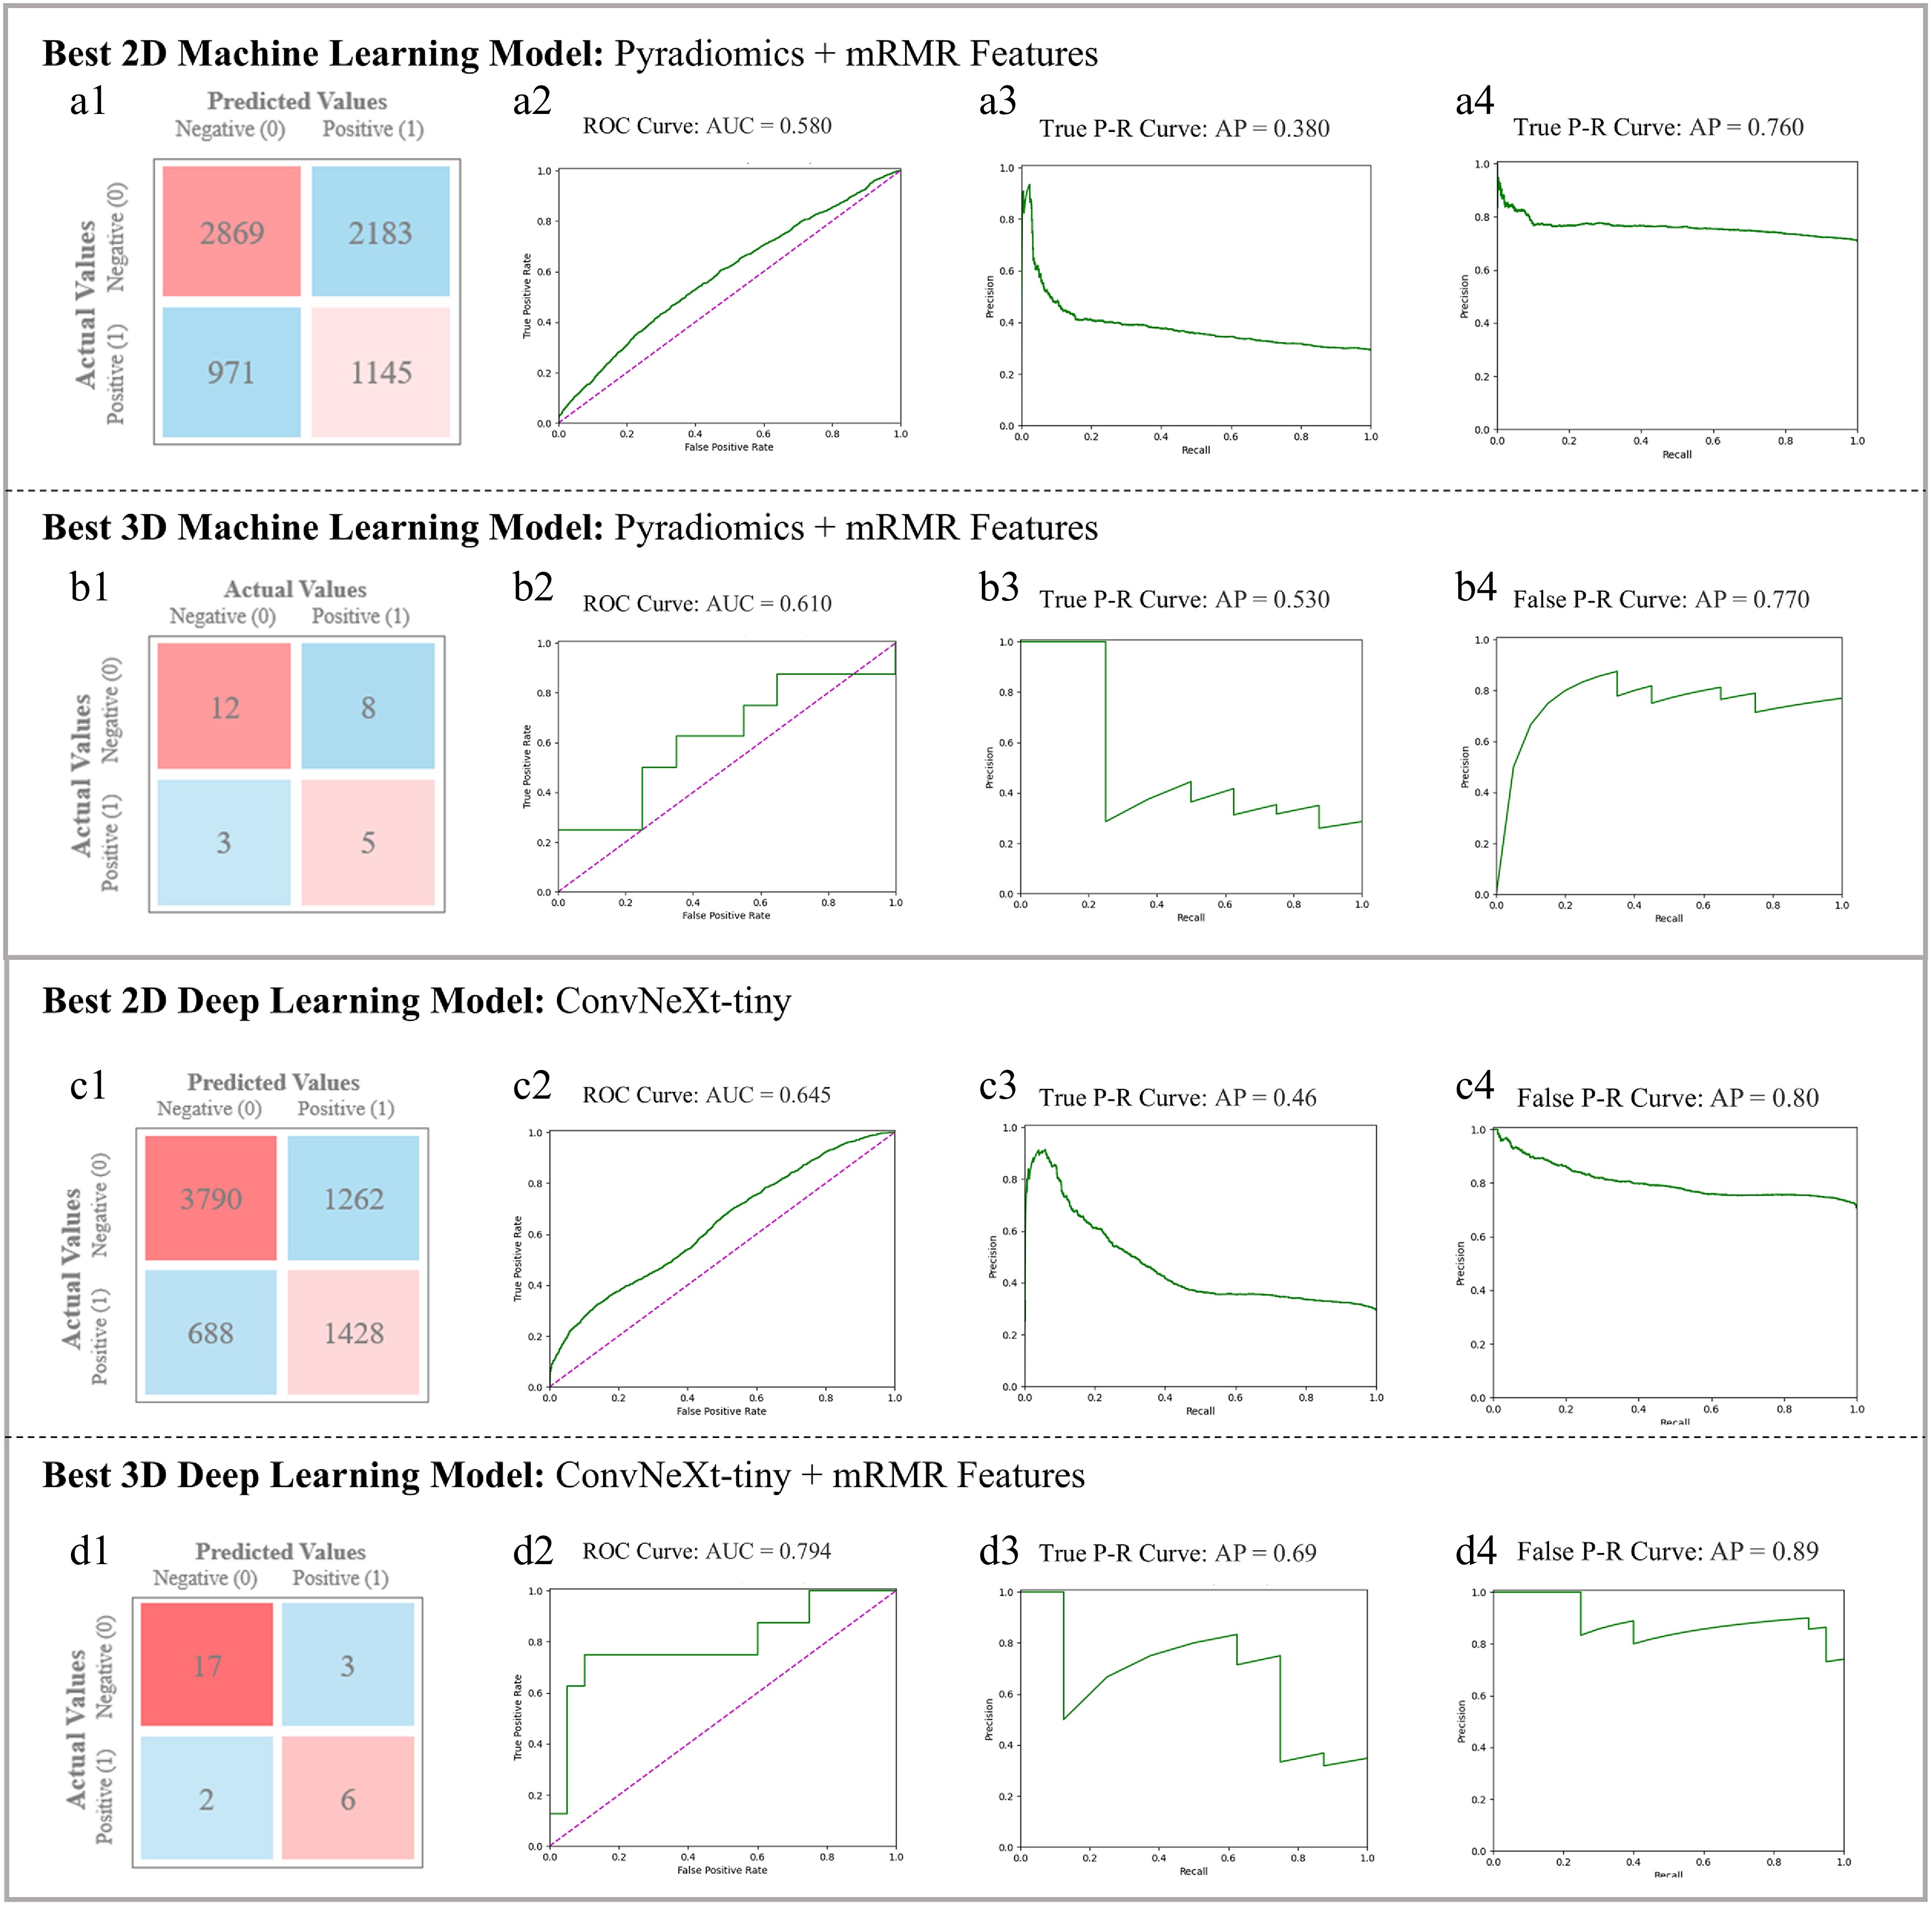
Figure 4.
Comparison of SVM with mRMR in (a) best 2D Machine Learning model (utilizing Pyradiomics and mRMR) and (b) best 3D Machine Learning model (utilizing Pyradiomics and mRMR). Each sub-figures (1)~(4) show the Confusion Matrix, ROC and class-based P-R curves. Radiomics-based mRMR features are classified by SVM. The Average Precision (AP) values refer to the area under the P-R curves. (c) Best 2D Deep Learning Model (ConvNeXt-tiny) figures, in which sub-figure (1)~(4) depict its visualization results; (d) 3D SS-OCTA-omics (utilized ConvNeXt-tiny and mRMR) figures, in which sub-figure (1)~(4) show its visualization results as the best 3D model.
Visualization of heatmaps
-
Figure 5 shows the Grad-CAM heatmap for the 2D ConvNeXt-tiny-based model, which was derived from the last convolution layer of the ConvNeXt-tiny model. The Grad-CAM heat map can help to identify whether the high response areas are concentrated in the most distinctive progression-related parts. Compared with the cross-sectional Angio-flow images, the model successfully recognized clinically distinctive areas that have a high correlation with the NPA progression of RVO.
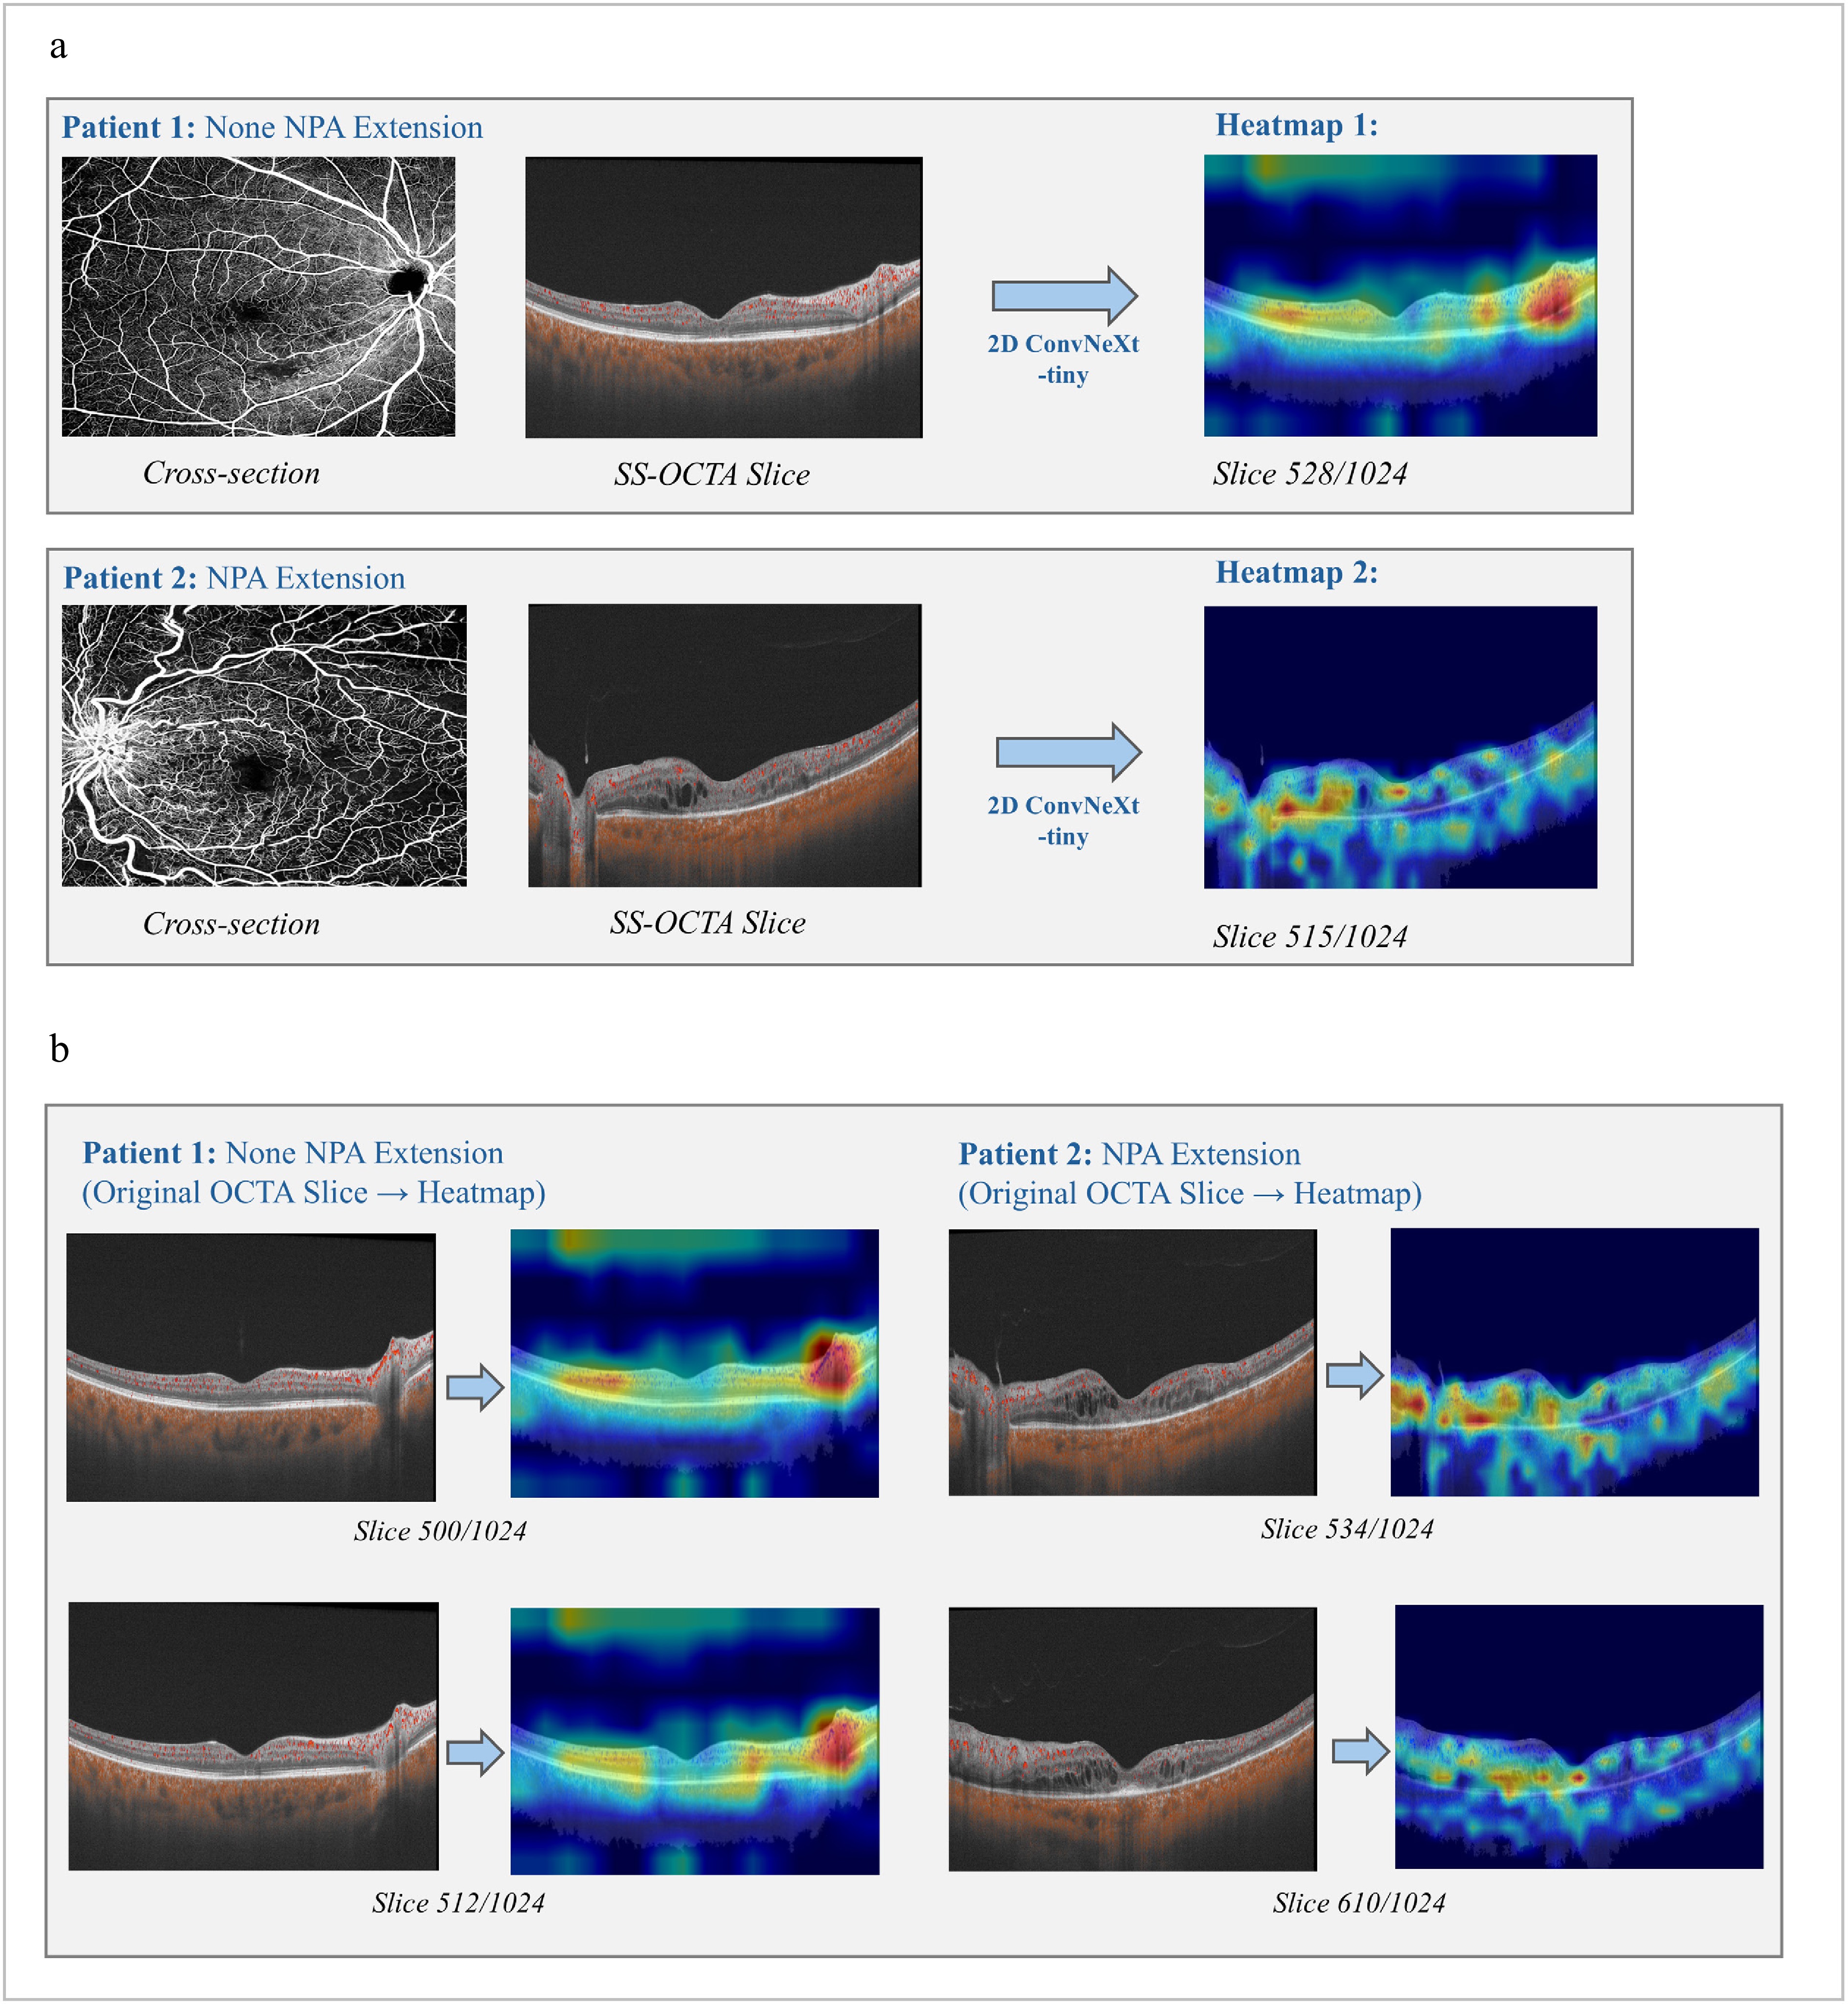
Figure 5.
Heatmaps generated by the best 2D model: ConvNeXt-tiny. (a) Comparisons between cross-section Angio-flow OCTA images and original SS-OCTA slices for both types of patient samples. (b) SS-OCTA original slices and its heatmaps for each type of patient with relatively high degree of confidences.
Comparisons with the existing clinical biomarkers
-
We used 117 clinically defined biomarkers, including FAZ, VD, FD, SVP, and DVP features, for evaluation. As shown in Supplementary Table S3, although the DVP features obtained the highest specificity of 0.78 (95% CI: 0.586–0.914) and the FD features obtained the highest sensitivity of 0.83 (95% CI: 0.645–0.945), the combined FAZ + SVP + DVP + FD feature set processed via mRMR achieved the overall better performance with the highest Acc of 0.65 (95% CI: 0.448–0.820) and an AUC of 0.58 (95% CI: 0.374–0.785). Moreover, the optimal combination of clinical biomarkers outperformed conventional 2D radiomics models (accuracy: 0.65 vs 0.57–0.61 in Table 3), though both underperformed our proposed 3D SS-OCTA-omics framework (Acc: 0.821).
Table 3. Comparisons among machine learning methods and deep learning methods on 2D/3D external validation datasets (with 95% confidence interval).
Evaluation model (external) Acc. Sen. Spe. Pre. F1. AUC. 2D ResNet 0.540
(0.533−0.546)0.430
(0.424−0.436)0.590
(0.584−0.596)0.340
(0.334−0.345)0.330
(0.322−0.337)0.520
(0.514−0.526)2D ViT 0.610
(0.604−0.616)0.220
(0.214−0.226)0.760
(0.755−0.765)0.310
(0.304−0.316)0.230
(0.221−0.237)0.510
(0.503−0.516)2D ConvNeXt−tiny 0.685
(0.679−0.690)0.545
(0.539−0.551)0.589
(0.583−0.595)0.638
(0.632−0.644)0.522
(0.515−0.528)0.612
(0.605−0.618)2D ConvNeXt+3D mRMR 0.678
(0.671−0.684)0.520
(0.514−0.526)0.680
(0.674−0.686)0.650
(0.644−0.656)0.528
(0.521−0.534)0.618
(0.612−0.624)3D ResNet 0.661
(0.564−0.749)0.569
(0.422−0.707)0.741
(0.603−0.850)0.659
(0.515−0.785)0.610
(0.512−0.701)0.621
(0.515−0.727)3D ViT 0.688
(0.592−0.773)0.608
(0.461−0.742)0.759
(0.624−0.865)0.689
(0.548−0.809)0.645
(0.548−0.734)0.701
(0.600−0.802)3D ConvNeXt-tiny 0.734
(0.641−0.814)0.706
(0.562−0.825)0.759
(0.624−0.865)0.720
(0.583−0.833)0.714
(0.621−0.796)0.749
(0.653−0.845)3D ConvNeXt+3D mRMR 0.771
(0.680−0.846)0.745
(0.604−0.857)0.793
(0.663−0.891)0.760
(0.628−0.864)0.753
(0.663−0.829)0.768
(0.674−0.862)* The 95% Confidence Interval values of proportion-based metrics were calculated using the Clopper-Pearson exact method, the Bootstrap method were used for calculating f1-score, the DeLong method was utilized for AUC. The methods highlighted in bold represent the best models among the compared 2D and 3D methods; the bolded data for each metric represents the best result point estimate of each metric. Evaluations on external dataset
-
On the 2D external dataset (Table 3), the 2D ConvNeXt-tiny achieved the highest Acc of 0.685 (95% CI: 0.679–0.690), with an AUC of 0.612 (95% CI: 0.605–0.618), while other baselines such as ResNet and ViT showed further degradation (Acc = 0.54–0.61, AUC ≤ 0.52). The proposed 2D ConvNeXt-tiny + 3D mRMR Radiomics feature fusion method further improved the overall performance by achieving an AUC of 0.618 (95% CI: 0.612–0.624). The performance gap between internal and external validation reflects the distributional and acquisition differences between datasets, yet the proposed ConvNeXt-tiny framework preserved moderate generalization capacity, maintaining over 0.6 AUC and outperforming other 2D baselines.
On the independent 3D external dataset (Table 3), all models exhibited a mild decline in performance due to cross-dataset variation. The proposed 3D ConvNeXt-tiny + 3D mRMR model maintained the top AUC performance and further achieved the highest accuracy on 3D dataset: Acc = 0.771 (95% CI: 0.680–0.846), AUC = 0.768 (95% CI: 0.674–0.862), notably higher than 3D ResNet: AUC = 0.621 (95% CI: 0.515–0.727) and 3D ViT: AUC = 0.701 (95% CI: 0.600–0.802). Despite a slight reduction (2.6% of AUC compared with internal validation, but still higher than 0.75), the model maintained balanced sensitivity (0.745) and specificity (0.793), indicating robust generalization and preserved predictive value across imaging domains.
RVO subtype evaluations
-
Subtype analysis revealed consistent performance of the proposed 3D ConvNeXt-tiny model across both internal and external datasets, as represented in Supplementary Table S4. In the internal 87-patient dataset with NPA progression distributions in 37.2% BRVO and 13.9% CRVO patients, the model achieved an Acc of 0.785 and AUC of 0.780 (95% CI: 0.591–0.969) for BRVO, and an Acc of 0.857, AUC of 0.812 (95% CI: 0.628–0.995) for CRVO. In the external validation dataset of 109 patients, model performance remained stable, yielding an Acc of 0.779 and an AUC of 0.757 (95% CI: 0.665–0.849) for BRVO, and an Acc of 0.811, AUC of 0.773 (95% CI: 0.682–0.864) for CRVO. Although the external cohort exhibited different NPA progression distributions (BRVO 50.0% vs CRVO 41.5%), the model maintained balanced sensitivity (0.798 vs 0.813) and specificity (0.811 vs 0.831) across subtypes. When combining both datasets, BRVO still showed a higher overall NPA progression tendency than CRVO (44.5% vs 28.6%), aligning with the internal findings that the model could adapt to subtype-specific progression patterns without major degradation in predictive metrics.
-
In this study, we proposed the SS-OCTA-omics framework, in which both machine learning and deep learning methods were integrated for the prediction of NPA progression in patients with RVO after anti-VEGF treatment. Our proposed SS-OCTA-omics framework achieved superior predictive performance with an AUC of 0.794 (95% CI: 0.612–0.975), Acc of 0.821 (95% CI: 0.631–0.939) when compared to conventional machine learning approaches and the standalone ConvNeXt-tiny method. These results illustrate the complementary value of combining deep features with radiomics for prediction. In addition, we also identified that 3D-based methods can consistently outperform 2D ones, which shows the importance of volumetric analysis for accurate NPA progression prediction.
Anti-VEGF therapy has emerged as a pivotal treatment modality in managing RVO, particularly in addressing nonperfusion complications[32]. Despite its effectiveness, frequent injections, high costs, and variable responses remain challenges. NPA progression after treatment affects 17% to 38% of patients (27.6% in our study) and correlates with the number of injections. Consistent with prior findings, CRVO patients in our cohort required more injections but showed less NPA progression than BRVO cases[33,34]. In our research, we explored NPA progression in the pro re nata (PRN) stage after the completion of three anti-VEGF injections, which is consistent with current clinical practice. Additionally, we utilized thresholds for NPA assessment based on baseline NPA using noninvasive widefield OCTA, providing an objective metric for evaluating the treatment response.
SS-OCTA offers detailed, noninvasive visualization of retinal blood flow and microvasculature, comparable to fluorescein angiography. Quantitative parameters such as FAZ, VD, and FD in the SVP and DVP enable precise monitoring of retinal ischemia and nonperfusion[35]. However, in our study, the predictive performance of these parameters was relatively poor. This may be attributed to the fact that the observed NPA progression was relatively small (over one PD) and all included baseline BRVO and CRVO eyes were classified as non-ischemic based on established ischemic criteria (≥ 5 DD for BRVO, ≥ 10 DD for CRVO). Anatomic analyses revealed that more venous components were detected in the DVP, while more arterial components were present in the SVP, which illustrates the role of the DVP in RVO pathologies[36]. VD from the DVP demonstrated higher accuracy than the SVP, indicating that changes occur early in the venous components of RVO. Additionally, the branching complexity of the capillary network, as measured by FD[26], showed significantly higher sensitivity in detecting the progression of NPA, suggesting a strong association between these capillary alterations and NPA progression.
Deep learning, particularly when leveraging the ConvNeXt structure[30], showed superior performance when compared to traditional machine learning methods in this research. The ConvNeXt-tiny's architecture, with efficient and scalable convolutional layers, facilitated more robust feature extraction. In this study, the ConvNeXt-based structure with larger kernel sizes (7 × 7 for 2D and 7 × 7 × 7 for 3D) has improved receptive fields to obtain subtle contextual and spatial features in images and volumes, making the model more effective in analyzing both detailed and structural information in the retinal layers. The 3D ConvNeXt-tiny-based model, which was optimized for processing volumetric data, has further improved the 2D predictive performance. This is expected as the spatial information across slices of SS-OCT/OCTA fused images, which could model the depth and spatial relationships existing within the retinal tissue, was missing in the 2D models. 3D ConvNeXt-tiny is a capacity-constrained and parameter-efficient backbone, as a compromise between simpler 3D CNNs that mainly capture local patterns and deeper high-capacity models (e.g., 3D ViT), since its large-kernel depthwise convolutions enable effective modeling[37,38] of both fine-grained microvascular features and broader ischemic context in SS-OCTA volumes while limiting overfitting risk in a small-sample setting. The highest AUC score was achieved by the 3D ConvNeXt-tiny-based model fused with Radiomics features (3D SS-OCTA-omics method), suggesting that deep learning models can significantly benefit from multi-modality feature fusion, which will potentially aid the management of disease and lay the foundation for further research.
Prior research has explored the utility of Radiomics and machine learning in retinal diagnostics, but these studies often relied on 2D imaging data and conventional machine learning methods, which may fail to capture the spatial complexity of 3D microvascular networks. Carrera-Escalé et al. achieved AUCs of 0.82 and 0.77 for diabetes and diabetic retinopathy using 2D OCT/OCTA Radiomics with logistic regression[13], while Meng et al. reported an AUC of 0.982 for DME outcomes using a backpropagation neural network[14]. Similarly, Kar et al. obtained an AUC of 0.78 for DME and RVO using SD-OCT Radiomics and linear discriminant analysis[18]. Radiomics relies on specific feature extraction types, which have limited ability to extract and represent implicit information in retinal images, and may be difficult to capture relevant complex features for RVO that are less explored by machine learning.
In contrast, deep learning models automatically extract complex, non-linear retinal features and generalize across large datasets, making them well-suited for RVO imaging analysis. However, prior studies mainly used conventional 2D architectures (e.g., ResNet, EfficientNet), single-modality inputs, and limited performance. Chhabria et al. achieved 0.682 accuracy for RVO diagnosis using a 2D CNN[39], while Choi et al. reached an AUC of 0.755 for BRVO prediction for fundus and vessel segmentation images[40]. These studies, while valuable, did not explore the fusion of Radiomics features with deep learning, nor did they leverage 3D imaging data to capture depth-resolved structural information, but reflected the inability of relatively backward scanning equipment. Our work addresses these gaps by demonstrating the effectiveness of fusing Radiomics features with deep learning-extracted features, particularly when using a 3D SS-OCTA dataset. The integration of spatial context and depth-resolved information enabled our SS-OCTA-omics model to capture disease morphology features more effectively, leading to significant improvements in performance. This model functions as a risk-stratification–driven clinical decision support system, translating deep learning predictions into actionable RVO management strategies (Supplementary Fig. S4). By integrating baseline OCTA volumes and clinical biomarkers, the 3D ConvNeXt-tiny architecture predicts the risk of NPA progression within the upcoming follow-up window and stratifies patients into high- and low-risk groups. High-risk patients may benefit from proactive treatment intensification, such as shortened anti-VEGF injection intervals, use of high-affinity agents, or early combination therapy with corticosteroids to mitigate ischemia progression. In contrast, low-risk patients can safely transition to a Treat-and-Extend regimen, allowing longer follow-up intervals and reduced treatment burden. By addressing subtype-specific clinical goals for CRVO and BRVO, this framework bridges model predictions with real-world treatment protocols and supports a shift from standardized care toward personalized precision medicine. These findings also suggest that future diagnostic tools should prioritize 3D imaging and advanced deep learning architectures to improve accuracy and clinical utility. The use of Grad-CAM technology further validated the rationality of the model's decision-making capability, revealed that the regions of focus aligned with expert judgments, thereby enhancing the interpretability and clinical relevance.
The external dataset evaluation also demonstrates that integrating volumetric representations with radiomics-guided feature selection enhances the discriminative capability of deep models for NPA progression prediction. Classical 2D and machine learning approaches (e.g., SVM, LR, Adaboost) exhibited limited generalization, possibly due to insufficient spatial context and dependence on handcrafted feature distributions. In contrast, the proposed 3D SS-OCTA-omics (ConvNeXt-tiny + 3D mRMR method) achieved superior internal and external performance, suggesting that feature-level fusion effectively balances deep feature abstraction with clinically interpretable radiomic descriptors. Although external validation results of the proposed method showed a minor performance decline with an AUC from 0.794 (95% CI: 0.612–0.975) to 0.768 (95% CI: 0.674–0.862), this is expected due to domain shift and scanner variations. Importantly, the model retained > 0.75 accuracy and robust AUC, evidencing good cross-dataset stability. This evaluation evidence confirms that the proposed method not only learns subtype-invariant biomarkers but also demonstrates consistent generalization across heterogeneous cohorts, which is a key requirement for clinical applicability in SS-OCTA-based prognosis.
The consistent performance of the 3D ConvNeXt-tiny model across internal and external datasets indicates good generalizability in handling RVO subtype heterogeneity. This stability suggests that the model's learned representations capture fundamental structural and vascular cues that are less sensitive to dataset-specific progression biases. In addition, CRVO cases demonstrated slightly higher Acc. and AUC in both datasets (0.857/0.812 internally; 0.811/0.773 externally), possibly reflecting the more distinct global ischemic patterns typically observed in CRVO. In contrast, BRVO's localized occlusion and variable extent of nonperfusion may contribute to larger inter-case variability and the mild performance decline in external validation. Overall, these results confirm that the proposed method retains robustness when applied to unseen populations and performs consistently across RVO subtypes despite differences in clinical and imaging characteristics.
Identifying biomarkers linked to the progression of nonperfusion zones can empower clinicians to more accurately gauge the efficacy of treatments for RVO patients and to adjust therapeutic strategies promptly. There were some limitations of our study. First, we acknowledge that all the imaging data used in this study were acquired from a single center, and we only included 196 patients for experiments. In our future study, we will explore the developed algorithm on a larger cohort of patient studies across multiple clinical centers to evaluate the generalizability of the proposed algorithm. Second, SS-OCTA volumes were acquired using different fields of view (12 × 12, 9 × 9, and 6 × 6 mm2), which may introduce variability in image resolution and measurement consistency. Functional assessments of visual function in relation to NPA were also not conducted[41−47]. In future work, we plan to explore the correlation between different image features and visual function. Third, SS-OCTA measures motion-contrast flow signal rather than true blood flow, and we did not have standardized ultra-widefield FA for all eyes to directly validate the 3D OCTA-derived nonperfusion volumes. In addition, repeated OCTA scans were not routinely acquired in this retrospective cohort, precluding a formal assessment of inter-scan reproducibility of OCTA-based NPA; this should be addressed in future prospective studies. In addition, eyes with hemorrhage impairing visualization were excluded; our cohort represents relatively 'clean' RVO cases. This limits generalizability to patients with significant hemorrhage. Finally, we plan to evaluate more multimodal deep learning approaches that can integrate metadata-matched images and optimize the method by vessel segmentation to improve the early prediction of RVO. Future studies including such cases are warranted to validate the robustness of OCTA-derived NPA measurements. Regardless, we anticipate that the SS-OCTA-omics methodology utilized in this research has broader implications, potentially serving as a model for biomarker discovery in other retinal conditions. Advancing our approach in this direction is essential for a more evidence-driven understanding and management of RVO.
-
In conclusion, this study establishes a 3D Radiomics-deep learning fusion framework, SS-OCTA-omics, integrating volumetric SS-OCTA data with ConvNeXt-tiny architecture, significantly enhancing the prediction of NPA progression in RVO. Our framework achieved overall better performance, outperforming conventional machine learning methods for 2D radiomics features and clinical biomarkers, demonstrating its potential as a robust tool for early identification of high-risk patients. By combining radiomics-based microvascular heterogeneity quantification with deep learning's hierarchical spatial modeling, the synergy enables precise risk stratification, offering clinicians a non-invasive, data-driven strategy to optimize anti-VEGF therapy and mitigate vision loss.
This work was supported by Lumitin Vision to Brightness Research Funding for the Young and middle-aged Ophthalmologists (Grant No. BCF-KH-YK-20230803-05; granted by Bethune Charitable Foundation,
www.bqejjh.org.cn/ds/23084e5c3d.html ), Clinical Research Innovation Plan of Shanghai General Hospital (Grant No. CCTR-2022C02), the National Natural Science Foundation of China (Grant No. 82201246), and National Clinical Key Specialty Construction Project (Grant No. 10000015Z155080000004).-
The authors confirm contribution to the paper as follows: study conception and design: Bi L, Yu S; investigation and data collection: Peng Y, Wang H, Kim J; data analysis, draft manuscript preparation: Xu Y, Huo X; manuscript revision: Yu S, Bi L. All authors reviewed the results and approved the final version of the manuscript.
-
All data generated or analyzed during this study are included in this article. Further inquiries can be directed to the corresponding author.
-
The authors declare that they have no conflict of interest.
-
Authors contributed equally: Yupeng Xu, Xinyu Huo
- Supplementary Table S1 Optimized parameters for classifiers.
- Supplementary Table S2 Comparisons among the ConvNeXt types based on 2D fusion dataset.
- Supplementary Table S3 Prediction results of cinical biomarkers with machine learning SVM classifier (with 95% CI).
- Supplementary Table S4 BRVO/CRVO subgroup performance (with 95% CI) of our proposed 3D SS-OCTA-omics (3D ConvNeXt-tiny + mRMR).
- Supplementary Fig. S1 Samples of data-preprocessing pipeline regarding different FOVs.
- Supplementary Fig. S2 Detailed treatment regimen and follow-up.
- Supplementary Fig. S3 Two example studies, where (a) shows slice without NPA progression; (b) with NPA progression.
- Supplementary Fig. S4 AI-integrated clinical decision workflow.
- Copyright: © 2026 by the author(s). Published by Maximum Academic Press, Fayetteville, GA. This article is an open access article distributed under Creative Commons Attribution License (CC BY 4.0), visit https://creativecommons.org/licenses/by/4.0/.
-
About this article
Cite this article
Xu Y, Huo X, Peng Y, Wang H, Kim J, et al. 2026. Predicting nonperfusion area progression in retinal vein occlusion using 3D SS-OCTA radiomics and deep learning based fusion models. Visual Neuroscience 43: e016 doi: 10.48130/vns-0026-0013 

Predicting nonperfusion area progression in retinal vein occlusion using 3D SS-OCTA radiomics and deep learning based fusion models
- Received: 30 June 2025
- Revised: 09 February 2026
- Accepted: 13 February 2026
- Published online: 22 April 2026
Abstract: Retinal vein occlusion (RVO) is a major retinal vascular disorder in which the progression of nonperfusion area (NPA) is closely linked to visual outcomes. This study evaluates a 3D radiomics and deep learning fusion framework (SS-OCTA-omics) derived from swept-source OCTA imaging for predicting nonperfusion area (NPA) progression (ΔNPA > 1 PD) in RVO. A retrospective internal cohort of 87 RVO patients (with 22,272 slices of 2D data and 87 volumes of 3D data) and an external validation cohort of 109 patients (with 27,904 slices of 2D data and 109 volumes of 3D data) underwent SS-OCTA imaging, from which 2D and 3D radiomics features reflecting retinal microstructure were extracted. A 3D ConvNeXt-tiny network was developed to integrate deep learning and radiomics features, and its predictive performance was compared with 2D models, traditional radiomics approaches (SVM, Adaboost, and Logistic Regression), and clinical biomarkers, including vessel density (VD) and fractal dimension (FD). The 3D fusion model achieved an AUC of 0.794 (95% CI: 0.612–0.975) and an accuracy of 82.1% (95% CI: 0.631–0.939), outperforming 2D architectures (AUC 0.645 [95% CI: 0.634–0.656]), conventional radiomics (AUC 0.610 [95% CI: 0.405–0.815]), and clinical biomarkers (AUC 0.570 [95% CI: 0.363–0.776]). These findings highlight the potential of the SS-OCTA-omics framework to enhance individualized risk assessment in RVO.
-
Key words:
- Retinal vein occlusion /
- Nonperfusion area /
- SS-OCTA /
- Radiomics /
- 3D deep learning.