









Search
2026 Volume 6
Article Contents
REVIEW   Open Access    

Remote sensing–derived vegetation indices for assessing water-use efficiency and associated physiological traits in grass species adaption to drought stress: a review

More Information
  • Received: 04 March 2026
    Revised: 11 May 2026
    Accepted: 14 May 2026
    Published online: 12 August 2026
    Grass Research  6 Article number: e024 (2026)  |  Cite this article
  • Increasing shortage of water availability for irrigation and declining precipitation have intensified the need to enhance plant drought tolerance. Water-use efficiency (WUE) is a key trait affecting plant adaptation to drought stress and can be assessed through instantaneous measurements of the photosynthesis-to-transpiration ratio, biomass-to-water use ratio, and carbon isotope discrimination (CID; Δ13C). However, these conventional approaches are labor-intensive, destructive, and time-consuming, limiting their applicability in large-scale phenotyping and breeding programs. Remote sensing-based vegetation indices (VIs) have been widely applied in grass species, including Normalized Difference Vegetation Index (NDVI), Green Normalized Difference Vegetation Index (GNDVI), Water Band Index (WBI), Normalized Difference Moisture Index (NDMI), Normalized Difference Snow Index (NDSI), Optimized Soil-Adjusted Vegetation Index (OSAVI), and Shortwave Infrared Water Index (SWWI), to estimate Δ13C and key physiological traits associated with WUE, including leaf area index (LAI), net photosynthetic rate (A), stomatal conductance (gs), chlorophyll and water content. This review synthesizes current advances in the use of VIs derived from remote sensing imagery to assess Δ13C and WUE-related traits, with a focus on grass species, such as annual cereal crops as well as perennial turf and forage grasses. The VI-based approach has great potential in high-throughput phenotyping and screening WUE-related traits for developing drought-tolerant and water-use-efficient grass species.
  • 加载中
  • [1] Hatfield JL, Dold C. 2019. Water-use efficiency: advances and challenges in a changing climate. Frontiers in Plant Science 10:1−14 doi: 10.3389/fpls.2019.00103

    CrossRef   Google Scholar

    [2] Medrano H, Tomás M, Martorell S, Flexas J, Hernández E, et al. 2015. From leaf to whole-plant water use efficiency (WUE) in complex canopies: limitations of leaf WUE as a selection target. The Crop Journal 3:220−228 doi: 10.1016/j.cj.2015.04.002

    CrossRef   Google Scholar

    [3] Sun Y, Piao S, Huang M, Ciais P, Zeng Z, et al. 2016. Global patterns and climate drivers of water-use efficiency in terrestrial ecosystems deduced from satellite-based datasets and carbon cycle models. Global Ecology and Biogeography 25:311−323 doi: 10.1111/geb.12411

    CrossRef   Google Scholar

    [4] Tshikunde NM, Odindo A, Shimelis H, Mashilo J. 2018. Leaf gas exchange and water-use efficiency of dry-land wheat genotypes under water stressed and non-stressed conditions. Acta Agriculturae Scandinavica, Section B — Soil & Plant Science 68:738−748 doi: 10.1080/09064710.2018.1480729

    CrossRef   Google Scholar

    [5] Avramova V, Meziane A, Bauer E, Blankenagel S, Eggels S, et al. 2019. Carbon isotope composition, water use efficiency, and drought sensitivity are controlled by a common genomic segment in maize. Theoretical and Applied Genetics 132:53−63 doi: 10.1007/s00122-018-3193-4

    CrossRef   Google Scholar

    [6] Vines PL, Zhang J. 2022. High-throughput plant phenotyping for improved turfgrass breeding applications. Grass Research 2:1−13 doi: 10.48130/GR-2022-0001

    CrossRef   Google Scholar

    [7] Zhang J, Maleski J, Khanal S, Webb A, Schwartz B, et al. 2025. Phenomics-driven insights into zoysiagrass drought resistance using small unmanned aircraft systems (sUAS)-based hyperspectral images. The Plant Phenome Journal 8:e70027 doi: 10.1002/ppj2.70027

    CrossRef   Google Scholar

    [8] Poudel S, Vennam RR, Shrestha A, Reddy KR, Wijewardane NK, et al. 2023. Resilience of soybean cultivars to drought stress during flowering and early-seed setting stages. Scientific Reports 13:1277 doi: 10.1038/s41598-023-28354-0

    CrossRef   Google Scholar

    [9] Katuwal KB, Yang H, Huang B. 2023. Evaluation of phenotypic and photosynthetic indices to detect water stress in perennial grass species using hyperspectral, multispectral and chlorophyll fluorescence imaging. Grass Research 3:16 doi: 10.48130/GR-2023-0016

    CrossRef   Google Scholar

    [10] Liang H, Zhou Y, Lu Y, Pei S, Xu D, et al. 2024. Evaluation of soybean drought tolerance using multimodal data from an unmanned aerial vehicle and machine learning. Remote Sensing 16:2043 doi: 10.3390/rs16112043

    CrossRef   Google Scholar

    [11] Gai J, Wang J, Xie S, Xiang L, Wang Z. 2024. Spectroscopic determination of chlorophyll content in sugarcane leaves for drought stress detection. Precision Agriculture 25:543−569 doi: 10.1007/s11119-023-10082-0

    CrossRef   Google Scholar

    [12] Zhang J, He Y, Liu J, Fan J, Shang J, et al. 2024. Integrating spectral data and phylogeographic patterns to study plant genetic variation: a review. Grass Research 4:11 doi: 10.48130/grares-0024-0009

    CrossRef   Google Scholar

    [13] Khuimphukhieo I, Bhandari M, Enciso J, da Silva JA. 2024. Assessing drought stress of sugarcane cultivars using unmanned vehicle system (UAS)-based vegetation indices and physiological parameters. Remote Sensing 16:1433 doi: 10.3390/rs16081433

    CrossRef   Google Scholar

    [14] Merewitz E, Meyer W, Bonos S, Huang B. 2010. Drought stress responses and recovery of texas × kentucky hybrids and Kentucky bluegrass genotypes in temperate climate conditions. Agronomy Journal 102:258−268 doi: 10.2134/agronj2009.0328

    CrossRef   Google Scholar

    [15] Kuska MT, Behmann J, Mahlein AK. 2018. Potential of hyperspectral imaging to detect and identify the impact of chemical warfare compounds on plant tissue. Pure and Applied Chemistry 90:1615−1624 doi: 10.1515/pac-2018-0102

    CrossRef   Google Scholar

    [16] Su Q, Wang J, Ling H, Wang Z, Gai J. 2025. Estimation of chlorophyll and water content in maize leaves under drought stress based on VIS/NIR spectroscopy. Processes 13:3087 doi: 10.3390/pr13103087

    CrossRef   Google Scholar

    [17] Slaton MR, Hunt ER Jr, Smith WK. 2001. Estimating near-infrared leaf reflectance from leaf structural characteristics. American Journal of Botany 88:278−284 doi: 10.2307/2657019

    CrossRef   Google Scholar

    [18] Tucker CJ. 1980. Remote sensing of leaf water content in the near infrared. Remote Sensing of Environment 10:23−32 doi: 10.1016/0034-4257(80)90096-6

    CrossRef   Google Scholar

    [19] Braga P, Crusiol LGT, Nanni MR, Caranhato ALH, Fuhrmann MB, et al. 2021. Vegetation indices and NIR-SWIR spectral bands as a phenotyping tool for water status determination in soybean. Precision Agriculture 22:249−266 doi: 10.1007/s11119-020-09740-4

    CrossRef   Google Scholar

    [20] Rouse JW, Haas RH, Schell JA, Deering DW. 1974. Monitoring vegetation systems in the Great Plains with ERTS. In 3rd ERTS Symposium. Washington, DC, USA: NASA. NASA. Goddard Space Flight Center. pp. 309−317 https://ntrs.nasa.gov/citations/19740022614
    [21] Sims DA, Gamon JA. 2002. Relationships between leaf pigment content and spectral reflectance across a wide range of species, leaf structures and developmental stages. Remote Sensing of Environment 81:337−354 doi: 10.1016/S0034-4257(02)00010-X

    CrossRef   Google Scholar

    [22] Zhang N, Su X, Zhang X, Yao X, Cheng T, et al. 2020. Monitoring daily variation of leaf layer photosynthesis in rice using UAV-based multi-spectral imagery and a light response curve model. Agricultural and Forest Meteorology 291:108098 doi: 10.1016/j.agrformet.2020.108098

    CrossRef   Google Scholar

    [23] Lobos GA, Matus I, Rodriguez A, Romero-Bravo S, Araus JL, et al. 2014. Wheat genotypic variability in grain yield and carbon isotope discrimination under Mediterranean conditions assessed by spectral reflectance. Journal of Integrative Plant Biology 56:470−479 doi: 10.1111/jipb.12114

    CrossRef   Google Scholar

    [24] Jordan CF. 1969. Derivation of leaf-area index from quality of light on the forest floor. Ecology 50:663−666 doi: 10.2307/1936256

    CrossRef   Google Scholar

    [25] Babar MA, van Ginkel M, Klatt AR, Prasad B, Reynolds MP. 2006. The potential of using spectral reflectance indices to estimate yield in wheat grown under reduced irrigation. Euphytica 150:155−172 doi: 10.1007/s10681-006-9104-9

    CrossRef   Google Scholar

    [26] Inoue Y, Peñuelas J, Miyata A, Mano M. 2008. Normalized difference spectral indices for estimating photosynthetic efficiency and capacity at a canopy scale derived from hyperspectral and CO2 flux measurements in rice. Remote Sensing of Environment 112:156−172 doi: 10.1016/j.rse.2007.04.011

    CrossRef   Google Scholar

    [27] Segarra J, Aparicio N, Kefauver SC, Rukhsar A, Arjona JM, et al. 2025. Phenotyping genetic advances of wheat under Mediterranean conditions using stable isotopes and high-resolution aerial and satellite multispectral data. Crop and Environment 4:271−285 doi: 10.1016/j.crope.2025.09.001

    CrossRef   Google Scholar

    [28] Gitelson AA, Gritz Y, Merzlyak MN. 2003. Relationships between leaf chlorophyll content and spectral reflectance and algorithms for non-destructive chlorophyll assessment in higher plant leaves. Journal of Plant Physiology 160:271−282 doi: 10.1078/0176-1617-00887

    CrossRef   Google Scholar

    [29] Peng Y, Nguy-Robertson A, Arkebauer T, Gitelson AA. 2017. Assessment of canopy chlorophyll content retrieval in maize and soybean: implications of hysteresis on the development of generic algorithms. Remote Sensing 9:226 doi: 10.3390/rs9030226

    CrossRef   Google Scholar

    [30] Huete AR. 1988. A soil-adjusted vegetation index (SAVI). Remote Sensing of Environment 25:295−309 doi: 10.1016/0034-4257(88)90106-X

    CrossRef   Google Scholar

    [31] Qi J, Chehbouni A, Huete AR, Kerr YH, Sorooshian S. 1994. A modified soil adjusted vegetation index. Remote Sensing of Environment 48:119−126 doi: 10.1016/0034-4257(94)90134-1

    CrossRef   Google Scholar

    [32] Gamon JA, Peñuelas J, Field CB. 1992. A narrow-waveband spectral index that tracks diurnal changes in photosynthetic efficiency. Remote Sensing of Environment 41:35−44 doi: 10.1016/0034-4257(92)90059-S

    CrossRef   Google Scholar

    [33] El-Hendawy SE, Al-Suhaibani NA, Elsayed S, Hassan WM, Dewir YH, et al. 2019. Potential of the existing and novel spectral reflectance indices for estimating the leaf water status and grain yield of spring wheat exposed to different irrigation rates. Agricultural Water Management 217:356−373 doi: 10.1016/j.agwat.2019.03.006

    CrossRef   Google Scholar

    [34] Peñuelas J, Filella I, Gamon JA. 1995. Assessment of photosynthetic radiation-use efficiency with spectral reflectance. New Phytologist 131:291−296 doi: 10.1111/j.1469-8137.1995.tb03064.x

    CrossRef   Google Scholar

    [35] Merzlyak MN, Gitelson AA, Chivkunova OB, Rakitin VY. 1999. Non-destructive optical detection of pigment changes during leaf senescence and fruit ripening. Physiologia Plantarum 106:135−141 doi: 10.1034/j.1399-3054.1999.106119.x

    CrossRef   Google Scholar

    [36] Baret F, Guyot G. 1991. Potentials and limits of vegetation indices for LAI and APAR assessment. Remote Sensing of Environment 35:161−173 doi: 10.1016/0034-4257(91)90009-U

    CrossRef   Google Scholar

    [37] Roujean JL, Breon FM. 1995. Estimating PAR absorbed by vegetation from bidirectional reflectance measurements. Remote Sensing of Environment 51:375−384 doi: 10.1016/0034-4257(94)00114-3

    CrossRef   Google Scholar

    [38] Miller JR, Hare EW, Wu J. 1990. Quantitative characterization of the vegetation red edge reflectance 1. An inverted-Gaussian reflectance model. International Journal of Remote Sensing 11:1755−1773 doi: 10.1080/01431169008955128

    CrossRef   Google Scholar

    [39] Zhang HY, Liu MR, Feng ZH, Song L, Li X, et al. 2021. Estimations of water use efficiency in winter wheat based on multi-angle remote sensing. Frontiers in Plant Science 12:614417 doi: 10.3389/fpls.2021.614417

    CrossRef   Google Scholar

    [40] Huete A, Didan K, Miura T, Rodriguez EP, Gao X, et al. 2002. Overview of the radiometric and biophysical performance of the MODIS vegetation indices. Remote Sensing of Environment 83:195−213 doi: 10.1016/S0034-4257(02)00096-2

    CrossRef   Google Scholar

    [41] Read JJ, Tarpley L, McKinion JM, Reddy KR. 2002. Narrow-waveband reflectance ratios for remote estimation of nitrogen status in cotton. Journal of Environmental Quality 31:1442−1452 doi: 10.2134/jeq2002.1442

    CrossRef   Google Scholar

    [42] Feng W, Guo BB, Wang ZJ, He L, Song X, et al. 2014. Measuring leaf nitrogen concentration in winter wheat using double-peak spectral reflection remote sensing data. Field Crops Research 159:43−52 doi: 10.1016/j.fcr.2014.01.010

    CrossRef   Google Scholar

    [43] Peñuelas J, Gamon JA, Griffin KL, Field CB. 1993. Assessing community type, plant biomass, pigment composition, and photosynthetic efficiency of aquatic vegetation from spectral reflectance. Remote Sensing of Environment 46:110−118 doi: 10.1016/0034-4257(93)90088-F

    CrossRef   Google Scholar

    [44] Penuelas J, Pinol J, Ogaya R, Filella I. 1997. Estimation of plant water concentration by the reflectance Water Index WI (R900/R970). International Journal of Remote Sensing 18:2869−2875 doi: 10.1080/014311697217396

    CrossRef   Google Scholar

    [45] Prasad B, Carver BF, Stone ML, Babar MA, Raun WR, et al. 2007. Genetic analysis of indirect selection for winter wheat grain yield using spectral reflectance indices. Crop Science 47:1416−1425 doi: 10.2135/cropsci2006.08.0546

    CrossRef   Google Scholar

    [46] Villegas D, Aparicio N, Royo C. 2008. Assessment of durum wheat yield and carbon isotope discrimination by reflectance indices WI and PRI. In Cereal Science and Technology for Feeding Ten Billion People: Genomics Era and Beyond, eds. Molina-Cano JL, Christou P, Graner A, Hammer K, Jouve N, et al. Zaragoza, Spain: CIHEAM/IRTA. pp. 403–405 www.academia.edu/74838824/Assessment_of_durum_wheat_yield_and_carbon_isotope_discrimination_by_reflectance_indices_WI_and_PRI
    [47] Marino G, Pallozzi E, Cocozza C, Tognetti R, Giovannelli A, et al. 2014. Assessing gas exchange, sap flow and water relations using tree canopy spectral reflectance indices in irrigated and rainfed Olea europaea L. Environmental and Experimental Botany 99:43−52 doi: 10.1016/j.envexpbot.2013.10.008

    CrossRef   Google Scholar

    [48] Brunori E, Bernardini A, Moresi FV, Attorre F, Biasi R. 2022. Ecophysiological response of Vitis vinifera L. in an urban agrosystem: preliminary assessment of genetic variability. Plants 11:3026 doi: 10.3390/plants11223026

    CrossRef   Google Scholar

    [49] Zarco-Tejada PJ, Ustin SL. 2002. Estimation of vegetation water content with MODIS data and radiative transfer simulation. Proceedings of the First International Symposium on Recent Advances in Quantitative Remote Sensing, Valencia, Spain, 16−20 September, 2002. Valencia, Spain: CIHEAM. 6 pp. http://hdl.handle.net/10261/10628
    [50] Beegum S, Hassan MA, Ramamoorthy P, Bheemanahalli R, Reddy KN, et al. 2024. Hyperspectral reflectance-based high throughput phenotyping to assess water-use efficiency in cotton. Agriculture Switzerland 14:1054 doi: 10.3390/agriculture14071054

    CrossRef   Google Scholar

    [51] Gao BC. 1996. NDWI—A normalized difference water index for remote sensing of vegetation liquid water from space. Remote Sensing of Environment 58:257−266 doi: 10.1016/S0034-4257(96)00067-3

    CrossRef   Google Scholar

    [52] Chen D, Huang J, Jackson TJ. 2005. Vegetation water content estimation for corn and soybeans using spectral indices derived from MODIS near- and short-wave infrared bands. Remote Sensing of Environment 98:225−236 doi: 10.1016/j.rse.2005.07.008

    CrossRef   Google Scholar

    [53] Garriga M, Romero-Bravo S, Estrada F, Méndez-Espinoza AM, González-Martínez L, et al. 2021. Estimating carbon isotope discrimination and grain yield of bread wheat grown under water-limited and full irrigation conditions by hyperspectral canopy reflectance and multilinear regression analysis. International Journal of Remote Sensing 42:2848−2871 doi: 10.1080/01431161.2020.1854888

    CrossRef   Google Scholar

    [54] Sharaf-Eldin MA, Elsayed S, Elmetwalli AH, Yaseen ZM, Moghanm FS, et al. 2023. Using optimized three-band spectral indices and a machine learning model to assess squash characteristics under moisture and potassium deficiency stress. Horticulturae 9:79 doi: 10.3390/horticulturae9010079

    CrossRef   Google Scholar

    [55] Bell GE, Howell BM, Johnson GV, Raun WR, Solie JB, et al. 2004. Optical sensing of turfgrass chlorophyll content and tissue nitrogen. HortScience 39:1130−1132 doi: 10.21273/Hortsci.39.5.1130

    CrossRef   Google Scholar

    [56] Yang M, Hassan MA, Xu K, Zheng C, Rasheed A, et al. 2020. Assessment of water and nitrogen use efficiencies through UAV-based multispectral phenotyping in winter wheat. Frontiers in Plant Science 11:927 doi: 10.3389/fpls.2020.00927

    CrossRef   Google Scholar

    [57] Gitelson AA, Merzlyak MN. 1997. Remote estimation of chlorophyll content in higher plant leaves. International Journal of Remote Sensing 18:2691−2697 doi: 10.1080/014311697217558

    CrossRef   Google Scholar

    [58] Khuimphukhieo I, Zhao L, Ghansah B, Scott JLL, Fernandez-Montero O, et al. 2025. Use of uncrewed aerial system (UAS)-based crop features to perform growth analysis of energy cane genotypes. Plants 14:654 doi: 10.3390/plants14050654

    CrossRef   Google Scholar

    [59] Haboudane D, Miller JR, Pattey E, Zarco-Tejada PJ, Strachan IB. 2004. Hyperspectral vegetation indices and novel algorithms for predicting green LAI of crop canopies: modeling and validation in the context of precision agriculture. Remote Sensing of Environment 90:337−352 doi: 10.1016/j.rse.2003.12.013

    CrossRef   Google Scholar

    [60] Royo C, Villegas D. 2011. Field measurements of canopy spectra for biomass assessment of small-grain cereals. In Biomass - Detection, Production and Usage, ed. Matovic MD. 510 pp. doi: 10.5772/973
    [61] Wu C, Niu Z, Tang Q, Huang W. 2008. Estimating chlorophyll content from hyperspectral vegetation indices: modeling and validation. Agricultural and Forest Meteorology 148:1230−1241 doi: 10.1016/j.agrformet.2008.03.005

    CrossRef   Google Scholar

    [62] Cox R, Parr TW, Plant RA. 1988. Water use and water-use efficiency of perennial ryegrass swards as affected by the height and frequency of cutting and seed rate. Grass and Forage Science 43:97−104 doi: 10.1111/j.1365-2494.1988.tb02145.x

    CrossRef   Google Scholar

    [63] Groh J, Vanderborght J, Pütz T, Vogel HJ, Gründling R, et al. 2020. Responses of soil water storage and crop water use efficiency to changing climatic conditions: a lysimeter-based space-for-time approach. Hydrology and Earth System Sciences 24:1211−1225 doi: 10.5194/hess-24-1211-2020

    CrossRef   Google Scholar

    [64] Erickson JE, Kenworthy KE. 2011. Nitrogen and light affect water use and water use efficiency of zoysiagrass genotypes differing in canopy structure. HortScience 46:643−647 doi: 10.21273/HORTSCI.46.4.643

    CrossRef   Google Scholar

    [65] Morgan W, Singh J, Kesheimer K, Davis J, Sanz-Saez A. 2024. Identifying physiological traits related with drought tolerance and water-use efficiency in floral hemp (Cannabis sativa L.). Crop Science 64:354−372 doi: 10.1002/csc2.21150

    CrossRef   Google Scholar

    [66] Farquhar GD, Ehleringer JR, Hubick KT. 1989. Carbon isotope discrimination and photosynthesis. Annual Review of Plant Physiology and Plant Molecular Biology 40:503−537 doi: 10.1146/annurev.pp.40.060189.002443

    CrossRef   Google Scholar

    [67] Ismail AM, Hall AE. 1993. Inheritance of carbon isotope discrimination and water-use efficiency in cowpea. Crop Science 33:498−503 doi: 10.2135/cropsci1993.0011183X003300030016x

    CrossRef   Google Scholar

    [68] Johnson RC, Tieszen LL. 1993. Carbon isotope discrimination, water relations, and gas exchange in temperate grass species and accessions. In Stable Isotopes and Plant Carbon-water Relations, eds. Ehleringer JR, Hall AE, Farquhar GD. Amsterdam: Elsevier. pp. 281–296 doi: 10.1016/b978-0-08-091801-3.50027-1
    [69] Condon AG, Richards RA. 1992. Broad sense heritability and genotype × environment interaction for carbon isotope discrimination in field-grown wheat. Australian Journal of Agricultural Research 43:921−934 doi: 10.1071/ar9920921

    CrossRef   Google Scholar

    [70] Merewitz E, Belanger F, Warnke S, Huang B, Bonos S. 2014. Quantitative trait loci associated with drought tolerance in creeping bentgrass. Crop Science 54:2314−2324 doi: 10.2135/cropsci2013.12.0810

    CrossRef   Google Scholar

    [71] Pittman JJ, Arnall DB, Interrante SM, Moffet CA, Butler TJ. 2015. Estimation of biomass and canopy height in bermudagrass, alfalfa, and wheat using ultrasonic, laser, and spectral sensors. Sensors 15:2920−2943 doi: 10.3390/s150202920

    CrossRef   Google Scholar

    [72] Bazzo COG, Kamali B, Hütt C, Bareth G, Gaiser T. 2023. A review of estimation methods for aboveground biomass in grasslands using UAV. Remote Sensing 15:639 doi: 10.3390/rs15030639

    CrossRef   Google Scholar

    [73] Johnson RC, Bassett LM. 1991. Carbon isotope discrimination and water use efficiency in four cool-season grasses. Crop Science 31:157−162 doi: 10.2135/cropsci1991.0011183X003100010036x

    CrossRef   Google Scholar

    [74] Mertens S, Verbraeken L, Sprenger H, De Meyer S, Demuynck K, et al. 2023. Monitoring of drought stress and transpiration rate using proximal thermal and hyperspectral imaging in an indoor automated plant phenotyping platform. Plant Methods 19:132 doi: 10.1186/s13007-023-01102-1

    CrossRef   Google Scholar

    [75] Dong H, Dong J, Sun S, Bai T, Zhao D, et al. 2024. Crop water stress detection based on UAV remote sensing systems. Agricultural Water Management 303:109059 doi: 10.1016/j.agwat.2024.109059

    CrossRef   Google Scholar

    [76] Yousfi S, Marín J, Parra L, Lloret J, Mauri PV. 2022. Remote sensing devices as key methods in the advanced turfgrass phenotyping under different water regimes. Agricultural Water Management 266:107581 doi: 10.1016/j.agwat.2022.107581

    CrossRef   Google Scholar

    [77] Jones P, Allen LH Jr, Jones JW, Boote KJ, Campbell WJ. 1984. Soybean canopy growth, photosynthesis, and transpiration responses to whole-season carbon-dioxide enrichment. Agronomy Journal 76:633−637 doi: 10.2134/agronj1984.00021962007600040030x

    CrossRef   Google Scholar

    [78] Zhang G, Ming B, Shen D, Xie R, Hou P, et al. 2021. Optimizing grain yield and water use efficiency based on the relationship between leaf area index and evapotranspiration. Agriculture 11:313 doi: 10.3390/agriculture11040313

    CrossRef   Google Scholar

    [79] Zhou H, Zhou G, Zhou L, Lv X, Ji Y, et al. 2021. The interrelationship between water use efficiency and radiation use efficiency under progressive soil drying in maize. Frontiers in Plant Science 12:794409 doi: 10.3389/fpls.2021.794409

    CrossRef   Google Scholar

    [80] He L, Ren X, Wang Y, Liu B, Zhang H, et al. 2020. Comparing methods for estimating leaf area index by multi-angular remote sensing in winter wheat. Scientific Reports 10:13943 doi: 10.1038/s41598-020-70951-w

    CrossRef   Google Scholar

    [81] Song W, Liu H, Lu Y, Lv J, Gui R, et al. 2025. Precise drought threshold monitoring in winter wheat different growth periods using a multispectral unmanned aerial vehicle. Drones 9:157 doi: 10.3390/drones9030157

    CrossRef   Google Scholar

    [82] Din M, Zheng W, Rashid M, Wang S, Shi Z. 2017. Evaluating hyperspectral vegetation indices for leaf area index estimation of Oryza sativa L. at diverse phenological stages. Frontiers in Plant Science 8:820 doi: 10.3389/fpls.2017.00820

    CrossRef   Google Scholar

    [83] El-Hendawy S, Al-Suhaibani N, Al-Ashkar I, Alotaibi M, Tahir MU, et al. 2020. Combining genetic analysis and multivariate modeling to evaluate spectral reflectance indices as indirect selection tools in wheat breeding under water deficit stress conditions. Remote Sensing 12:1480 doi: 10.3390/rs12091480

    CrossRef   Google Scholar

    [84] Filella I, Penuelas J. 1994. The red edge position and shape as indicators of plant chlorophyll content, biomass and hydric status. International Journal of Remote Sensing 15:1459−1470 doi: 10.1080/01431169408954177

    CrossRef   Google Scholar

    [85] McCree KJ. 1972. Test of current definitions of photosynthetically active radiation against leaf photosynthesis data. Agricultural Meteorology 10:443−453 doi: 10.1016/0002-1571(72)90045-3

    CrossRef   Google Scholar

    [86] Liu J, van Iersel MW. 2021. Photosynthetic physiology of blue, green, and red light: light intensity effects and underlying mechanisms. Frontiers in Plant Science 12:619987 doi: 10.3389/fpls.2021.619987

    CrossRef   Google Scholar

    [87] Okyere FG, Cudjoe DK, Virlet N, Castle M, Riche AB, et al. 2024. Hyperspectral imaging for phenotyping plant drought stress and nitrogen interactions using multivariate modeling and machine learning techniques in wheat. Remote Sensing 16:3446 doi: 10.3390/rs16183446

    CrossRef   Google Scholar

    [88] Parida PK, Eagan S, Ramanujam K, Sengodan R, Uthandi S, et al. 2024. Machine learning approaches for estimation of the fraction of absorbed photosynthetically active radiation and net photosynthesis rate of maize using multi-spectral sensor. Heliyon 10:e34117 doi: 10.1016/j.heliyon.2024.e34117

    CrossRef   Google Scholar

    [89] Li L, Huang G, Wu J, Yu Y, Zhang G, et al. 2025. Combine photosynthetic characteristics and leaf hyperspectral reflectance for early detection of water stress. Frontiers in Plant Science 16:1520304 doi: 10.3389/fpls.2025.1520304

    CrossRef   Google Scholar

    [90] Peng Y, Zeng A, Zhu T, Fang S, Gong Y, et al. 2017. Using remotely sensed spectral reflectance to indicate leaf photosynthetic efficiency derived from active fluorescence measurements. Journal of Applied Remote Sensing 11:026034 doi: 10.1117/1.JRS.11.026034

    CrossRef   Google Scholar

    [91] Filella I, Amaro T, Araus JL, Peñuelas J. 1996. Relationship between photosynthetic radiation-use efficiency of barley canopies and the photochemical reflectance index (PRI). Physiologia Plantarum 96:211−216 doi: 10.1111/j.1399-3054.1996.tb00204.x

    CrossRef   Google Scholar

    [92] Fullana-Pericàs M, Conesa MÀ, Gago J, Ribas-Carbó M, Galmés J. 2022. High-throughput phenotyping of a large tomato collection under water deficit: combining UAVs' remote sensing with conventional leaf-level physiologic and agronomic measurements. Agricultural Water Management 260:107283 doi: 10.1016/j.agwat.2021.107283

    CrossRef   Google Scholar

    [93] Taghvaeian S, Chávez JL, Hattendorf MJ, Crookston MA. 2013. Optical and thermal remote sensing of turfgrass quality, water stress, and water use under different soil and irrigation treatments. Remote Sensing 5:2327−2347 doi: 10.3390/rs5052327

    CrossRef   Google Scholar

    [94] Volterrani M, Minelli A, Gaetani M, Grossi N, Magni S, et al. 2017. Reflectance, absorbance and transmittance spectra of bermudagrass and manilagrass turfgrass canopies. PLoS One 12:e0188080 doi: 10.1371/journal.pone.0188080

    CrossRef   Google Scholar

    [95] Zhang F, Zhou G. 2019. Estimation of vegetation water content using hyperspectral vegetation indices: a comparison of crop water indicators in response to water stress treatments for summer maize. BMC Ecology 19:18 doi: 10.1186/s12898-019-0233-0

    CrossRef   Google Scholar

    [96] Gutierrez M, Reynolds MP, Klatt AR. 2010. Association of water spectral indices with plant and soil water relations in contrasting wheat genotypes. Journal of Experimental Botany 61:3291−3303 doi: 10.1093/jxb/erq156

    CrossRef   Google Scholar

    [97] McCall DS, Zhang X, Sullivan DG, Askew SD, Ervin EH. 2017. Enhanced soil moisture assessment using narrowband reflectance vegetation indices in creeping bentgrass. Crop Science 57:S161−S168 doi: 10.2135/cropsci2016.06.0471

    CrossRef   Google Scholar

    [98] Claudio HC, Cheng Y, Fuentes DA, Gamon JA, Luo H, et al. 2006. Monitoring drought effects on vegetation water content and fluxes in chaparral with the 970 nm water band index. Remote Sensing of Environment 103:304−311 doi: 10.1016/j.rse.2005.07.015

    CrossRef   Google Scholar

    [99] Zarco-Tejada PJ, Rueda CA, Ustin SL. 2003. Water content estimation in vegetation with MODIS reflectance data and model inversion methods. Remote Sensing of Environment 85:109−124 doi: 10.1016/S0034-4257(02)00197-9

    CrossRef   Google Scholar

    [100] McCann SE, Huang B. 2008. Evaluation of drought tolerance and avoidance traits for six creeping bentgrass cultivars. HortScience 43:519−524 doi: 10.21273/HORTSCI.43.2.519

    CrossRef   Google Scholar

    [101] Sanchez-Bragado R, Newcomb M, Chairi F, Condorelli GE, Ward RW, et al. 2020. Carbon isotope composition and the NDVI as phenotyping approaches for drought adaptation in durum wheat: beyond trait selection. Agronomy 10:1679 doi: 10.3390/agronomy10111679

    CrossRef   Google Scholar

    [102] Casadesús J, Kaya Y, Bort J, Nachit MM, Araus JL, et al. 2007. Using vegetation indices derived from conventional digital cameras as selection criteria for wheat breeding in water-limited environments. Annals of Applied Biology 150:227−236 doi: 10.1111/j.1744-7348.2007.00116.x

    CrossRef   Google Scholar

    [103] Gracia-Romero A, Vergara-Díaz O, Thierfelder C, Cairns JE, Kefauver SC, et al. 2018. Phenotyping conservation agriculture management effects on ground and aerial remote sensing assessments of maize hybrids performance in Zimbabwe. Remote Sensing 10:349 doi: 10.3390/rs10020349

    CrossRef   Google Scholar

    [104] Yousfi S, Gracia-Romero A, Kellas N, Kaddour M, Chadouli A, et al. 2019. Combined use of low-cost remote sensing techniques and δ13C to assess bread wheat grain yield under different water and nitrogen conditions. Agronomy 9:285 doi: 10.3390/agronomy9060285

    CrossRef   Google Scholar

    [105] Wang M, Ellsworth PZ, Zhou J, Cousins AB, Sankaran S. 2016. Evaluation of water-use efficiency in foxtail millet (Setaria italica) using visible-near infrared and thermal spectral sensing techniques. Talanta 152:531−539 doi: 10.1016/j.talanta.2016.01.062

    CrossRef   Google Scholar

    [106] Fania F, Pecorella I, Romano E, Spadanuda P, Pecchioni N, et al. 2025. RGB-derived indices accurately detect genotypic and agronomic differences in canopy variation in durum wheat. Crops 5:85 doi: 10.3390/crops5060085

    CrossRef   Google Scholar

    [107] Rustamova S, Jahangirov A, Léon J, Naz AA, Huseynova I. 2026. Wheat diversity reveals new genomic loci and candidate genes for vegetation indices using genome-wide association analysis. bioRxiv 1−22 doi: 10.64898/2026.01.14.699455

    CrossRef   Google Scholar

    [108] Serba DD, Wu YQ, Hejl RW, Williams CF, Bronson KF. 2023. Spectral reflectance estimated genetic variation in hybrid turf bermudagrass. Grass Research 3:22 doi: 10.48130/Gr-2023-0022

    CrossRef   Google Scholar

    [109] Garbulsky MF, Peñuelas J, Gamon J, Inoue Y, Filella I. 2011. The photochemical reflectance index (PRI) and the remote sensing of leaf, canopy and ecosystem radiation use efficiencies: a review and meta-analysis. Remote Sensing of Environment 115:281−297 doi: 10.1016/j.rse.2010.08.023

    CrossRef   Google Scholar

    [110] Xie Q, Dash J, Huang W, Peng D, Qin Q, et al. 2018. Vegetation indices combining the red and red-edge spectral information for leaf area index retrieval. IEEE Journal of Selected Topics in Applied Earth Observations and Remote Sensing 11:1482−1493 doi: 10.1109/Jstars.2018.2813281

    CrossRef   Google Scholar

    [111] Gao S, Yan K, Liu J, Pu J, Zou D, et al. 2024. Assessment of remote-sensed vegetation indices for estimating forest chlorophyll concentration. Ecological Indicators 162:112001 doi: 10.1016/j.ecolind.2024.112001

    CrossRef   Google Scholar

    [112] Barati S, Rayegani B, Saati M, Sharifi A, Nasri M. 2011. Comparison the accuracies of different spectral indices for estimation of vegetation cover fraction in sparse vegetated areas. The Egyptian Journal of Remote Sensing and Space Science 14:49−56 doi: 10.1016/j.ejrs.2011.06.001

    CrossRef   Google Scholar

    [113] Ihuoma SO, Madramootoo CA. 2019. Sensitivity of spectral vegetation indices for monitoring water stress in tomato plants. Computers and Electronics in Agriculture 163:104860 doi: 10.1016/j.compag.2019.104860

    CrossRef   Google Scholar

    [114] Ferdos F, Rahman MR. 2024. Challenges and prospects in using very high-resolution optical satellite imagery for urban water body extraction—a study utilizing GeoEye remote sensing data for surface water management perspective. In Water Resource Management in Climate Change Scenario, eds. Talukdar S, Shahfahad, Pal S, Naikoo MW, Ahmed S, et al. Cham: Springer. pp. 113−131 doi: 10.1007/978-3-031-61121-6_7
    [115] Dong J, Xiao X, Wagle P, Zhang G, Zhou Y, et al. 2015. Comparison of four EVI-based models for estimating gross primary production of maize and soybean croplands and tallgrass prairie under severe drought. Remote Sensing of Environment 162:154−168 doi: 10.1016/j.rse.2015.02.022

    CrossRef   Google Scholar

    [116] Zhen Z, Chen S, Yin T, Chavanon E, Lauret N, et al. 2021. Using the negative soil adjustment factor of soil adjusted vegetation index (SAVI) to resist saturation effects and estimate leaf area index (LAI) in dense vegetation areas. Sensors 21:2115 doi: 10.3390/s21062115

    CrossRef   Google Scholar

    [117] Ren H, Zhou G, Zhang F. 2018. Using negative soil adjustment factor in soil-adjusted vegetation index (SAVI) for aboveground living biomass estimation in arid grasslands. Remote Sensing of Environment 209:439−445 doi: 10.1016/j.rse.2018.02.068

    CrossRef   Google Scholar

    [118] Kim DM, Zhang H, Zhou H, Du T, Wu Q, et al. 2015. Highly sensitive image-derived indices of water-stressed plants using hyperspectral imaging in SWIR and histogram analysis. Scientific Reports 5:15919 doi: 10.1038/srep15919

    CrossRef   Google Scholar

  • Cite this article

    Zhang Q, Huang B. 2026. Remote sensing–derived vegetation indices for assessing water-use efficiency and associated physiological traits in grass species adaption to drought stress: a review. Grass Research 6: e024 doi: 10.48130/grares-0026-0019
    Zhang Q, Huang B. 2026. Remote sensing–derived vegetation indices for assessing water-use efficiency and associated physiological traits in grass species adaption to drought stress: a review. Grass Research 6: e024 doi: 10.48130/grares-0026-0019

Figures(1)  /  Tables(3)

Article Metrics

Article views(48) PDF downloads(8)

Other Articles By Authors

REVIEW   Open Access    

Remote sensing–derived vegetation indices for assessing water-use efficiency and associated physiological traits in grass species adaption to drought stress: a review

Grass Research  6 Article number: e024  (2026)  |  Cite this article

Abstract: Increasing shortage of water availability for irrigation and declining precipitation have intensified the need to enhance plant drought tolerance. Water-use efficiency (WUE) is a key trait affecting plant adaptation to drought stress and can be assessed through instantaneous measurements of the photosynthesis-to-transpiration ratio, biomass-to-water use ratio, and carbon isotope discrimination (CID; Δ13C). However, these conventional approaches are labor-intensive, destructive, and time-consuming, limiting their applicability in large-scale phenotyping and breeding programs. Remote sensing-based vegetation indices (VIs) have been widely applied in grass species, including Normalized Difference Vegetation Index (NDVI), Green Normalized Difference Vegetation Index (GNDVI), Water Band Index (WBI), Normalized Difference Moisture Index (NDMI), Normalized Difference Snow Index (NDSI), Optimized Soil-Adjusted Vegetation Index (OSAVI), and Shortwave Infrared Water Index (SWWI), to estimate Δ13C and key physiological traits associated with WUE, including leaf area index (LAI), net photosynthetic rate (A), stomatal conductance (gs), chlorophyll and water content. This review synthesizes current advances in the use of VIs derived from remote sensing imagery to assess Δ13C and WUE-related traits, with a focus on grass species, such as annual cereal crops as well as perennial turf and forage grasses. The VI-based approach has great potential in high-throughput phenotyping and screening WUE-related traits for developing drought-tolerant and water-use-efficient grass species.

    • The increasing frequency and severity of droughts, combined with rising water demand and declining water resources, exacerbate water scarcity and threaten plant growth and productivity. Consequently, developing strategies to enhance plant tolerance to drought stress by improving water use efficiency (WUE) is essential. WUE refers to the amount of carbon assimilated during photosynthesis or used to produce biomass or grains per unit of water consumed by the crop[1,2]. Several plant traits influence WUE, including biomass, leaf area or plant density, photosynthetic rate (A), evapotranspiration (ET), transpiration (T), and stomatal conductance (gs)[35]. Evaluation and quantification of these WUE-related components are necessary to assess WUE and to develop water-use-efficient plant varieties.

      Most current methodologies for assessing WUE are either destructive or labor-intensive, including measurements such as the A/T and the biomass/ET, and estimations based on carbon isotope discrimination (CID; Δ13C) analysis. Alternatively, vegetation indices derived from remote sensing offer significant potential for high-throughput and non-destructive evaluation of WUE. Spectral technologies evaluate plant vegetation by analyzing how much light is reflected and absorbed by plants in different wavelengths, which are closely linked to plant growth, physiological traits, and environmental stresses[614]. For instance, visible light (450−750 nm) reflectance relates to pigments such as chlorophyll, carotene, and anthocyanin in leaves[15]. Pigment-related indices include Photochemical Reflectance Index (PRI), Chlorophyll red-edge Index (Clred-edge), Structure-Insensitive Pigment Index (SIPI), and Modified Chlorophyll Absorption in Reflectance Index (MCARI). Visible and NIR have been successfully used in the estimation of chlorophyll and water content in leaves exposed to drought stress[16]. Near-infrared red (NIR, 750−1,000 nm) reflectance relates to cell structure such as protein, starch, fatty acid, the thick leaf cuticle, mesophyll exposure ratio in plants[15,17], and is captured by structural indices such as Normalized Difference Vegetation Index (NDVI), Simple Ratio (SR), Enhanced Vegetation Index (EVI), and Soil-Adjusted Vegetation Index (SAVI). Short-wave infrared (SWIR, 1,000−2,500 nm) contains absorption peaks for water, sugar, and other plant chemicals, in which water has a high absorption rate at 1,450, 1,900, and 2,500 nm[15,18]. SWIR has advanced in non-destructively differentiating genotypic variations and phenotyping for relative water content (RWC), A, gs, and T in plants exposed to drought[19]. Water-related indices include Water Band Index (WBI), Shortwave Infrared Water Index (SWWI), Normalized Difference Moisture Index (NDMI), and Normalized Difference Water Index (NDWI). When spectral technologies are integrated with Unmanned Aerial Vehicle (UAV), they make remote sensing a powerful tool for data acquisition in complex physiological traits such as WUE-related traits.

      To capture spectral reflectance of plants, the most widely used cameras or sensors mounted on UAVs include Red-green-blue (RGB), multispectral, and hyperspectral imaging systems. These sensors are primarily different in spectral resolution, the level of interpretable physiological traits from the data, and cost, making each suited to different application scenarios. The sensor type requirements for VIs associated with WUE-related traits are listed in Table 1. RGB camera is the most basic form, capturing three color bands (red, green, and blue). With its low-cost and widespread accessibility, RGB imagery is widely used for a quick and cheap check of plants, especially for canopy color, structure, visible biotic and abiotic stress symptoms, but lacks invisible spectral information. Hyperspectral imaging has the highest spectral resolution, capturing hundreds of narrow contiguous bands to provide highly specific information about plant growth, physiological status, and stress responses. Hyperspectral imaging offers high spectral resolution to assist physiological traits estimation but generates large datasets, requires complex processing, and is high-cost. Multispectral cameras use several specific bands (four to ten bands) like visible and near-infrared, enabling the calculation of more vegetation indices. Multispectral systems are more practical for large-scale breeding programs, providing high-throughput phenotyping with a balance between operation efficiency, data content, and affordable cost.

      Table 1.  A summary of vegetation Indices for physiological traits associated with water use efficiency.

      Indices Formula Sensor type Ref.
      NDVI (Normalized Difference Vegetation Index) (R800 − R720)/(R800 + R720);
      (R830 − R660)/(R830 + R660);
      (R900 − R680)/(R900 + R680);
      (R800 − R600)/(R800 + R600);
      Multispectral [2023]
      DVI (Difference Vegetation Index) R810 − R680;
      R800 − R720
      Multispectral [22,24]
      RVI (Ratio Vegetation Index) R830 / R660 Multispectral [23,25]
      SR (Simple Ratio) R900/R680 Multispectral [23,26]
      CVI (Chlorophyll Vegetation Index) NIR* RED /GREEN2 Multispectral [27]
      CIred-edge (Chlorophyll Index - Red Edge) (RNIR/Rred-edge) − 1 Red-edge multispectral [22,28,29]
      SAVI (Soil Adjusted Vegetation Index) (1 + 0.5)*(RNIR − Rred)/(RNIR + Rred + 0.5) Multispectral [22,23,30]
      MSAVI (Modified SAVI) (2*RNIR + 1)−(2*RNIR + 1)2−8*(RNIR − Rred)2 Multispectral [22,31]
      PRI (Photochemical Reflectance Index) (R531 − R570)/(R531 + R570) Hyperspectral/narrowband multispectral [32,33]
      SIPI (Structure Insensitive Pigment Index) (R800 − R445)/(R800 − R680) Multispectral [23,34]
      PSRI (Plant Senescence Reflectance Index) (R680 − R500)/R750 Multispectral/hyperspectral [35]
      TSAVI (Transformed Soil Adjusted Vegetation Index) (−1.4735*R780 + R650 + 1.4735*1.3681) Multispectral [36]
      RDVI (Red Difference Vegetation Index) (R800 − R670)/sqrt(R800 + R670) Multispectral [37]
      Lo (The minimum spectral reflectance corresponding
      to the chlorophyll absorption well)
      Min(R680 − R780)
      Hyperspectral [38,39]
      EVI-1 (Enhanced Vegetation Index-1) 2.5*(R860 − R645)/(1 + R860 + 6*R645 − 7.5*R470) Multispectral [39,40]
      Readone R415/R695 Red-edge multispectral [41]
      NDDAig (Normalized Difference of the Double-peak
      Areas based on REPig [red edge positions derived by
      maximum inverted Gaussian fitting] division)
      (R755 + R680 − 2*R705)/(R755 − R680) Hyperspectral [39,42]
      WEI (Water Use Efficiency Index) NDDAig/FWBI;
      [(R755 + R680 − 2*R705)]*Min(R930980)/
      [(R755 − R680)*R900]
      Hyperspectral/multispectral [39]
      WBI (Water Band Index)
      R970/R900;
      R950/R900
      Hyperspectral/narrowband multispectral [4348]
      SRWI (Simple Ratio Water Index) R860/R1240 SWIR sensor [49,50]
      NDWI (Normalized Difference Water Index) (R860 − R1240)/(R860 + R1240);
      (R860 − R2270)/(R860 + R2270);
      (R970 − R880)/(R970 + R880);
      (R970 − R920)/(R970 + R920);
      (R858 − R1640)/(R858 + R1640);
      (R858 − R2130)/(R858 + R2130);
      SWIR-enabled multispectral [33,5053]
      NDI (Normalized Difference Index)
      (R602 − R598 − R600)/(R602 + R598 + R600);
      (R644 − R630 − R652)/(R644 + R630 + R652);
      (R648 − R662 − R624)/(R648 + R662 + R624)
      RGB/multispectral [54]
      GNDVI (Green Normalized Difference Vegetation Index) (R780 − R550)/(R780 + R550) Multispectral [33,39,45,55,56]
      NDRE (Red Edge NDVI) (RNIR − Rred-edge)/(RNIR + Rred-edge)

      Red-edge multispectral [29,39,57]
      NGRDI (Normalized Green Red Difference Index) (Rgreen − Rred)/(Rgreen + Rred)
      (R780 − R670)/(R780 + R670)

      RGB [56,58]
      EVI (Enhanced Vegetation Index) 2.5*(RNIR − R680)/(1 + RNIR + 6*R680–7.5*R450);
      2[R830 − R660]/[1 + R830 + 6R660 − 7.5R460]
      Multispectral [23,25,56]
      SWWI (Shortwave Infrared Water Index) R1650/R850 SWIR sensor [23,25]
      NWI3 (Normalized Water Index -3) (R970 − R920)/(R970 + R920) SWIR sensor [23,25]
      NDMI (Normalized Difference Moisture Index) [R2200 − R1100]/[R2200 + R1100] SWIR-enabled multispectral [23,25]
      NDSI (Normalized Difference Snow Index) (R518 − R676)/(R518 + R676);
      (R620 − R623)/(R620 + R623);
      (R620 − R637)/(R620 + R637)
      SWIR sensor [23,26]
      MTVI (Modified Triangular Vegetation Index) $ \dfrac{1.5[1.2({R}_{800}-{R}_{550})-2.5({R}_{670}-{R}_{550})]}{\sqrt{{(2{{R}_{800}}+1)}^{2}-\left(6{R}_{800}-5\sqrt{{R}_{670}}\right)-0.5}} $ Multispectral [23,33,59,60]
      OSAVI (Optimal Soil Adjusted Vegetation Index) (1 + 0.16) × (R750 − R705)/(R750 + R705 + 0.16) Multispectral [13,23,61]
      TVI (Triangular Vegetation Index) 0.5 [120(R750 − R550)-200(R670 − R550)] Multispectral [23,33,59,60]

      This review overviews and analyzes methodologies for assessing WUE and VIs related to WUE, and further discusses potential indices associated with carbon-isotope-discrimination-based WUE in grass species, including annual cereal crops and perennial grasses cultivated as turf or forage.

    • WUE at the plant community level is typically calculated as the ratio of total plant biomass to total community ET, where a higher WUE indicates more biomass produced per unit of water consumed[62]. The total amount of plant biomass that has been produced by the community is often the dry weight of the plants. The ET rate is the total amount of water lost from the system to the atmosphere. It is the sum of the transpiration rate from the leaves of plants and the evaporation rate from the soil. The ET rate can be measured using lysimeters in field plots or pot-grown plants in controlled environments, such as growth-chamber and greenhouse experiments. The biomass/ET based WUE has been used widely in various crops, including perennial grasses and annual crops, such as maize (Zea mays L.), winter wheat (Triticum aestivum L.), and winter rye (Secale cereale L.)[5,63].

      At the leaf level, intrinsic or instantaneous WUE is calculated from the ratio of A and T or gs, expressed as μmol CO2 per mmol H2O. The leaf-level WUE can be quantified directly using gas exchange systems which measure the rates of A and T or gs, allowing for real-time calculation of A/T or A/gs in individual leaves of field plants or pot-grown plants[64,65].

      Leaf WUE can also be estimated by measuring Δ13C. Both atmospheric 12CO2 and 13CO2 enter the stomata together, but Rubisco has a higher affinity to the lighter and smaller 12CO2 due to their different kinetics and diffusion rates, resulting in a change in the composition of 13C and 12C (δ13C) in leaf tissues compared to the constant δ13C in the air[66]. However, when stomatal closure occurs under drought, limited availability of CO2 makes Rubisco take up more unfavorable 13CO2 when 12CO2 runs out in the stomata, resulting in a higher δ13C in the plant. Therefore, when the stomata close more, there is a higher Δ13C, which refers to a greater discrimination of δ13C between the plant and the air. These plants were considered more water-use efficient as their stomata close more under abiotic stress. The Δ13C is negatively correlated with instantaneous WUE[67]. WUE can be effectively estimated with Δ13C, and genetic variations in Δ13C were found among grass species[68]. The Δ13C is highly heritable and has high broad-sense heritability (over 0.91) in various plant species, such as wheat[69]. Significant QTLs associated with Δ13C were identified on chromosomes 5 and 6 in creeping bentgrass (Agrostis stolonifera) under drought[70]. The Δ13C value provides a long-term, integrated measure of the ratio of internal leaf CO2 concentration to ambient CO2 concentration by reflecting the plant's physiological responses over the period of tissue formation, offering a practical alternative to instantaneous WUE measurements by laborious gas exchange systems.

      Destructive methods for measuring WUE, such as plant community-based biomass assessments, present challenges, especially for crops like turfgrass, which are not designed for clipping yield harvesting. Additionally, the accuracy of these measurements is often limited by non-uniform canopy growth[71,72]. Instantaneous WUE estimation provides more direct and precise physiological data; however, it is time-consuming and labor-intensive[7]. The Δ13C serves as a more convenient surrogate for estimating integrated WUE[70,73]. However, this method involves destructive sampling, and the analysis of δ13C can be costly. Therefore, a non-destructive approach that can assess WUE and monitor its dynamic changes is highly desirable.

    • Remote sensing imagery, which captures the spectral reflectance of plant canopies, offers a powerful approach for evaluating plant growth, physiological traits, and responses to environmental stresses[613], suggesting a significant potential for high-throughput evaluation of WUE. Various VIs derived from remote sensing and spectral imaging are used to evaluate plant or canopy phenotypic traits or physiological status (Table 1). Under drought stress, plants exhibit varying reductions in leaf water status, chlorophyll content, A, ET, and leaf area index (LAI), all of which can be detected by UAV remote sensing[74,75]. This approach can identify drought-related physiological traits long before visible symptoms appear by analyzing changes in spectral reflectance related to water content and stress[10,21,75,76]. Those VIs specifically related to major physiological traits that control WUE are listed in Table 1 and depicted in Fig. 1. Several VIs exhibited associations with multiple components of WUE; these multifunctional indices are summarized in Table 2.
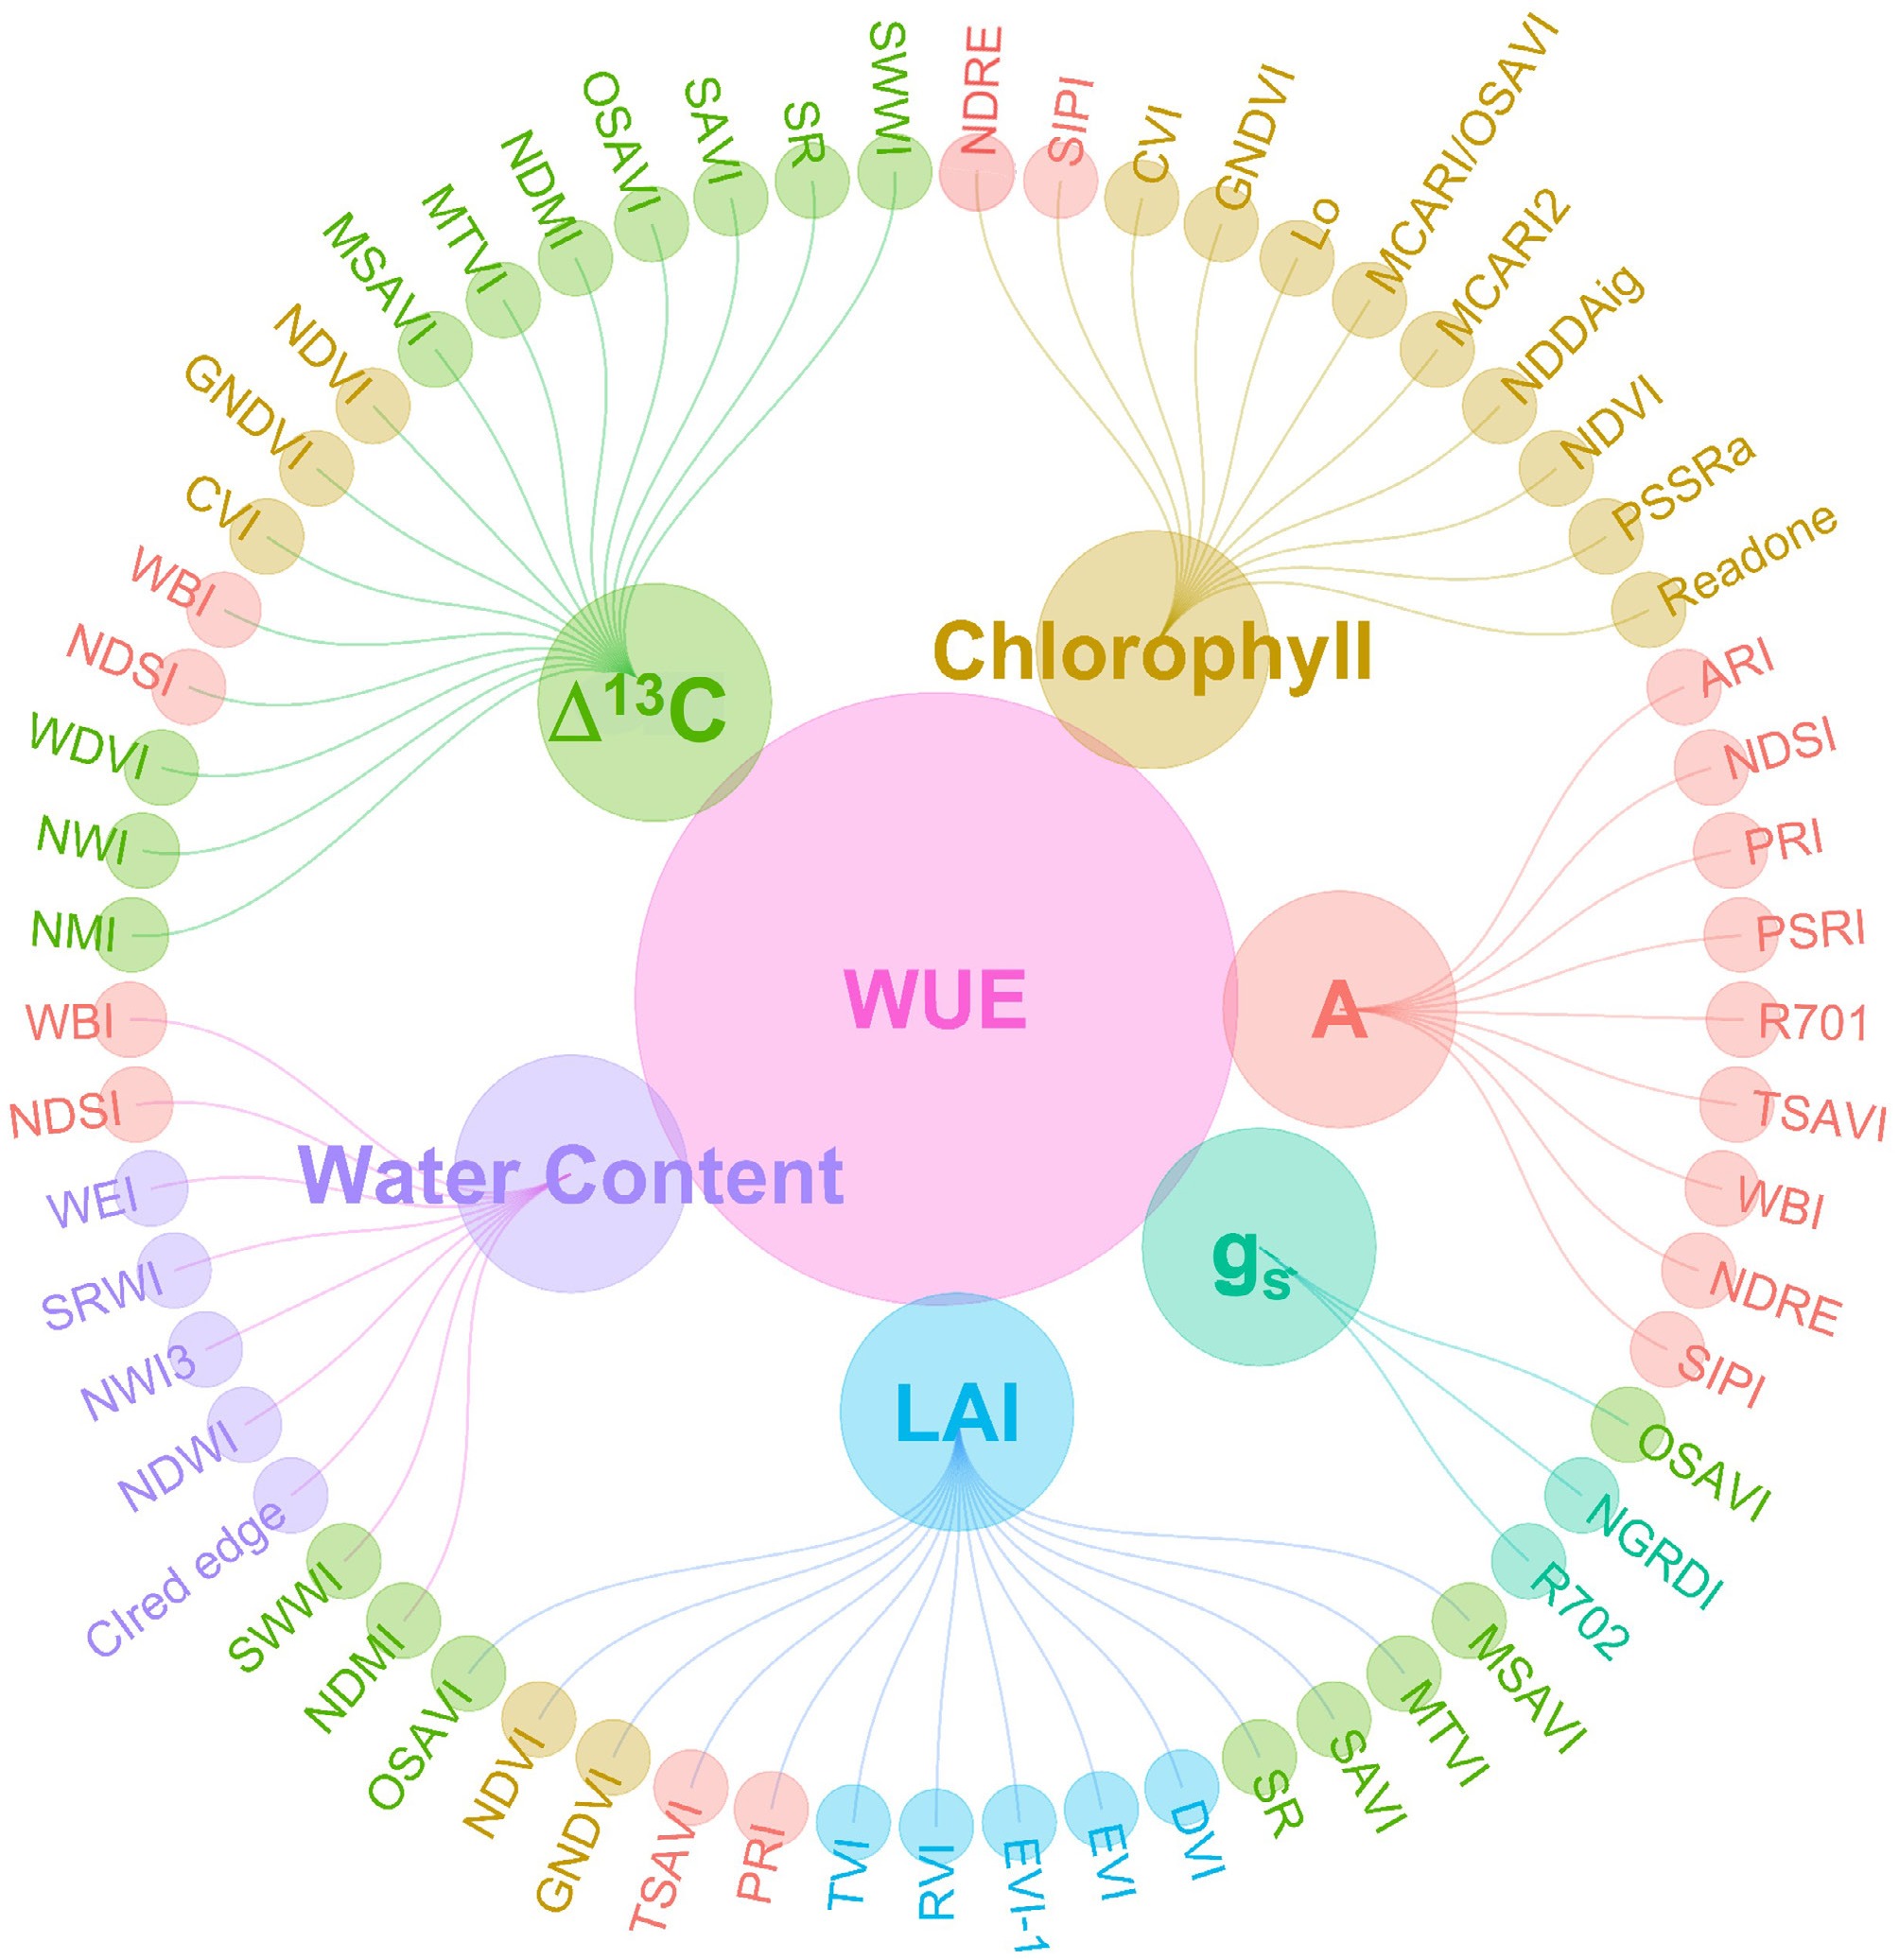
      Figure 1. 

      Network visualization of vegetation indices (VIs) and water-use efficiency (WUE) components. WUE is the central node, surrounded by its physiological traits: carbon isotope discrimination (Δ13C, in green), chlorophyll (in brown), photosynthesis (A, in red), stomatal conductance (gs, in teal), leaf area index (LAI, in blue), and water content (in purple). Vegetation indices are arranged in the outer ring and connected to specific physiological traits by lines. Lines connect each VIs to its corresponding WUE component. VIs associated with multiple WUE components are displayed in the color of the additional traits they relate to and are summarized separately in Table 2 to highlight their versatility.

      Table 2.  Vegetation indices linked to two or more traits of WUE.

      Vegetation index Leaf area index (LAI) Chlorophyll content Photosynthesis (A) Stomatal conductance (gs) Water status Carbon isotope
      discrimination (Δ13C)
      NDRE
      NDSI
      PRI
      R701
      SIPI
      TSAVI
      WBI
      OSAVI
      MSAVI
      MTVI
      SAVI
      SR
      NDMI
      SWWI
      CVI
      GNDVI
      NDVI
      Bold indicates vegetation indices (NDSI, OSAVI, GNDVI, and NDVI) that were associated with three traits.
    • LAI affects WUE through transpiration and photosynthetic capacity[77]. As LAI increases, the surface area for transpiration increases. However, higher LAI also increases the potential for photosynthesis and carbon uptake, which can improve WUE, but only up to an optimal point where water loss and water availability are balanced[78]. LAI has a direct but non-linear relationship with WUE[79]. NDVI, Difference Vegetation Index (DVI), EVI, and SR were highly and significantly correlated with LAI in different plant species, as reported in winter wheat[80,81] (Fig. 1; Table 1). Ratio Vegetation Index (RVI), NDVI, Green Normalized Difference Vegetation Index (GNDVI), Modified Soil Adjusted Vegetation Index (MSAVI), SAVI, Optimized Soil Adjusted Vegetation Index (OSAVI), and EVI efficiently described LAI in different growth stages of cotton (Gossypium hirsutum) under irrigation, with coefficients of determination of R2 ranging from 0.94 to 0.5[82]. LAI was strongly positively associated to EVI (r > 0.8), OSAVI (0.6 < r < 0.8), GNDVI (r > 0.8), Triangular Vegetation Index (TVI, 0.6 < r < 0.8), and modified Triangular Vegetation Index (MTVI, 0.6 < r < 0.8), but strongly negatively correlated with Normalized Difference Moisture Index (NDMI, r < −0.6) and Normalized Difference Water Index (NDWI, r < −0.8) in wheat exposed to drought stress[83]. Those aforementioned studies indicate that VIs, including NDVI, EVI, DVI, SR, RVI, GNDVI, MSAVI, TVI, SAVI, OSAVI, and MTVI, show strong correlations with LAI across various crops and growth stages, while moisture-related indices such as NDMI and NDWI may show negative relationships under drought conditions, highlighting the effectiveness of spectral indices in estimating LAI under both irrigated and water-stressed environments.

    • Chlorophyll absorbs sunlight to provide energy for photosynthesis, where carbohydrates are produced in leaves. Spectral reflectance at the red edge provides valuable information about plant chlorophyll concentration[84]. Chlorophyll content has been estimated by Chlorophyll Vegetation Index (CVI) in wheat under drought[27]. Bell et al.[55] found that GNDVI and NDVI were strongly correlated to chlorophyll (R2 = 0.7;0.75) and nitrogen concentration (R2 = 0.76; 0.81) in bermudagrass (Cynodon dactylon) and creeping bentgrass (Fig. 1; Table 1). Some vegetation indices, such as Normalized Difference Index (NDI) NDI602, 598, 600, NDI 644, 630, 652, NDI648, 662, 624, were significantly correlated with gravimetric WUE, with the R2 ranges in 0.19−0.25, also showed significant correlation with chlorophyll (R2: 0.18−0.58) across different levels of drought stress[54]. Overall, indices such as NDVI, CVI, GNDVI, and specific NDI variants have proven reliable for estimating chlorophyll, nitrogen concentration, and WUE across different crops and drought conditions, highlighting their value for precision monitoring of plant health and stress responses.

    • Photosynthesis provides sugar and energy for biomass accumulation and is related to WUE in various ways, from leaf-level instantaneous WUE to whole plant scales. The light wavelength of photosynthetically active radiation ranges from 400 to 700 nm in plants[85,86]. Some indices can indirectly estimate canopy photosynthesis, such as DVI, NDVI, Red Difference Vegetation Index (RDVI), SR, SAVI, and Transformed Soil Adjusted Vegetation Index (TSAVI)[87,88] (Fig. 1; Table 1). PRI estimates the radiation-use efficiency by plants, related to photosynthetic rate and chlorophyll fluorescence[89]. Some vegetative indices, such as red edge NDVI (NDRE), PRI, and EVI, showed significant correlation (R2, 0.88−0.49) to chlorophyll fluorescence (estimated as Fv/Fm) in aspen (Populus tremuloides) and cherry (Prunus avium) tree leaves under drought[90]. PRI also showed a significant correlation of r = 0.77 with epoxidation state and zeaxanthin in a cereal canopy[91]. NDVI, SR, and GNDVI were significantly and positively correlated (r ranges from 0.58−0.68) with photosynthetic rate under both well-watered and water-deficient conditions in different tomato (Solanum lycopersicum) genotypes[92]. In a winter wheat study, 12 out of 330 vegetation indices showed the highest correlation with instantaneous WUE (A/E) under drought, with R2 values between 0.53 and 0.57[39]. These indices were ranked as (normalized difference of the double-peak areas based on REPig [red edge positions derived by maximum inverted Gaussian fitting] division) NDDAig, the minimum spectral reflectance corresponding to the chlorophyll absorption well (Lo), EVI-1, RDVI, PRI, Readone, Green Vegetation Index (GVI), Plant Senescence Reflectance Index (PSRI), Structure Insensitive Pigment Index (SIPI), TSAVI, and DVI, furthermore, the water efficiency index (WEI = NDDAig/FWBI) were constructed for better sensitivity of WUE changes[39,42]. Those VIs of estimating canopy photosynthesis, chlorophyll fluorescence, and radiation-use efficiency, along with specialized metrics like WEI, offer valuable tools for monitoring photosynthetic performance and WUE across different crops and water conditions, particularly under drought stress.

    • Stomatal conductance regulates the flux of water vapor and CO2 in plants, which are highly associated with WUE. Vegetation indices, OSAVI and Normalized Green Red Difference Index (NGRDI), were selected as the best indicators for stomatal conductance under mild to moderate drought in sugarcane[13]. NDVI, SR, and GNDVI were significantly and positively correlated with net photosynthetic rate and stomatal conductance under both well-watered and water-deficient conditions in tomato, with r values ranging between 0.58−0.73[92]. NDWI and simple ratio water index (SRWI) had the highest prediction (with high regression values of R2 = 0.65, 0.66, respectively) for intrinsic WUE tested with 40 cotton cultivars in the field condition, while NDWI 2130 and NDWI 1640 showed regression values of R2 = 0.36 for both) didn't seem to be effective in this study[50]. Overall, VIs, such as OSAVI, NGRDI, NDVI, SR, GNDVI, NDWI, and SRWI, have demonstrated strong potential for monitoring stomatal behavior and predicting WUE across different crops and water conditions, though their effectiveness may vary depending on the specific index and crops studied.

    • Canopy water status-related vegetation indices include SRWI, NDWI, SWWI, normalized water index (NWI), NDMI, WBI, WEI (Fig. 1; Table 1). Some vegetation indices using near-IR wavelengths, like NDWI, could penetrate deeper to see through multiple leaf layers, which may benefit the estimation of canopy water status for dense and overlapping turfgrass leaves[93,94]. NDWI 1,630 nm and NDWI 2,130 nm had shown promising potential to estimate vegetation water content[19,52,95]. Leaf water potential, RWC, and canopy temperature were significantly and strongly correlated with NWI-3 (r = −0.49, −0.24, 0.49) in wheat under drought[96]. In maize, canopy water content was found strongly correlated (R2 > 0.72) with Clred edge, NDVI, WBI, and NDWI under drought[95]. WBI was used to predict soil water content in crops and turfgrass, but it was found to be significantly and highly correlated (r = 0.52 − 0.85) to total chlorophyll and tissue water content in creeping bentgrass[97]. A strong negative correlation (r = −0.52) was found between WBI and T under drought in some plant species, such as corn[14]. WBI varies among plant species and is significantly correlated with water and CO2 flux under drought, suggesting the potential for estimating WUE[98]. The SRWI uses reflectance bands (typically R858/R1240) where water absorption features in the SWIR region are prominent. While some water indices designed for the leaf scale may not perform well at the canopy scale, the SRWI has demonstrated good performance at the canopy level, likely due to its strong response to the significant changes in canopy water content that occur in a canopy over time or under stress conditions, suggesting the reliable measurement of canopy water content from SRWI[99]. The VIs, particularly those utilizing near-infrared and shortwave infrared wavelengths, such as WBI, SWWI, NDWI, and SRWI, are valuable for assessing water content in dense canopies, penetrating multiple leaf layers, and capturing temporal changes under stress. Their correlations with leaf water potential, relative water content, canopy temperature, transpiration, and stomatal conductance highlight the utility for estimating WUE and managing crop water status across diverse plant species and environmental conditions.

    • Carbon isotope discrimination was used to estimate WUE among six creeping bentgrass cultivars to reveal their drought-tolerant mechanisms[100]. However, the spectral indices associated with Δ13C are not well studied in grass species under drought. A UAV remote sensing study demonstrated that vegetation indices such as NDVI, SR, and GNDVI were significantly correlated with A (r = 0.58−0.68), gs (r = 0.58−0.73), WUEintrisic (r = −0.66−0.51), and Δ13C (r = −0.52 to −0.17) under both well-watered and water deficient conditions in tomato[92]. Under drought, CVI has shown strong negative correlation (r = −0.75) with δ13C in wheat[27]. The correlation between NDVI and δ13C was significant under drought but not promising in well-watered conditions in durum wheat[101]. Besides NDVI, RGB-based vegetation index green area (GA) and greener area (GGA)[102,103] showed significant correlation (r = −0.49 to −0.44) with δ13C under rainfed and irrigated conditions in bread wheat[104]. In a panel of 368 wheat genotypes, several water-related indices [NDMI, NWI, SWWI, WBI, NDSI] and vegetative indices (MSAVI, Weighted Difference Vegetation Index [WDVI], SAVI, MTVI, and OSAVI) exhibited strong correlations with Δ13C (r up to 0.76), under mild drought stress or irrigated conditions, outperforming NDVI (r = 0.51)[23]. However, Lobos et al.[23], also reported that these indices were not effective predictors under severe drought. Visible-near infrared spectral data showed accurate and precise estimation of E, A, gs, Δ13C, WUEintrinsic, WUEinstantenous, with the R2 values ranging from 0.85 to 0.91 across different drought stress conditions, based on partial least squares regression (PLSR) model using spectroradiometer in foxtail millet (Setaria italica)[105].

      While Δ13C has been effectively used to characterize physiological responses to water stress, the integration of spectral indices as indirect, high-throughput proxies remains insufficiently explored in grass species. Evidence from other crops demonstrates that several vegetation indices—such as NDVI, SR, GNDVI, and RGB-based indices (GA and GGA)—can show significant relationships with Δ13C and WUE-related traits, particularly under drought or mild stress conditions. However, the strength and reliability of these relationships often vary with stress severity, as some indices lose predictive power under severe drought.

      In summary, as depicted in Fig. 1, LAI was closely associated with MSAVI, MTVI, SAVI, SR, DVI, EVI, RVI, TVI, PRI, NDVI, TSAVI, GNDVI, and OSAVI. Chlorophyll content correlated with NDRE, SIPI, CVI, GNDVI, Lo, MCARI/OSAVI, MCARI2, NDDAig, NDVI, PSSRa, and Readone. Photosynthetic activity was linked to ARI, NDSI, PRI, PSRI, R701, TSAVI, WBI, NDRE, and SIPI, while stomatal conductance was associated with OSAVI, NGRDI, and R702. Canopy and leaf water status showed strong relationships with WBI, NDSI, WEI, SRWI, NWI3, NDWI, and Clred edge. Δ13C related VIs include NMI, NWI, WDVI, NDSI, WBI, CVI, NDVI, GNDVI, MSAVI, MTVI, NDMI, OSAVI, SAI, SR, and SWWI. The indices NDRE, NDSI, PRI, R701, SIPI, TSAVI, WBI, OSAVI, MTVI, MSAVI, CVI, SAVI, SR, NDMI, SWWI, GNDVI, and NDVI are clearly linked to two or more traits associated with WUE (Table 2; Fig. 1). Indices like NDSI, OSAVI, NDVI, and GNDVI are the most versatile, covering three traits. SWWI, NDMI, NDWI, and WBI are particularly valuable for water-related monitoring. OSAVI links canopy leaf areas and stomatal behaviors, making it useful under drought conditions. These indices offer a reliable framework for monitoring physiological and water-related traits, ranging from LAI and chlorophyll content to A, gs, water status, and Δ13C, enabling accurate assessment of WUE and drought tolerance across diverse species.

      Although numerous VIs have been reported to correlate with WUE-related traits, their performance is not ubiquitous in all circumstances and is influenced by both physiological and methodological factors. The effectiveness and accuracy of VIs to estimate WUE depend on plant species and genotype, as well as environmental conditions, including atmospheric and soil factors. Remote sensing-based VIs have been successfully used to detect genotypic variations in durum wheat, bread wheat, and bermudagrass in varying climatic conditions, suggesting a promising potential in accelerating breeding programs[106108]. The sensitivity of VIs varies with drought progression. In early/mild drought, physiological changes such as reductions in photosynthetic efficiency and initial declines in leaf water status occur before visible structural damage; therefore, pigment- and water-sensitive indices, such as the PRI, Clred-edge, SIPI, GNDVI[109112], and water-related indices (such as NDWI)[113,114], are most responsive. As drought progresses, photosynthetic rates decline further, accompanied by chlorophyll degradation, change of leaf angle (leaf rolling or wilting), and leaf abscission (Table 3). Under prolonged or severe drought, more pronounced structural changes occur, including leaf senescence, canopy loss, and reduced leaf area, which become dominant drivers of spectral signals. Consequently, structural indices, including NDVI, EVI, and SAVI[110,115117], along with water-related indices (such as WBI, NDWI)[113,118], generally provide more reliable estimates of WUE-related traits at this stage (Table 3).

      Table 3.  Vegetation indices linked to WUE under early and prolonged/severe drought.

      Drought stage VI category VIs Related physiological traits Limitations
      Early/mild drought Pigment-related PRI Xanthophyll cycle,
      photosynthetic efficiency
      Affected by illumination, canopy structure; species-specific response[89,91,109]
      Pigment-related CIred-edge Chlorophyll content Requires narrow spectral bands, saturates in high canopy density[95,110]
      Pigment-related SIPI Ratio of carotenoid/ chlorophyll Saturates at high chlorophyll levels, requires high spectral resolution[39,111]
      Structural/
      pigment hybrid
      GNDVI Chlorophyll, nitrogen Influenced by canopy structure[55,83,112]
      Water-related NDWI Leaf water content Less sensitive under mild stress, Sensitive to atmospheric conditions[50,83,113,114]
      Prolonged/
      severe drought
      Structural NDVI Canopy greenness, biomass Saturates at high LAI; insensitive to early stress[80]
      Structural EVI Canopy structure, biomass Higher data quality acquisition, overcompensate in high biomass density[80,115]
      Structural SAVI Vegetation vs soil contrast Saturates in high canopy density[82,116,117]
      Water-related NDWI Leaf/canopy water content Sensitive to atmospheric conditions[19,113,114]
      Water-related WBI Leaf water content Sensitive to canopy structure and chlorophyll levels[95,118]
      Pigment-related MCARI Chlorophyll degradation Sensitive to canopy structure and soil background at lower or higher chlorophyll levels[16,111]
    • Improving plant drought tolerance has become an urgent priority under increasingly adverse climatic and environmental conditions, with WUE serving as a central trait for adaptation. WUE can be assessed through instantaneous gas exchange measurements or through Δ13C, which reflects integrated, whole-plant performance over time. However, conventional approaches for measuring WUE are labor-intensive and time-consuming, limiting their application in large-scale screening and breeding programs. This review highlights the potential of remote sensing–derived VIs to estimate key physiological components associated with WUE, including LAI, A, gs, water status, chlorophyll content, and Δ13C, across grass species ranging from annual cereal crops to perennial turf and forage grasses. However, the limited research in grass species, especially under varying drought intensities, underscores the need for further investigation to validate and optimize spectral indices for reliable drought tolerance assessment in these systems. Integrating UAV-based multispectral or hyperspectral imagery with advanced machine learning models could improve prediction accuracy and scalability. Additionally, exploring the physiological basis linking spectral reflectance to Δ13C will enhance mechanistic understanding and model transferability across species. For instance, stomatal regulation affects intercellular CO2 concentration and transpiration, thereby influencing both Δ13C and spectral indices (such as OSAVI) associated with leaf water content[53]. Long-term and multi-environment validation studies are also essential to determine the reliability of spectral proxies for breeding and management applications. Ultimately, refining non-destructive, high-throughput phenotyping tools for Δ13C and WUE estimation will support precision irrigation strategies and accelerate the selection of drought-tolerant turfgrass cultivars.

      • Authors wish to thank United State Department of Agriculture - National Institute of Food and Agriculture (2021-51181-35855) and Rutgers Center for Turfgrass Science for funding support.

      • The authors confirm their contributions to the paper as follows: study conception and design, literature collection: Zhang Q, Huang B; draft manuscript preparation: Zhang Q; manuscript revision, supervision: Huang B. All authors reviewed the results and approved the final version of the manuscript.

      • Data sharing is not applicable to this review as no datasets were generated or analyzed during the current study.

      • The authors declare that they have no conflict of interest.

      • Copyright: © 2026 by the author(s). Published by Maximum Academic Press, Fayetteville, GA. This article is an open access article distributed under Creative Commons Attribution License (CC BY 4.0), visit https://creativecommons.org/licenses/by/4.0/.
    Figure (1)  Table (3) References (118)
  • About this article
    Cite this article
    Zhang Q, Huang B. 2026. Remote sensing–derived vegetation indices for assessing water-use efficiency and associated physiological traits in grass species adaption to drought stress: a review. Grass Research 6: e024 doi: 10.48130/grares-0026-0019
    Zhang Q, Huang B. 2026. Remote sensing–derived vegetation indices for assessing water-use efficiency and associated physiological traits in grass species adaption to drought stress: a review. Grass Research 6: e024 doi: 10.48130/grares-0026-0019

Catalog

    /

    DownLoad:  Full-Size Img  PowerPoint
    Return
    Return