










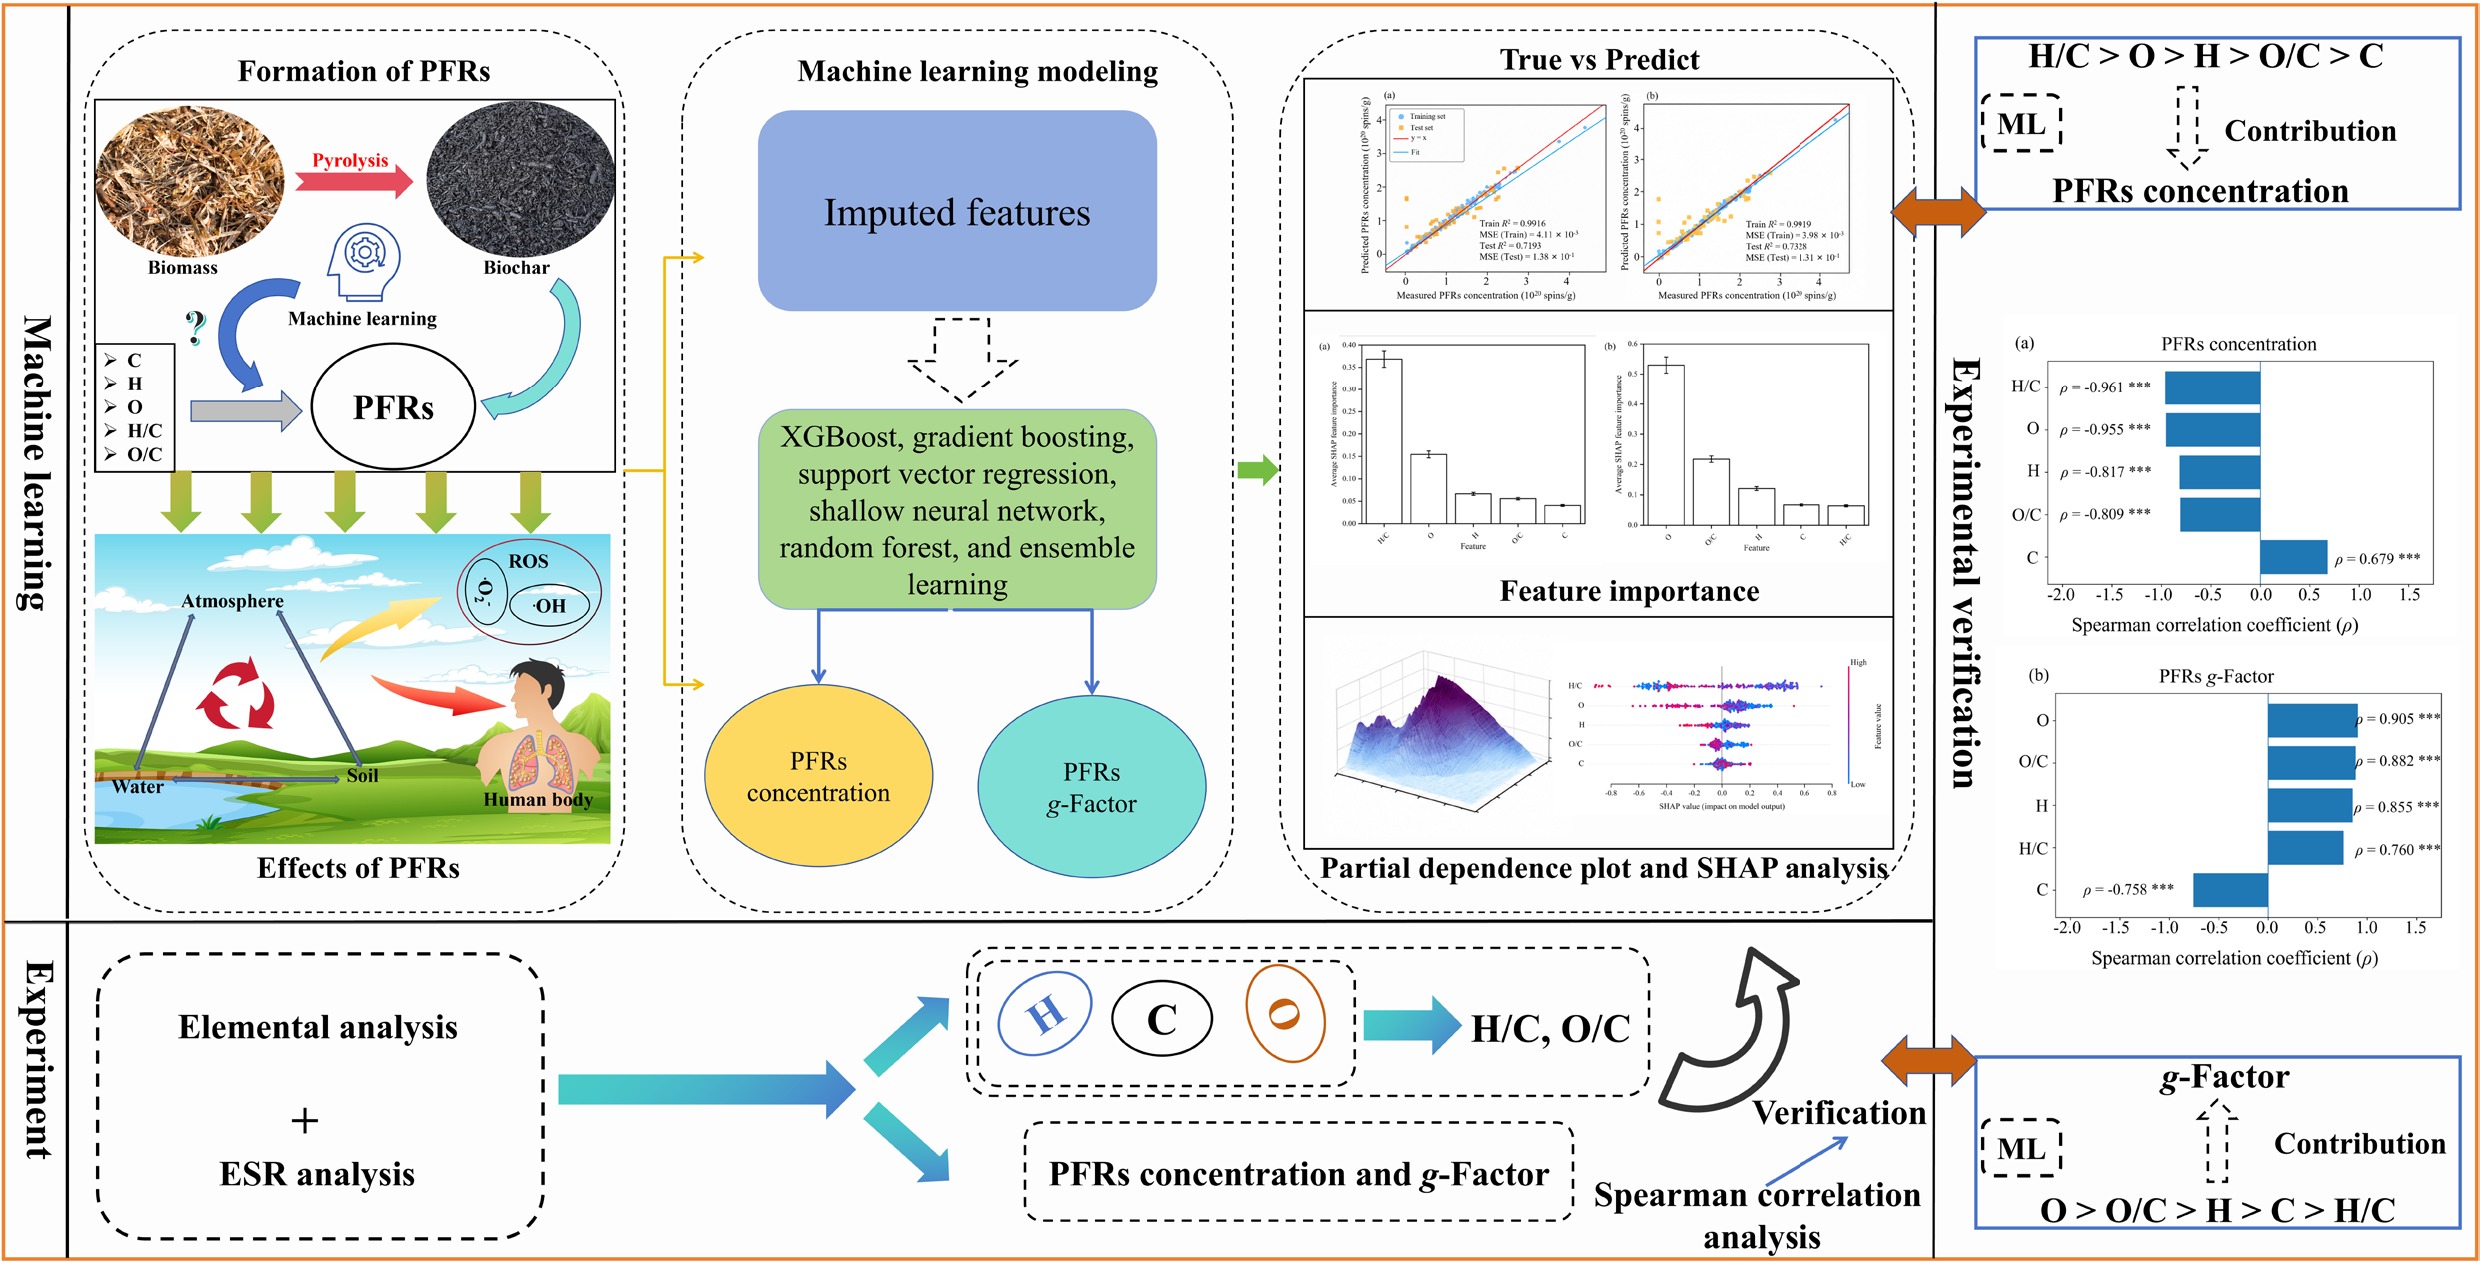



-
Biochar is a carbon-rich solid produced by pyrolysis under oxygen-limited or anaerobic conditions[1]. Owing to its porous structure, high surface area, and abundant functional groups, biochar has potential applications in agriculture, environmental remediation, and energy storage[2−4]. However, some specific physicochemical properties of biochars, particularly persistent free radicals (PFRs), may alter their performance and pose environmental risks. PFRs are stable, relatively long-lived radicals located on biochar surfaces and within pores[5], with lifetimes ranging from days to months[6]. They can mediate the formation of reactive oxygen species (ROS), including •OH, •O2−, and 1O2, thereby promoting the removal of organic pollutants[7,8] and heavy metals[9]. Conversely, PFRs can induce oxidative stress in plant and animal cells[10]. For example, PFRs-derived •OH in biochar can reduce soil bacterial diversity and activity[11]. PFRs may also directly react with plant and animal cells and induce ROS formation, leading to environmental risks. The reactivity of PFRs is mainly determined by their concentration and radical type, as reflected by the g-Factor. However, comprehensive studies linking PFRs properties with biochar physicochemical properties, especially elemental composition, remain limited.
PFRs concentration and radical type are commonly determined by electron paramagnetic resonance (EPR) spectroscopy (a.k.a. electron spin resonance [ESR] or electron magnetic resonance [EMR]). For radical-type identification, oxygen-centered radicals generally exhibit g-Factor values > 2.0040, mixed carbon- and oxygen-centered radicals exhibit values of 2.0030–2.0040, and carbon-centered radicals exhibit values < 2.0030[12]. Previous studies have examined factors affecting PFRs properties, including elemental composition and chemical structure. As oxygen-containing functional groups decrease in biochar, g-Factor values decline, and carbon-centered radicals form[13]. PFRs concentration is also directly associated with structural defects in biochar[14]. Our previous study showed that PFRs concentration is significantly and positively correlated with the peak areas of C=O and aromatic C=C groups[15]. The decomposition and reorganization of carbonaceous structures during pyrolysis constitute the main route for PFRs formation in biochar and directly change the elemental composition. A linear relationship between PFRs properties and elemental composition has been previously established for six types of lignocellulose-derived biochars[16]. However, such simple linear relationships may not be transferable to other lignocellulose-derived biochars. Therefore, owing to source-dependent differences in elemental composition and the likely nonlinear correlations between elemental composition and PFRs properties, a more general prediction model is needed to better understand diverse lignocellulose-derived biochars.
Machine learning (ML) is well suited to explore complex relationships between elemental composition and PFRs properties in lignocellulose-derived biochars. These data-driven approaches, including classification and regression tree-based models[17], can reduce the risk of overfitting, require relatively straightforward parameterization, and quantify the relative importance of individual factors[18]. This study constructed predictive models for PFRs concentration and g-Factor using eXtreme Gradient Boosting (XGBoost), gradient boosting, Support Vector Regression (SVR), shallow neural network (shallow NN), Random Forest (RF), and ensemble learning. In addition, this study interprets the importance of C, H, O, H/C, and O/C using Shapley additive explanations (SHAP), feature importance, and partial dependence plot (PDP) analyses. Independent lignocellulose-derived biochars were further prepared for experimental validation. This study provides scientific guidance for regulating biochar PFRs and a theoretical basis for evaluating the environmental impacts of biochar application.
-
A total of 263 paired records of PFRs concentration and g-Factor were collected from published studies to build prediction models (Supplementary Table S1)[12,13,16,19−35]. The raw datasets were preprocessed, including outlier removal and missing-value imputation. Outliers were identified using the interquartile range (IQR) method. For each dataset, the lower quartile (Q1), upper quartile (Q3), and interquartile range (IQR = Q3 − Q1) were determined. Samples with values lower than (Q1 − 1.5 IQR) or higher than (Q3 + 1.5 IQR) were identified as outliers and removed from the dataset (Supplementary Fig. S1). Before model construction, all literature-derived PFRs concentration data were converted to a uniform unit of ×1020 spins/g to ensure comparability among studies. No missing-value imputation was performed because the collected dataset did not contain any missing entries for the selected variables. However, because detailed EPR acquisition parameters, such as microwave power and modulation amplitude, were not uniformly available in the collected studies, further normalization based on instrumental settings was not performed. Consequently, the comparisons of PFRs concentration may contain minor uncertainties related to interstudy differences in EPR settings, and g-Factor-based radical identification might be less sensitive to signal intensity.
Pearson correlation coefficient (PCC) analysis
-
After the removal of outliers, only complete records containing all features were used for ML modeling. PFRs concentration and g-Factor were set as response variables, and C, H, O, H/C, and O/C were used as input variables. Pairwise linear correlations were quantified using the PCC analysis, as shown in Eq. (1):
$ r=\dfrac{\displaystyle\sum\limits_{i=1}^{n}\left({x}_{i}-\overline{x}\right)\left({y}_{i}-\overline{y}\right)}{\sqrt{\displaystyle\sum\limits_{i=1}^{n}{\left({x}_{i}-\overline{x}\right)}^{2}\displaystyle\sum\limits_{i=1}^{n}{\left({y}_{i}-\overline{y}\right)}^{2}}} $ (1) where,
$ \overline{x} $ $ \overline{y} $ $ {x}_{i} $ $ {y}_{i} $ Data normalization and model performance evaluation
-
All input value datasets were subjected to Z-score normalization to achieve standardization, as per Eq. (2):
$ x_{i}^{*}=\left({x}_{i}-\mu \right)/\sigma $ (2) where,
$ x_{i}^{*} $ $ \mu $ $ \sigma $ The ML models of PFRs concentration and g-Factor were assessed through the coefficient of determination (R2) and mean-squared error (MSE). The calculation formulas of R2 and MSE are shown in Eqs (3) and (4), respectively:
$ {R}^{2}=1-\dfrac{\displaystyle\sum{\left({y}_{i}-{\hat{y}}_{i}\right)}^{2}}{\displaystyle\sum{\left({y}_{i}-\overline{y}\right)}^{2}} $ (3) $ MSE=\dfrac{1}{n}\sum\limits_{i=1}^{n}{\left({y}_{i}-{\hat{y}}_{i}\right)}^{2} $ (4) where,
$ {y}_{i} $ $ {\hat{y}}_{i} $ $ \overline{y} $ Receiver operating characteristic (ROC) analysis
-
ROC curves were used as an auxiliary evaluation tool to assess the ability of each model to discriminate between high- and low-value samples. The median measured value of the response variable in the training set was used as the classification threshold. Samples above this threshold were assigned to the high-value class, and the remaining samples were assigned to the low-value class. The continuous predicted values generated by each model on the test set were then used as discriminant scores to calculate ROC curves and the corresponding area under the curve (AUC).
Experimental biochar
-
The experimental lignocellulose biochars derived from lignin, cellulose, pine sawdust (PS), rice straw (RS), and peanut hull (PH) were used to verify the ML results. Both cellulose and lignin feedstocks were sourced from Aladdin Reagent Company (Shanghai, China). The PH, RS, and PS feedstocks were purchased from an agricultural and forestry waste treatment plant in Kunming City, Yunnan Province. All raw materials were first crushed and sieved through a 100-mesh standard sieve and then subjected to pyrolysis at 300–800 °C under a 99.999% high-purity nitrogen atmosphere, with a holding time of 1 h. A heating rate of 10 °C/min was adopted.
Characterization of experimental biochars
-
The contents of C, H, and O were determined using an elemental analyzer (Vario MICRO Cube, Elementar, Germany) with a thermal conductivity detector. The combustion and reduction tube temperatures were set to 1,150 and 850 °C, respectively.
Both the PFRs concentration and g-Factor were determined by an electron paramagnetic resonance spectrometer (ESR, Bruker X-band A300-6/1, Germany). First, 10 ± 0.5 mg of biochar was loaded into quartz tubes with an outer diameter of 5.0 mm and an inner diameter of 3.0 mm. ESR parameters were set as follows based on our previous studies: 100 kHz modulation frequency, 9.2−9.9 GHz microwave frequency, 100 G sweep width, 1.00 G modulation amplitude, and 1,024 points as the resolution in the X-axis[15]. The microwave power was 0.1 mW (31 dB attenuation). The PFRs concentration (spins/g) was measured using the DPPH standard curve and adjusted by biochar weight, as described in our previous work.
-
Figure 1 shows the PCC matrix among all variables. H was weakly negatively correlated with PFRs concentration (r = −0.26), indicating that hydrogen content was inversely related to PFRs concentration, probably because of structural changes during biomass pyrolysis. O showed a moderate negative correlation with the PFRs concentration (r = −0.40), suggesting that higher oxygen content was associated with lower PFRs concentration, likely due to changes in oxygen-containing functional groups. O/C and H/C were also negatively correlated with PFRs concentration, with r values of −0.36 and −0.18, respectively. By contrast, C was weakly positively correlated with PFRs concentration (r = 0.11), indicating a minor contribution of carbon content to PFRs formation during biochar production. Overall, Fig. 1a indicates that H/C, H, O, and O/C were negatively associated with PFRs concentration and may be key descriptors affecting PFRs accumulation. For the PFRs g-Factor, H, O, and O/C showed significant positive correlations (p < 0.001). H was positively correlated with the g-Factor (r = 0.66), suggesting that changes in hydrogen-related functional groups may influence the radical type. O and O/C showed stronger positive correlations with the g-Factor (r = 0.77 and 0.74, respectively), indicating a shift from carbon-centered to oxygen-centered radicals. By contrast, C and H/C were only weakly correlated with the g-Factor (r = 0.067 and 0.038, respectively), further indicating that oxygen-related descriptors are the primary drivers of radical-type variations. These linear correlations provided a preliminary basis for subsequent ML modeling, while interpretable ML was used to elucidate nonlinear feature effects and interactions.
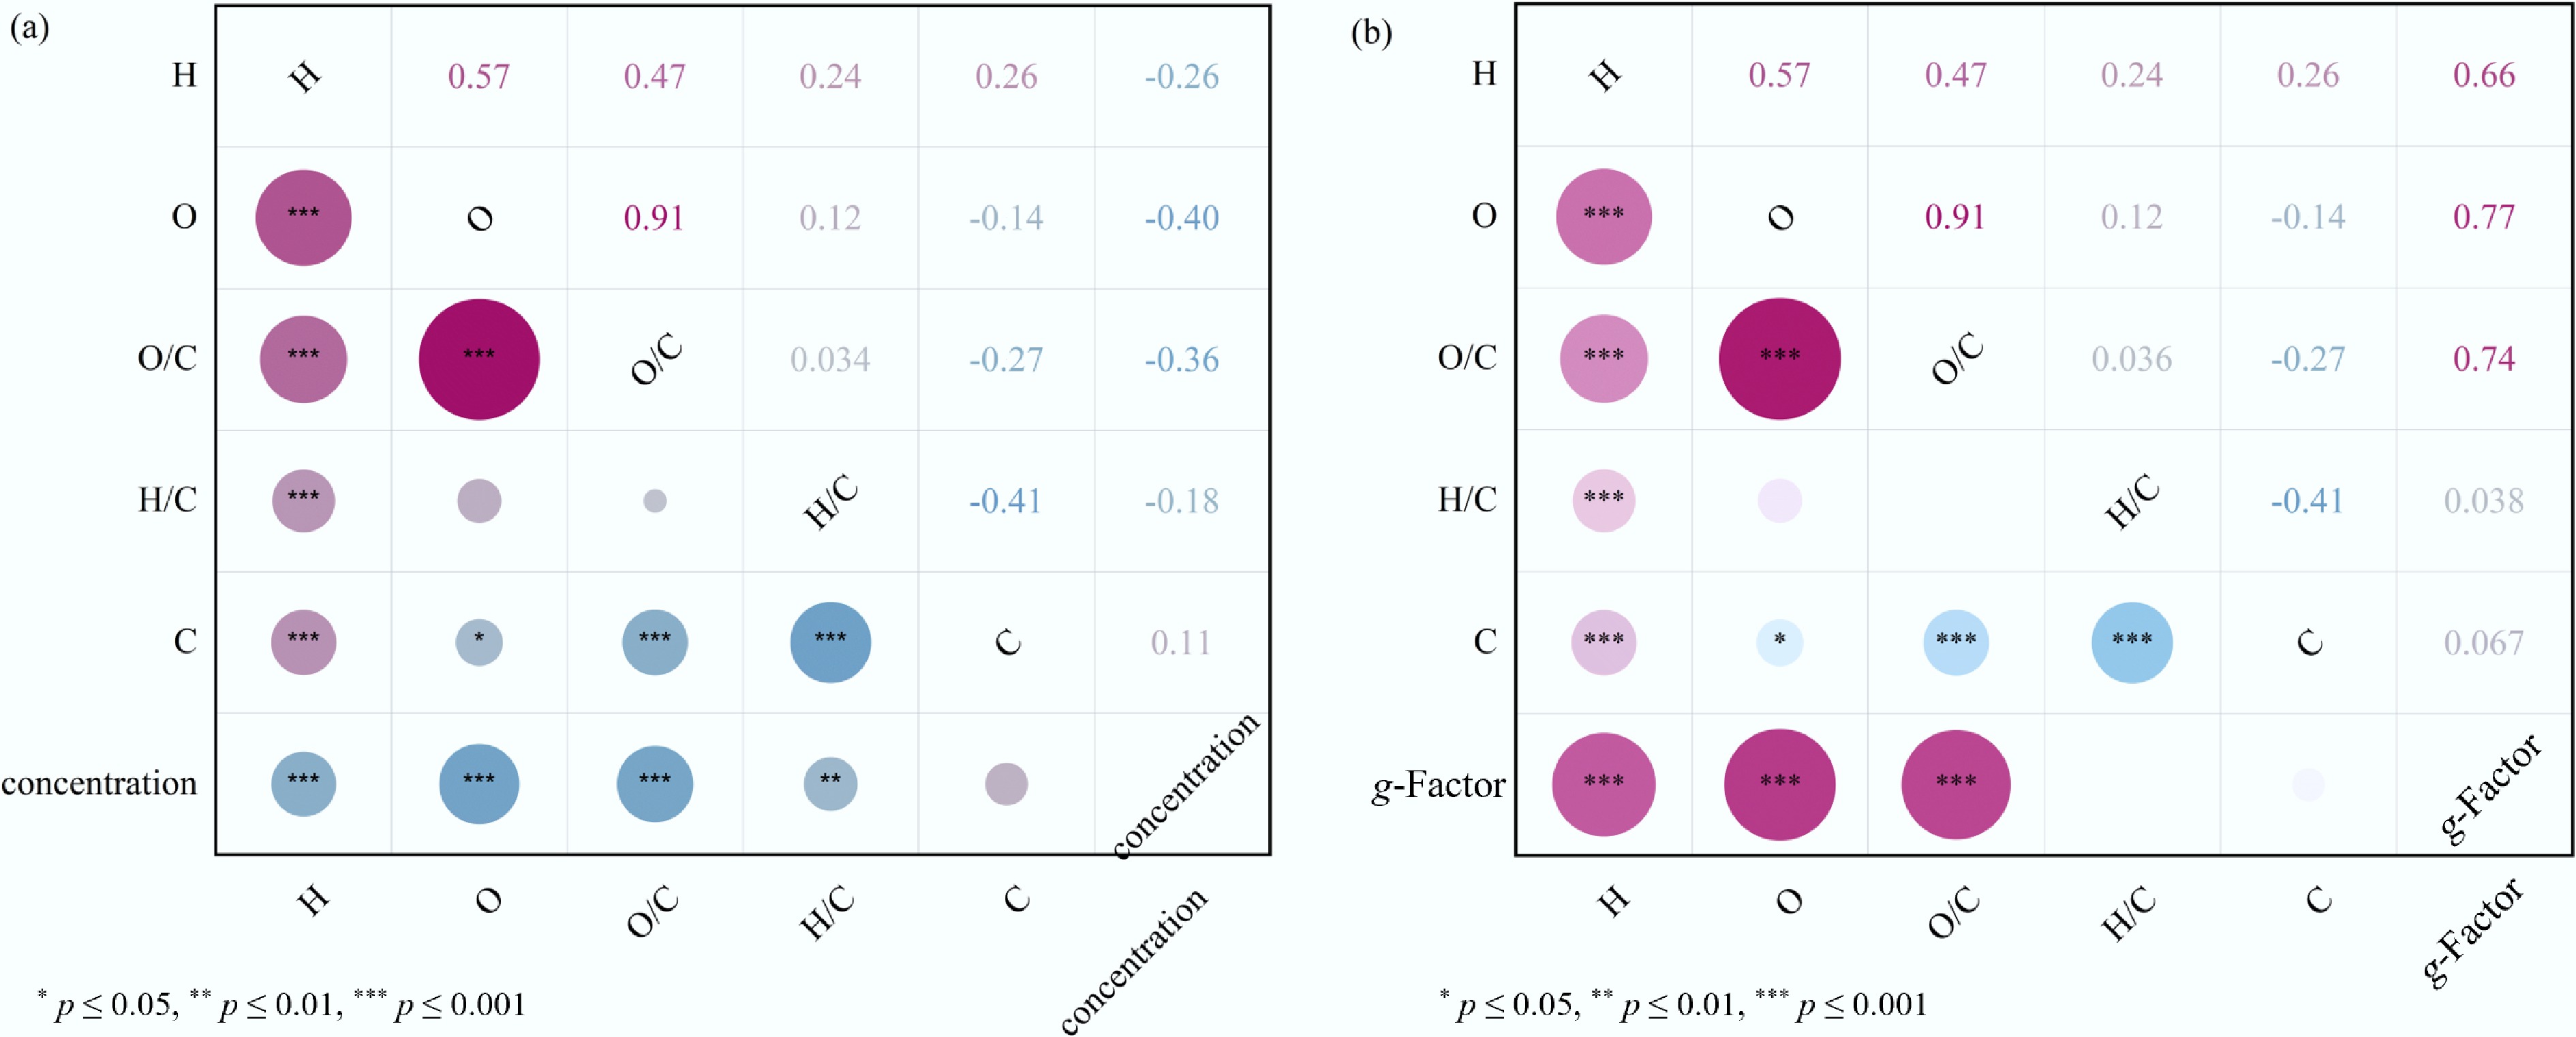
Figure 1.
Pairwise Pearson correlation matrix of all variables—H, O, O/C, H/C, and C: (a) Pearson correlation matrix between PFRs concentration and the variables. (b) Pearson correlation matrix between PFRs g-Factor value and the variables.
Model evaluation
-
Five molecular descriptor variables—H, O, O/C, H/C, and C—were selected as input features, while PFRs concentration and g-Factor values were used as the corresponding response variables. For each dataset, all samples were randomly divided into training and test subsets at a ratio of 80:20 after shuffling. A fixed random seed of 42 was used to ensure the reproducibility of the modeling results. Six ML algorithms, namely, XGBoost, Gradient Boosting, SVR, Shallow NN, RF, and ensemble learning, were employed to establish predictive models. The ensemble model was constructed by averaging the predicted outputs of XGBoost, gradient boosting, SVR, and RF. The predictive performance of each model was quantitatively evaluated using the R2 and MSE for both the training and test sets (Supplementary Table S2).
For PFRs concentration prediction, the regression plots in Fig. 2 show that the predicted values of most models are distributed close to the ideal y = x line, indicating that the selected elemental composition could effectively characterize the variation trend of PFRs concentration. XGBoost and gradient boosting exhibited strong fitting capability on the training set, with Train R2 values of 0.9916 and 0.9919, respectively. However, their Test R2 values decreased to 0.7193 and 0.7328, respectively, suggesting that these two boosting models tended to overfit the training data. By comparison, SVR and shallow NN achieved more balanced performance between the training and test sets, with Test R2 values of 0.7786 and 0.7797, respectively, indicating relatively favorable generalization capability. The RF model yielded a Train R2 of 0.9186 and Test R2 of 0.7553, reflecting stable but moderate predictive performance. The ensemble model achieved a Train R2 of 0.9683 and Test R2 of 0.7768, suggesting that model averaging improved the fitting capacity while maintaining reasonable predictive robustness on unseen samples. Overall, SVR, shallow NN, and ensemble learning exhibited comparatively better generalization performance for PFRs concentration prediction.
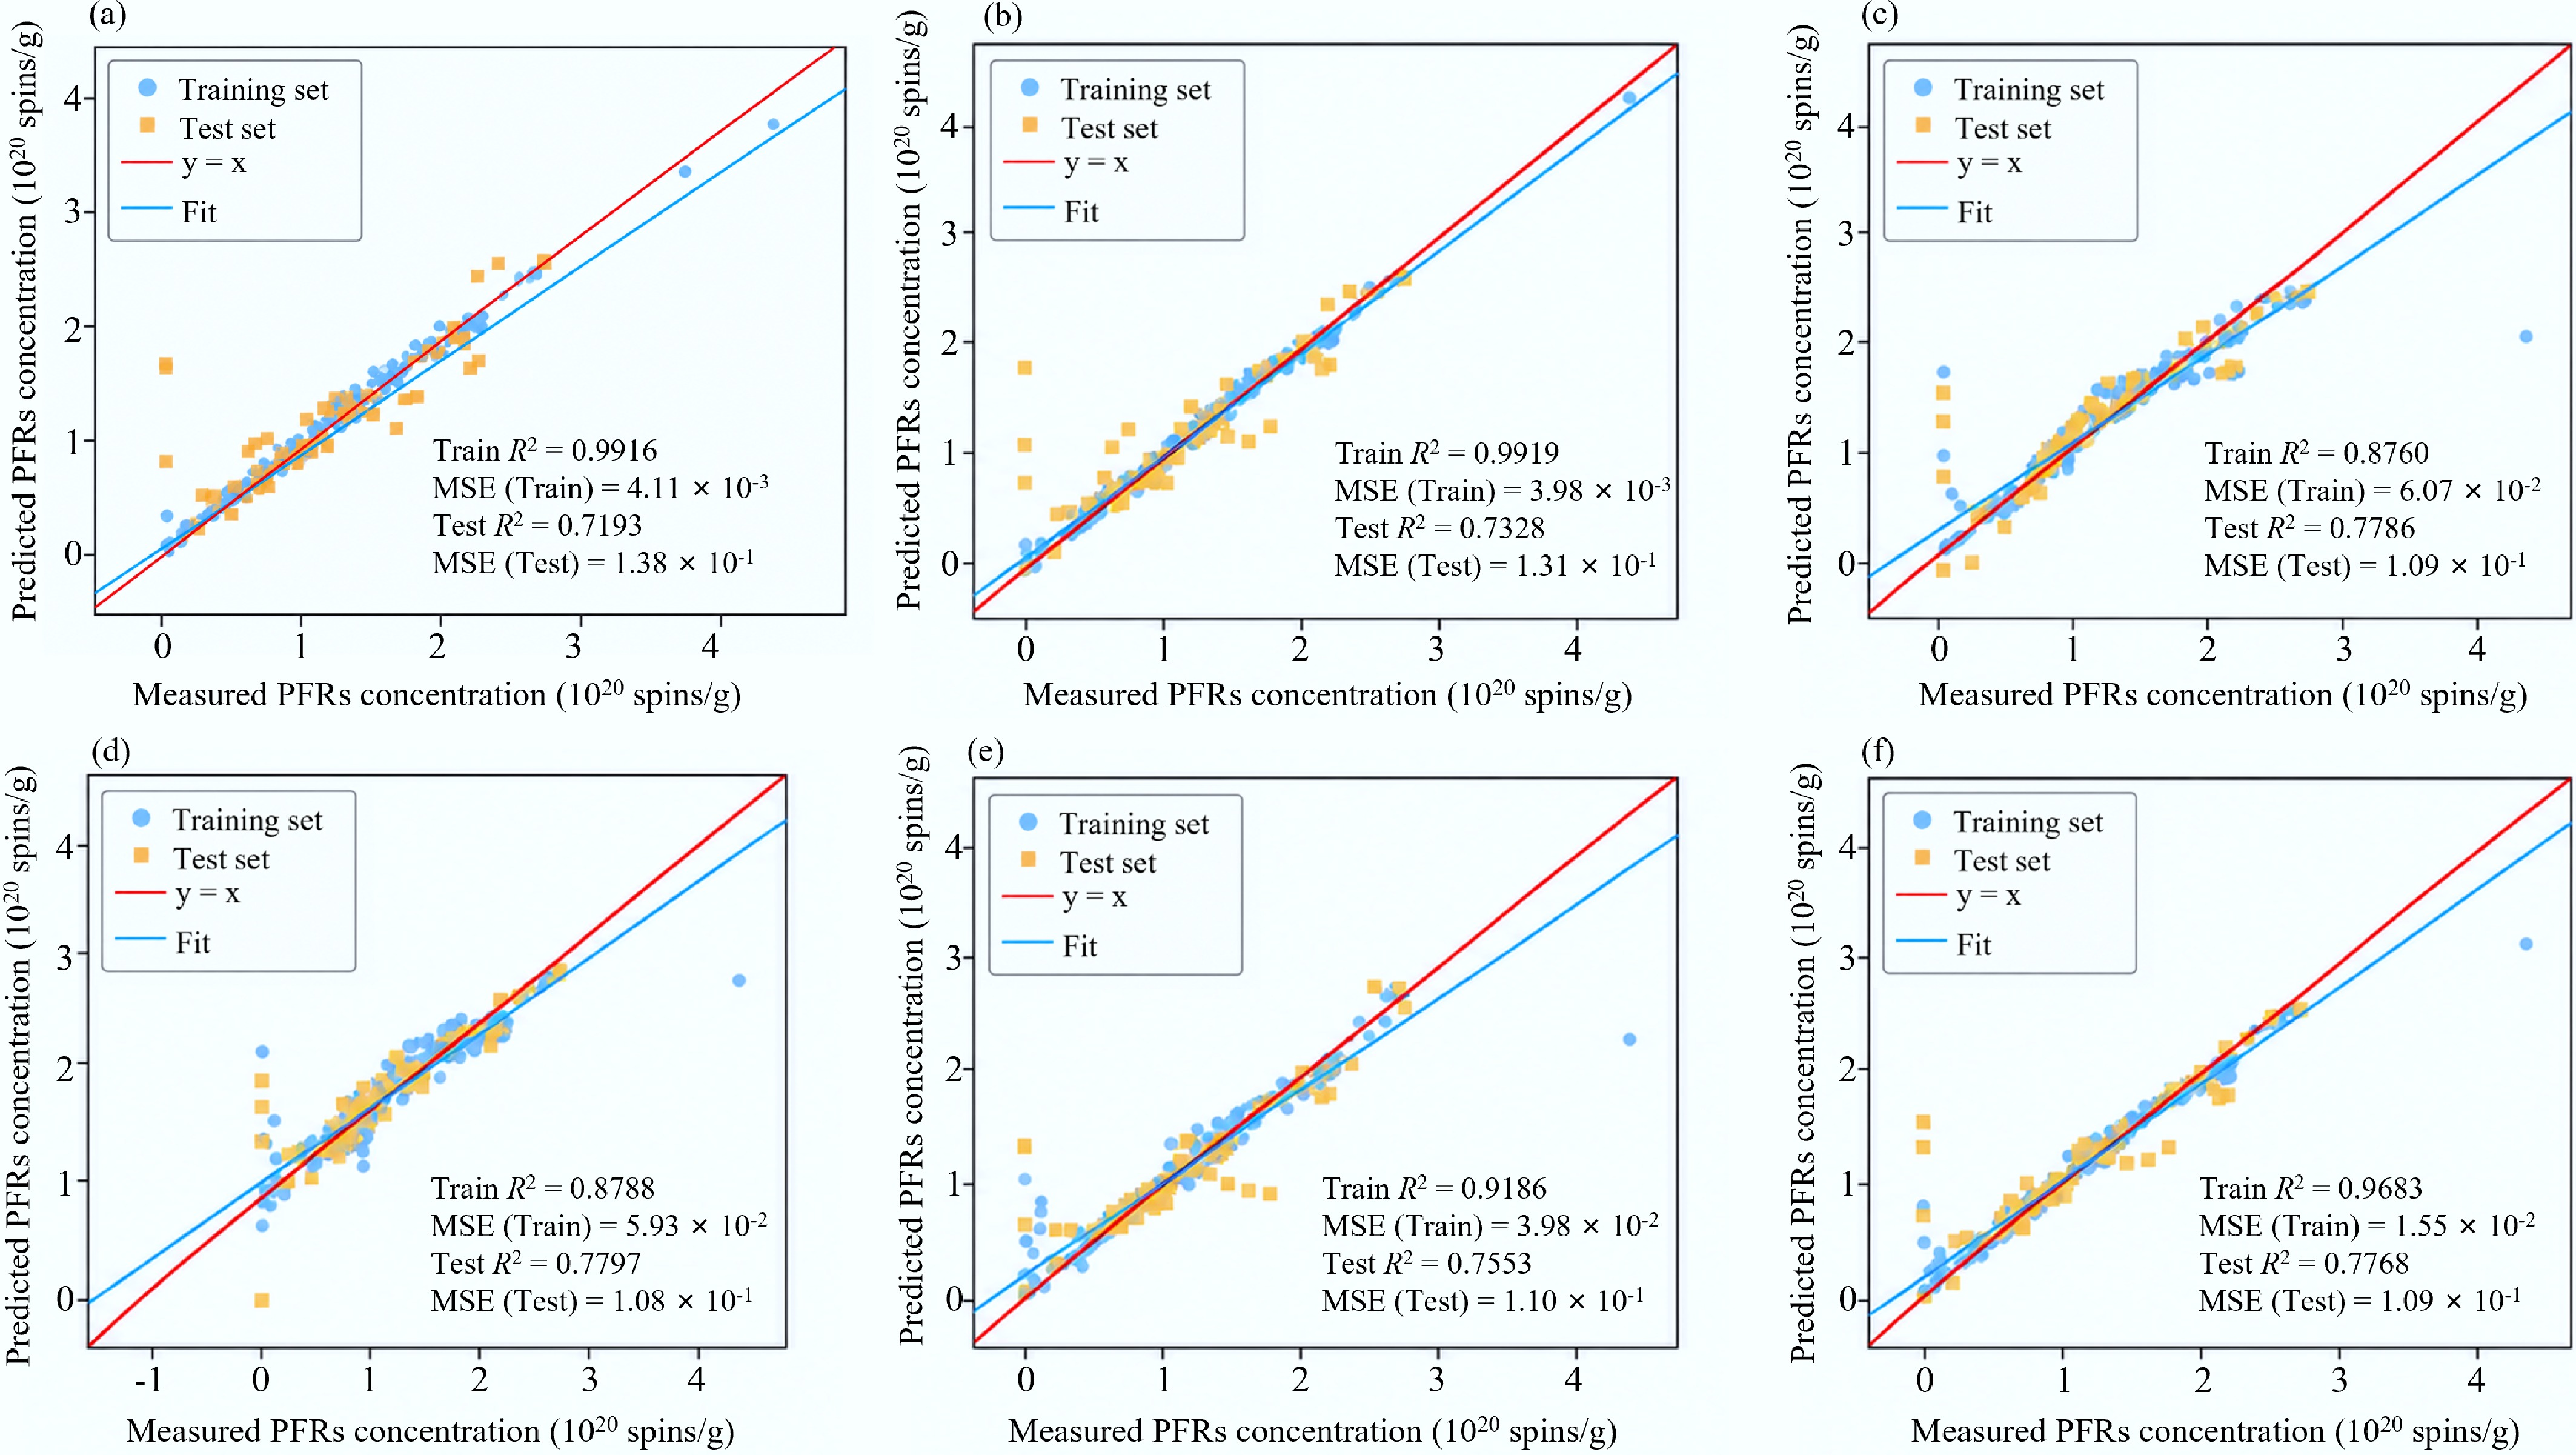
Figure 2.
Regression performance of different machine-learning models for PFRs concentration prediction. (a) XGBoost. (b) Gradient boosting. (c) SVR. (d) Shallow NN. (e) Random forest. (f) Ensemble.
Supplementary Figure S2 shows the ROC analysis, which further demonstrates the discriminative ability of the models for high-concentration PFRs samples. The threshold used for PFRs concentration was 1.1115 × 10²⁰ (Supplementary Fig. S2). All ROC curves were located well above the diagonal reference line, with the AUC values ranging from 0.9600 to 0.9886. Among the six models, SVR achieved the highest AUC value of 0.9886, followed by the shallow NN and ensemble learning, with the AUC values of 0.9771 and 0.9714, respectively. These results indicate that, although several models show moderate regression performance on the test set, they retained excellent capability for distinguishing high-concentration samples from low-concentration samples.
Figure 3 shows that, for the g-Factor prediction, the regression performance is generally lower than that for PFRs concentration. This result can be attributed to the much narrower numerical range of the g-Factor values, which increases the sensitivity of R2 to small absolute prediction errors. XGBoost and gradient boosting achieved high Train R2 values of 0.9949 and 0.9971, respectively, whereas their Test R2 values were only 0.6351 and 0.6599, respectively. This discrepancy indicated apparent overfitting and reduced generalization ability. SVR showed a Train R2 of 0.9325 and Test R2 of 0.5767, suggesting limited predictive robustness for the g-Factor dataset. By contrast, shallow NN achieved the highest Test R2 value of 0.7647, indicating that the nonlinear mapping ability of the shallow NN is more suitable for capturing the subtle variations in the g-Factor values. RF and ensemble learning had Test R2 values of 0.6880 and 0.6573, respectively, showing acceptable but not superior generalization performance. Therefore, compared with PFRs concentration, the accurate regression prediction of the g-Factor values remains more challenging.
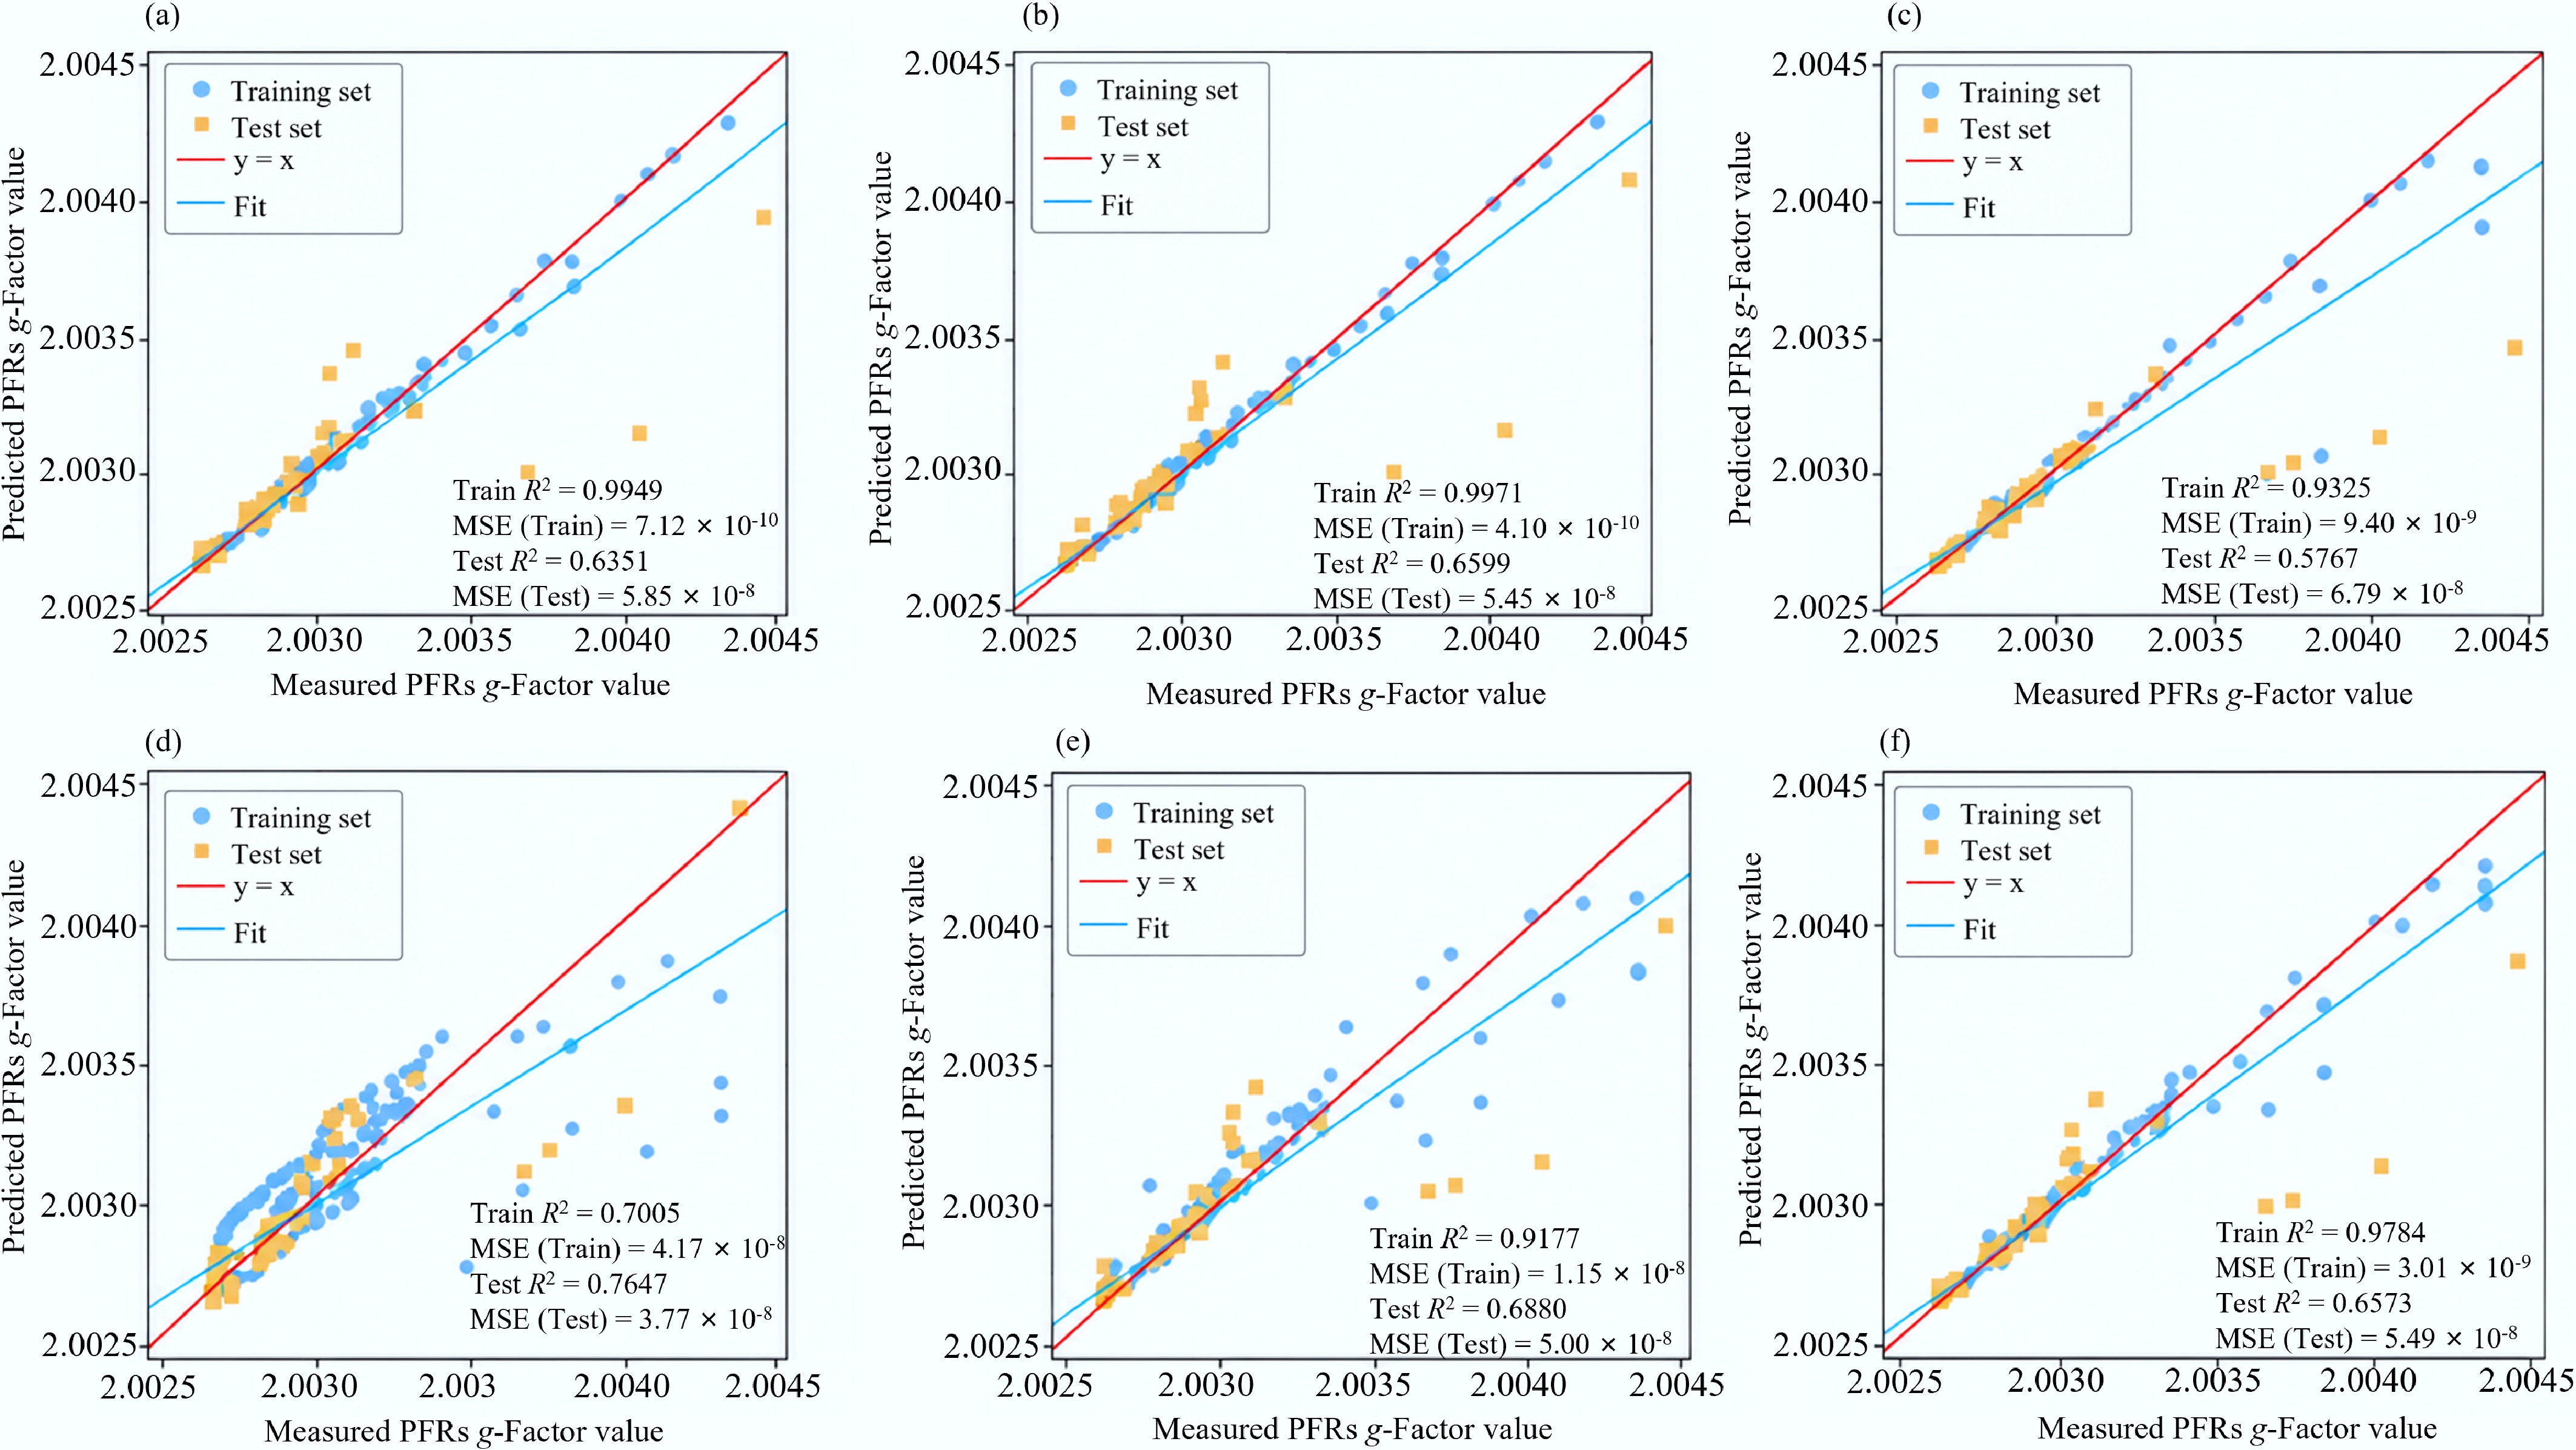
Figure 3.
Regression performance of different machine-learning models for g-Factor value prediction. (a) XGBoost. (b) Gradient boosting. (c) SVR. (d) Shallow NN. (e) Random forest. (f) Ensemble.
Despite the relatively limited regression accuracy of the g-Factor values, the ROC curves reveal excellent classification discrimination. The threshold used for the PFRs g-Factor value was 2.002655 (Supplementary Fig. S3). The AUC values of all models were higher than 0.9780, and the ensemble model had an AUC of 1.0000. XGBoost and RF also exhibited very high AUC values of 0.9971 and 0.9956, respectively. These findings suggest that the models could effectively differentiate high-g-Factor samples from low-g-Factor samples, even though precise continuous-value prediction was constrained by the narrow distribution range of the target variable. Overall, the regression and ROC analyses demonstrate that the selected ML models are capable of predicting PFRs concentration and g-Factor values. The models showed stronger regression robustness for PFRs concentration and greater high-/low-value discrimination ability for g-Factor values.
Feature importance analysis
-
SHAP analysis was used to analyze the feature importance of the elemental composition for the concentration of PFRs in biochar. Figure 4 shows that the average SHAP importance of different features to the model output follows the following order: H/C (0.3684) > O (0.1546) > H (0.0666) > O/C (0.0558) > C (0.0406) for PFRs concentration. The average SHAP value of the H/C feature is the largest, indicating that it has the most significant effect on the prediction of the PFRs concentration. Previous investigations have shown that the H/C atomic ratio can serve as a quantitative index for the degree of aromatization in biochar[36].
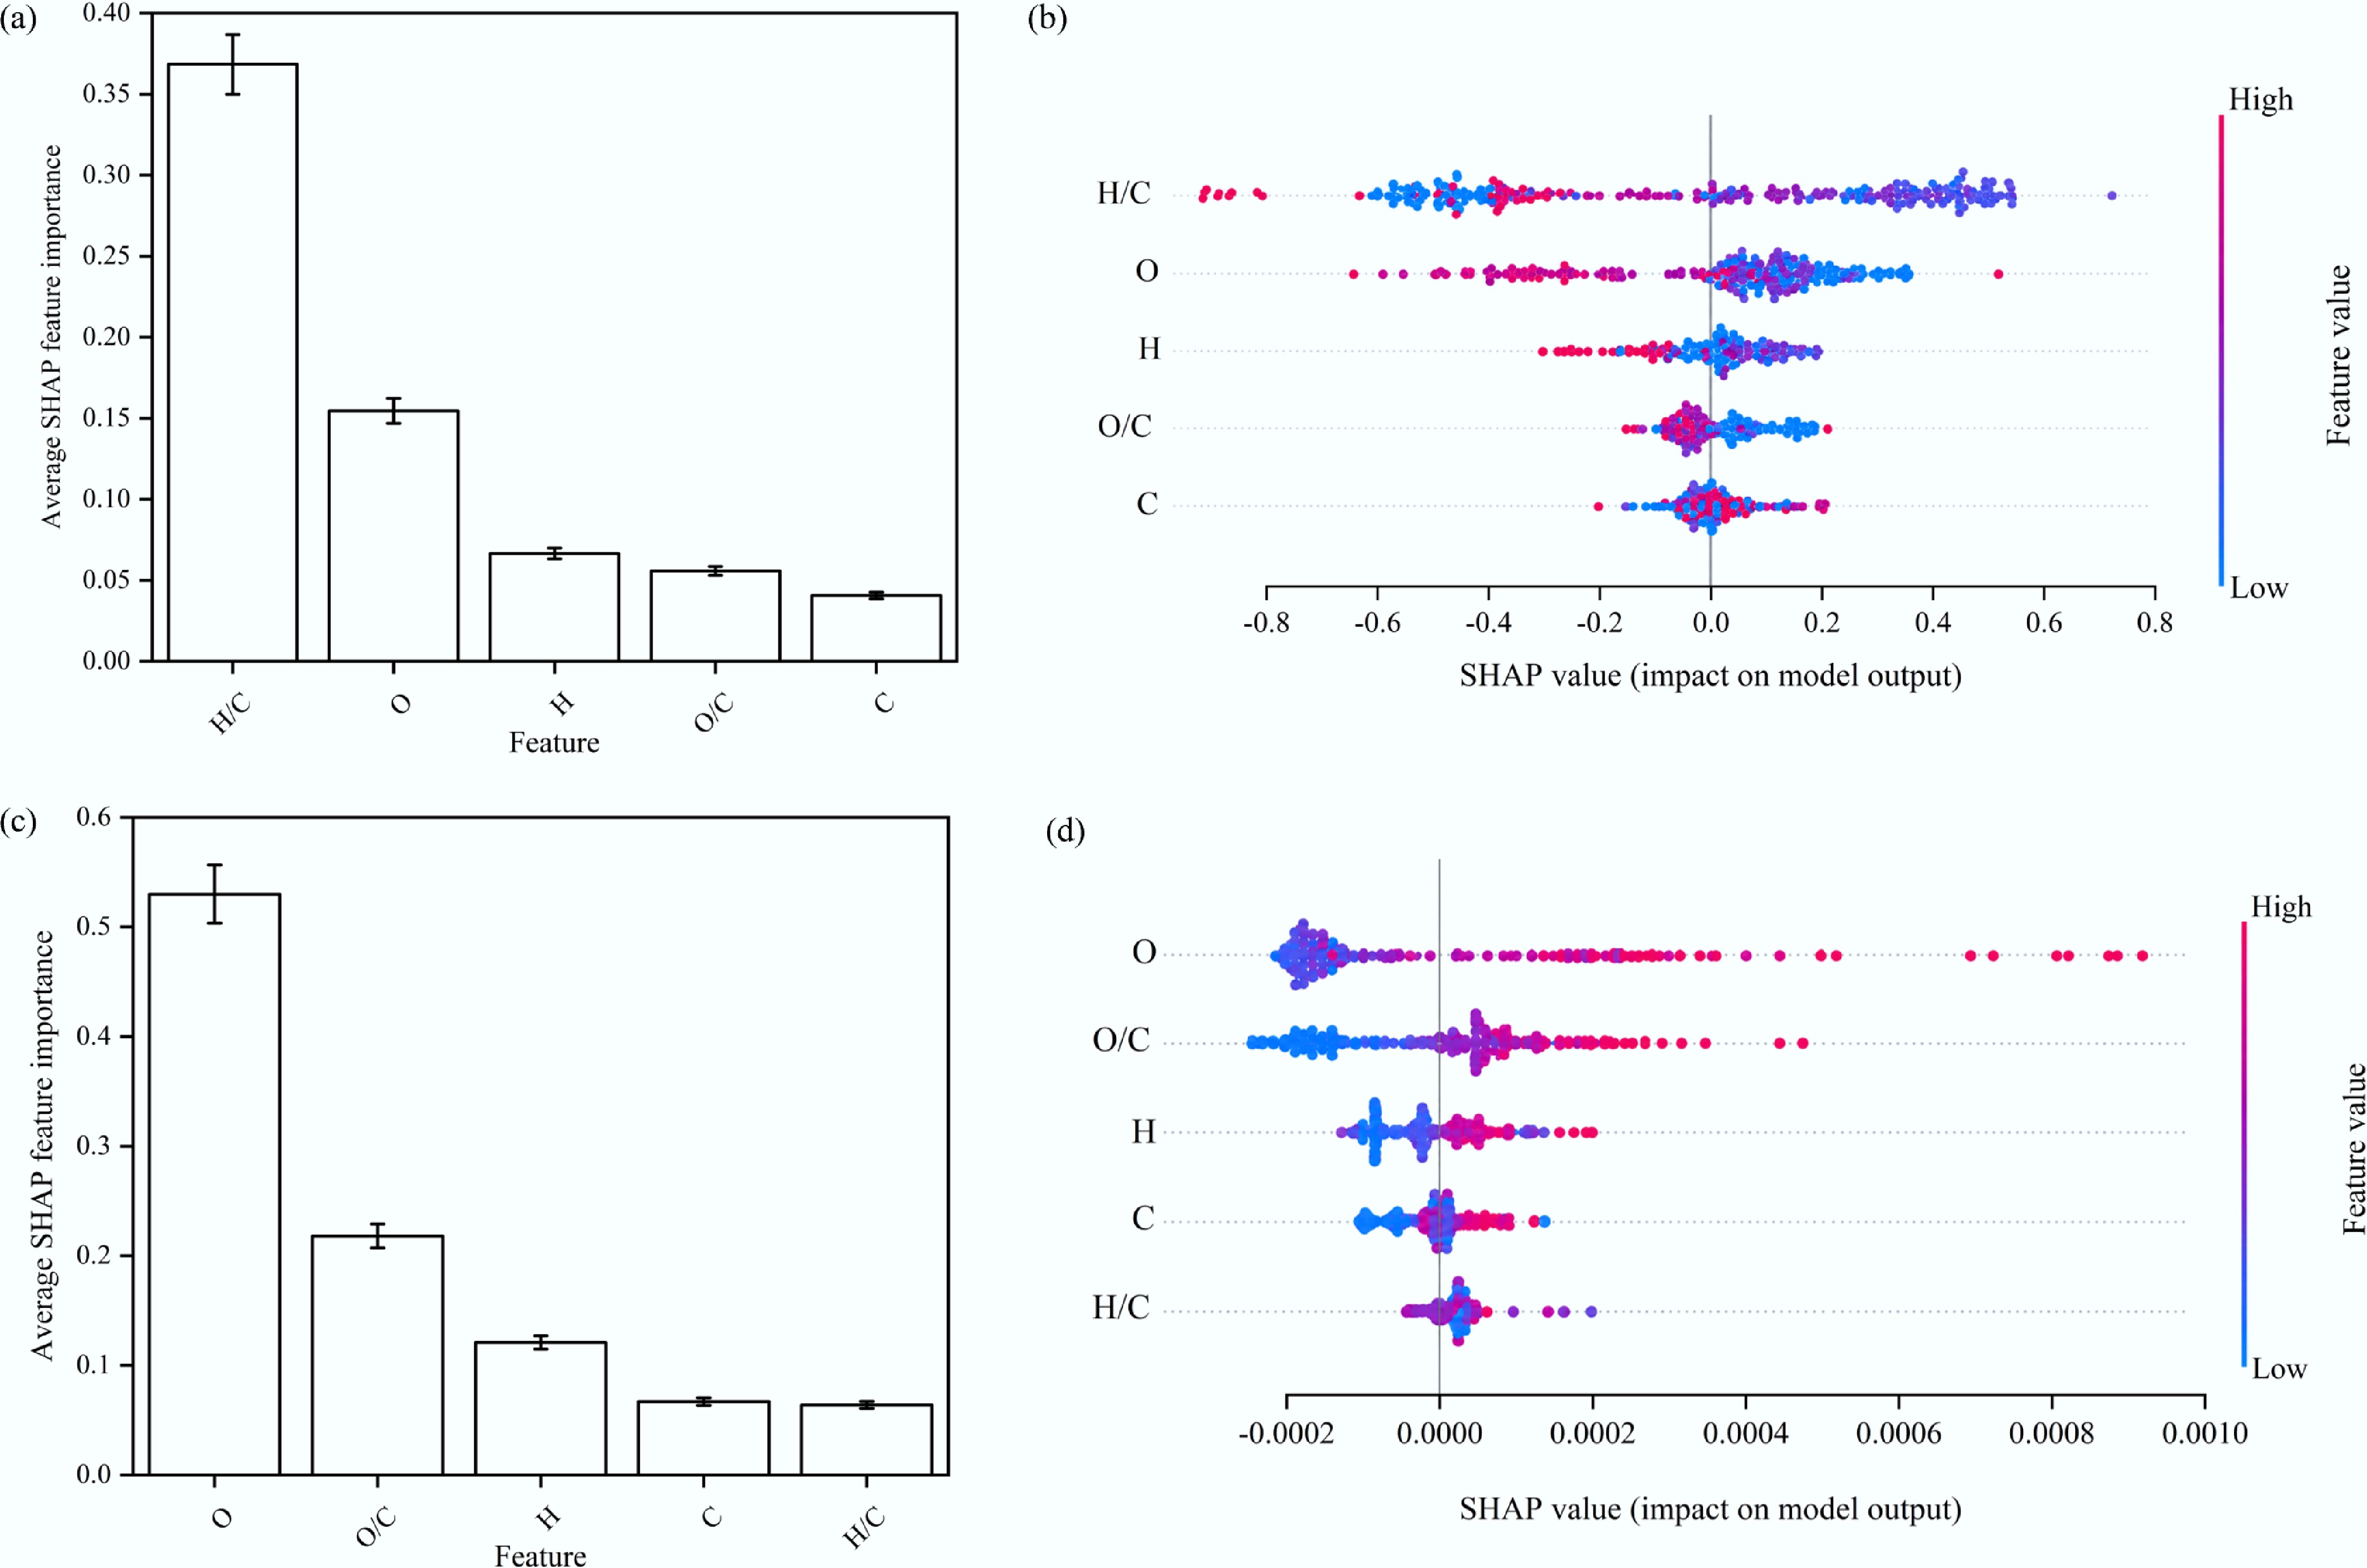
Figure 4.
Relative contribution of each feature based on SHAP feature-importance analysis and beeswarm plots: (a), (b) of PFRs concentration (the top row), and (c), (d) of PFRs g-Factor value (the bottom row). Error bars represent ± 5% of the corresponding mean absolute SHAP values.
In this elemental composition-based model, H/C was considered an elemental-ratio descriptor potentially associated with hydrogen deficiency and carbon condensation during pyrolysis, rather than a direct structural measurement of aromaticity. Figure 4b shows that in the SHAP beeswarm plot, H/C exhibits a wider horizontal distribution than the other descriptors, further supporting its strong influence. Lower H/C values are associated with higher PFRs concentration, likely because aromatic-ring formation provides a stable environment for radicals. C showed the lowest average SHAP value, indicating a weak contribution. This may be attributed to the high and relatively stable C content of biochar and its limited variation range. PFRs formation is more closely related to the chemical form of carbon, such as aromatic structures, than to the total C content[37]. In addition, O, H, and O/C showed negative effects on the predicted PFRs concentration. O/C reflects the abundance of oxygen-containing functional groups in biochar and is an indicator of oxygen content[38,39]. Therefore, decreases in O/C, O, and H may reflect functional-group rearrangement and carbon-structure condensation during pyrolysis, which promote PFRs accumulation.
Figure 4c shows that for the PFRs g-Factor, SHAP analysis revealed that the average feature importance ranked as follows: O (0.530) > O/C (0.218) > H (0.121) > C (0.067) > H/C (0.064) (Fig. 4c). O exhibited the highest importance score and exerted the dominant positive effect on the predicted g-Factor. O/C also contributed substantially; higher O/C values increase the predicted g-Factor. These results indicate that oxygen-rich compositions favor higher g-Factor values and are associated with oxygen-centered radicals[40,41]. H and C had weaker effects, although increases in their values also slightly elevated the predicted g-Factor. This trend may be related to the cleavage of the hydrocarbon structure during pyrolysis, which generates small radicals that can enter the macromolecular carbon skeleton and increase the g-Factor[40]. Overall, the feature-importance pattern for g-Factor reflects the transformation of radical types during biomass pyrolysis.
PDP analysis
-
After confirming the relative importance of individual input variables, PDP analysis was carried out to clarify the dependence of model outputs on key features. A PDP describes the overall effects of selected descriptors on the PFRs concentration or g-Factor. The univariate PDP results are shown in Fig. 5. The tick marks on the x-axis represent the fractiles of each feature and indicate data density. Regions with sparse data provide less reliable trends and were excluded from mechanistic interpretation. For example, in Fig. 5a, the trendline remains nearly unchanged when H/C > 0.7 because of the small number of data points within this range; therefore, the PDP here was not analyzed. Additionally, the intervals of O > 18 wt.% (Fig. 5b), O/C > 0.25 (Fig. 5c) and O > 17.5 wt.% (Fig. 5d) were not included in the analysis because of the sparse data points, which did not have reliable mechanistic interpretability.
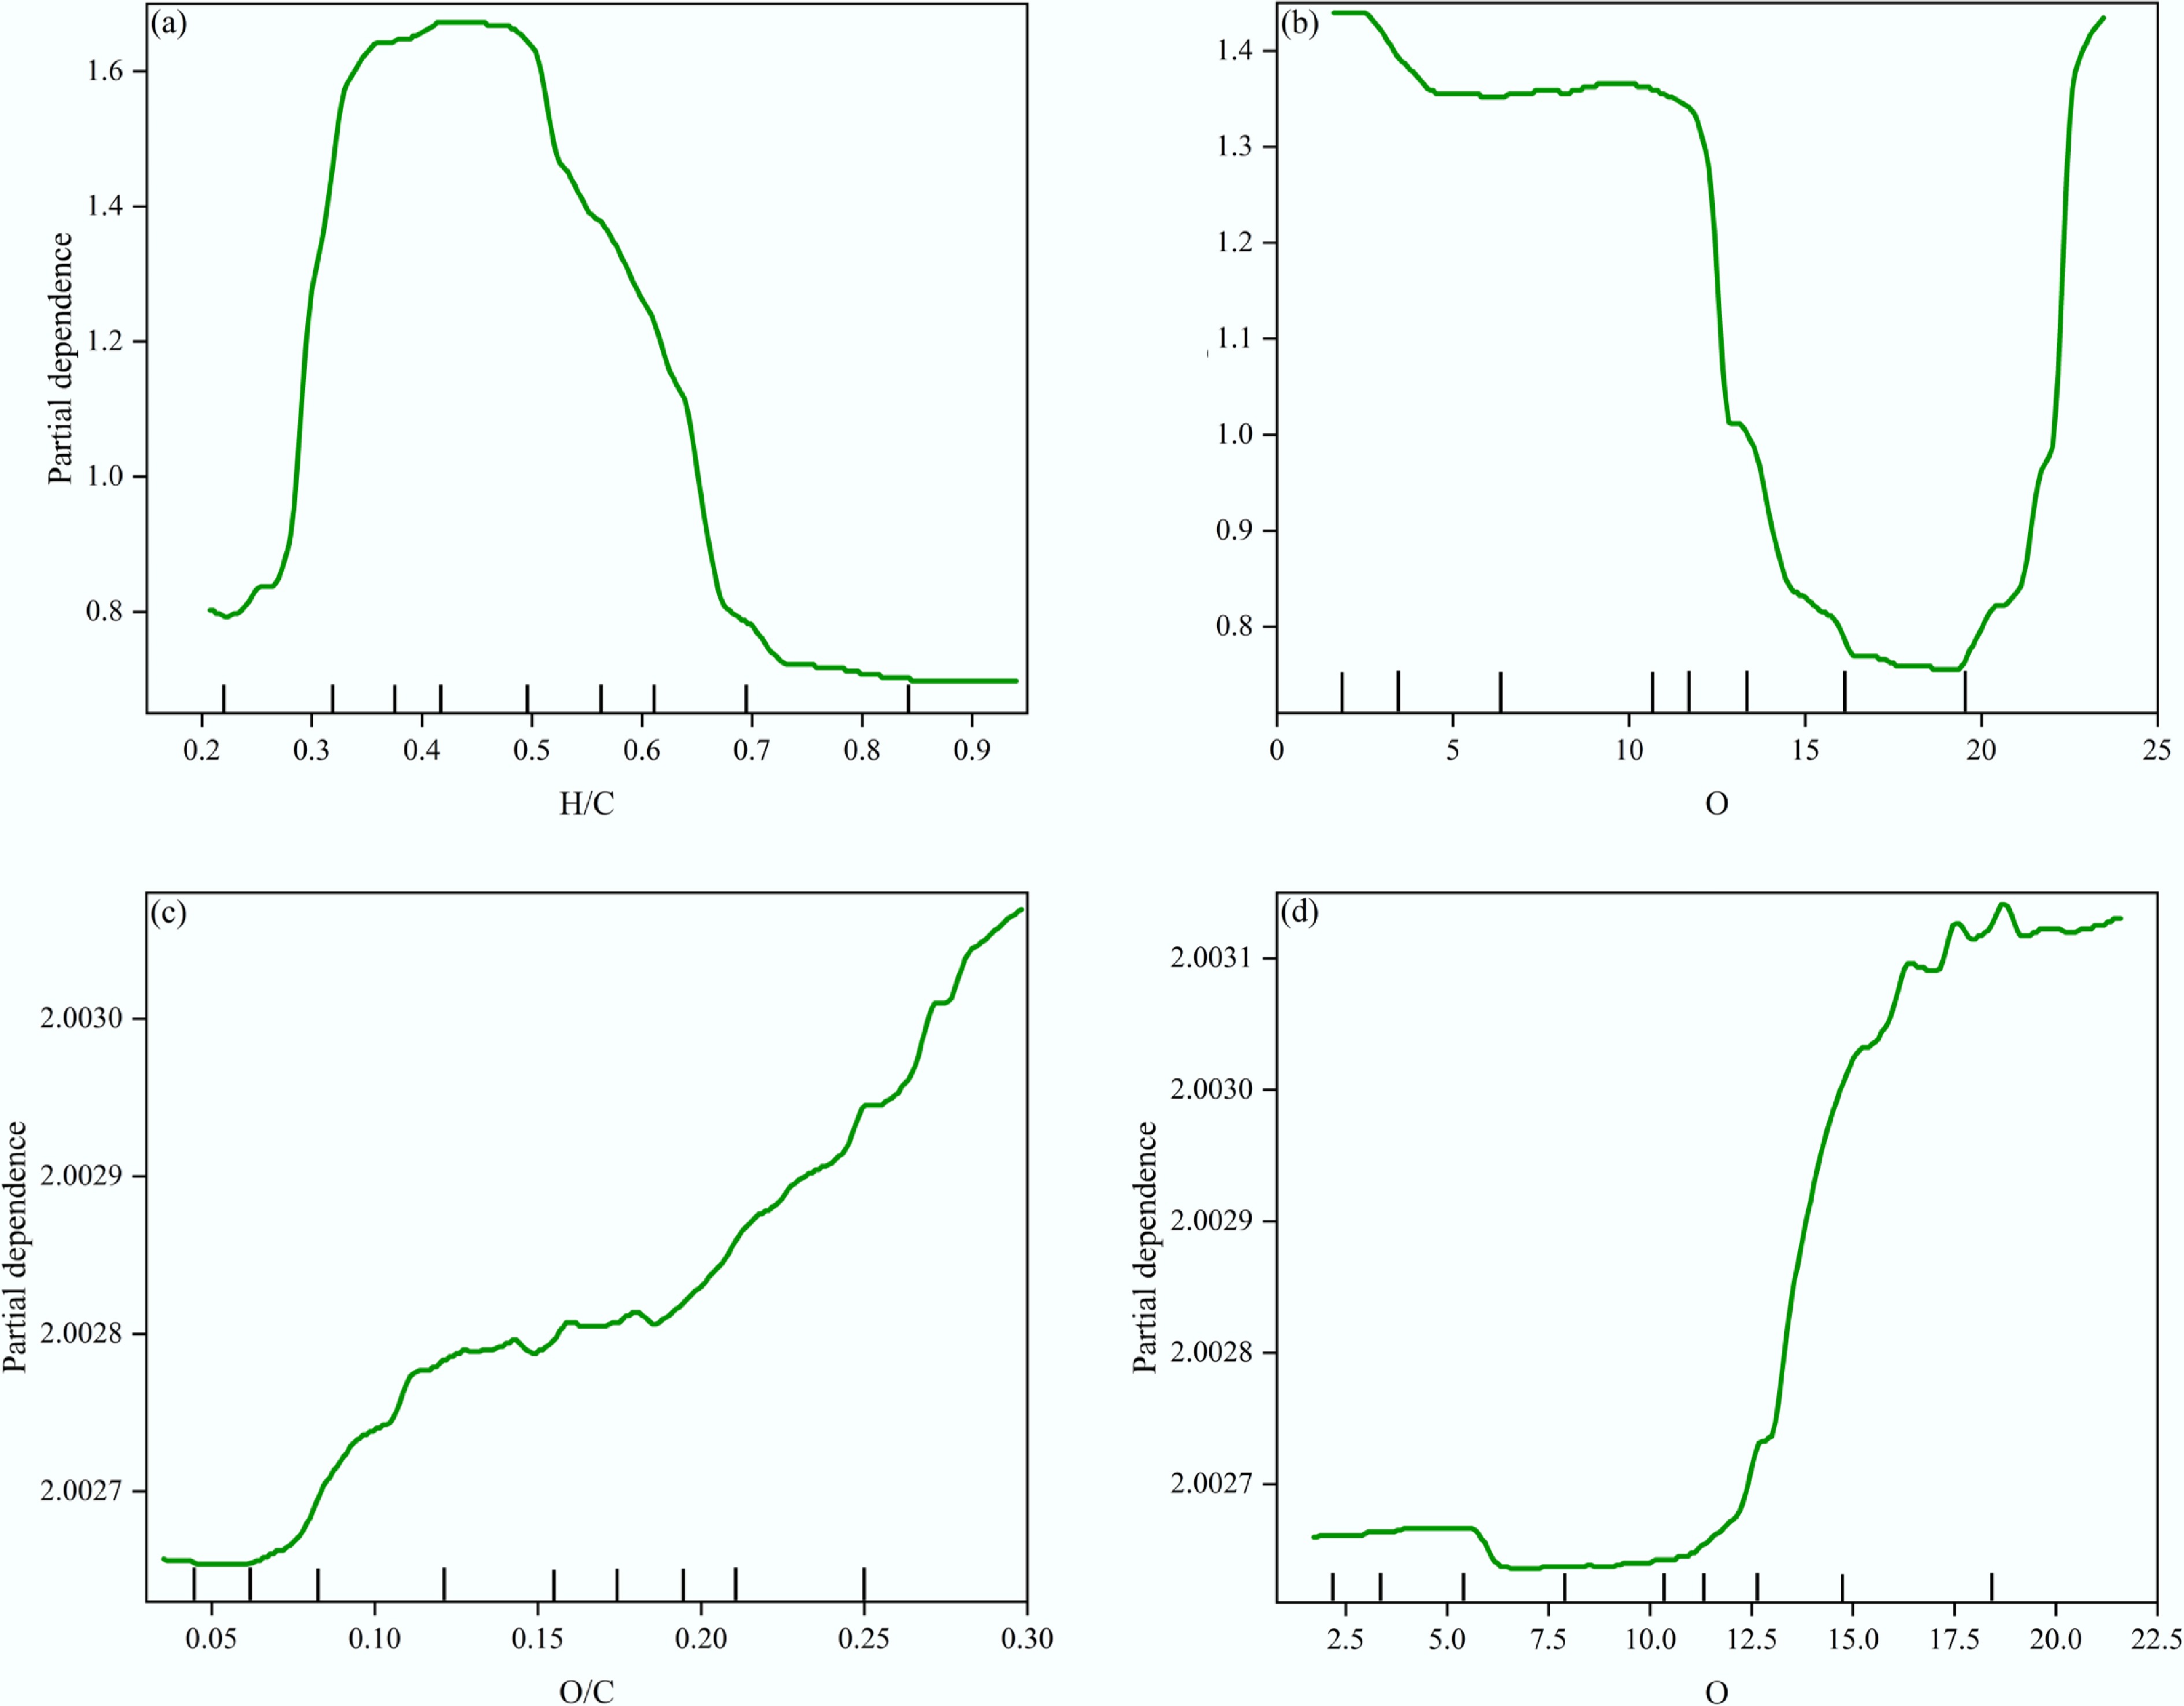
Figure 5.
The univariate PDP analysis on important features: (a), (b) of PFRs concentration (the top row), and (c), (d) of PFRs g-Factor (the bottom row). The tick marks on the x-axis represent the fractiles of target feature values and reflect the data density.
Based on the feature-importance results, the two most important features for each response variable were selected for univariate PDP analysis. Figure 5a, b shows the effects of H/C and O on PFRs concentration. H/C values are mainly concentrated between 0.3 and 0.7 and show a negative effect, consistent with the SHAP results. Thus, a higher degree of aromatization, reflected by lower H/C, is associated with a higher PFRs concentration[36]. O values are mainly concentrated between 10 and 15 wt.% and also show a negative effect, consistent with the feature-importance analysis. Figure 5c, d shows the effects of O/C and O on PFRs g-Factor. In Fig. 5c, partial dependence generally increases with O/C, indicating a positive effect of O/C on the g-Factor in the ML model. The increase is slower at low O/C and faster at higher O/C. This trend is consistent with the decrease in the g-Factor and shift from oxygen-centered to carbon-centered radicals as oxygen-related descriptors decline; a previous work also reported lower g-Factor values with decreasing H/C and O/C[16]. In Fig. 5d, partial dependence remains nearly stable at low O values and then sharply increases when O reaches approximately 10–12.5 wt.%. This result indicates that low O content has limited influence on the g-Factor, whereas higher O content strongly promotes g-Factor increases and the transition toward oxygen-centered radicals[41]. Overall, H/C and O show negative effects on PFRs concentration, whereas O and O/C show positive effects on the PFRs g-Factor within the reliable data ranges. However, univariate PDP analysis cannot fully resolve feature synergy. Therefore, multivariate PDP analysis is required.
Two-feature PDP analysis was further used to evaluate the synergistic effects on PFRs concentration and g-Factor. The top three descriptors identified by feature-importance analysis were selected; the representative results are shown in Fig. 6. High PFRs concentrations mainly occur when O is approximately 10–30 wt.%, H is approximately 2.0–4.0 wt.%, and H/C is approximately 0.6–0.9 (Fig. 6a–c). The response tends to decrease when O, H, or H/C is below or above these favorable ranges, indicating that either insufficient or excessive elemental contents are unfavorable for PFRs accumulation. Moderate O content may provide suitable oxygen-containing sites for radical formation and stabilization, whereas excessive O may promote radical quenching or over-oxidation[42]. Similarly, moderate H/C may maintain an appropriate C–H structure for stabilizing PFRs, whereas a low or too high H/C weakens radical accumulation. For the PFRs g-Factor, the partial dependence on H is small, whereas the partial dependences on O/C and O are stronger. Increasing O/C and O markedly increases the partial dependence of the PFRs g-Factor (Fig. 6d, e), indicating that O and O/C increase the g-Factor and promote the transformation from carbon-centered to oxygen-centered radicals[38,39]. Although the dependence of the g-Factor on H is weaker, higher H content increases the g-Factor when O/C and O are comparable. This result suggests that higher H reduces the relative contribution of carbon-centered radicals, possibly because small radicals generated during pyrolysis enter the macromolecular carbon skeleton and increase the g-Factor[40]. The conditional PDP and SHAP interaction analyses were further conducted to evaluate the H–O/C effect on the g-Factor (Supplementary Fig. S4). The conditional PDPs show that the predicted g-Factor generally increases with H within low-, medium-, and high-O/C strata, indicating that H has a positive contribution under comparable O/C conditions. However, the magnitude of this increase varies among O/C strata, with the strongest response observed in the medium-O/C range. Consistently, the SHAP dependence analysis shows that higher H content generally contributes positively to the predicted g-Factor (Supplementary Fig. S5), while the SHAP interaction map reveals that the H × O/C interaction is non-negligible but spatially heterogeneous. These results are consistent with previous findings[16]. Figure 6f further shows that the PFRs g-Factor has the greatest partial dependence under high O and high O/C conditions, indicating that biochars with higher O and O/C contain more oxygen-centered radicals. Overall, two-feature PDP analysis clarifies the elemental synergy mechanisms governing PFRs concentration and g-Factor.
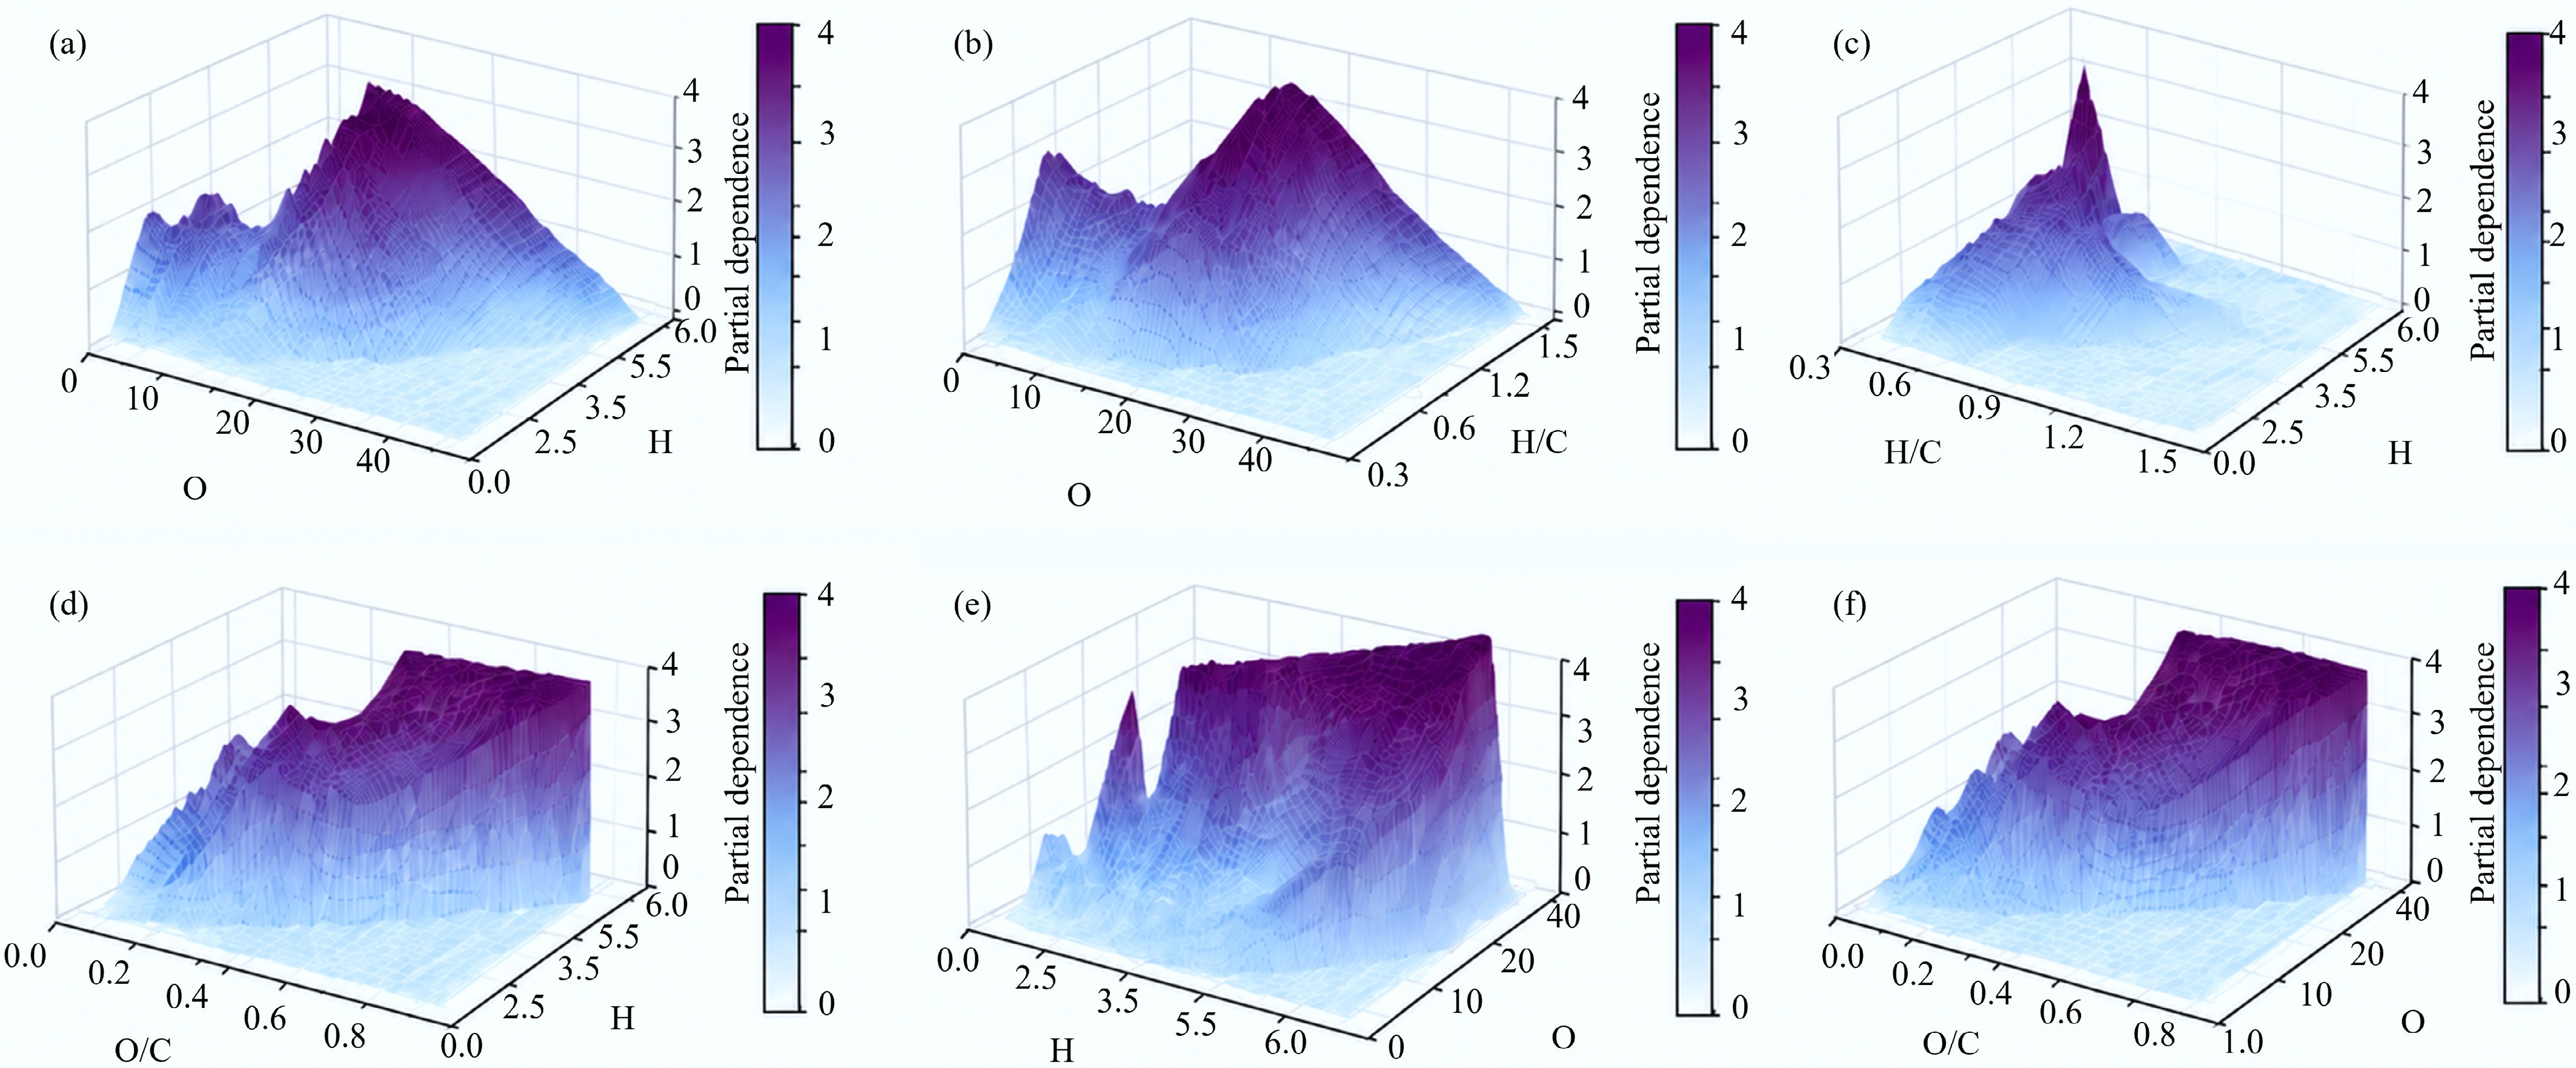
Figure 6.
PDP analysis with two features: (a)–(c) of PFRs concentration (the top row), (d)–(f) of PFRs g-Factor (the bottom row).
These results elucidate how elemental composition regulates PFRs formation. They also provide a theoretical basis for controlling PFRs-related risks. Correlations between elemental composition and PFRs concentration can guide the targeted regulation of elemental composition to mitigate environmental risks. PDP analysis also provides an engineering reference for regulating PFRs with different atomic centers and interpreting the evolution of elemental composition during biochar formation.
Experimental verification
-
To further validate the ML results, biochars derived from cellulose, lignin, peanut hull, rice straw, and pine sawdust were used to examine the relationships between elemental composition and PFRs properties in an independent experimental dataset. As shown in Supplementary Figs S6 and S7, C, H, O, H/C, and O/C are linearly fitted with PFRs concentration and the g-Factor. This is consistent with the results of SHAP analysis. When the pyrolysis temperature is more than 600 °C, the condensation and graphitization degree of the aromatic ring structure (lower H/C value around 0.0015) may induce the disappearance of PFRs in biochar (Supplementary Fig. S8). The g-Factor increases with increasing O and O/C, indicating that high O content generates more oxygen-centered free radicals. During pyrolysis, the thermal loss of O induces a decrease in O/C, resulting in the gradual transformation of the free-radical type from oxygen-centered to carbon-centered. Therefore, O and O/C are important features of the g-Factor. To further elaborate the relationship between the g-Factor and elements, a 3D scatter diagram was plotted (Supplementary Fig. S9), with O/C, H, and g-Factor as the x, y, and z axes, respectively. When the O/C values are similar, a higher H content can result in a greater g-Factor value, which is consistent with the outcomes of the PDP analysis and SHAP interaction heatmap.
To further verify the conclusions obtained from the ML interpretation, the Spearman rank correlation analysis was performed using the independently prepared experimental biochar dataset (Supplementary Fig. S10). For PFRs concentration, the absolute Spearman correlation coefficients followed the order H/C (ρ = −0.961) > O (ρ = −0.955) > H (ρ = −0.817) > O/C (ρ = −0.809) > C (ρ = 0.679), with all correlations being statistically significant. This ranking is consistent with the SHAP analysis and RF feature-importance results, confirming that H/C and O are the dominant experimental descriptors associated with PFRs concentration.
For the g-Factor, O and O/C show the strongest positive correlations, with Spearman coefficients of 0.905 and 0.882, respectively, followed by H. This result supports the ML conclusion that oxygen-related descriptors are the key factors governing the g-Factor variations. The positive correlations of O and O/C with g-Factor indicate that biochars with a higher oxygen content tend to contain more oxygen-centered radicals, whereas the decrease in oxygen-containing structures during pyrolysis promotes the transformation toward carbon-centered radicals.
Overall, the Spearman correlation analysis based on independent experimental biochars supported the feature-importance ranking obtained from interpretable ML and provided experimental evidence for the dominant roles of H/C and O in PFRs concentration and O and O/C in g-Factor regulation.
-
Multiple ML algorithms were used to predict PFRs concentration and g-Factor from elemental composition. The comparisons among XGBoost, gradient boosting, SVR, Shallow NN, RF, and ensemble learning showed that elemental descriptors effectively characterized both responses. SHAP analysis identified H/C and O as the dominant descriptors of PFRs concentration, whereas O and O/C dominated g-Factor variation. PDP analysis further showed that lower H/C and O favored PFRs accumulation, probably through free-radical stabilization, aromatization, and carbon-structure evolution during pyrolysis. At comparable O/C values, higher H content increased the g-Factor, indicating a lower relative contribution of carbon-centered radicals. Higher O and O/C promoted oxygen-centered radical formation and increased the g-Factor. Independent experimental validation confirmed the following ML interpretations: the Spearman correlation analysis showed that H/C and O were most strongly associated with PFRs concentration, while O and O/C primarily regulated the g-Factor. These results reveal the elemental regulation mechanism of PFRs and provide a predictive basis for biochar risk assessment and structure optimization in environmental remediation applications.
Not applicable.
-
It accompanies this paper at: https://doi.org/10.48130/bchax-0026-0020.
-
During the preparation of this study, the authors did not use any AI tools for language refinement, data analysis, figure enhancement, or any other purpose. The authors take full responsibility for the integrity and originality of the final manuscript.
-
The authors confirm their contributions to this study as follows: Linjian Gao: investigation, writing – original draft, data analysis and programming. Chengcheng Xu: writing – review & editing. Zhongda Xu: data curation. Mengzi Li: writing – review & editing. Wenmei Tao: funding acquisition, writing – review & editing, supervision. All authors reviewed the results and approved the final version of the manuscript.
-
The datasets used or analyzed during the current study are available from the corresponding author upon reasonable request.
-
The authors declare that they have no known competing financial interests or personal relationships that could have appeared to influence the work reported in this paper.
-
Full list of author information is available at the end of the article.
- The supplementary files can be downloaded from here.
- Copyright: © 2026 by the author(s). Published by Maximum Academic Press, Fayetteville, GA. This article is an open access article distributed under Creative Commons Attribution License (CC BY 4.0), visit https://creativecommons.org/licenses/by/4.0/.
-
About this article
Cite this article
Gao L, Xu C, Li M, Xu Z, Tao W. 2026. Elemental composition-based prediction of persistent free radicals concentration and g-Factor in lignocellulose-derived biochar combining interpretable machine learning and experimental analysis. Biochar X 2: e022 doi: 10.48130/bchax-0026-0020 

Elemental composition-based prediction of persistent free radicals concentration and g-Factor in lignocellulose-derived biochar combining interpretable machine learning and experimental analysis
- Received: 20 May 2026
- Revised: 01 July 2026
- Accepted: 22 July 2026
- Published online: 17 August 2026
Abstract: Persistent free radicals (PFRs), related to the elemental composition, are important factors that determine the reactivity of lignocellulose-derived biochar. However, the mechanism by which the elemental composition influences the PFRs properties in biochar is unclear. A comprehensive review of existing literature investigation on the relationship between PFRs and the elemental composition is urgently needed to elucidate the formation mechanism of PFRs. By collecting data from published papers, six machine-learning algorithms, namely, XGBoost, gradient boosting, support vector regression, shallow neural network, random forest, and ensemble learning, were compared, and the feature effects were interpreted using SHAP, feature-importance, and partial dependence analyses. The models showed satisfactory predictive and discriminative performance, with the best test R2 values reaching 0.7797 for PFRs concentration and 0.7647 for g-Factor, while the ROC-AUC values were > 0.9600 and 0.9780, respectively. Interpretable analyses identified H/C and O content as the dominant descriptors for PFRs concentration, whereas O content and O/C governed g-Factor variation. Decreases in H/C and O were associated with increased PFRs concentration, while increases in O and O/C promoted higher g-Factor values, indicating a shift toward the generation of oxygen-centered radicals. Independent experimental biochars prepared from lignocellulosic feedstocks further supported these results. The Spearman correlation analysis showed that H/C and O had the strongest correlations with PFRs concentration, while O and O/C were most strongly correlated with g-Factor; notably, at similar O/C values, higher H content increased g-Factor. This study provides a new perspective to elucidate the formation mechanism of PFRs.
-
Key words:
- Biochar /
- Persistent free radicals /
- Machine learning /
- Elemental composition