













-
Stand density, commonly defined as the number of culms per unit area, is a key indicator of a stand's structure and growth potential. It characterizes a stand's spatial distribution and serves as a fundamental metric for sustainable forest management[1]. Appropriate stand density and spatial configuration can enhance land-use efficiency and the provision of ecosystem services, thereby supporting forest-resource management and regulation[2,3]. Monitoring stand density is essential for predicting carbon sequestration, biomass accumulation, tree growth, and mortality[4,5].
Conventional monitoring of stand density in bamboo relies mainly on field surveys, which can be inefficient and labor-intensive as a result of complex terrain and dense stands, thereby limiting large-scale, rapid monitoring[6]. Remote sensing-based estimation of bamboo stand density has mainly relied on high-resolution red–green–blue or multispectral imagery[7,8]. Although optical imagery provides broad spatial coverage, it is sensitive to cloud cover and illumination conditions and often fails to capture reliable understory structural information in bamboo stands with high canopy closure and severe crown overlap[9,10]. In addition, these approaches often require high-quality labeled data, limiting their generalizability and robustness under severe occlusion. In contrast, unmanned aerial vehicle–light detection and ranging (UAV–LiDAR), as an active remote-sensing technology, can capture high-density three-dimensional (3D) point clouds, offering clear advantages for characterizing stands' vertical structure and detecting individual stems[11−13]. In arboreal forests, UAV–LiDAR has been widely used for segmentation of individual trees segmentation and for estimating stand density. For example, Hui et al.[12] developed an adaptive mean-shift method combined with hierarchical segmentation for individual-tree extraction. Wu et al.[14] leveraged UAV–LiDAR point clouds and multiple estimation strategies to quantify stand density in plantations, demonstrating the utility of UAV–LiDAR for plot-level inversion of stand structural parameters. However, UAV–LiDAR applications for bamboo stand density estimation remain limited because of continuous canopies and severe crown overlap. Liu et al.[15] proposed an area-based method using multiregion UAV–LiDAR point clouds, with field-measured plot density as the response variable and the point clouds' structural features as predictors. This strategy reduced dependence on explicit detection of individual bamboo plants, which is highly sensitive to point density and the understory's visibility.
Overall, existing UAV–LiDAR approaches for estimating stand density in Moso bamboo (Phyllostachys edulis) forests have two key limitations. First, relying on fine-grained single-culm segmentation restricts their applicability in dense, severely occluded bamboo stands. Second, most studies treat individual culms as the basic modeling unit, lacking a framework that jointly represents overlapping culms and links unit-level predictions to stand-level density estimates. In addition, existing approaches primarily estimate stand density using canopy-level attributes, but the structural information contained within overlapping canopy units has not been fully utilized. How to effectively characterize overlapping canopy structures and establish their relationship with stand density remains an unresolved issue in remote sensing-based stand density estimation of Moso bamboo forests. To address these limitations, we proposed a method for estimating stand density in Moso bamboo forests based on recognition unit classification using UAV–LiDAR point cloud data. First, three recognition unit types (single-culm, two-culm, and three-culm units) were constructed, and their geometric and point cloud structural features were extracted. Second, key features were selected using the recursive feature elimination based on SHapley Additive exPlanations (SHAP) values (RFE-SHAP) algorithm, and the performance of three classifiers was compared across different occlusion scenarios to reveal the complementary roles of geometric and structural UAV–LiDAR-derived features and evaluate the effectiveness of their feature-level integration. Finally, stand density was estimated using weighted statistics of recognition unit predictions, and its accuracy was validated against plot-level field measurements under complex canopy conditions. This study provides a robust framework for remote-sensing-based stand density estimation in Moso bamboo forests without relying on individual-culm segmentation.
-
This study was conducted in Shangping Township (25°51'−25°58' N, 117°12'−117°19' E), Yong'an City, Fujian Province, China (Fig. 1), with an average annual temperature of 14 °C and an average annual precipitation of 2,039 mm. The mean elevation is approximately 1,100 m. The forest cover in the study area is 89.01%, and bamboo forests occupy approximately 7,253 ha, accounting for 20.4% of the total forest land. The dominant vegetation types include evergreen broadleaf forests, coniferous–broadleaf mixed forests, coniferous forests, bamboo forests, and shrubs.
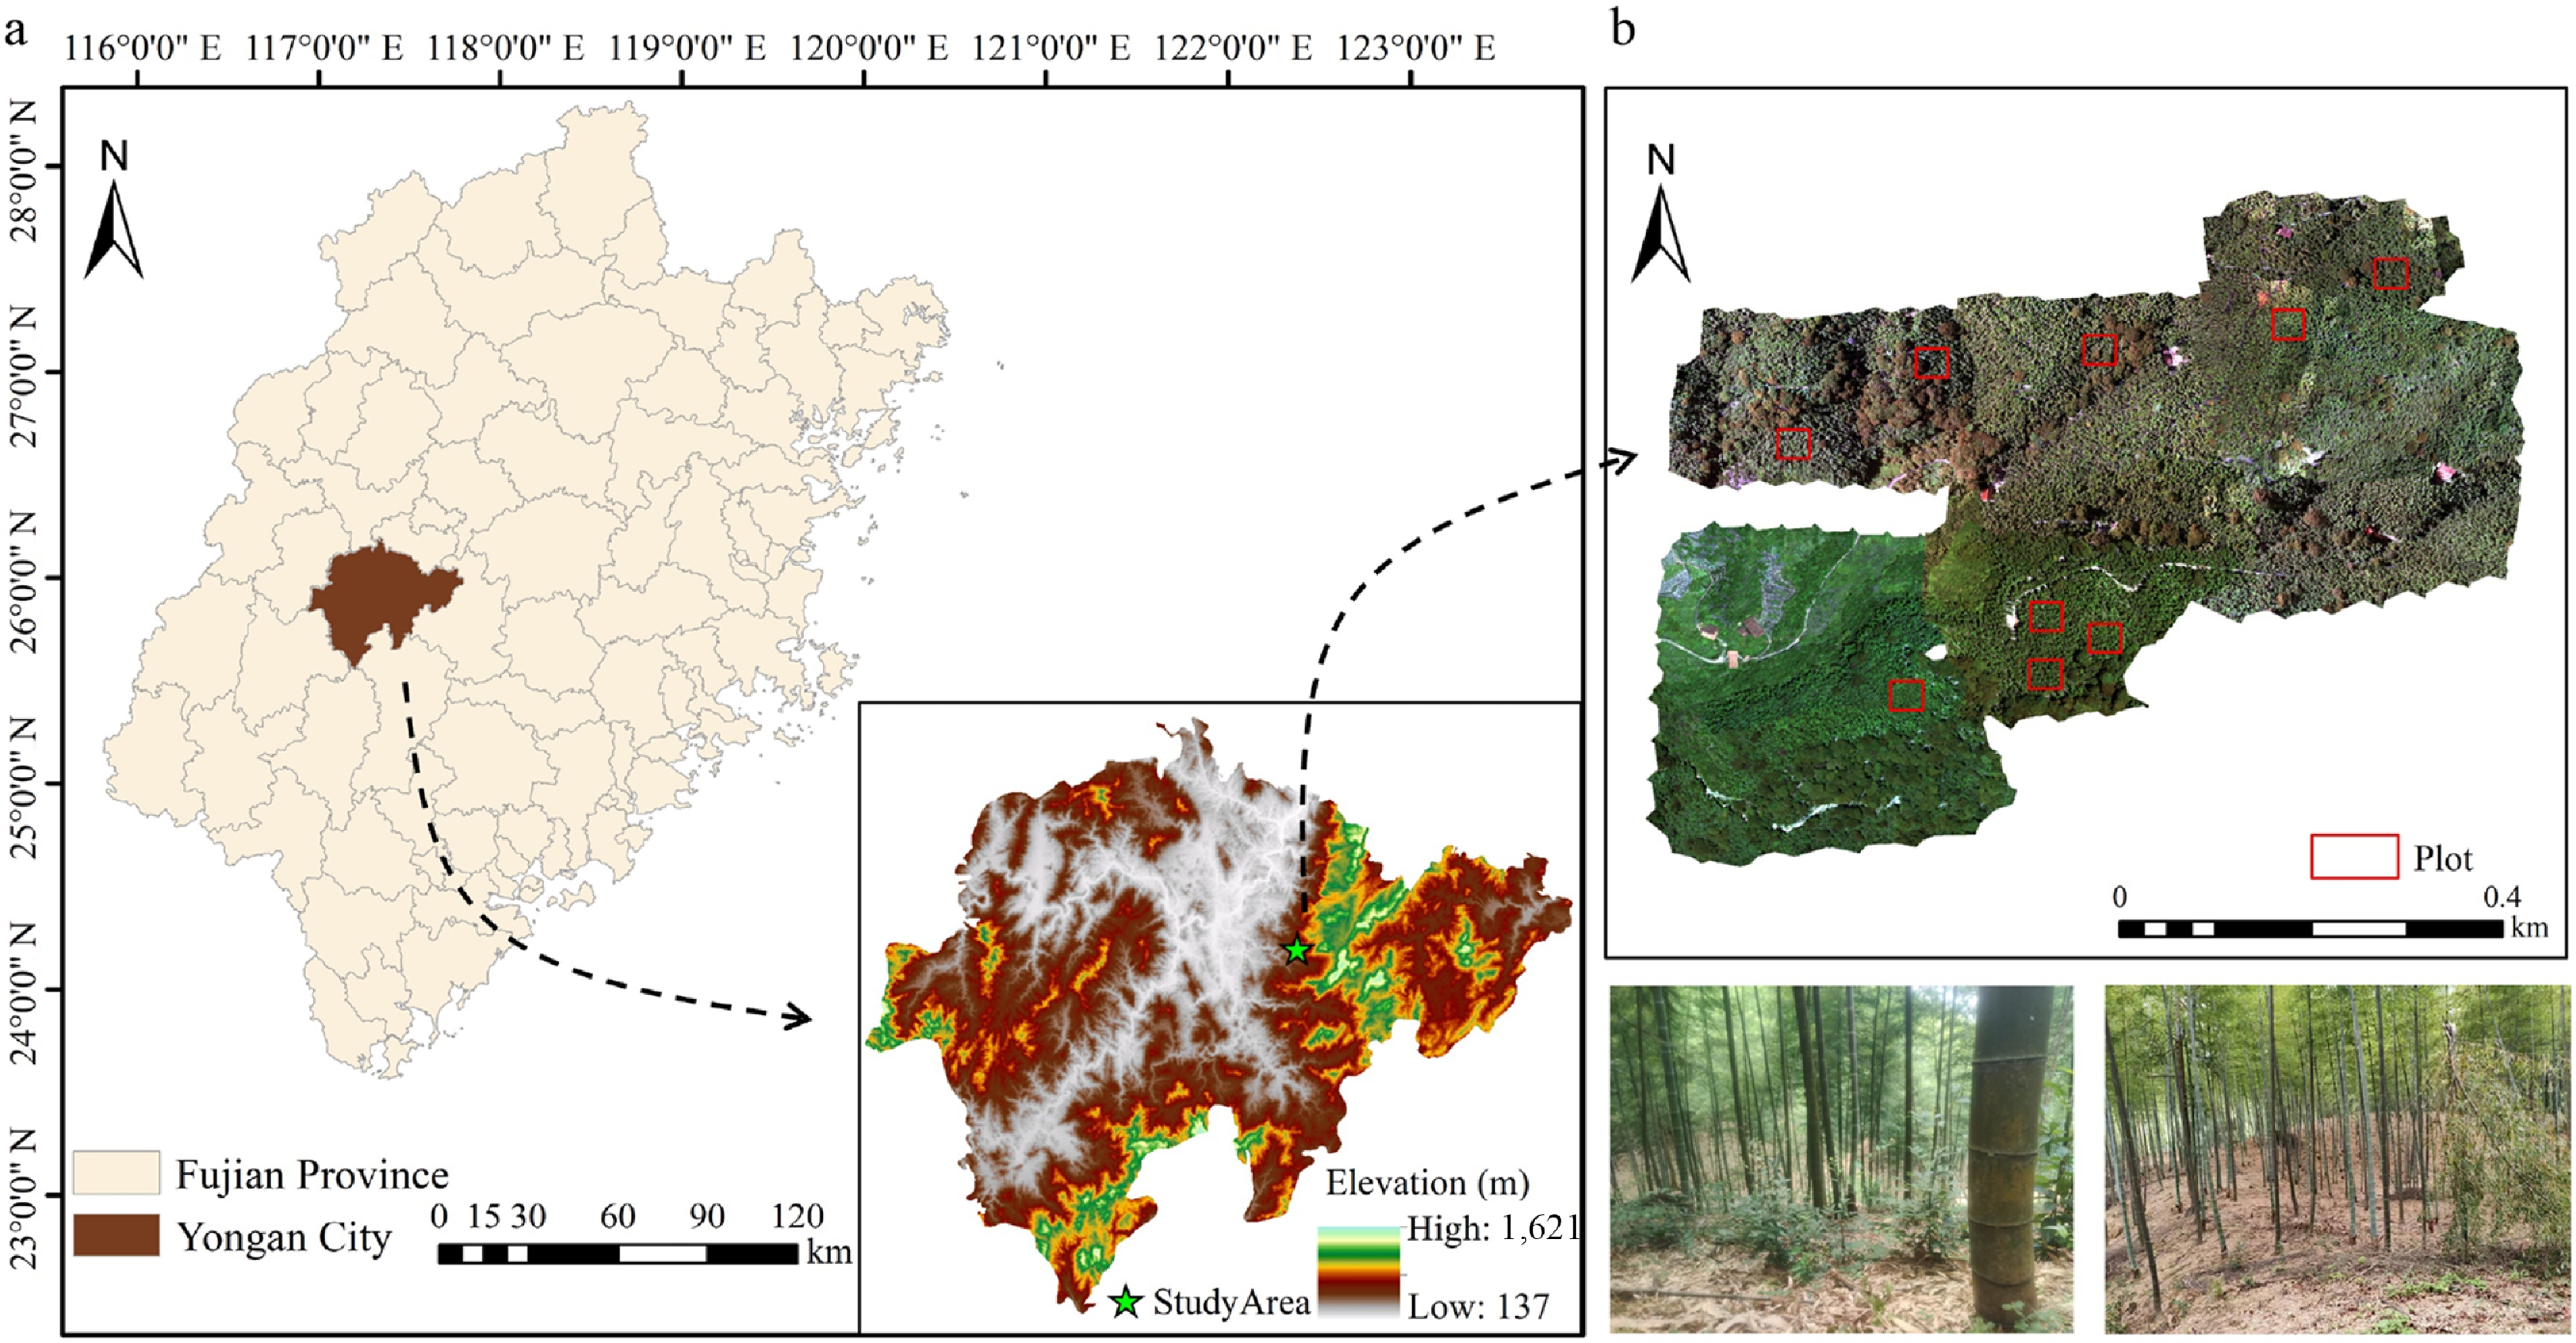
Figure 1.
Spatial location of the study area and field sampling plots. Panel (a) shows the geographic context: The administrative boundary of Fujian Province, the location of Yong'an City, and the elevation map of Yong'an City, with the UAV survey site marked by a green star; the elevation gradient ranges from 137 m (low) to 1,621 m (high). Panel (b) presents the UAV orthoimage covering Shangping Township, Yong'an City, with the nine sample plots delineated by red rectangular frames; the horizontal scale bar represents the distance of the survey area. The two photographs at the bottom illustrate the on-site conditions of the Moso bamboo forest within the sampling plots. The figure is prepared based on a standard map (review number GS [2020]4619), downloaded from the Standard Map Service website of the Ministry of Natural Resources of China. No modifications have been made to administrative boundaries.
Data acquisition and preprocessing
Field data collection
-
A total of nine 30 m × 30 m Moso bamboo plots were established and surveyed within the study area from July to August 2024. During this period, the bamboo was in a stable growth phase with a relatively intact canopy structure, providing representative conditions for field sampling.
Within each plot, all culms were inventoried and counted. Stand density was calculated as the number of culms divided by plot area and expressed on a per-hectare basis (culms ha−1). Basic structural parameters of the stands, including mean height, diameter at breast height (DBH), and internode length at breast height, were also measured using a hypsometer and a diameter tape, respectively.
The planar coordinates of individual culms were obtained using real-time kinematic (RTK) positioning[16]. Plot-level slope, aspect, and elevation were derived from field measurements and ancillary topographic data. Summary statistics of the stands' structural and topographic characteristics for all plots are presented in Table 1.
Table 1. Structural and topographic characteristics of the nine sample plots.
Sample plot No. Mean culm height (m) Mean DBH (cm) Mean internode length at breast height (cm) Stand density (culms ha−1) Slope (°) Aspect Altitude (m) 1 12.0 10.5 18.9 3,124 39 Northwest 757 2 15.3 10.9 21.1 1,768 28 West 784 3 11.0 9.6 18.9 3,368 20 Southeast 709 4 11.3 9.6 19.4 2,646 30 South 689 5 12.0 8.4 17.4 1,734 35 Northwest 695 6 12.1 8.6 17.9 2,190 22 Northwest 721 7 13.4 10.3 19.2 3,413 32 Northwest 685 8 12.6 10.3 19.5 1,756 19 Northwest 713 9 13.9 10.1 19.7 2,590 29 South 771 Acquisition and preprocessing of UAV–LiDAR point cloud data
-
Acquisition of the LiDAR data was synchronized with the field survey. Point cloud data for the sample plots were collected using a drone (DJI Matrice 300 RTK) equipped with a Zenmuse L1 LiDAR sensor (Fig. 2). The beam divergence angle of the DJI Zenmuse L1 is 0.03° (horizontal) × 0.28° (vertical), and its ranging accuracy reaches 3 cm at a measurement distance of 100 m. The system operated in three-return mode, with a scan frequency of 160 kHz and a scan angle of ± 40°. Forward and side overlap were both set to 85%, and the flight speed was 10 m s−1, using an orthogonal flight pattern. To ensure complete coverage of each plot, the flight boundary was extended by 15 m beyond the plots' edges. The LiDAR point cloud data were projected in the World Geodetic System (WGS) 1984/Universal Transverse Mercator (UTM) Zone 50N coordinate system.
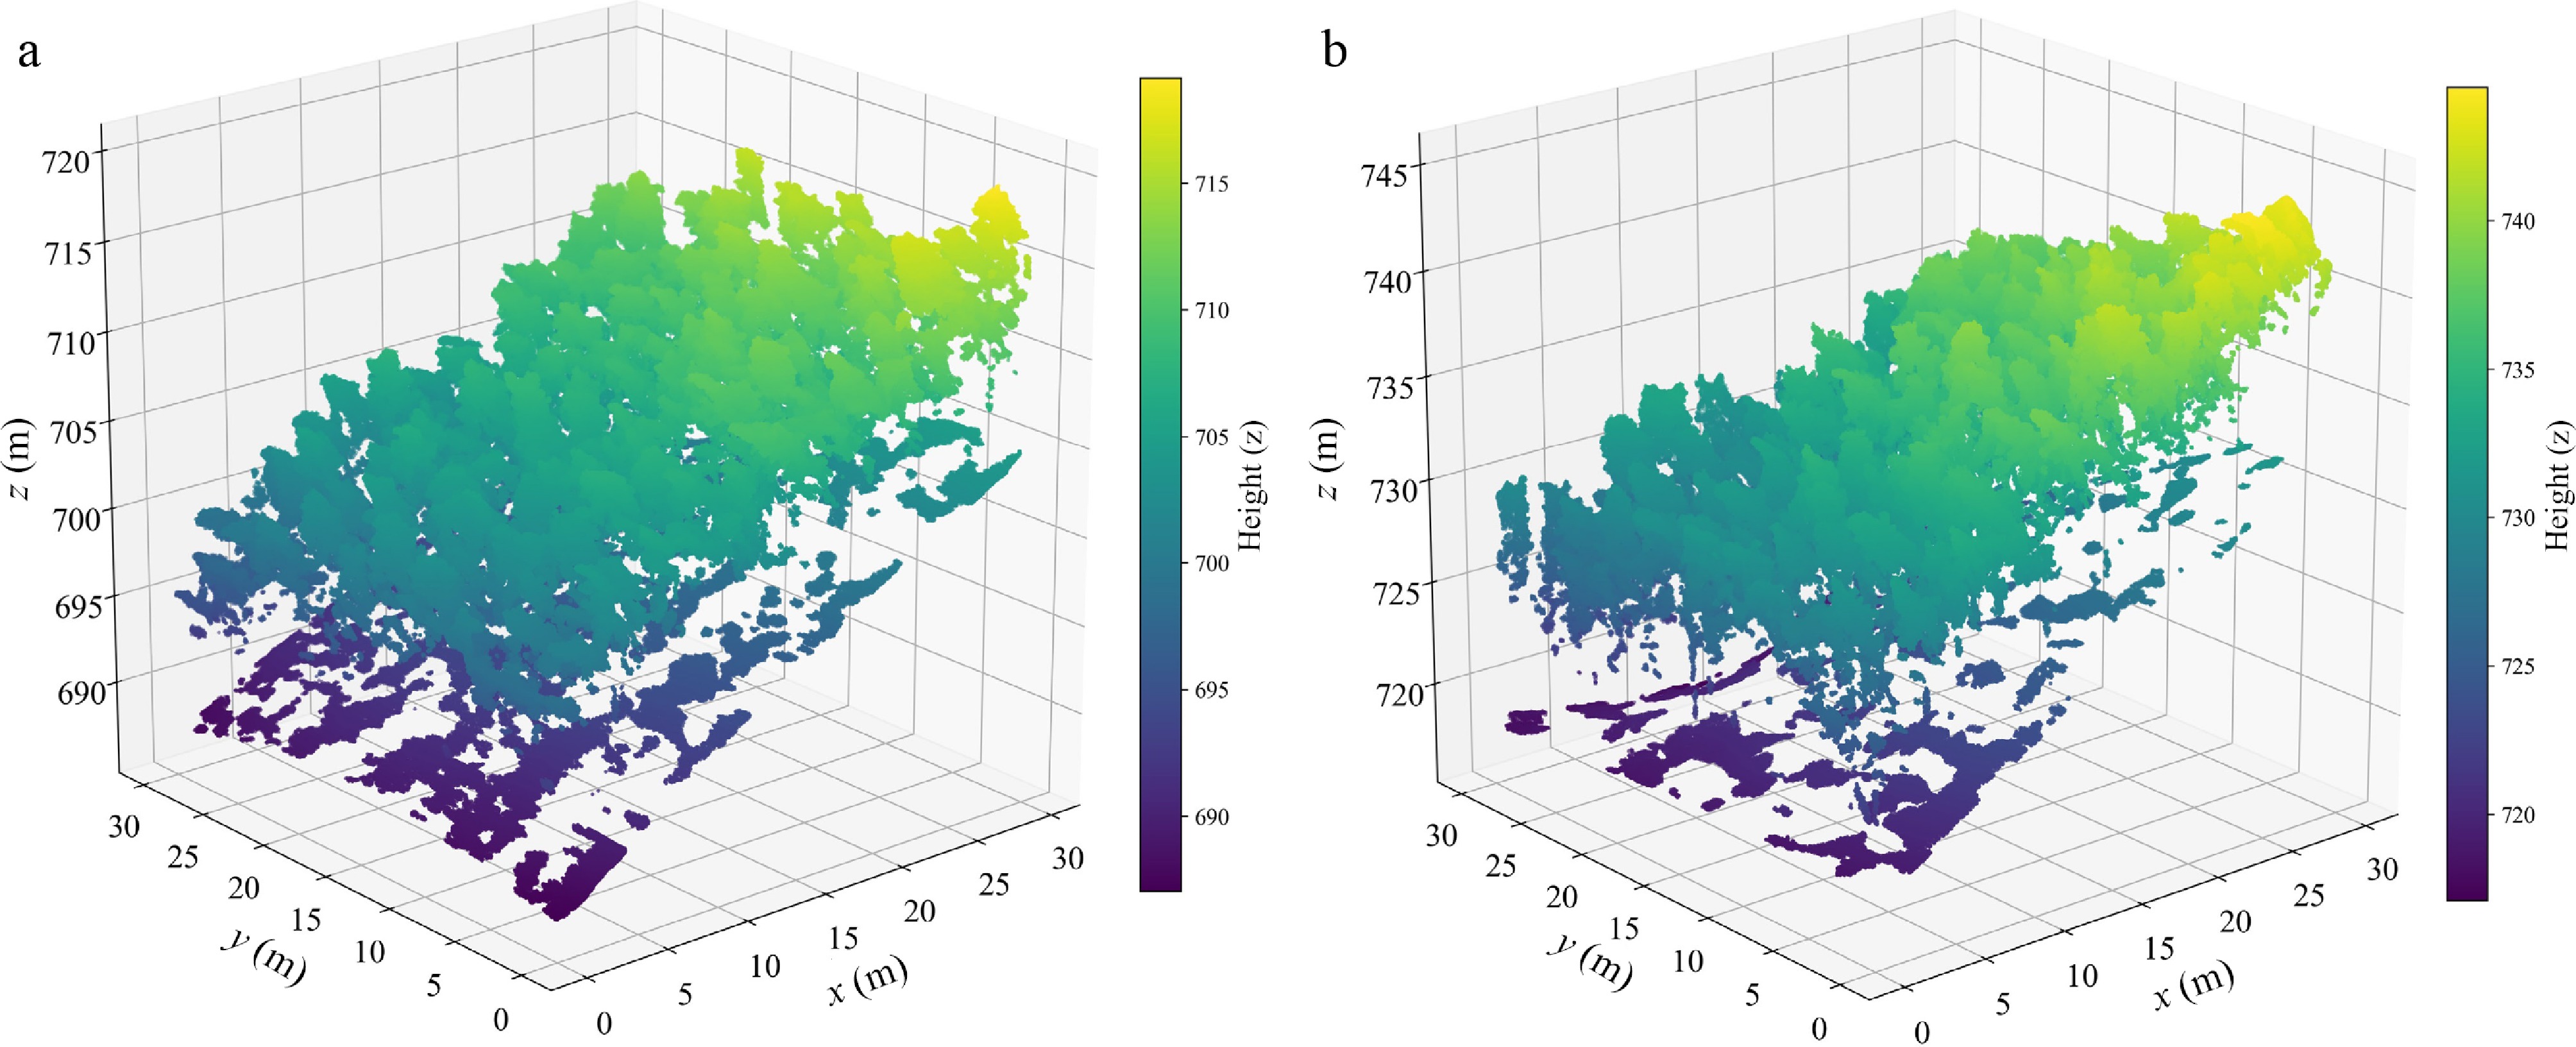
Figure 2.
Three-dimensional visualization of UAV–LiDAR point clouds from two representative Moso bamboo sample plots. (a) Plot YD5; (b) Plot YD6. The horizontal x and y axes represent teh horizontal planar distance (m), and the vertical z axis denotes elevation (m). The color of the point clouds is coded according to the elevation values. The figure demonstrates the complex vertical canopy structure, characterized by high canopy closure and severe inter-culm occlusion in Moso bamboo stands.
Point cloud preprocessing was conducted as follows. First, UAV–LiDAR point clouds were denoised in CloudCompare v2.10 using statistical outlier removal (SOR) filtering. After preprocessing, the point cloud densities across plots ranged from 1,214.40 to 4,572.96 points m−2, with a mean of 2,258.84 points m−2. Second, ground points were extracted using the cloth simulation filter (CSF)[17], which separated the denoised point cloud into ground and nonground returns. A digital elevation model (DEM) with a spatial resolution of 0.1 m was then generated from the ground points using the Kriging interpolation tool in ArcGIS 10.8 to represent plot-scale topographic variation.
Point clouds were normalized to remove terrain effects on the elevation values. For each nonground point, the elevation of the corresponding ground surface was subtracted from its raw elevation[18], thereby aligning the culms' bases within each plot to a common reference plane. The normalized point clouds were then rasterized to generate a canopy height model (CHM) with a spatial resolution of 0.1 m × 0.1 m[19], which was used for subsequent individual-culm segmentation and canopy feature extraction (Fig. 3).
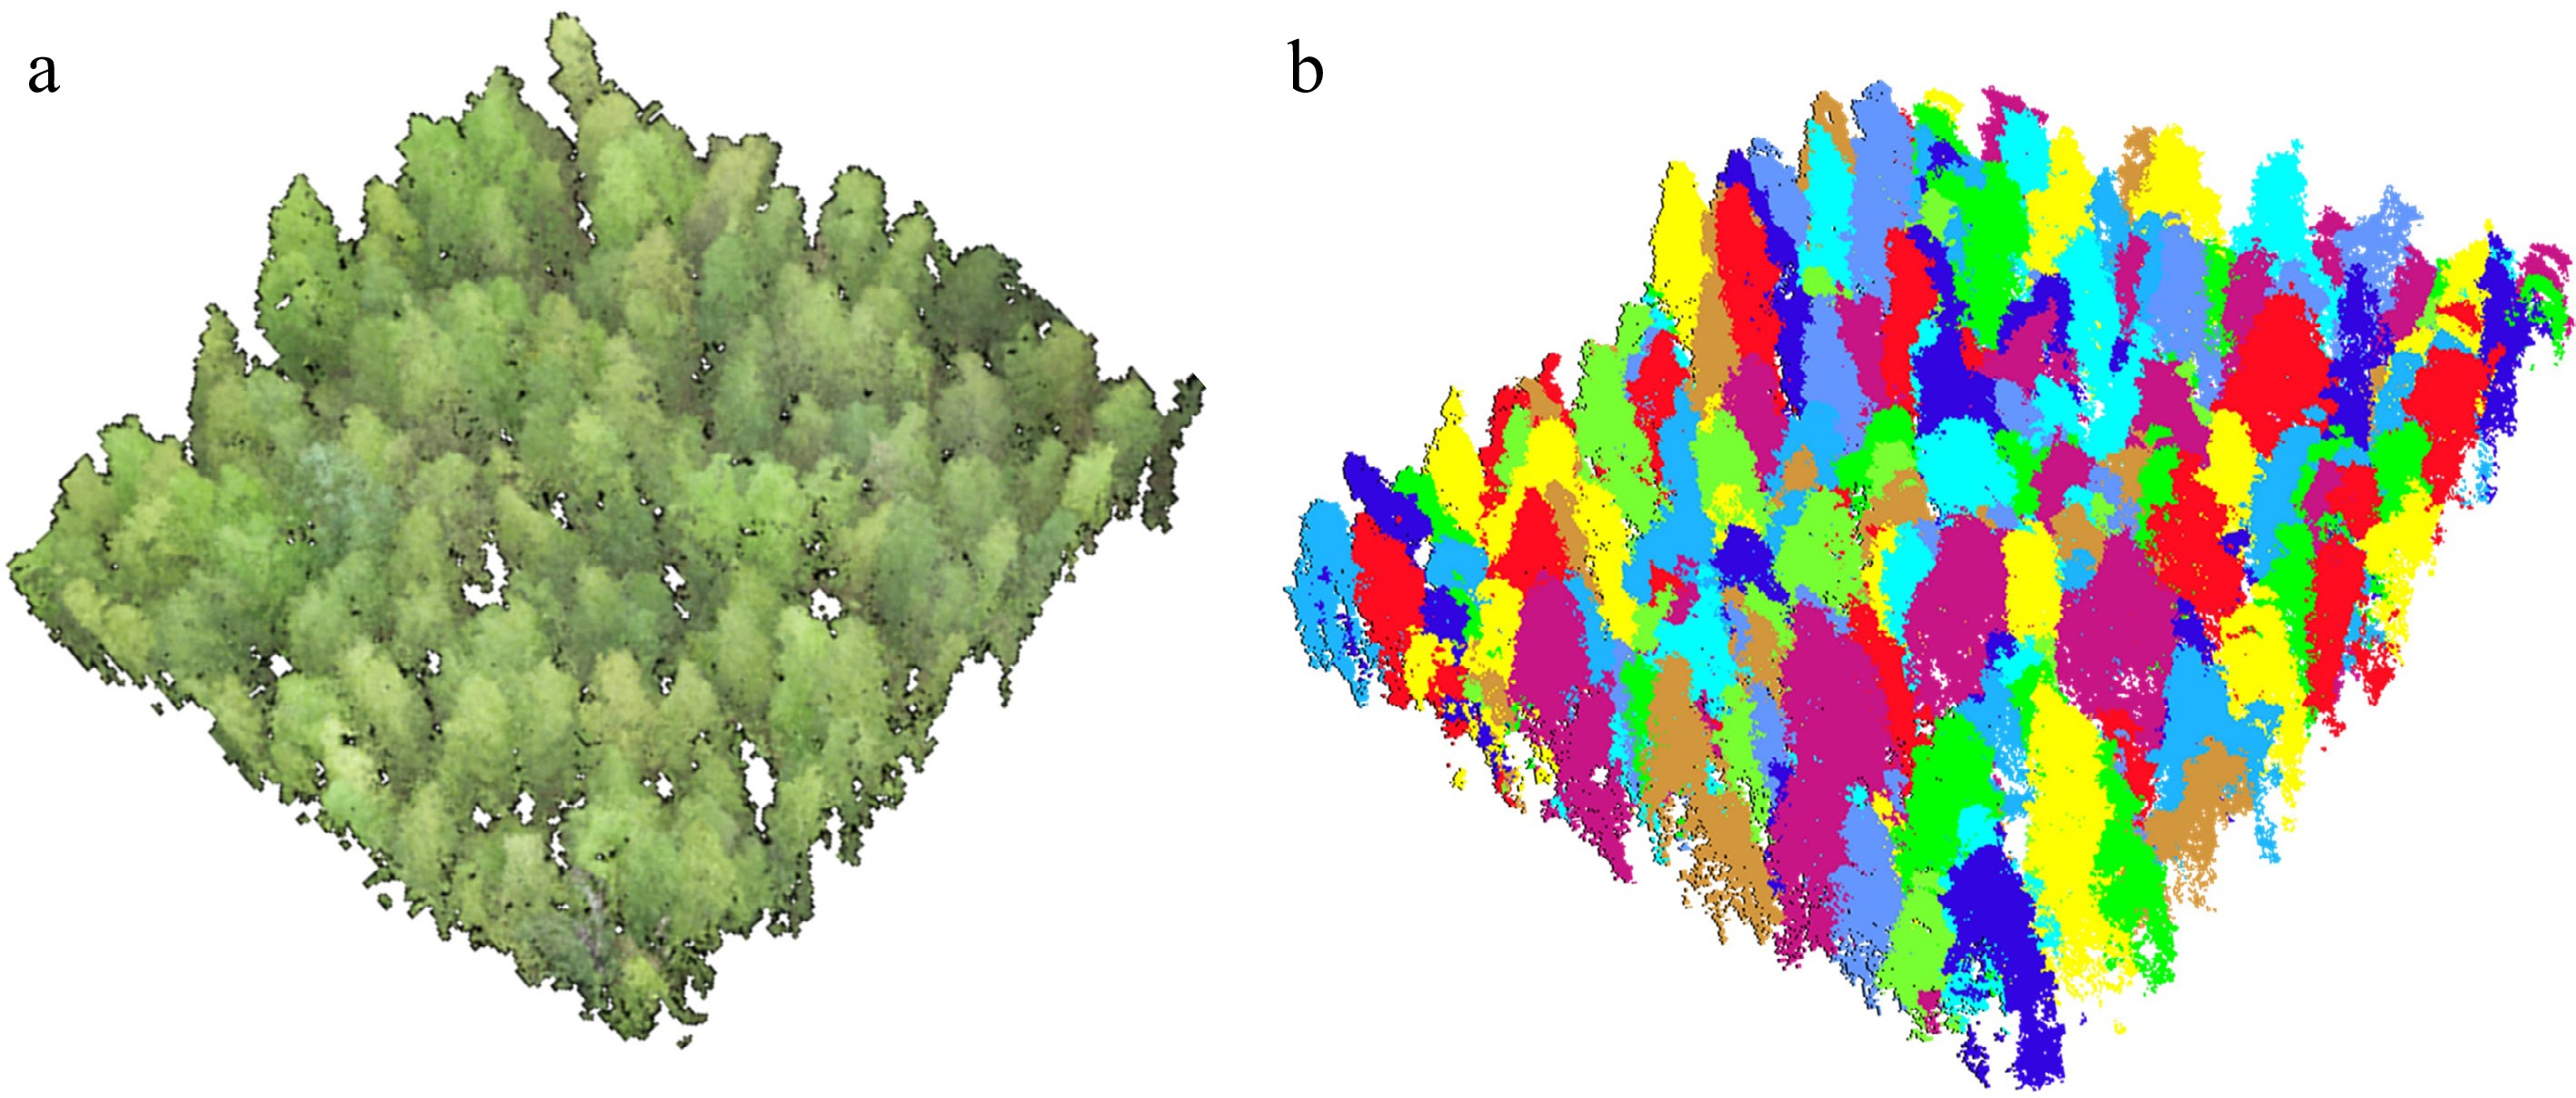
Figure 3.
Point cloud normalization and individual bamboo segmentation using the point cloud segmentation (PCS) algorithm. (a) Normalized point cloud (example: Plot 5); (b) individual bamboo segmentation result based on PCS (example: Plot 5).
Research methods
-
This study addresses the estimation of stand density in structurally complex Moso bamboo forests, and the overall technical workflow is illustrated in Fig. 4. First, to address the limited performance of conventional individual-based segmentation in canopy-overlap areas, we applied the point cloud segmentation (PCS) algorithm together with visual interpretation to identify occlusion states and define recognition units containing one, two, or three overlapping culms. For each recognition unit, geometric descriptors and point cloud structural features were extracted, and RFE-SHAP was used to identify a key feature subset that remained informative under occlusion. Subsequently, machine learning classifiers were developed to distinguish among recognition unit types. Finally, plot-level stand density was estimated from recognition unit classification results using weighted counting and validated against field measurements.
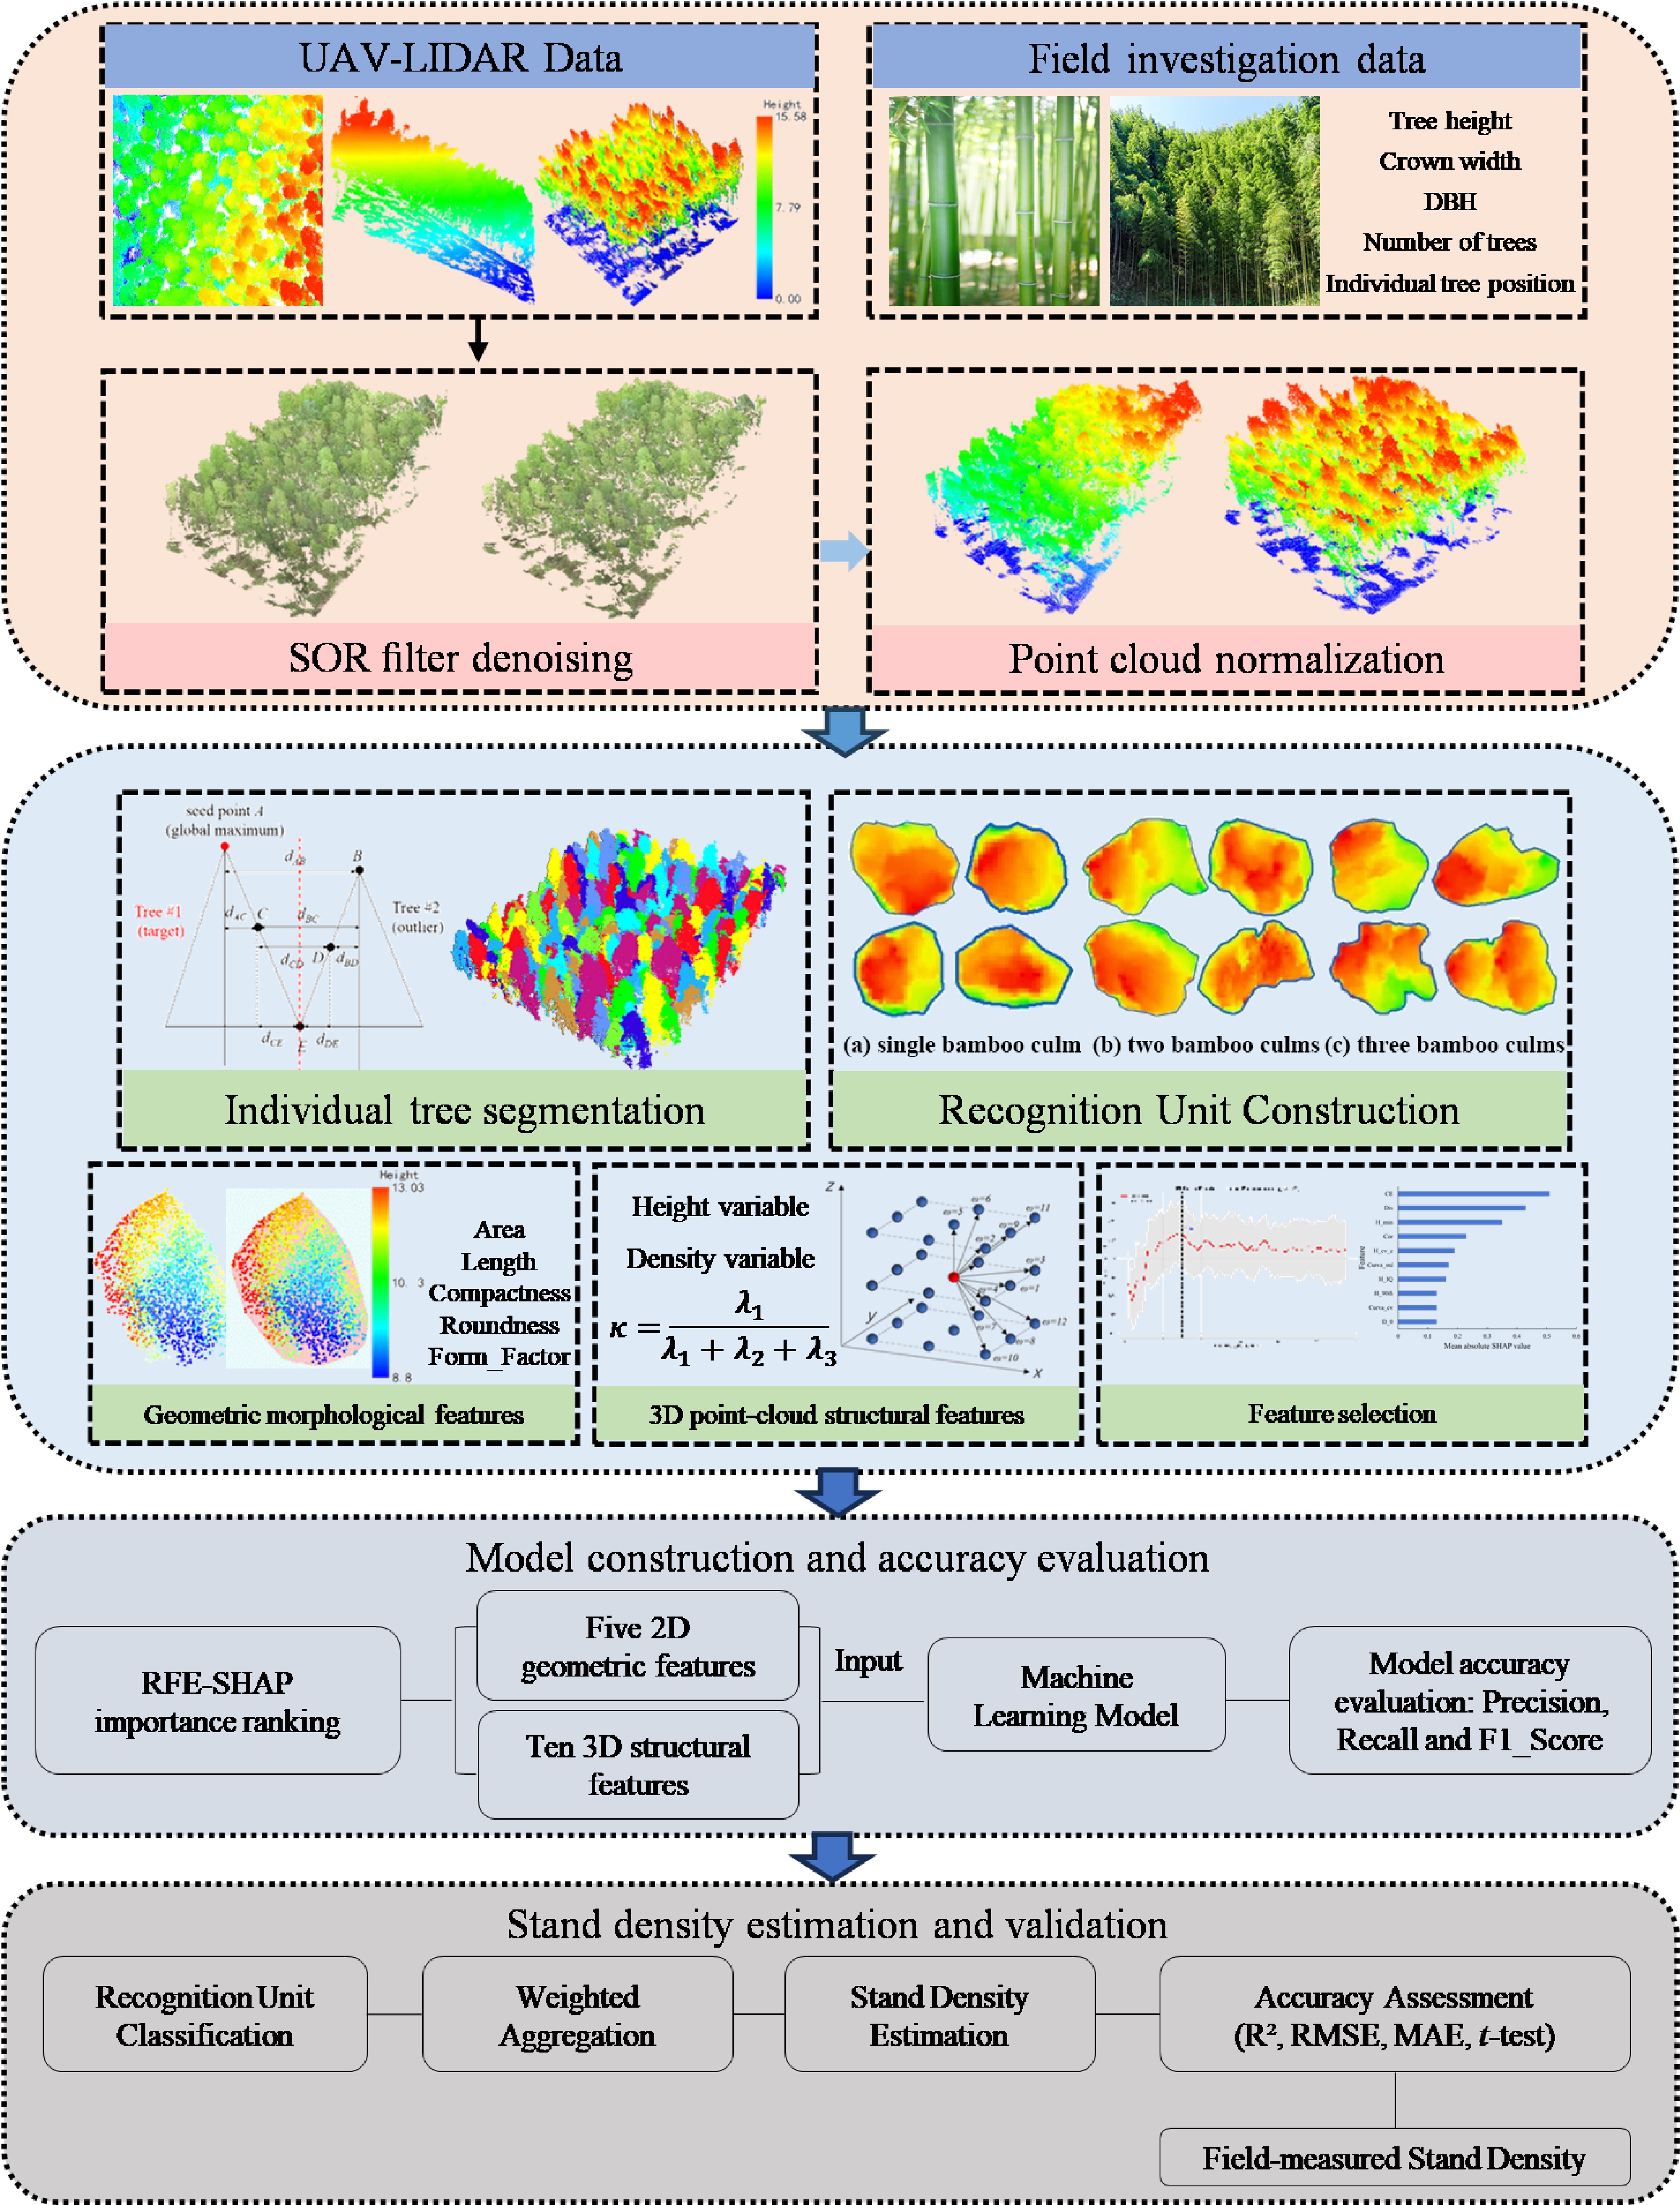
Figure 4.
Technical flowchart.
All analyses were conducted in Python. Open3D (v0.18.0) was used for geometric feature extraction and concave hull reconstruction. Random Forest (RF), support vector machine (SVM), and k-nearest neighbors (KNN) classifiers were implemented using Scikit-learn (v1.5.1). SHAP-based feature interpretation was performed using SHAP (v0.46.0), and the RFE-SHAP procedure was implemented based on a LightGBM model (v4.3.0).
Initial segmentation and recognition-unit construction
-
The PCS algorithm[20] was first applied to segment individual culms from the normalized point clouds of the nine plots. It analyzes point elevations and interpoint distances and uses local-maximum detection to identify canopy apices and delineate crown boundaries. The grid resolution was set to 0.2 m; the buffer size to 40 pixels. Gaussian smoothing was applied with a sigma value of 1 and a radius of 3 pixels. However, PCS alone has limited performance in Moso bamboo forests because of the high canopy closure and extremely small interculm spacing. Visual inspection of the segmented point cloud results revealed three typical occlusion patterns: Isolated single culms, partially overlapping pairs, and strongly overlapping triplets. Based on the UAV point cloud observations, three recognition unit categories were accordingly defined, namely single-culm units (one culm), two-culm units (two culms), and units with three-culm units (three or more culms). Recognition units containing four or more culms occurred only rarely in the point cloud dataset; such samples accounted for an extremely small proportion of the total dataset and could not form an independent category for model training, so they were incorporated into the three-or-more-culm unit category. The class labels of the recognition units were manually assigned through visual interpretation of the segmented point clouds in combination with RTK-measured culm coordinates collected during the field survey. Specifically, the number of culms contained within each segmented canopy unit was determined according to the spatial correspondence between the point cloud segment and the measured culm locations, and each recognition unit was subsequently labeled as a single-culm, two-culm, or three-culm unit. These field-derived labels were then used as the ground truth classes for supervised classification.
In this study, the concave hull algorithm[21] was applied to the point clouds of each recognition unit to reconstruct two-dimensional (2D) projected boundaries and extract the crown contours. Polygons of the recognition units' crowns were further delineated and exported as shapefiles using the Open3D. On the basis of the field survey data and the CHM, 432 single-culm, 320 two-culm, and 320 three-culm recognition units in total were identified from the PCS segmentation results across all nine plots, comprising the full set of valid segmented units.
Feature extraction and selection (RFE-SHAP)
-
To capture morphological differences among recognition units under canopy occlusion, we constructed a comprehensive feature set comprising geometric features and point cloud structural features, and introduced an explainability-driven feature-selection strategy to optimize the model inputs.
Geometric features
-
The recognition units' crown outlines were delineated using the concave hull algorithm, and geometric features were extracted in Python. The alpha value was set to 0.15 m. Morphological differences among recognition units were quantified using planar geometric metrics, including area, length, compactness, roundness, and form factor[22]. In addition, volumetric geometric descriptors, namely the concave hull surface area (Hull_Sur) and concave hull enclosed volume (Hull_Vol), were further derived from reconstructed mesh models (Table 2).
Table 2. Morphological description of different geometric features.
Morphological features Description Area Total area of the polygon, minus the area of the holes Length The combined length of all boundaries of the polygon, including the boundaries of the holes Compactness A shape measure that indicates the compactness of the polygon. A circle is the most compact shape with a value of 1/π. The compactness value of a square is 1/2(√π).
Compactness = √(4 × area/π) / outer contour lengthRoundness A shape measure that compares the area of the polygon to the square of the maximum diameter of the polygon. The "maximum diameter" is the length of the major axis of an oriented bounding box enclosing the polygon. The roundness value for a circle is 1, and the value for a square is 4/π
Roundness = 4 × (area)/(π × major_length2)Form factor A shape measure that compares the area of the polygon to the square of the total perimeter. The form factor value of a circle is 1, and the value of a square is π/4
Form factor = 4 × π × (area)/(total perimeter2)Hull_Sur Total area of the triangulated mesh of the concave hull reconstructed from the point cloud Hull_Vol Volume enclosed by the concave hull mesh Point clouds' structural features
-
To characterize the internal complexity and vertical heterogeneity in overlapping bamboo canopies, point clouds' structural features were extracted and grouped into four categories as follows.
Statistical variables of height and density: Based on the normalized UAV–LiDAR vegetation point clouds, 22 commonly used statistical metrics[23−25] were extracted to capture canopy height distribution and vertical density distribution (Table 3). Height-related variables quantified the central tendency and dispersion of canopy height. Density-related variables characterized vertical variation in canopy density.
Table 3. List of variables extracted from UAV–LiDAR point clouds.
Category Variable Descriptions Height variable Hx Height percentiles H_IQ, H_Sq Interquartile range of height, quadratic mean of height Hmax, Hmean, Hmin, Hmedian Maximum, mean, minimum, and median height Hcv, Hkurtosis, Hskewness, Hstddev, Hvariance Coefficient of variation, kurtosis, skewness, standard deviation, and variance of height Density variable D0, D1, …, D9 Proportion of points in each vertical layer relative to the total number of points, counted from bottom to top X takes values of 1, 5, 10, 20, 25, 30, 40, 50, 60, 70, 75, 80, 90, 95, 99, D0−D9 is the density of the point cloud in each of the ten horizontal layers uniformly divided from low to high. Subscripts such as max, mean, and std indicate the corresponding statistical operations. Canopy entropy (CE): This was calculated according to the method of Liu et al.[26] to quantify the spatial complexity and randomness of the point cloud arrangement within the crown (Table 4).
Table 4. Point clouds' structural features.
Feature category Variable Descriptions Canopy feature CE Canopy entropy 3D texture features Asm Angular second moment Cont Contrast Entr Entropy Idm Inverse difference moment Mean Mean Hom Homogeneity Dis Dissimilarity AutoCor Autocorrelation Cor Correlation Curvature features Curva_Mean Mean curvature Curva_Median Median curvature Curva_PCT90 90th percentile curvature Curva_std Standard deviation of curvature Curva_cv Coefficient of variation of curvature The 3D texture features: Nine texture metrics were derived using the 3D gray-level co-occurrence matrix (GLCM) method[27], which characterizes repetitive patterns and local heterogeneity within the point cloud (Table 4).
Curvature features: Based on covariance analysis and singular value decomposition of local point cloud neighborhoods[28,29], five curvature metrics were calculated. These metrics reflect canopy surface roughness and undulation (Table 4).
Feature selection using RFE-SHAP
-
To mitigate redundancy in the high-dimensional feature space and improve the interpretability of feature selection while preserving predictive performance, RFE-SHAP[30] was applied to select informative predictors and reduce the dimensionality of recognition-unit features.
SHAP values, grounded in cooperative game theory, quantify the global importance of each feature by estimating its marginal contribution to the model's predictions across different feature subsets. Compared with conventional RFE, which ranks features using model coefficients or Gini importance, RFE-SHAP uses the mean absolute SHAP value as the importance criterion during recursive elimination, thereby integrating feature selection with the model's interpretability.
$ \text{f}\left(\text{x}\right)={\phi}_{0}+\sum\limits_{\text{i=1}}^{\text{N}}{\phi}_{{i}} $ (1) where, ϕ0 represents the baseline output value of the model, and ϕi denotes the SHAP value of the i-th feature.
Accordingly, the RFE-SHAP procedure was applied separately to three feature sets: (1) Geometric features only (including both 2D planar metrics and 3D concave-hull metrics), (2) structural features only (height/density statistics, canopy entropy, 3D texture, and curvature), and (3) the combined set of all features. For each scenario, the optimal feature subset was determined via 10-fold cross-validation.
In this study, feature fusion refers specifically to feature-level integration of geometric and point cloud structural descriptors extracted from the same UAV–LiDAR dataset, rather than fusion of multiple sensors or heterogeneous data sources.
Recognition unit classification models
-
A machine learning classification framework was developed to identify recognition unit types under complex canopy conditions using the selected feature subset. The RF, KNN, and SVM classifiers were evaluated. These algorithms represent ensemble-, instance-, and kernel-based learning paradigms, respectively, enabling a comparison across complementary modeling strategies.
Grid search combined with stratified 10-fold cross-validation was adopted to tune the hyperparameters for all machine learning models. The full hyperparameter search ranges and optimal parameter combinations of RF, SVM, KNN, and LightGBM are summarized in Supplementary Table S1. To guarantee experimental reproducibility, a fixed random seed (random_state = 42) was implemented for all random operations, including dataset partitioning, cross-validation, and model training. Prior to model training, feature standardization via StandardScaler was performed for SVM and KNN; scaling statistics were exclusively fitted on the training subset and then applied to the independent test set. No feature scaling was conducted for RF and LightGBM, as tree-based models are invariant to feature magnitude.
The 1,072 samples were first divided into training (70%) and test (30%) sets using stratified sampling. Feature selection, hyperparameter optimization, and model training were performed exclusively on the training set, whereas the independent test set was reserved for final model evaluation. This ratio balances adequate model training with an independent test evaluation under limited sample sizes. During sample construction and data partitioning, the distribution of recognition units across occlusion levels was considered to ensure sufficient representation of all three classes and consistent class proportions between the training and test sets, thereby improving representativeness under field-realistic canopy conditions. In addition, 10-fold stratified cross-validation was conducted within the training set to reduce variance associated with a single split, mitigate overfitting, and improve the robustness of model evaluation.
To compare classification performance across models, five widely used evaluation metrics were adopted[31]: Accuracy, precision, recall, F1 score, and the Kappa coefficient. Accuracy measures the overall classification correctness; precision and recall describe predictive reliability and sensitivity, respectively; the F1 score summarizes the balance between precision and recall; and the Kappa coefficient quantifies agreement beyond chance. All metrics were derived from the confusion matrix, and their formulas are provided below:
$ \rm {Precision}=\dfrac{{TP}}{{TP+FP}} $ (2) $\rm {Recall}=\dfrac{{TP}}{{TP+FN}} $ (3) $ \rm {F1\; Score}=\dfrac{{2PR}}{{P+R}} $ (4) $\rm {Accuracy}=\dfrac{{TP+TN}}{{FP+FN+TP+TN}} $ (5) where, TP (true positive) indicates a predicted value of 1 and an actual value of 1 (correct positive prediction); FP (false positive) indicates a predicted value of 1 but an actual value of 0 (incorrect positive prediction); and FN (false negative) indicates a predicted value of 0 but an actual value of 1 (incorrect negative prediction).
Stand density estimation
-
After classifying the recognition units, plot-level stand density in Moso bamboo forests was estimated by aggregating the classification outputs. Rather than relying on high-precision segmentation based on individual culms, we developed a weighted statistical inversion framework that utilizes the compositional characteristics of the classified units, thereby mitigating the effects of complex canopy structure and multiculm occlusion.
Specifically, the classifier outputs were categorized into three recognition-unit types: Single-, two-, and three-culm units, corresponding to units containing one, two, and three or more culms. At the plot scale, the counts of the three unit types were denoted as N1, N2, and N3, respectively Plot-level culm abundance was then estimated using a weighted sum of these counts based on the number of culms represented by each unit type:
$ N=1\times{{N}}_{1}+2\times{{N}}_{2}+3\times{{N}}_{3} $ (6) where, N denotes the estimated total number of Moso bamboo culms within a plot. Stand density (SD, culms ha−1) was then calculated using plot area (A, in ha) as follows:
$ \rm {SD}=\dfrac{{N}}{{A}} $ (7) To validate the reliability of the stand density estimates, plot-level stand density derived from UAV–LiDAR data was compared with field-measured stand density. A paired t-test was performed to determine whether the two estimates differed significantly.
-
Conventional individual culm segmentation cannot accurately delineate bamboo culms' boundaries in dense Moso bamboo stands with high canopy closure. PCS segmentation outputs from the nine sample plots exhibited incomplete separation of single culms, partial crown overlap between two culms, and severe occlusion among three culms (Fig. 5). Figure 5 visualizes the segmentation results as 3D point clouds to separate intertwined overlapping crowns and intuitively demonstrate various segmentation defects. Combined with field survey observations, three types of recognition units were defined in this study: Single-culm, two-culm, and three-culm recognition units (Fig. 6). Distinct from the 3D point cloud visualization in Fig. 5, Fig. 6 adopts a 2D CHM to characterize variations of vertical height within the crowns, facilitating identification of the actual number of culms enclosed in each segmented unit.
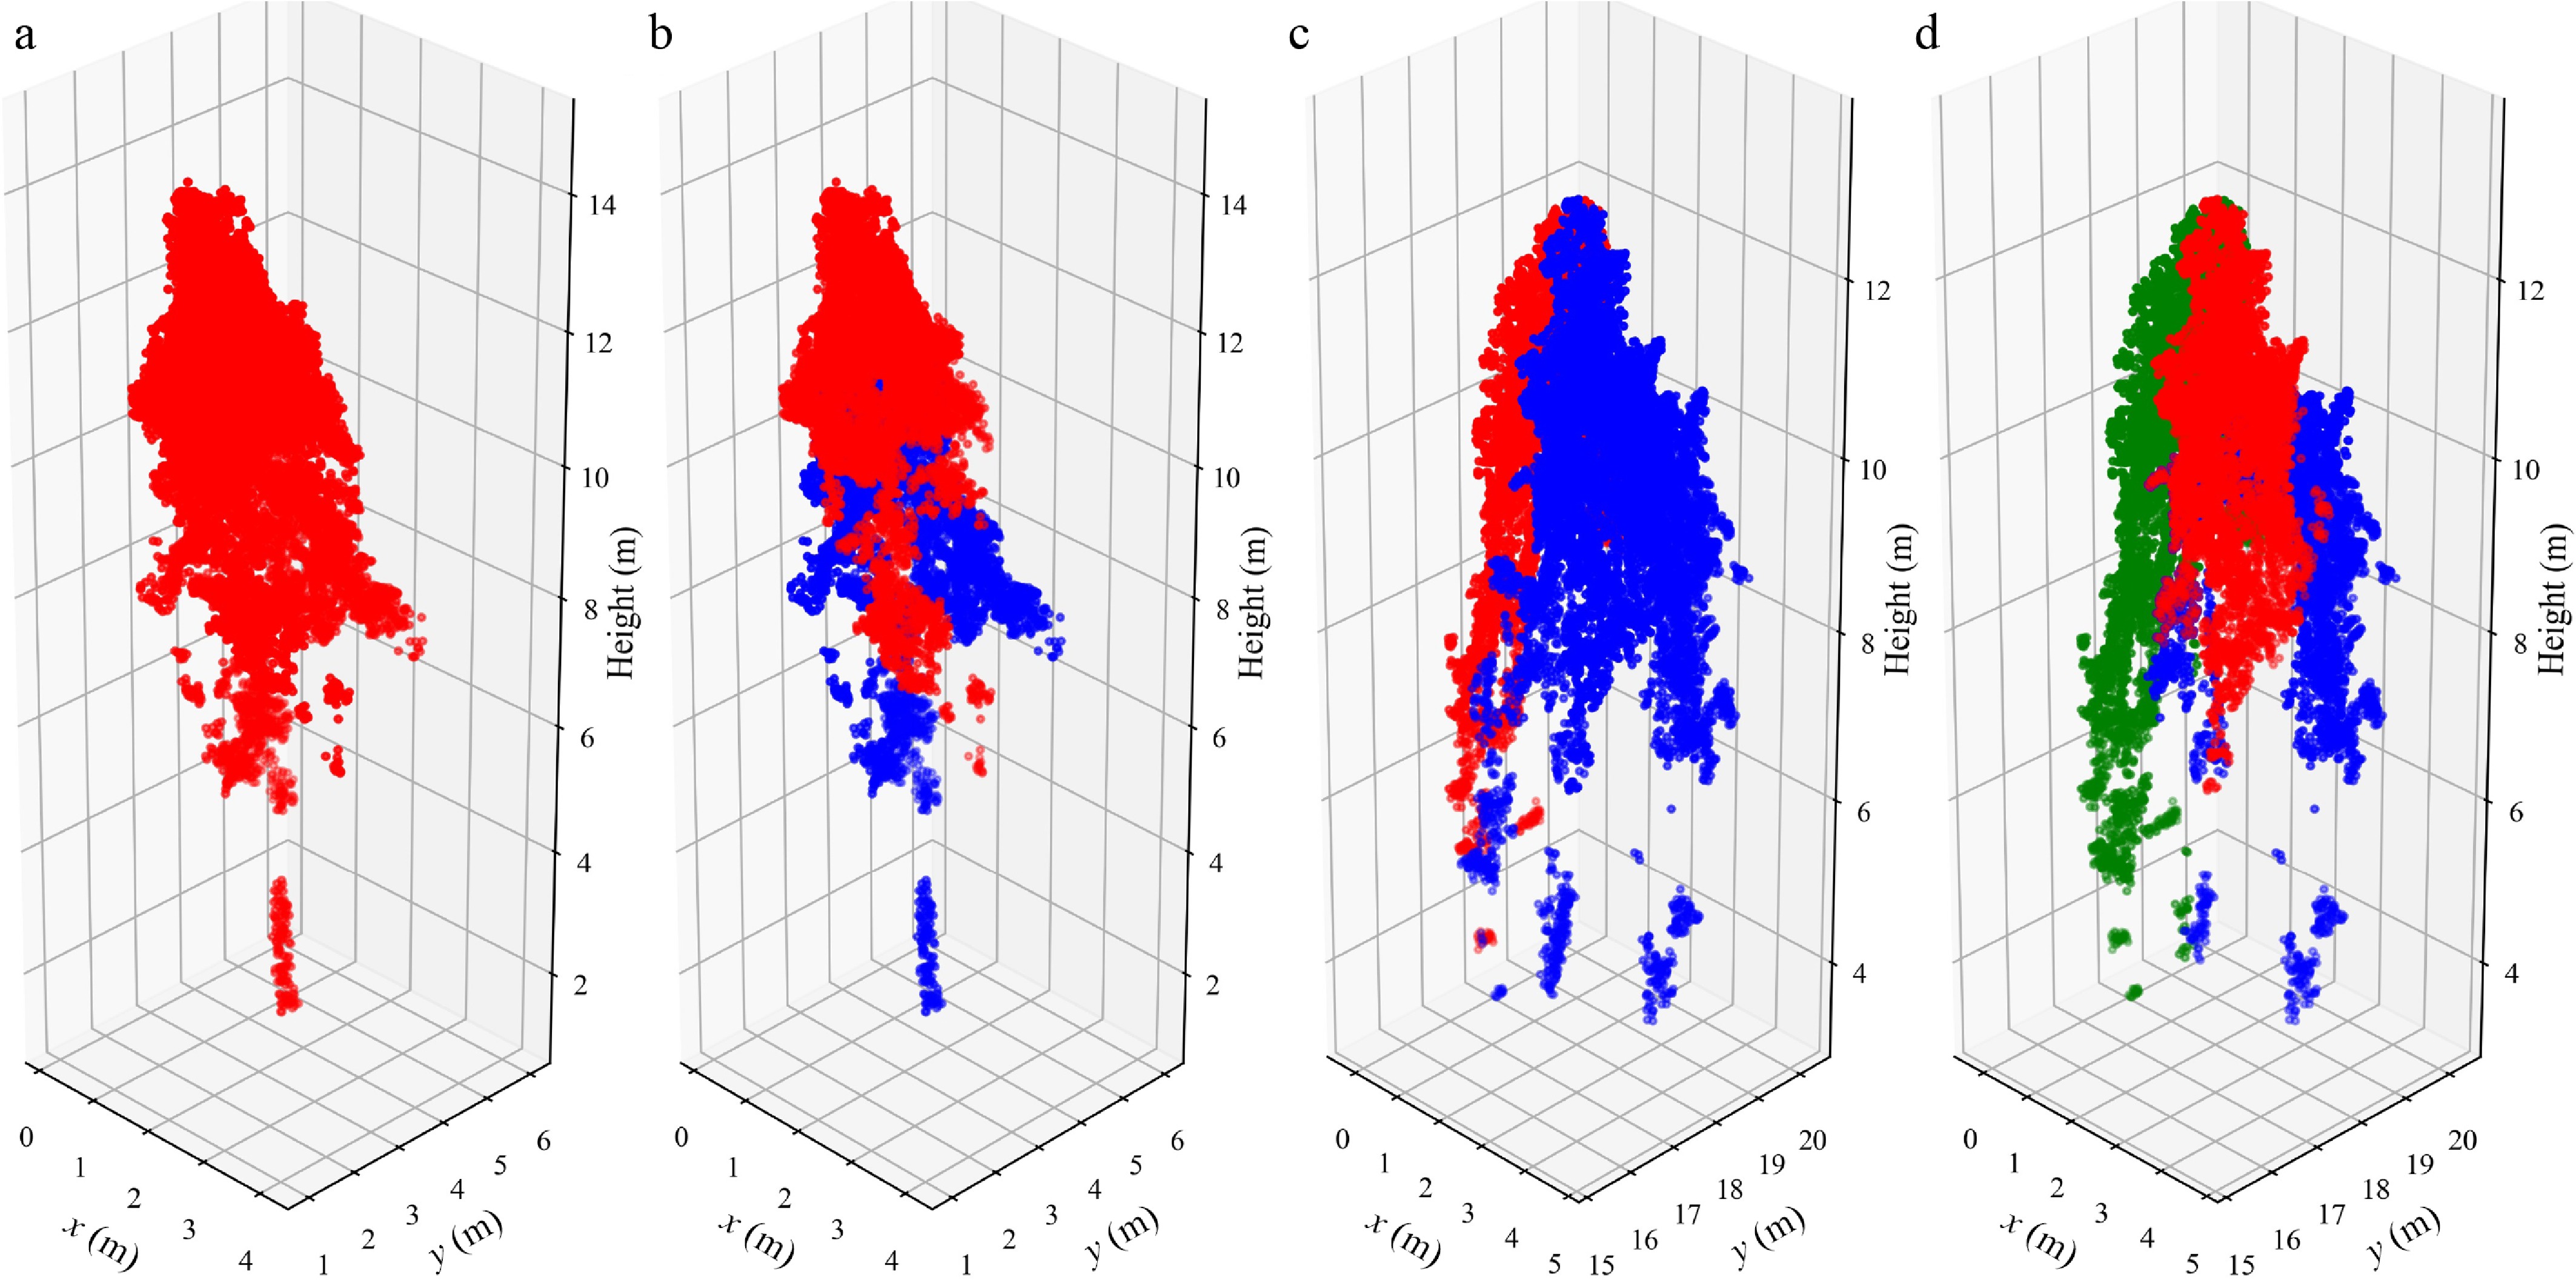
Figure 5.
Examples of inaccurate PCS segmentation results. (a) PCS segmentation result (Example 1); (b) corresponding field-observed culms (Example 1); (c) PCS segmentation result (Example 2); (d) corresponding field-observed culms (Example 2).

Figure 6.
Recognition units of different forms of bamboo. (a1), (a2) Single-culm recognition unit; (b1), (b2) two-culm recognition unit; (c1), (c2) three-culm recognition unit.
Feature selection
-
In total, 1,072 valid recognition unit samples were obtained. Fifty-eight features were extracted from the geometric and point cloud structural descriptors. RFE-SHAP feature selection performance was evaluated via 10-fold cross-validation only within the training set. As shown in Fig. 7, the highest mean cross-validation classification accuracy (0.759) was achieved when retaining 15 features. The red curve illustrates the trend of mean accuracy with varying feature numbers, and the gray shaded area represents the range of accuracy variation across cross-validation folds.
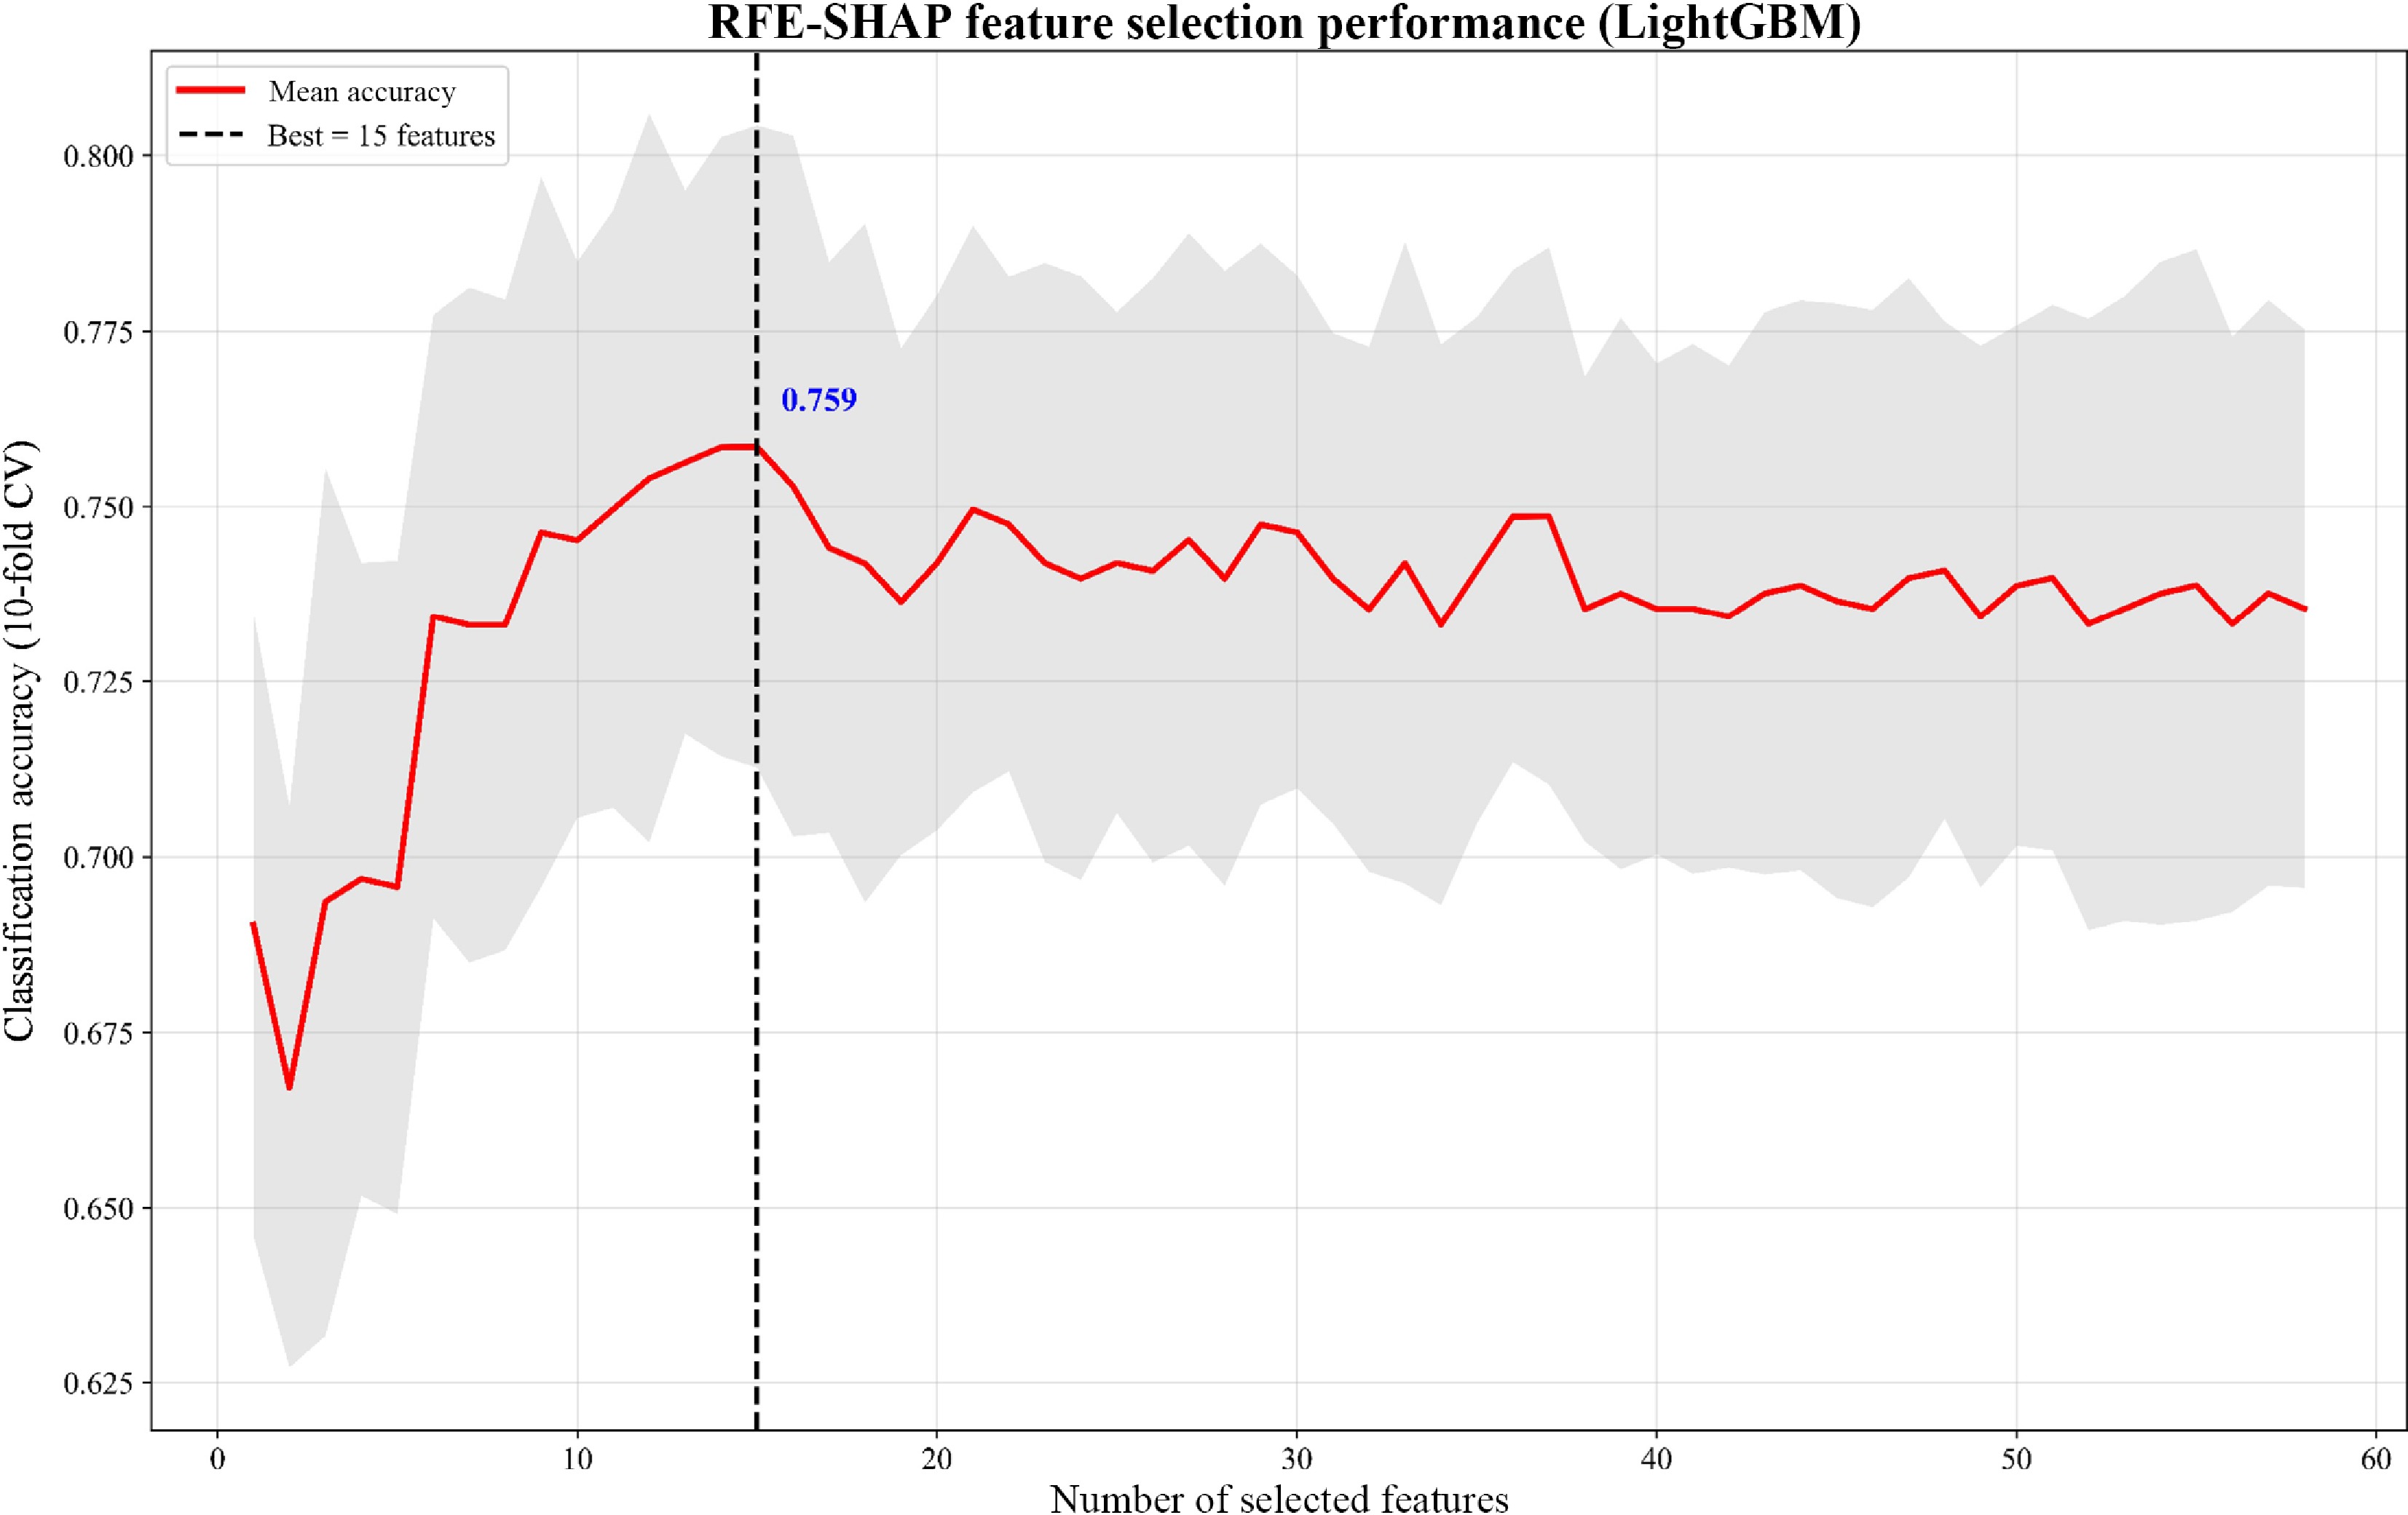
Figure 7.
RFE-SHAP feature selection performance assessment.
On the basis of classification accuracy and feature reduction efficiency, three optimal feature subsets were selected: 5 geometric features, 10 point cloud structural features, and a combined set of 15 features (Fig. 8). These reduced subsets retained predictive performance while substantially decreasing the feature dimensionality.
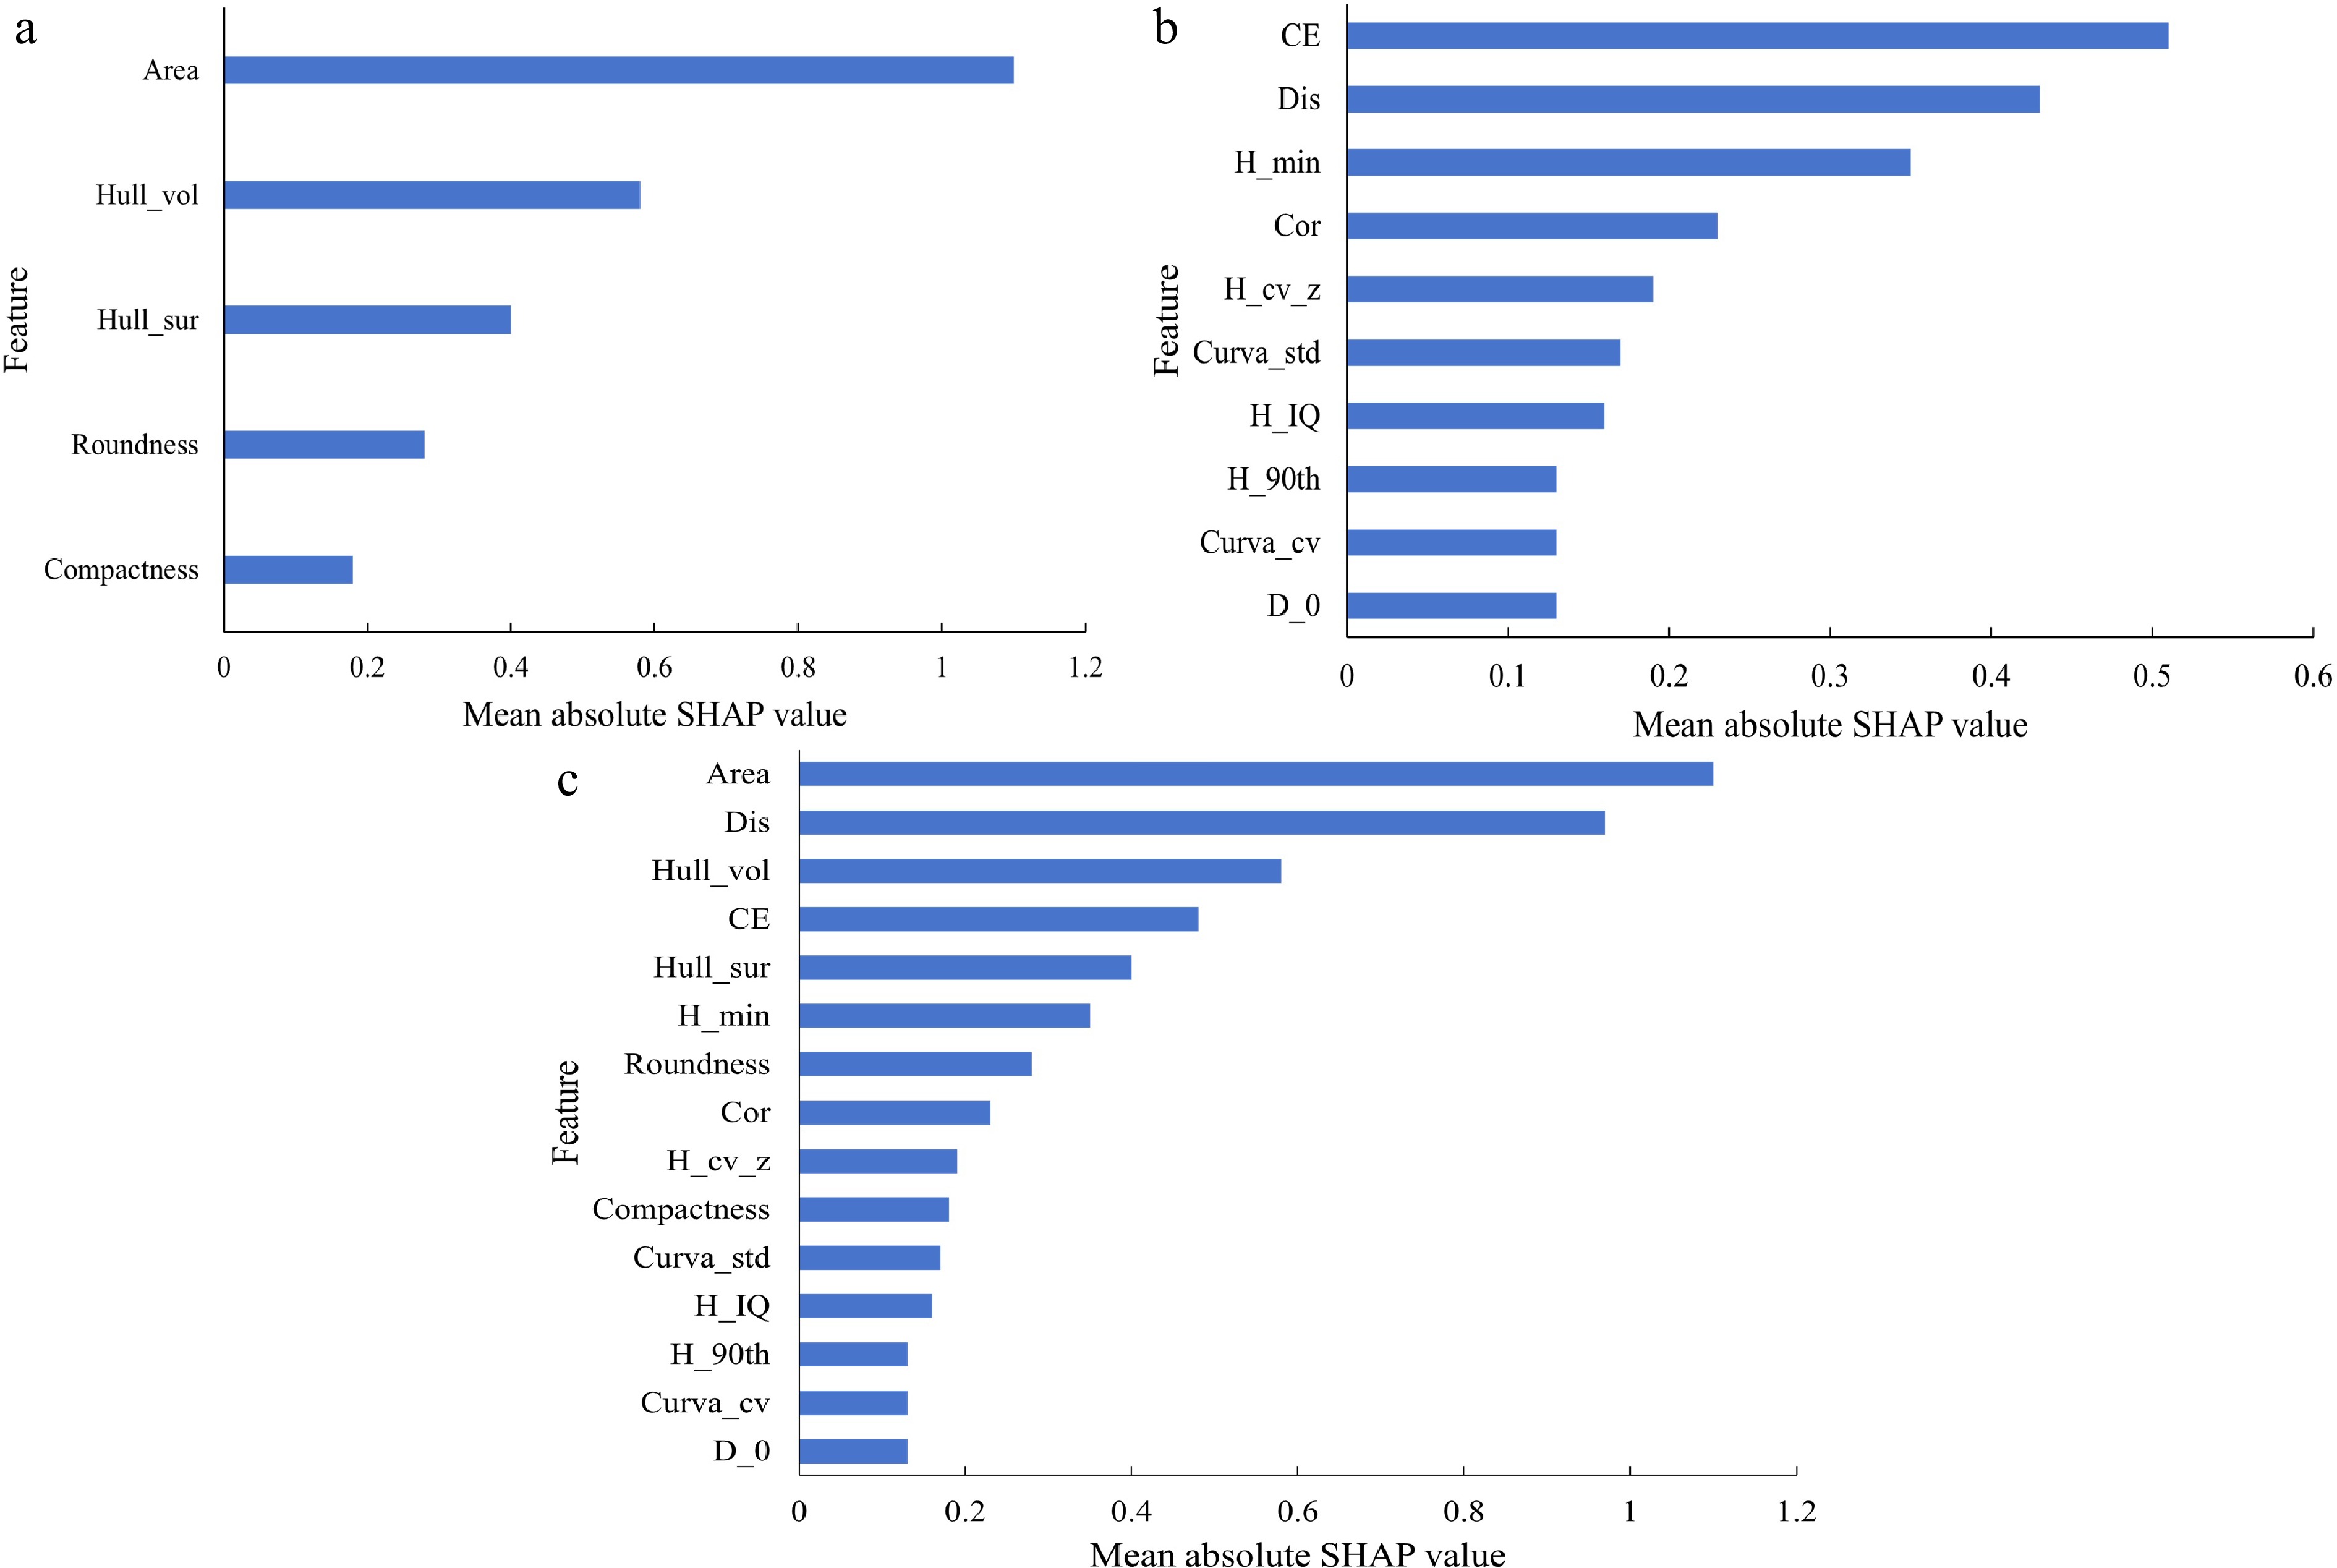
Figure 8.
Results of feature selection using RFE-SHAP. (a) Top 5 geometric descriptors; (b) top 10 point cloud structural features; (c) 15 integrated features.
Further feature importance analysis revealed clear differences among recognition unit types in both the geometric descriptors and point cloud structural features (Fig. 9). Specifically, geometric features showed stronger discriminative ability for single-culm units, whereas point cloud structural features were more robust under multiculm occlusion.
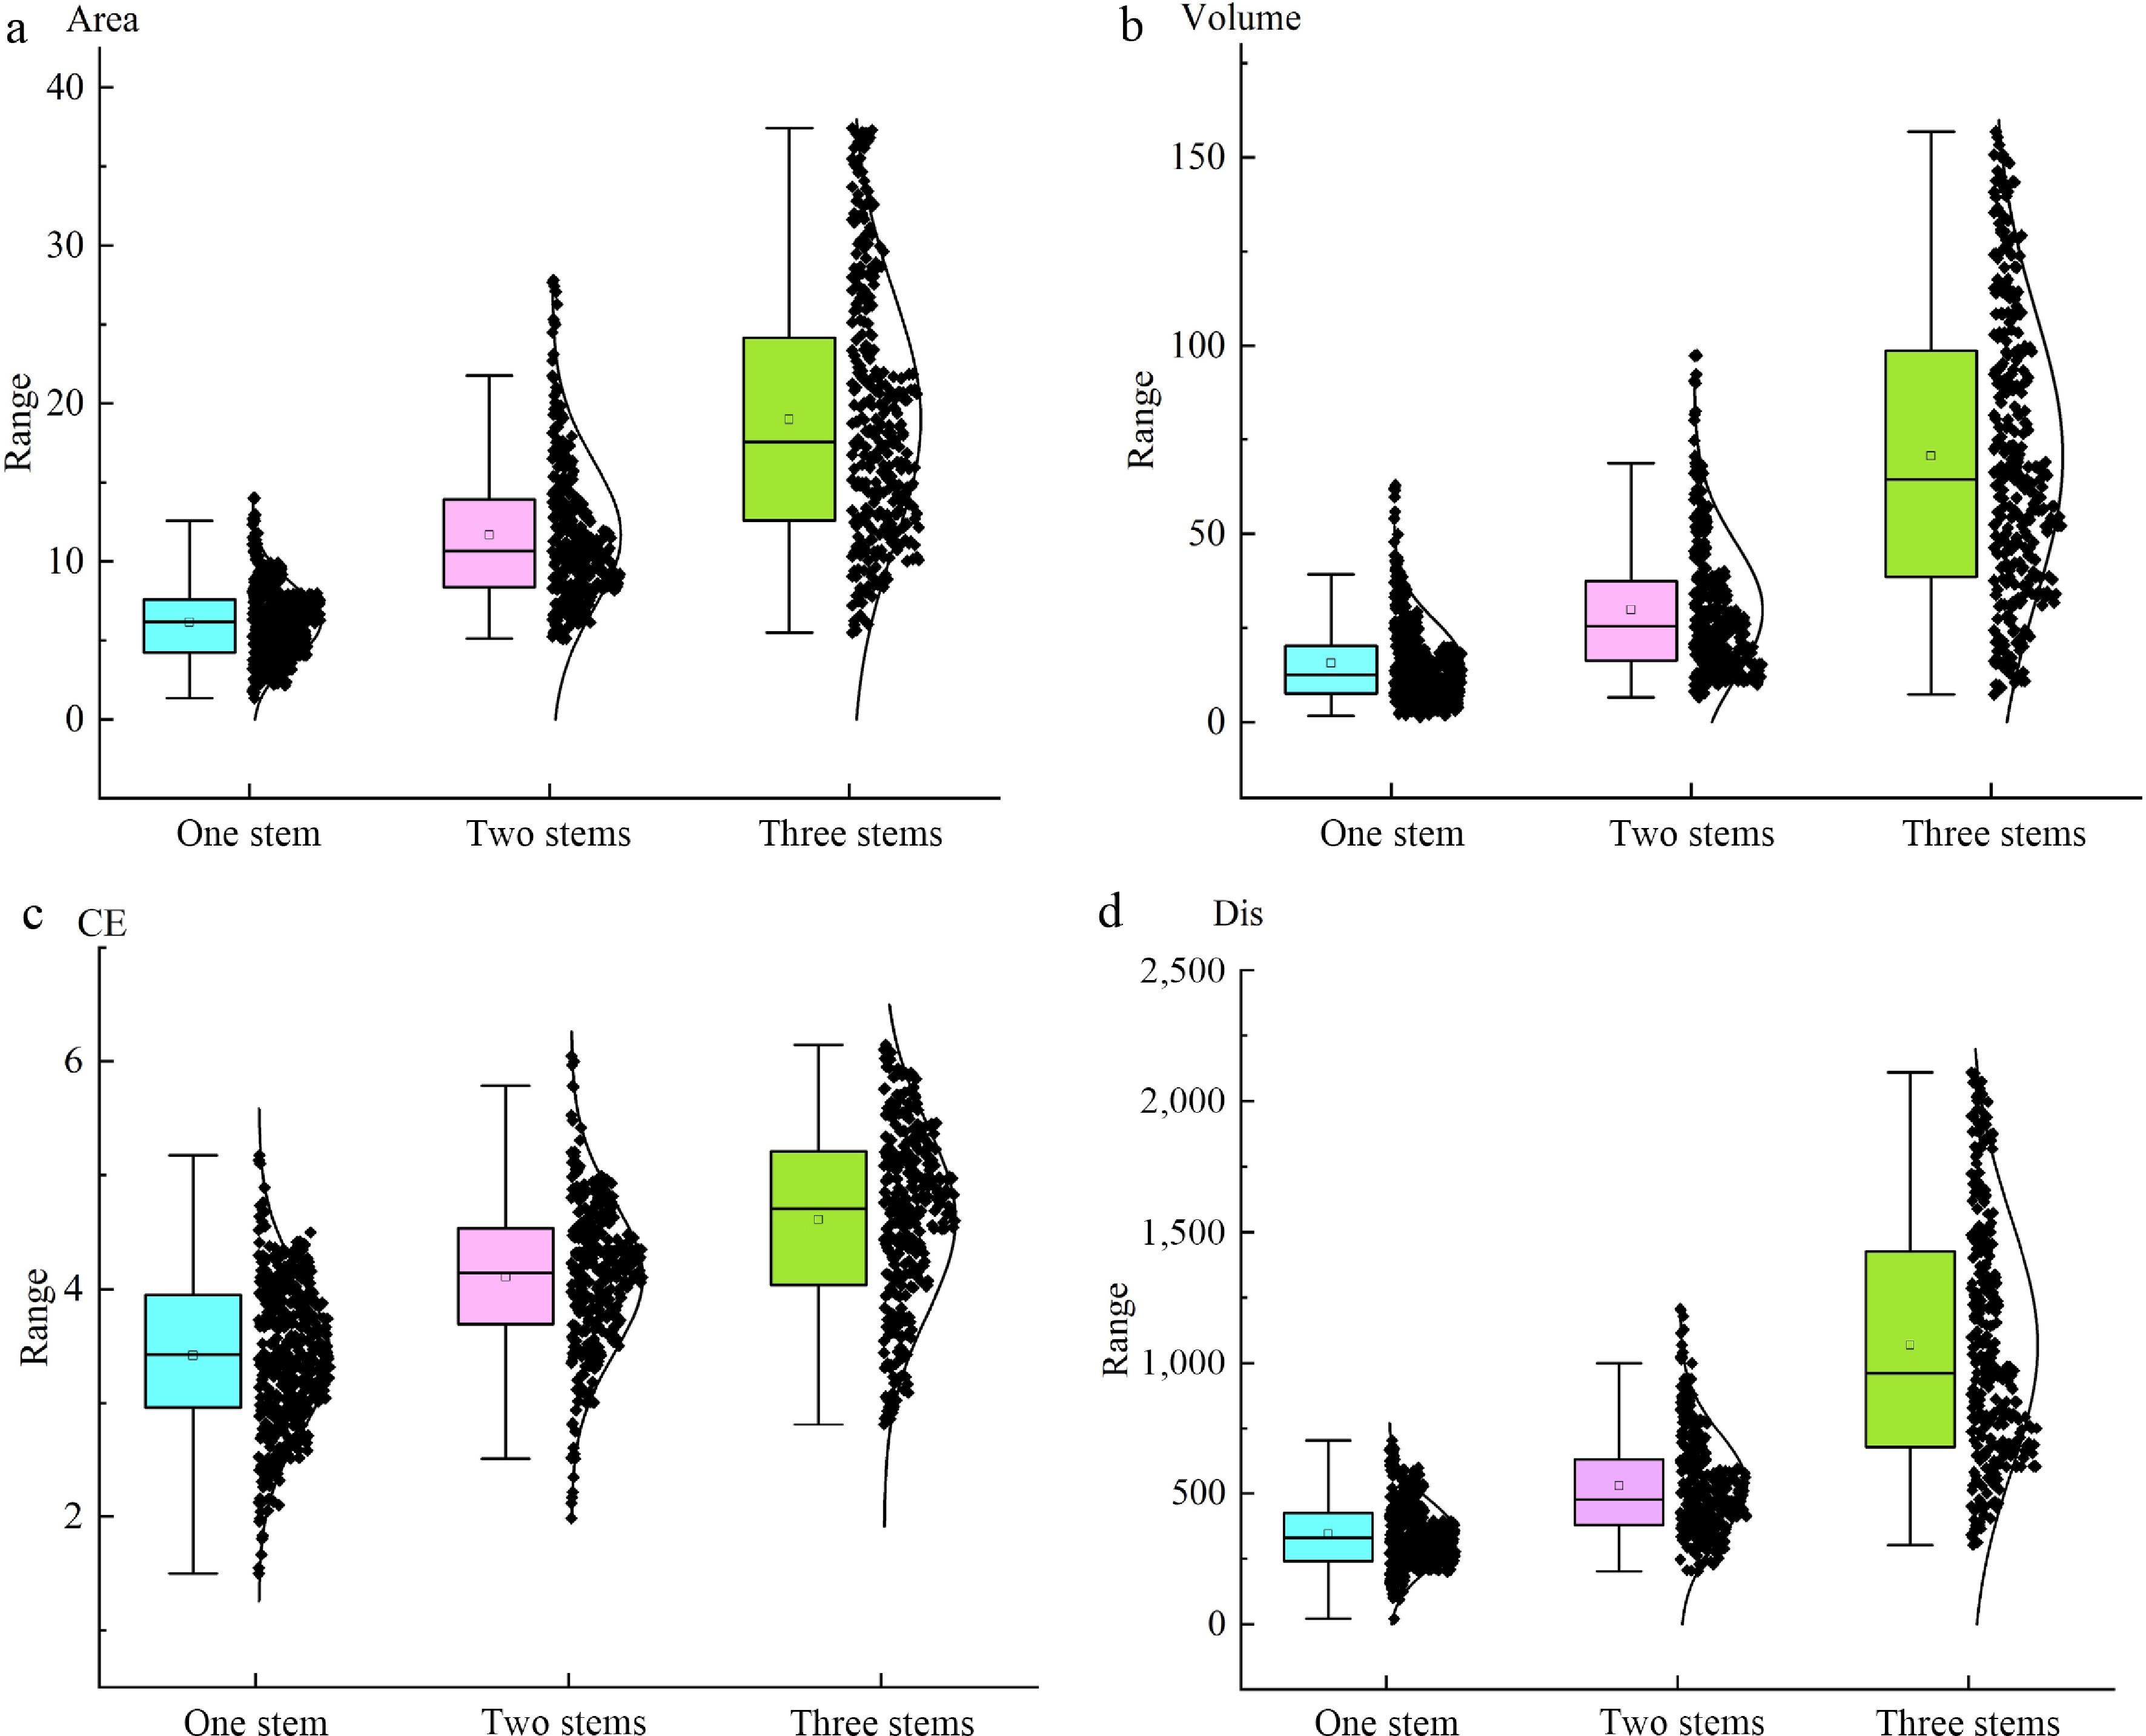
Figure 9.
Feature differences among different recognition units (single, two, and three culms). (a) Area; (b) Hull_Vol; (c) CE; (d) dissimilarity (Dis).
These selected feature subsets were subsequently used to develop machine learning classifiers for identifying recognition units under different occlusion conditions.
Recognition unit classification results and selection of the optimal model
-
Using the selected feature subsets, the RF, SVM, and KNN classifiers were evaluated to assess their recognition unit classification performance under varying levels of canopy occlusion. The classification results obtained from the geometric, structural, and combined feature sets are summarized in Table 5.
Table 5. Classification performance of different feature sets and machine learning models.
Feature set Model Accuracy F1
(Single culm)F1
(Two culms)F1
(Three culms)Geometric RF 0.76 0.87 0.69 0.60 SVM 0.67 0.78 0.58 0.56 KNN 0.71 0.82 0.61 0.62 Structural RF 0.74 0.80 0.71 0.65 SVM 0.67 0.73 0.62 0.64 KNN 0.70 0.74 0.66 0.67 Combined RF 0.80 0.92 0.69 0.75 SVM 0.75 0.84 0.66 0.69 KNN 0.79 0.85 0.71 0.71 Overall, classification performance varied substantially among feature sets and machine learning algorithms. RF consistently achieved the highest accuracy across most feature sets, whereas the combined feature set generally produced the best overall classification results.
Models based on geometric features showed strong discriminative ability for single-culm recognition units. RF achieved an F1 score of 0.87 for single-culm units; however, classification performance decreased as canopy overlap increased, with the F1 score declining to 0.60 for three-culm units. This indicates that geometric descriptors alone become less effective when the crown boundaries were increasingly obscured by canopy overlap.
Compared with geometric features, point cloud structural features demonstrated greater robustness under multiculm occlusion conditions. Although the F1 scores for single-culm units were slightly lower, classification performance for two- and three-culm units improved. For example, RF achieved F1 scores of 0.71 and 0.65 for two- and three-culm units, respectively, suggesting that structural descriptors better capture internal canopy complexity under overlapping conditions.
The integration of geometric and structural features further improved the recognition performance across all recognition unit types. Among all evaluated models, RF combined with the integrated feature set achieved the highest overall accuracy (0.80). The corresponding F1 scores reached 0.92, 0.69, and 0.75 for single-, two-, and three-culm units, respectively. These results demonstrate that the complementary information provided by geometric and structural features enhances the discrimination of recognition units under varying canopy occlusion levels.
To provide a more detailed evaluation of the optimal classifier, the confusion matrix of the RF model is presented in Table 6. The model achieved an overall accuracy of 80.12% and a Kappa coefficient of 0.698. For single-culm units, producer's and user's accuracies reached 90.98% and 93.08%, respectively. Lower accuracies were observed for two- and three-culm units, with most misclassifications occurring between these two categories. Specifically, 32 of the 96 true three-culm units were misclassified as two-culm units, resulting in an underestimation of the three-culm class. Consequently, the two-culm category received a substantial number of false positive samples and showed an overclassification tendency. These results indicate that increasing canopy overlap substantially increased the difficulty of classification.
Table 6. The RF model's identification results.
Recognition unit Single
culmTwo
culmsThree
culmsTotal Producer's
accuracy (%)Single culm 121 9 0 130 93.08 Two culms 12 73 11 96 76.04 Three culms 0 32 64 96 66.67 Total 133 114 75 322 − User's accuracy (%) 90.98 64.04 85.33 Total accuracy (%) − − − − 80.12 Kappa coefficient − − − − 0.698 Overall accuracy = 80.12%; Kappa = 0.698. Rows correspond to the true reference classes, and columns correspond to the model-predicted classes. Row totals indicate the number of samples for each true class, and column totals indicate the number of samples assigned to each predicted category. Diagonal values represent correctly classified samples; off-diagonal values denote misclassified samples. To further investigate the causes of classification errors, height dispersion metrics were compared between correctly and incorrectly classified recognition units (Fig. 10).
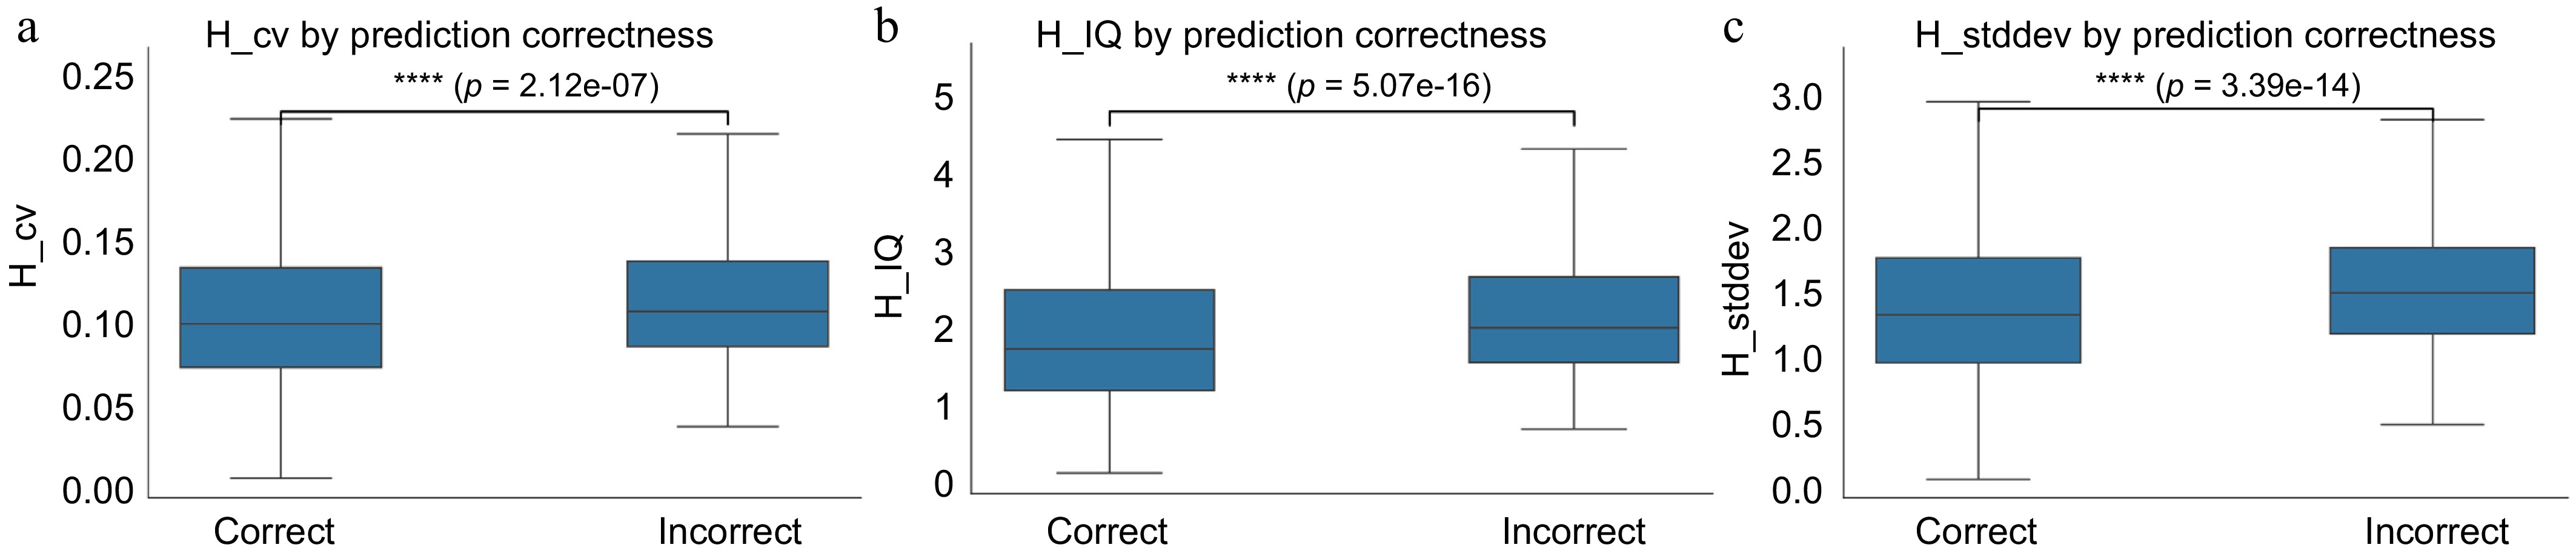
Figure 10.
Comparison of height dispersion metrics between correctly and incorrectly classified recognition units. (a) Coefficient of variation of height (H_cv); (b) interquartile range of height (H_IQ, m); (c) standard deviation of height (H_stddev, m). The Mann–Whitney U-test was adopted to detect statistical differences between groups. Horizontal lines with significance markers denote significant differences between the two groups (****, p < 0.001). H_cv represents the coefficient of variation of point height within each recognition unit; H_IQ is the interquartile range of point height; H_stddev denotes the standard deviation of point height.
Figure 10 illustrates the group differences in three height dispersion metrics: the coefficient of variation of height (H_cv), interquartile range of height (H_IQ), and standard deviation of height (H_stddev). The Mann–Whitney U-test confirmed that misclassified units exhibited significantly higher H_cv, H_IQ and H_stddev than correctly classified units (p < 0.001). Specifically, erroneous samples presented larger H_IQ, higher H_stddev, and elevated H_cv, which reflect greater dispersion in the vertical structure and internal complexity. This indicates that strong vertical heterogeneity within recognition units obscures structural distinctions among single-culm, two-culm, and three-culm units, increasing the uncertainty of classification. Overall, the RF model built using integrated geometric and point cloud structural features achieved optimal classification accuracy and was adopted for subsequent estimations of stand density.
Recognition unit-based stand density estimation results
-
Using the recognition unit classification results generated by the optimal RF model, stand density was estimated through weighted aggregation and validated against field measurements. Comparisons between predicted and measured stand densities at the plot level revealed satisfactory overall consistency. Most plots exhibited minor deviations, whereas larger estimation errors occurred for plots with a higher proportion of three-culm recognition units, indicating that severe canopy occlusion constitutes an important source of estimation uncertainty. The overall estimation achieved high accuracy, with R2 = 0.95, root mean squared error (RMSE) = 200.6 culms ha−1, and mean absolute error (MAE) = 195.0 culms ha−1.
Because plot-level validation was based on only nine plots, the paired t-test was used only to evaluate whether a detectable mean bias was present, rather than to demonstrate statistical equivalence. The mean bias (predicted – measured) was 9.78 culms plot−1, with a 95% confidence interval of –2.60 to 22.15 culms plot−1. Expressed as stand density, this corresponds to 108.6 culms ha−1, with a 95% confidence interval of –28.9 to 246.1 culms ha−1. As shown in Table 7, therefore, the validation results indicate close plot-level correspondence, but the small sample size limits the strength of statistical inference.
Table 7. Results of the paired-sample t-test between predicted and field-measured culm counts at the plot level.
Variable Mean
(culms plot−1)Standard deviation (culms plot−1) Standard error (culms plot−1) t df p Measured vs. predicted −9.78 16.10 5.37 −1.82 8 0.11 As shown in Table 8, the proposed recognition unit-based weighted aggregation method achieved more accurate plot-level culm count estimates than direct counting based on the PCS segmentation results. It achieved an MAE of 17.6 culms per plot, an RMSE of 18.1 culms per plot, and a mean relative error of 8.3%. The PCS-based individual segmentation method, by contrast, yielded an MAE of 42.7 culms per plot, an RMSE of 50.0 culms per plot, and a mean relative error of 17.6%. Relative to PCS segmentation, the proposed method reduced MAE by approximately 59%, RMSE by 64%, and mean relative error by more than half. In severely occluded plots, relative errors remained below 10% for the proposed method but reached 20%–30% for the PCS baseline.
Table 8. Comparison of measured and estimated bamboo culm counts using PCS segmentation and the proposed recognition unit method.
Sample
plot No.Measured culms
(culms plot−1)Predicted culms
(culms plot−1)Relative error (%) PCS culms (culms plot−1) Relative error (%) 1 281 295 5.0 189 32.7 2 159 183 15.1 164 3.1 3 303 290 4.3 256 15.5 4 238 257 8.0 207 13.0 5 156 167 7.1 181 16.0 6 197 216 9.6 159 19.3 7 307 285 7.2 229 25.4 8 158 173 9.5 137 13.3 9 233 254 9.0 186 20.2 Mean relative error (%) 8.3 17.6 MAE (culms plot−1) 17.6 42.7 RMSE (culms plot−1) 18.1 50.0 Relative error (%) = |estimated – measured|/measured × 100%, where "measured" is the field-measured culm count per plot (30 m × 30 m), "estimated" is the culm count estimated by recognition units and "PCS estimated culms" are outputs derived by PCS. Although the estimation accuracy was generally high, variations in estimation error were observed among plots. To examine whether these variations were associated with the environmental conditions, plot-level Spearman correlation analysis was conducted between the mean absolute relative error and site factors (Table 9).
Table 9. Plot-level Spearman correlation between mean absolute relative error and site factors.
Variable Spearman p-value Stand density −0.172 0.382 Slope 0.330 0.086 Altitude −0.079 0.690 As shown in Table 9, stand density, slope, and altitude all exhibited weak correlations with the mean absolute relative error, with Spearman coefficients of −0.172, 0.330, and −0.079, respectively. None of these relationships were statistically significant (p > 0.05). These results imply that site conditions (stand density, slope, altitude) do not strongly drive estimation error. Estimation uncertainty is more likely linked to the composition of recognition units and canopy occlusion.
In terms of error characteristics, the accuracy of stand density estimation varied across plots with different recognition unit compositions. In plots dominated by single-culm units, stand density estimation errors were generally small. In plots where two-culm units predominated, errors increased slightly, although overall accuracy remained high. By contrast, plots with a higher proportion of occluded multiculm units exhibited greater estimation errors. These results suggest that uncertainty in stand density estimation increases with the number of culms per recognition unit and the degree of canopy occlusion.
Overall, the proposed recognition unit-based weighted aggregation method maintained stable stand density estimation performance across plots, despite increased uncertainty under severe multiculm occlusion. These results demonstrate the effectiveness of integrating recognition unit classification with weighted aggregation for estimating stand density in dense Moso bamboo forests.
-
This study systematically evaluated the discriminative roles of geometric and point cloud structural features for recognizing Moso bamboo units under different occlusion levels. The results showed that point cloud structural features were more robust than geometric features as canopy occlusion increased, but combining the two feature groups consistently improved classification performance across all recognition unit types.
Geometric features (e.g., area and volume) mainly describe the external canopy shape in the horizontal and vertical dimensions. Under single-culm or weakly occluded conditions, these descriptors can effectively represent the spatial extent of individual bamboo crowns, resulting in strong discrimination of single-culm units. However, as the number of culms increased and crown overlap becomes more severe, canopy boundaries become less distinct, reducing the ability of geometric features to separate adjacent canopy elements. This likely explains their lower stability for multiculm recognition units.
By contrast, point cloud structural features characterize the vertical distribution and internal organization of predicted canopy counts, thereby partially compensating for information loss caused by occlusion. For example, canopy entropy (CE) reflects internal structural complexity and was generally higher in multiculm units, indicating more heterogeneous and vertically stratified canopy organization. The point cloud dissimilarity index (Dis) describes spatial dispersion and effectively captured the increased structural complexity associated with overlapping crowns. Because these descriptors depend less on clear canopy boundaries, they remained more stable under dense canopy conditions.
The RFE-SHAP results further highlighted the complementary relationship between geometric and structural features. Feature dimensionality was substantially reduced with little loss of predictive performance, and the retained variables showed clear physical interpretability. Geometric features mainly provided information on canopy shape and spatial extent, whereas structural features captured internal density, texture, and heterogeneity. Their feature-level integration therefore enabled a more complete representation of canopy structure without requiring multisensor data fusion. This may explain why models with combined features consistently outperformed models based on either feature group alone.
Model performance differences based on recognition units
-
Three representative machine learning models (RF, SVM, and KNN) were evaluated under different recognition unit conditions. Among them, RF combined with the integrated feature set achieved the best overall performance for single-, two-, and three-culm units, with F1 scores of 0.92, 0.69, and 0.75, respectively. This likely reflects the ability of RF to model complex nonlinear relationships and interactions among multidimensional features while maintaining robustness to noise and correlated variables. Misclassified units showed significantly higher values of H_cv, H_IQ, and H_stddev than correctly classified units (p < 0.001), indicating that classification errors were closely associated with increased vertical structural heterogeneity. Greater height variability within recognition units likely reflects stronger canopy overlap and more complex vertical organization, which can blur class boundaries and reduce features' separability.
Although feature fusion substantially improved the classification accuracy, the performance for multiculm units remained lower than that for single-culm units, particularly for three-culm units. This finding is consistent with previous studies[32]. The reduced performance is mainly attributable to increased canopy overlap within multiculm units, which introduces multiple sources of uncertainty. On the one hand, overlapping crowns blur individual geometric boundaries, increasing the likelihood of feature confusion. On the other hand, occlusion effects in high-density canopies reduce the completeness of sampling in the lower and inner canopy layers, thereby weakening the ability of structural features to capture individual differences. In addition, under limited point cloud density, structural information from multiculm canopies is more likely to be compressed, further constraining the model's ability to discriminate complex structures[33−37]. The geometric and point cloud structural features extracted in this study are sensitive to the data's resolution. After preprocessing, point cloud density across plots ranged from 1,214.40 to 4,572.96 points m−2, with a mean of 2,258.84 points m−2. However, in areas with severe canopy overlap, LiDAR occlusion reduces the number of effective returns and leads to incomplete spatial sampling. This point cloud sparsification lowers the discriminability of structural features (e.g., texture and curvature) and blurs the geometric outline features, thereby exacerbating feature mixing.
Compared with existing approaches for handling overlapping canopies, the recognition unit strategy proposed in this study offers distinct advantages in complex bamboo forest environments. Unlike deep learning methods that rely on highly accurate segmentation of individual trees or instances, the recognition unit approach does not require precise delineation of the individual boundaries. Instead, it constructs multiculm occlusion units and treats canopy overlap as an intrinsic structural attribute, thereby reducing the cumulative impact of segmentation errors on estimations of stand density. This strategy is more robust and easier to implement when data are limited or canopy overlap is severe. However, it is limited by the need to predefine the recognition unit categories, and multiculm units inevitably lose fine-scale individual-level structural information. Therefore, the method may be less suitable for applications requiring precise retrieval of individual culms' parameters.
Despite these advantages, classification errors may still influence the subsequent process of estimating stand density. Because fixed weights based on the number of culms were assigned to recognition unit classes, misclassification between two-culm and three-culm units may propagate into density estimates. However, most classification errors occurred between adjacent classes with relatively small differences in the number of culms, limiting their influence on the final estimates. Furthermore, stand density was derived through weighted aggregation across numerous recognition units within each plot, which tended to reduce the impact of local classification errors through error compensation. This interpretation is consistent with the paired-sample test results, which indicated no statistically significant difference was detected between estimated and field-measured stand density. Future studies could incorporate class probabilities, probabilistic weighting schemes, or uncertainty propagation methods to explicitly quantify the confidence intervals associated with stand density predictions.
Limitations and future improvements
-
Although the proposed recognition unit classification inversion framework showed good robustness under typical canopy occlusion conditions, several limitations remain.
First, terrain factors can substantially affect the accuracy of LiDAR-based point cloud normalization. In Moso bamboo stands located on steep slopes (e.g., > 30°), errors in ground point filtering and interpolation often increase in a nonlinear manner with slope, which may distort the CHM and consequently degrade the accuracy of extracting crown geometric features such as crown volume and height.
Second, the current framework relies primarily on structural information from LiDAR data. Integrating additional data sources may further improve canopy characterization. For example, hyperspectral imagery could provide complementary spectral information for separating understory vegetation, dead culms, or canopy health conditions, whereas multiview point clouds may help reduce information loss caused by laser occlusion. Future studies should therefore explore joint structural–spectral feature spaces based on UAV–LiDAR and imaging sensors.
Third, although conventional machine learning models performed well in this study, more advanced learning frameworks may further improve recognition under severe occlusion. Deep learning approaches, such as instance segmentation or graph neural networks, may better capture the spatial topology and interactions among neighboring culms within recognition units.
Finally, the transferability of the proposed framework should be further evaluated across broader forest conditions. Forest types with dense canopies and overlapping crowns, such as conifer plantations or tropical broadleaf forests, may provide suitable test cases for assessing the general applicability of the method.
-
Using UAV–LiDAR point cloud data, we proposed a stand density estimation method using multiscale recognition units to address the difficulty of individual-level bamboo segmentation in Moso bamboo forests caused by canopy overlap and curved culm tips. Stand density estimation from the recognition unit scale to the plot scale was enabled by grouping spatially inseparable bamboo individuals into recognition units containing different numbers of culms and discriminating them using an integrated feature set composed of geometric–morphological and point cloud structural descriptors derived from the same UAV–LiDAR dataset.
The results indicated that under complex canopy structures, point cloud structural features are the key drivers of accuracy in stand density estimation. In contrast, geometric–morphological features mainly provided information on the outer canopy's outline and were relatively less stable under multiculm occlusion. The recognition unit-based weighted aggregation strategy effectively integrates classification information under multiculm occlusion and enables robust stand density estimation for Moso bamboo forests without relying on fine-scale individual segmentation.
Although uncertainty in stand density estimation increased with a higher number of culms per recognition unit and stronger canopy occlusion, the overall error remained within an acceptable range, indicating that the proposed method is well suited to high-density Moso bamboo forests with severe occlusion. Compared with conventional stand density inversion approaches that depend on fine-scale individual segmentation, this study provides a more robust and operational pathway for monitoring Moso bamboo's abundance under complex canopy conditions.
-
This accompanies this paper online at: https://doi.org/10.48130/smartfor-0026-0011.
-
The authors confirm their contributions to the paper as follows: study conception and design: Zhang Y, Song H, Li M, Yu K, Liu J; data collection: Yu Z, Huang D, Huang W; analysis and interpretation of results, draft manuscript preparation: Zhang Y. All authors reviewed the results and approved the final version of the manuscript.
-
The raw UAV–LiDAR point cloud data cannot be publicly shared because of project and intellectual property restrictions. Sample datasets containing recognition unit feature matrix and class labels are available from the corresponding author upon reasonable request.
-
The authors declare that they have no conflict of interest.
- Supplementary Table S1 Optimal hyperparameter combinations determined by grid search.
- This article is an open access article distributed under Creative Commons Attribution License (CC BY 4.0), visit https://creativecommons.org/licenses/by/4.0/.
-
About this article
Cite this article
Zhang Y, Song H, Li M, Yu Z, Huang D, et al. 2026. Estimating stand density of Moso bamboo forests through recognition unit classification using UAV–LiDAR-derived geometric and structural features. Smart Forestry 1: e014 doi: 10.48130/smartfor-0026-0011 

Estimating stand density of Moso bamboo forests through recognition unit classification using UAV–LiDAR-derived geometric and structural features
- Received: 03 December 2025
- Revised: 22 July 2026
- Accepted: 30 July 2026
- Published online: 31 August 2026
Abstract: Moso bamboo (Phyllostachys edulis) is a major component of China's forest resources, and accurate estimations of stand density are essential for effective management. However, traditional approaches remain hindered by high canopy closure, bent upper culms, and crown overlap. To address these limitations, we developed a recognition unit framework based on unmanned aerial vehicle (UAV)–light detection and ranging (LiDAR) point clouds without requiring single-culm segmentation. Three categories (single-culm, two-culm occluded, and three-culm occluded) were defined. Geometric and point cloud structural descriptors were extracted using concave hull reconstruction, voxel-based texture metrics, and singular value decomposition. Key predictors were selected via recursive feature elimination based on SHapley Additive exPlanations (SHAP) values (RFE-SHAP), and performance across unit types was evaluated using Random Forest and other machine-learning classifiers. The results indicated three main findings. First, feature-level integration of geometric and point cloud structural descriptors derived from the same UAV–LiDAR dataset improved classification robustness, with Random Forest achieving F1 scores of 0.92, 0.69, and 0.75 for the single-, two-, and three-culm units, respectively. Second, geometric descriptors performed best for single-culm units (F1 = 0.87), whereas point cloud structural descriptors were more robust under occlusion, maintaining an F1 score of 0.65 in three-culm units and outperforming geometry-only features (F1 = 0.60). Third, the model achieved an overall accuracy of 80.12% and a Kappa coefficient of 0.698, although the estimation uncertainty increased with increasing canopy occlusion. Based on weighted aggregation of classified recognition units, stand density estimation showed strong agreement with field measurements (R2 = 0.95, root mean squared error = 200.6 culms ha−1, and mean absolute error = 195.0 culms ha−1), with no significant difference detected by the paired-sample t-test (p > 0.05). Overall, the proposed approach enabled reliable estimations of stand density under dense Moso bamboo canopies and provides a practical framework for ecological monitoring and evidence-based management.
-
Key words:
- Phyllostachys edulis /
- Stand density /
- Recognition units /
- UAV–LiDAR