













-
With advances in high throughput sequencing, together with improvements in genome assembly algorithms, an increasing number of species genomes have been sequenced and released. These data provide an important foundation for further biological studies, including gene function research, comparative genomic analysis, and evolutionary analysis. However, as accessible genome data continue to expand, effective management and use of these resources have become a new challenge for biologists, especially those with limited programming skills. This challenge is evident in two ways. First, unlike well-studied species such as Arabidopsis thaliana and rice (Oryza sativa), most published genomes provide only sequence and annotation files. Further data exploration requires custom scripts or additional tools, such as TBtools-II[1]. Second, many species, and even the same accession, may have undergone multiple genome assembly updates, resulting in several versions, as seen in strawberry (Fragaria × ananassa)[2−5] and maize (Zea mays)[6−8]. Moreover, although model species such as A. thaliana[9,10] and rice[11] have high-quality genome assemblies, their annotation information has been updated over time. Therefore, the rapid accumulation of genome data is no longer a matter of storage. It has become a problem of data management and utilization.
To solve these problems, two main categories of tools have long been available. The first category comprises genome database websites, as mentioned above, which focus on the collection, retrieval, and storage of data resources. Examples include SapBase and Ananas Genomics Database[12]. These resources are usually deployed as centralized online servers and have facilitated data analysis for many researchers. The second category comprises data analysis tools, which focus on the implementation of analytical algorithms or functional modules. These include command line tools such as BLAST[13] and IQ-TREE[14], as well as online or local tools with user-friendly interfaces such as eggNOG-mapper[15] and TBtools-II. Notably, many genome databases also provide basic data analysis functions[12]. However, substantial room for improvement remains in database maintenance and in the flexible, customized use of data. Key limitations include data updates, rapid integration between data resources and analytical functions, allocation of computational resources for intensive analysis tasks, and efficient data transfer. Together, these limitations affect the efficiency of data exploration by researchers.
Overall, we still need a readily deployable genome data management tool that can be used independently and efficiently. Such a tool should support robust genome version management. It should also enable seamless integration of data resources and analytical functions, thereby accelerating genome data exploration and providing a framework suitable for artificial intelligence (AI)-driven analysis. To this end, we developed Simple Genome Hub (SGH), a cross-platform tool for local genome data management and analysis. The tool is designed to relieve researchers from laborious manual data management. It can be used without extensive prior knowledge, supports structured management of omics data and efficient extraction of biological information, and ensures that analytical data can be preserved over the long term and traced to their sources.
-
Simple Genome Hub (SGH) is a local platform for genome management and workflow analysis that is centered on data. Its core design is to organize and store genomes and related files in a standardized file tree, allowing integrated analysis tools to recognize and access these resources rapidly and consistently. During import, the software calls the 'GXF Fix' and 'GXF Genome Match Test tools' in TBtools-II (v2.540) to check and repair the correspondence between the input genome and annotation files under a unified standard[16]. These files are then stored as core data unit files. The software subsequently builds a genome sequence index using a method that follows the faidx specification, and generates transcript, coding sequence (CDS), and protein sequence files. When users access a data unit, the software retrieves the complete metadata from standardized paths and accurately extracts and displays all derived information associated with the genome's data unit.
Design of integrated analysis tools
-
SGH integrates TBtools-II (v2.540), a Java implementation of eggNOG-mapper (v0.1-DIAMOND only,
https://github.com/taaan-k/eggnog-mapper-java-DiamondOnly ), BLAST+ (v2.12.0), and native tools to build six downstream analysis toolkits: Sequence Tools, Gene Info., Gene Expression, Function Annotation, Genome Analysis, and BLAST Analysis[13,15,16]. All tools are implemented with Java Swing, which supports tool invocation, connections between tools, and interactive graphical interfaces. The relationships among genes, transcripts, and proteins are established from the parent ID, gene_ID, and transcript_ID attributes in the annotation files. For analyses that involve multiple tools, intermediate files are automatically converted in the background according to the input and output requirements of each tool.The Auto Function Annotations, Multiple Synteny, Explore Expression Data, and Gene Ontology/Kyoto Encyclopedia of Genes and Genomes (GO/KEGG) Enrichment Analysis tools provide interactive controls that automatically build workflows specified by the user. In Auto Func. Annotations, representative protein sequences are automatically extracted as input. The corresponding eggNOG database is then downloaded according to the species group, and annotation is performed by calling the eggNOG-mapper with a DIAMOND search[15]. In the GO/KEGG Enrichment Analysis tools, enrichment p-values are calculated on the basis of the overlap between the input gene set and each functional term, and multiple testing correction is performed using the Benjamini–Hochberg method[17]. Results can be filtered by the raw p-value or adjusted false discovery rate (FDR) and displayed as an interactive matrix. During data exploration, sample correlations are calculated using the Pearson correlation coefficient, and tissue specificity is calculated using the Tau (τ) specificity index (TAU index). In the Multiple Synteny tool, users can first arrange genomes freely in draft mode. Position boundaries are standardized using grid references and automatic boundary snapping. During link curve construction, collision boxes are added to the genomes, and Bézier reference paths between genomes are drawn automatically based on collision and overlap relationships. After the draft is confirmed, a sequence of pairwise genome comparison tasks is created according to the specified plan. Pairwise genome comparisons are then performed by calling 'One Step MCScanX (Pure Java)' in TBtools-II[18]. All results and analysis files are visualized by calling the JIGplot graphics engine in TBtools-II.
-
Genome data mining is typically based on the genome sequence of the target species and its gene structure annotation. The former provides the genomic DNA sequence, whereas the latter defines the genomic coordinates of genes. Nearly all omics analyses, including common transcriptome analyses and comparative genomic analyses, generate results that are associated with a specific version of the reference genome. Similarly, in experimental studies focused on gene function, the transcript or protein sequences used as references also correspond directly to a specific genome assembly and annotation version. We therefore propose a genome data management model that uses one genome sequence together with its corresponding gene structure annotation as a single data unit (Fig. 1a).
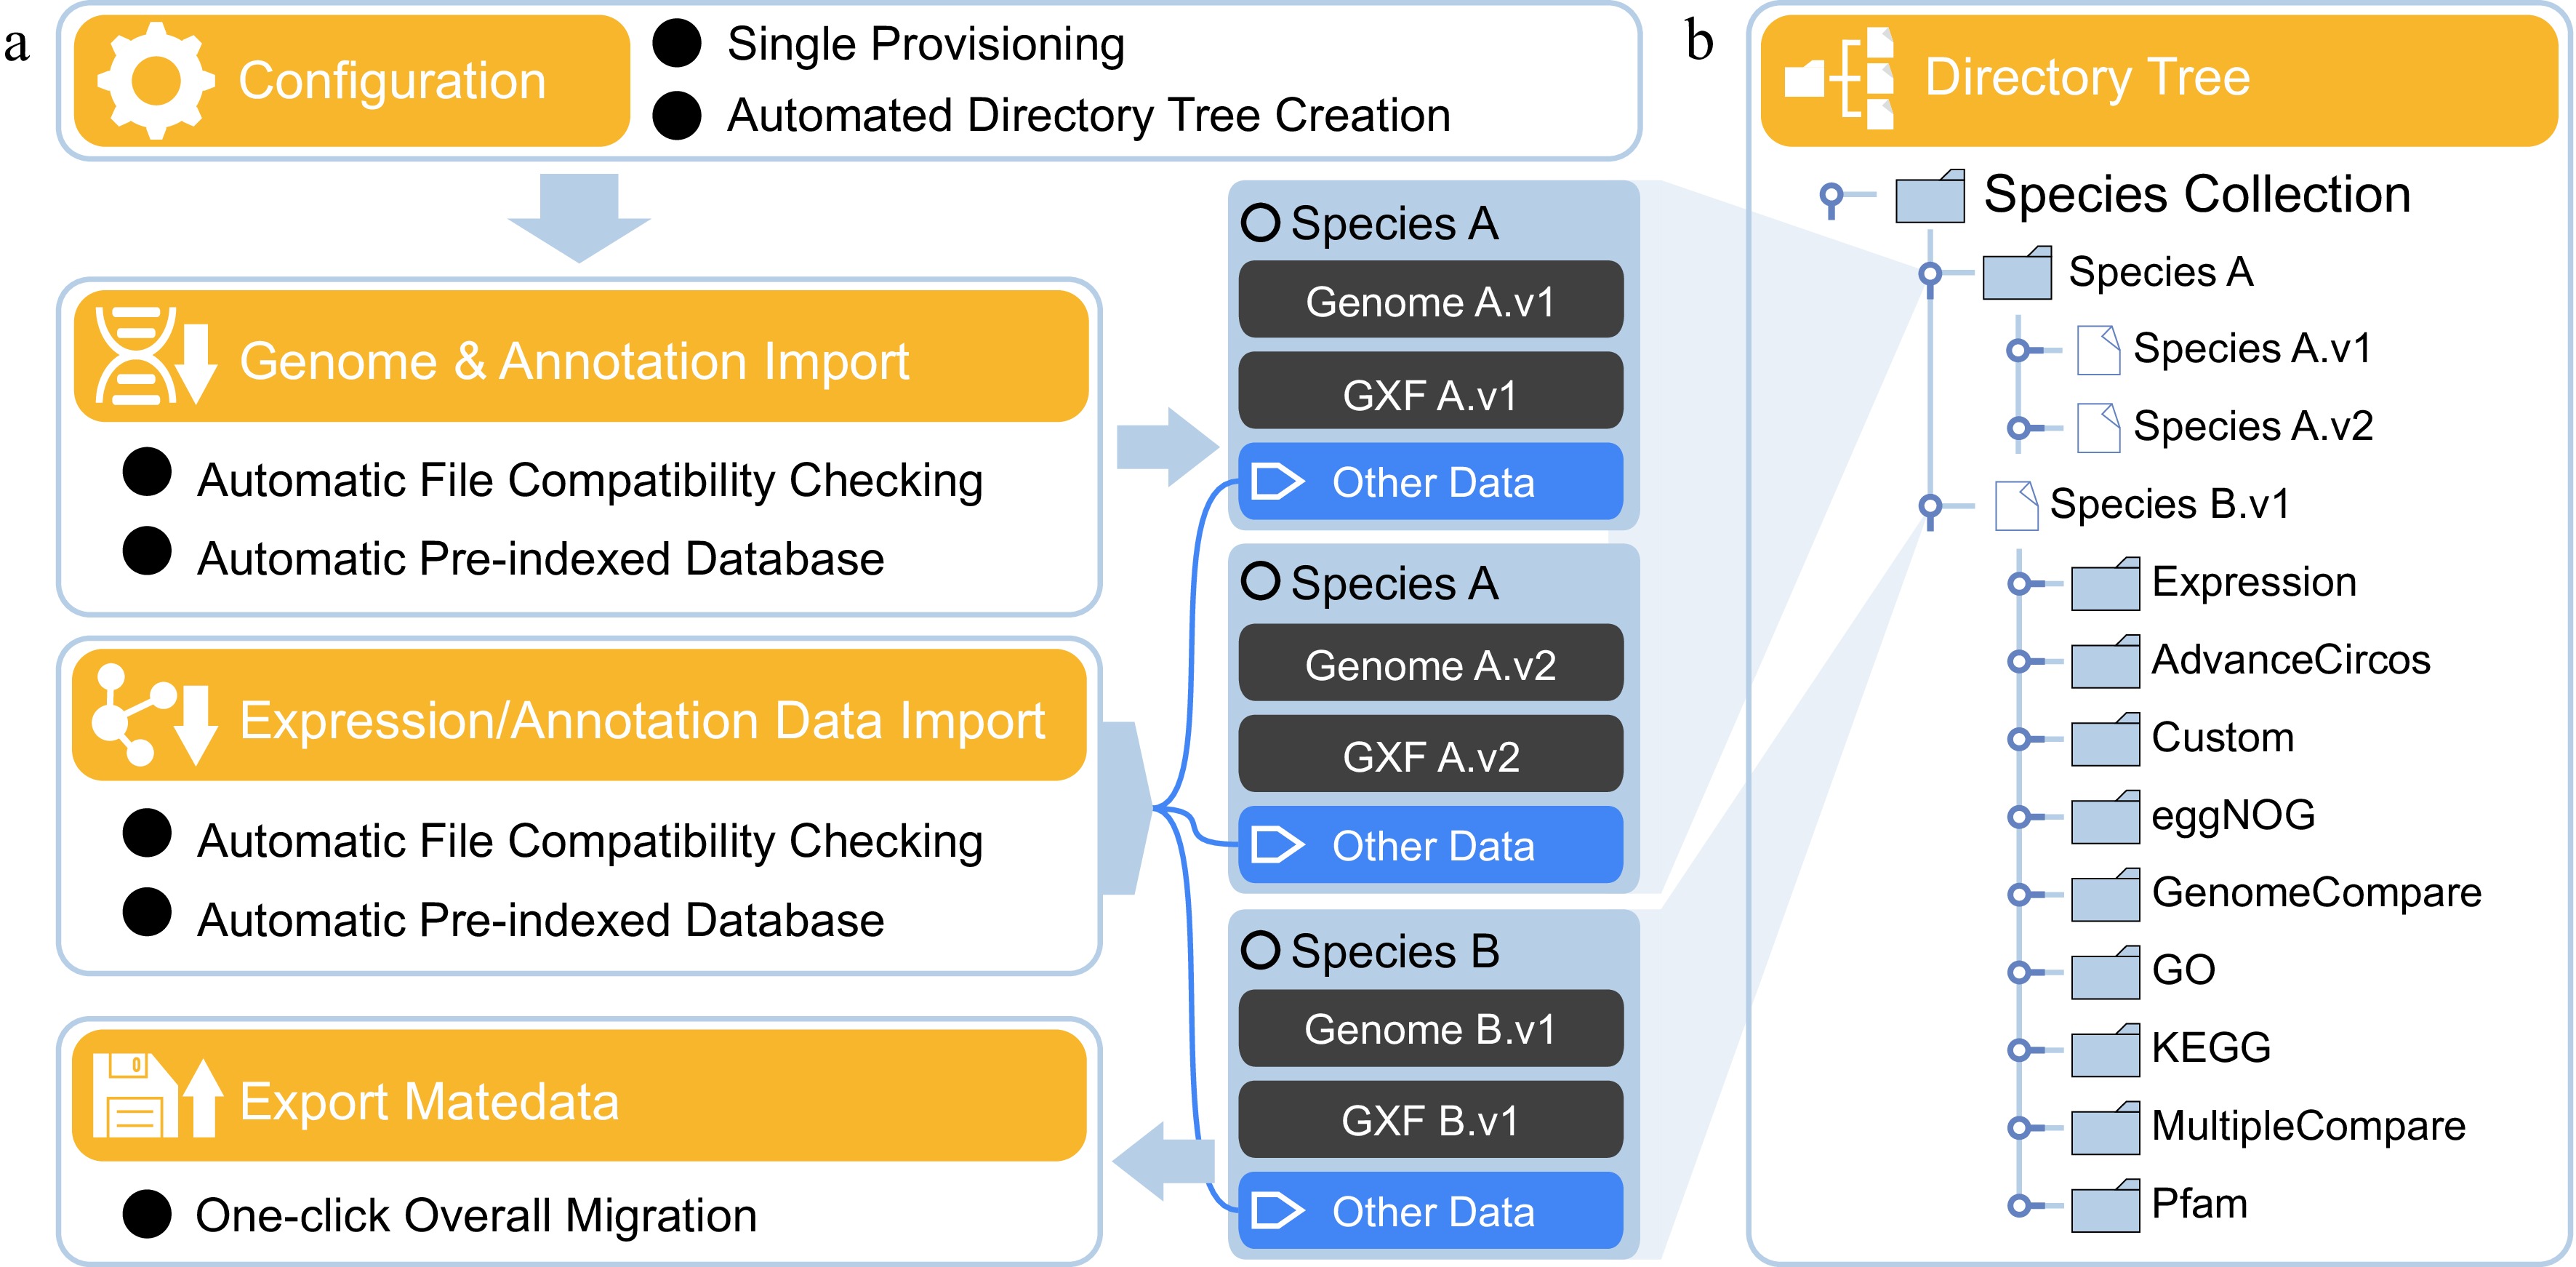
Figure 1.
Data management strategy centered on a data unit consisting of one genome and its annotation. (a) Automated and standardized features of database management. (b) Structure and components of the database directory tree.
In practice, genome data management is typically performed manually. Different file types are classified, stored, and named within customized directory structures. During analysis, result files and log files must also be placed in the appropriate locations as they are generated. For most biologists without enough computational training, however, file management becomes increasingly difficult as the data accumulate, and may even lead to the use of an incorrect genome version. SGH implements a stable local directory tree for organizing genome data (Fig. 1b). All data are stored under a primary repository path. After import, data are programmatically archived and can be exported when needed. This design reduces the uncertainty and burden associated with manual judgment and file selection.
On this basis, SGH uses a data-centered design to connect discrete functional modules, including those from TBtools-II. It thereby provides a cross-platform framework for local data exploration, in which data resources and analytical functions can be directly integrated and invoked. For human users, this design reduces the need to configure input data during analysis, provides intuitive interactive visual outputs, and improves the speed and continuity of analytical workflows. For future coding agent users, the framework enables the simultaneous recognition of input data and available functions. Thus, the SGH model provides a reliable framework for AI-ready genome analysis (Fig. 2).
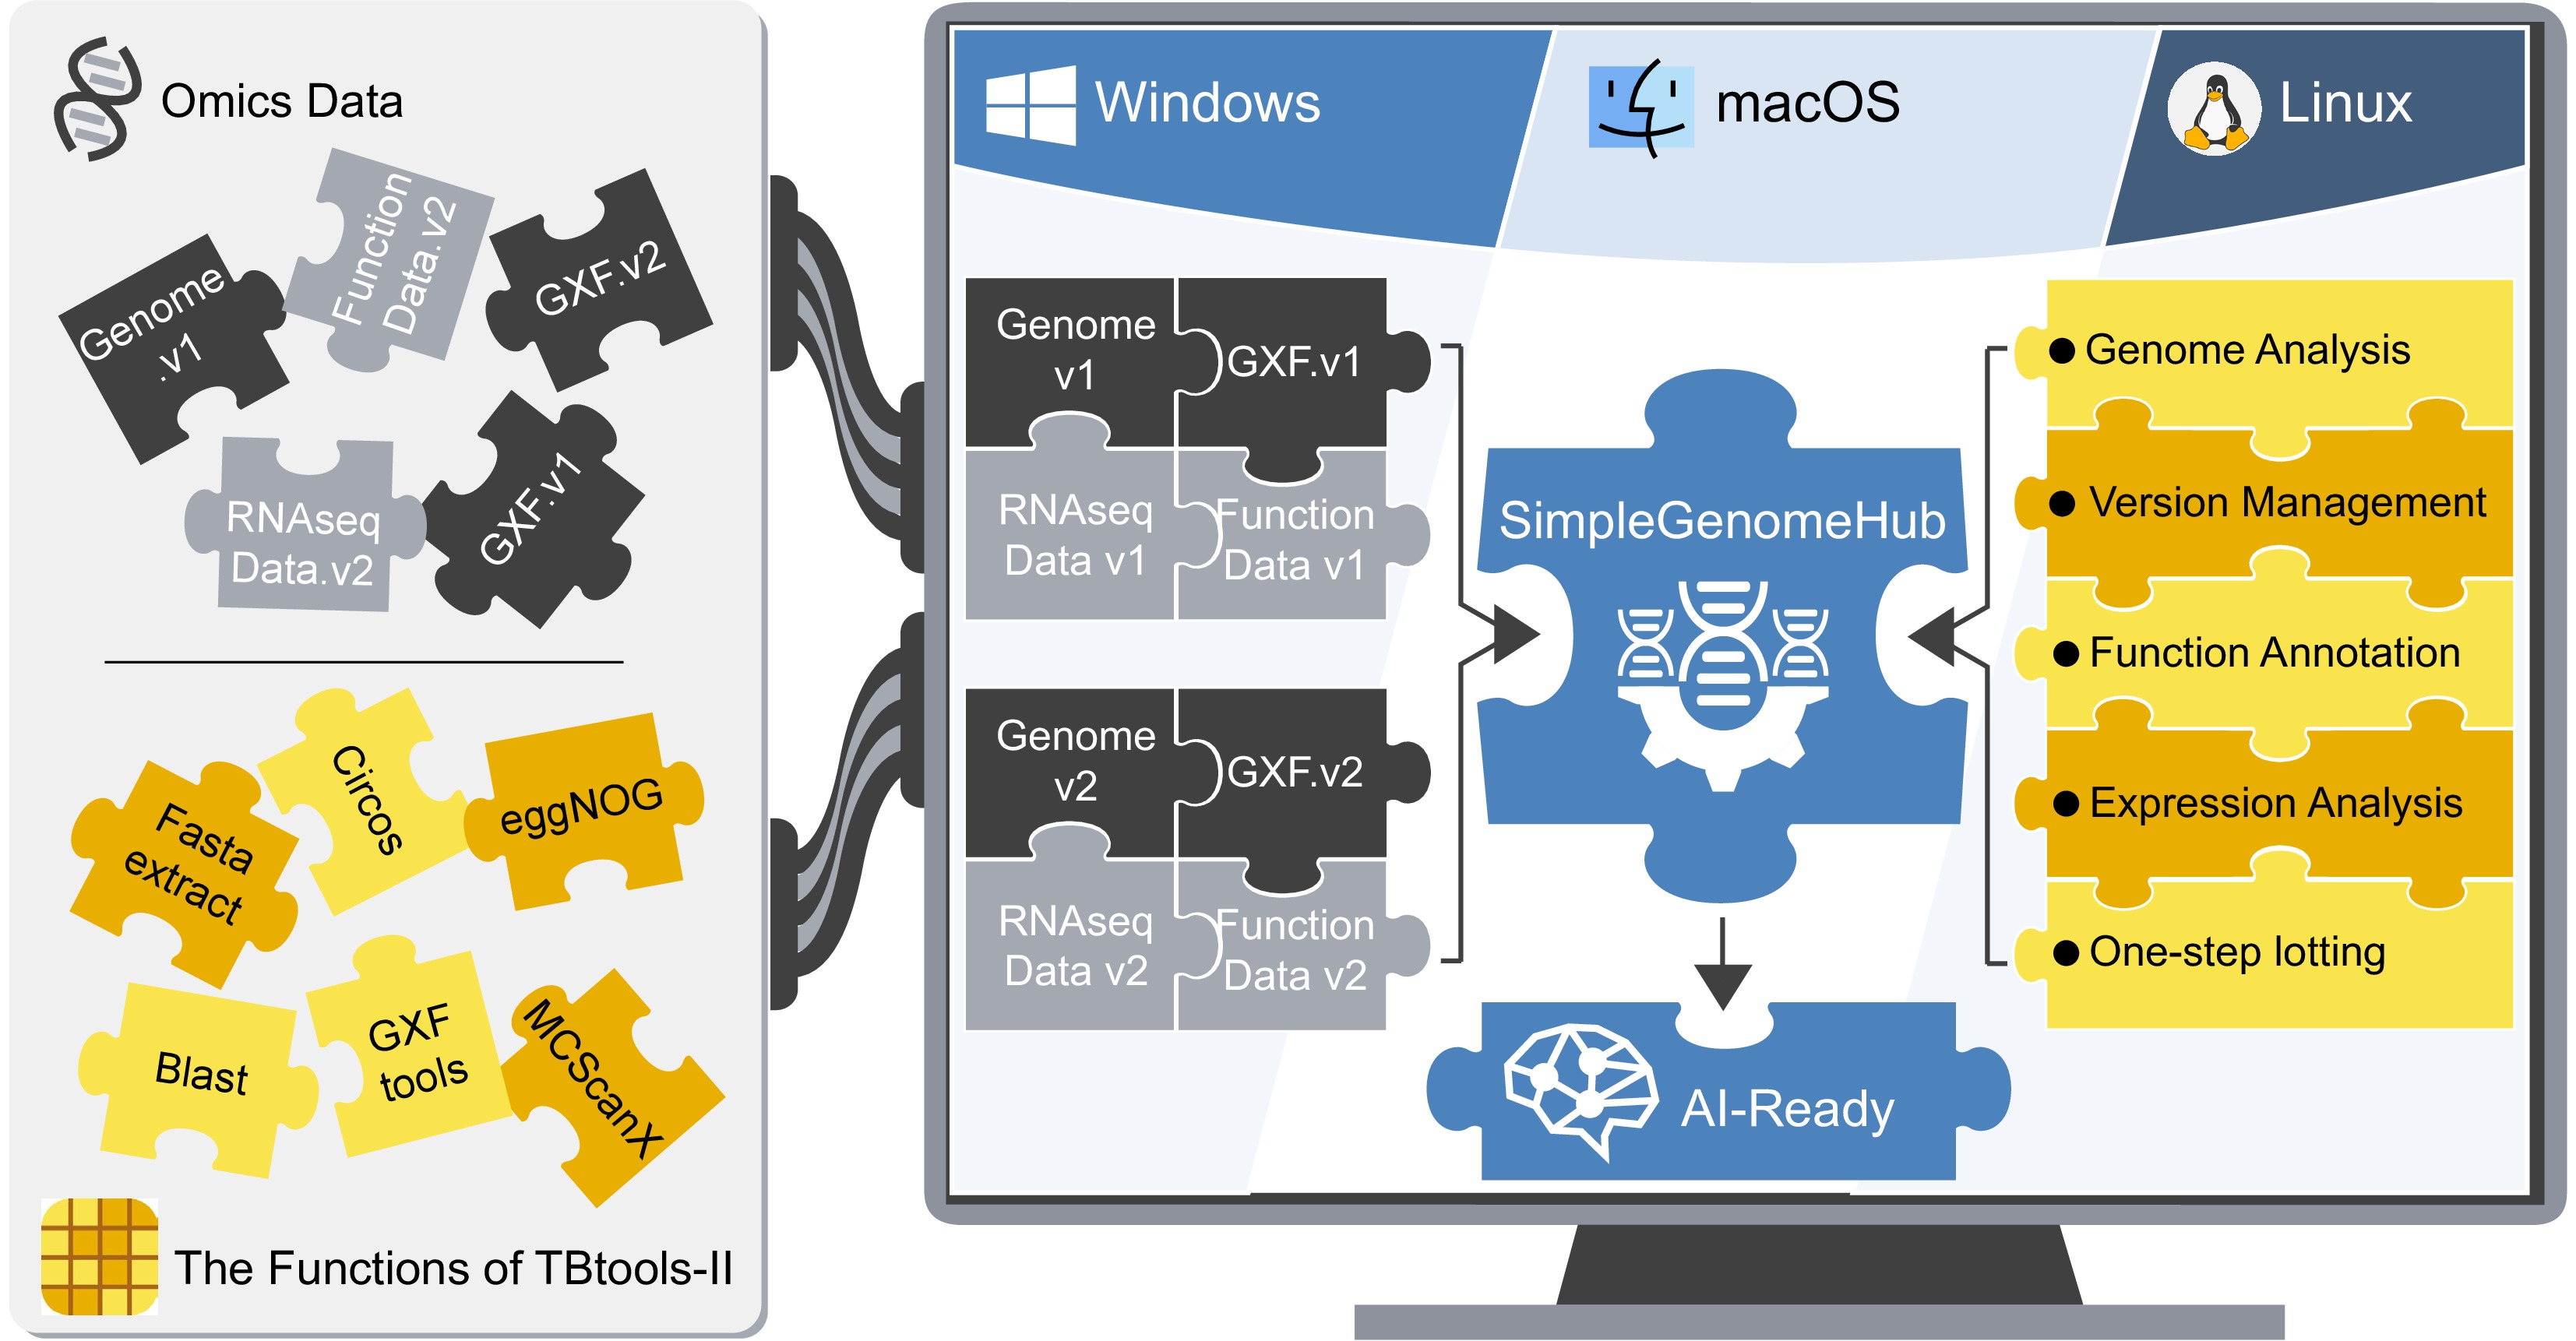
Figure 2.
SGH is designed around the integration of data and analytical functions, and its overall framework is AI-ready.
Software interface and feature overview
-
The main interface of SGH comprises a data management panel, a basic information panel for data units, and a functional analysis panel (Fig. 3a). The data management panel supports global configuration, data unit editing, import, export, and deletion. It also provides a context menu in the interactive file tree, allowing users to quickly locate files or open and browse saved analysis results (Fig. 3b). In the basic information panel, the selected data unit is presented as a set of cards, showing key information such as species, version, annotated genes, created gene sets, and chromosomes (Fig. 3b). The file management and functional analysis panel provides entry points to all 25 analytical functions. Depending on the different analysis workflows and data use scenarios, these functions are organized into eight categories: File Operations, Sequence Tools, Gene Info., Gene Expression, Function Annotation, Genome Analysis, BLAST Analysis, and Gene Set (Fig. 3b).
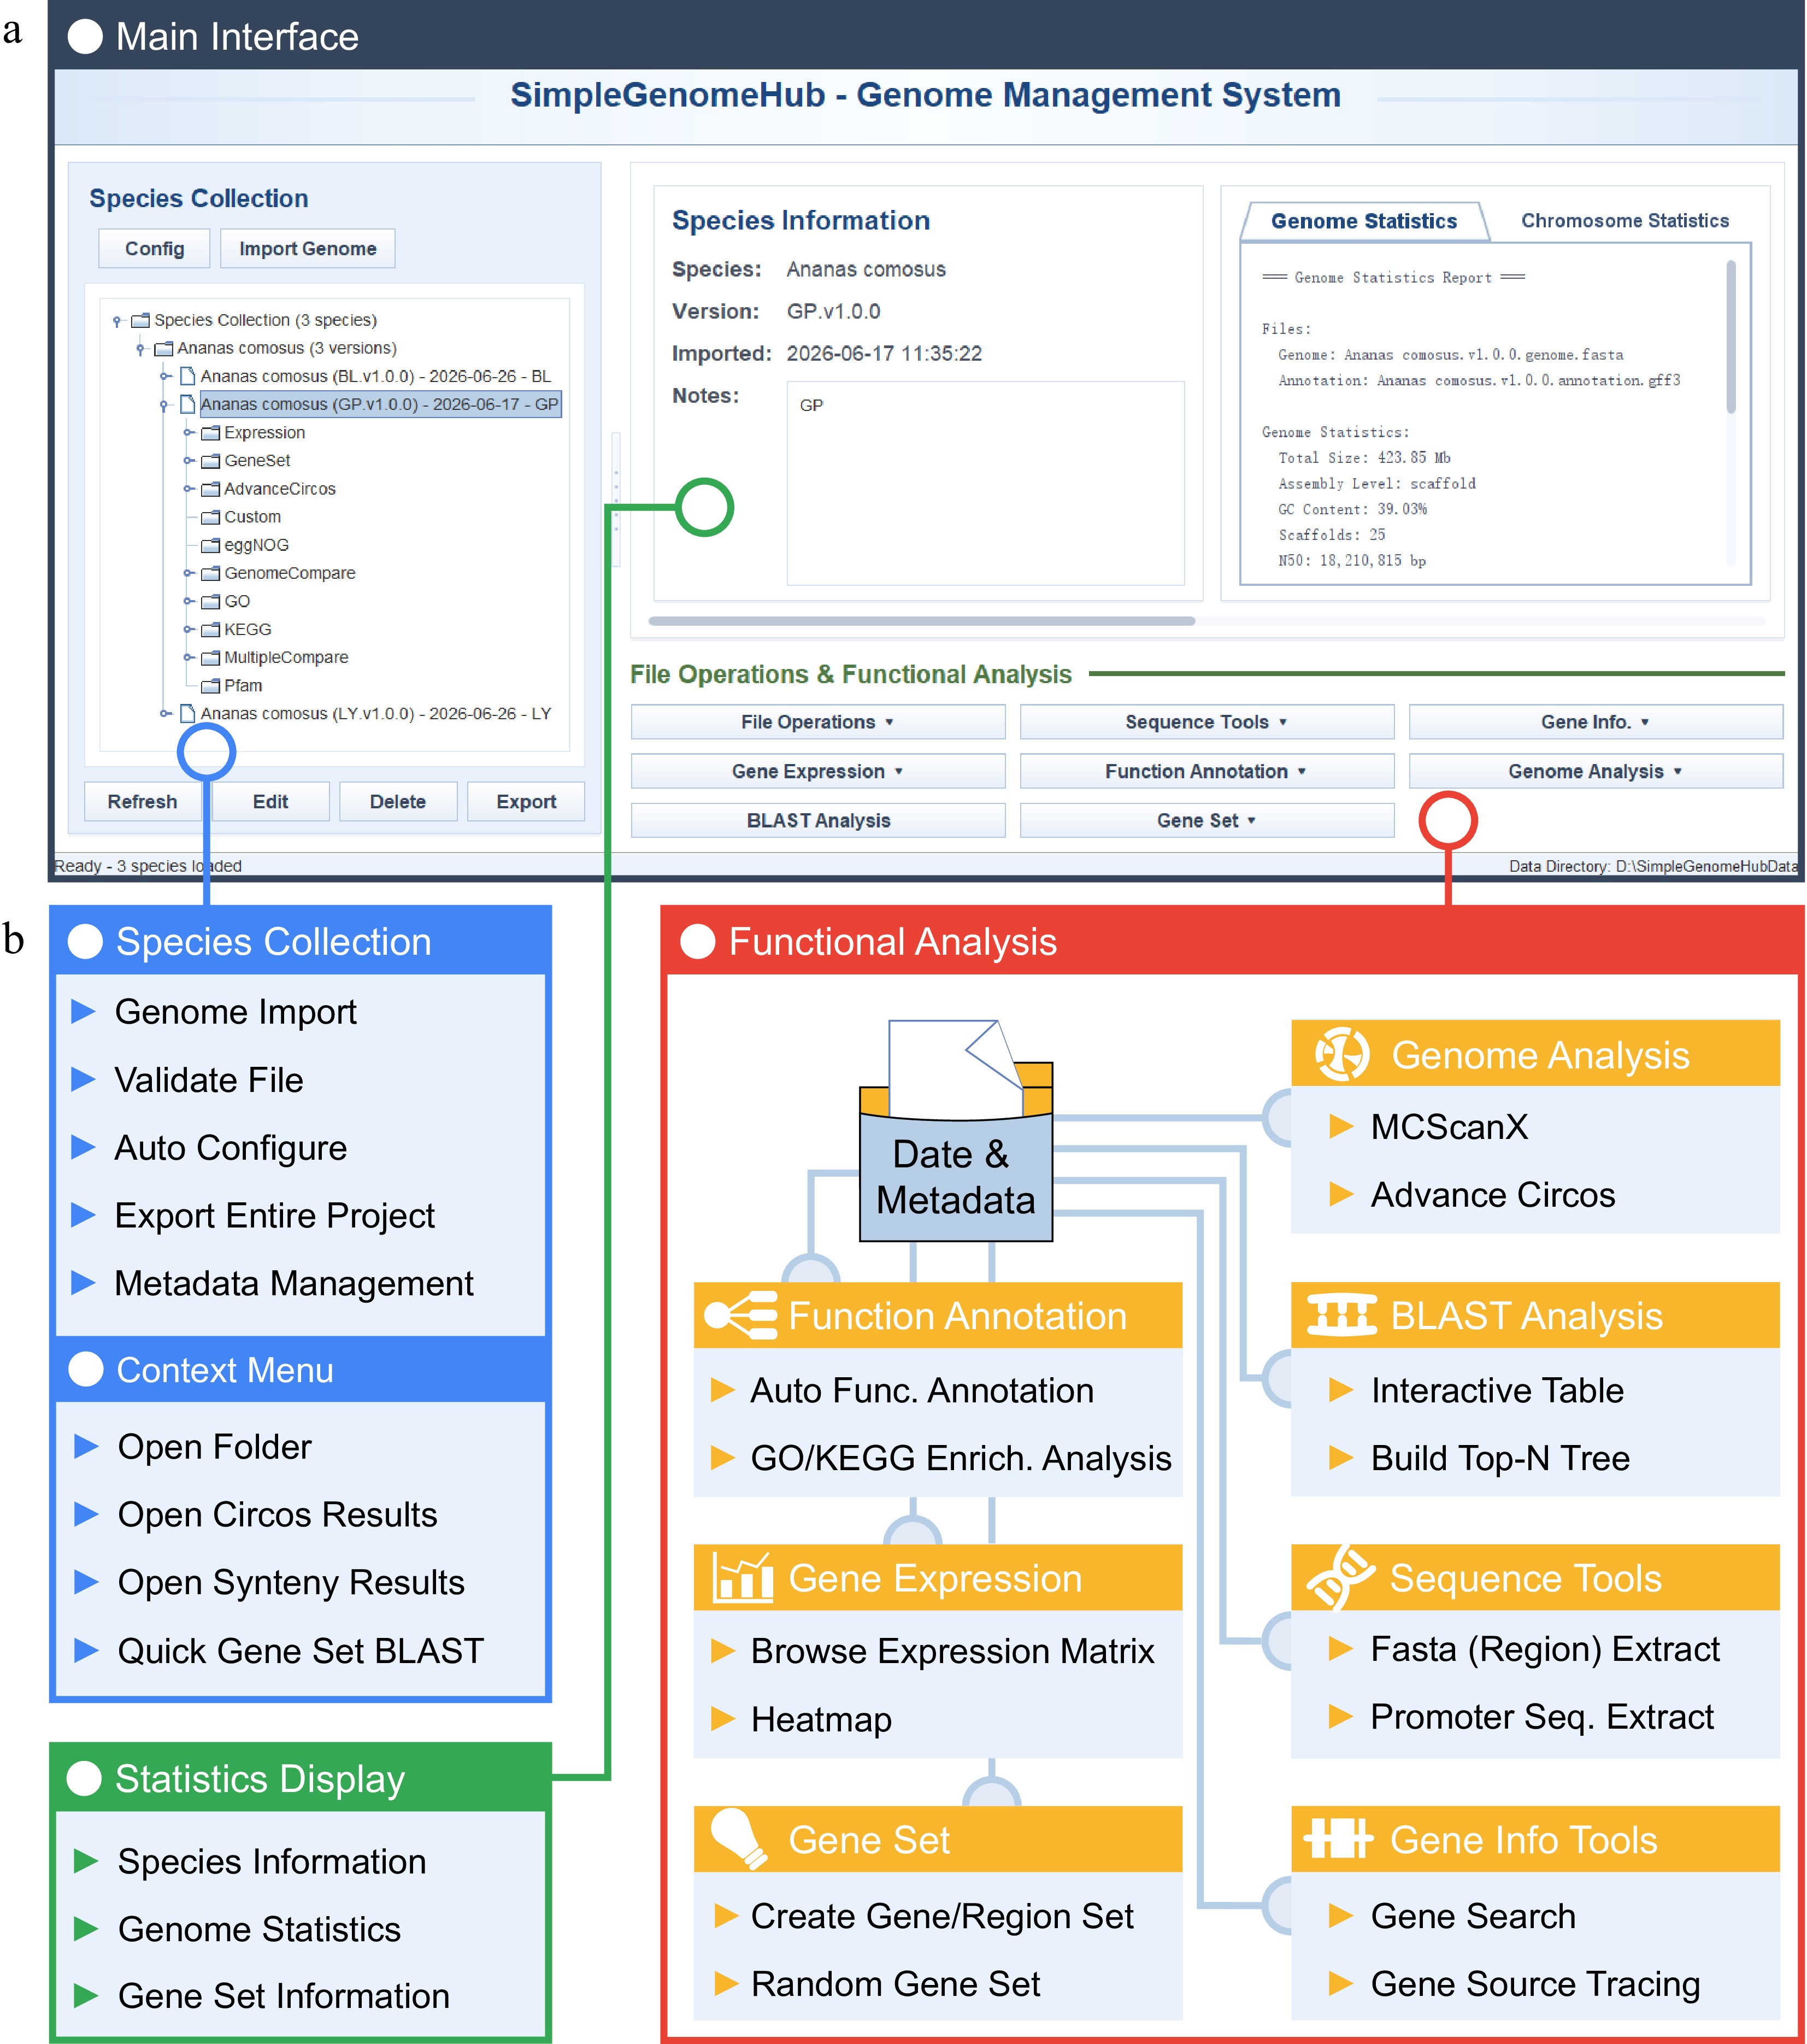
Figure 3.
Interface design and functional overview of SGH. (a) Overview of the main interface. The left panel shows the directory tree for managing genome versions. The right panel shows genome assembly and related information, with the corresponding function buttons below. (b) Overview of the genome data exploration functions in SGH.
Genomic data exploration features
-
On the basis of a single genome data unit, SGH supports four major classes of analysis, namely Gene Info., BLAST Analysis, Functional Analysis, and Gene Expression (Fig. 4a). For retrieving sequence information, SGH supports gene ID-based searches and returns transcripts, CDS, and protein sequences, together with gene structure information, in a single query (Fig. 4c). It can also extract relevant entries from functional annotation data or visualize the expression profile of the queried gene across different conditions (Fig. 4e). This improves the completeness of retrieved information and avoids the need for users to locate and search individual result files separately. For sequence analysis, SGH integrates local BLAST[13] functionality. Within a single interface, users can select alignment targets, set BLAST parameters, monitor the alignment process, and browse the results. The software also supports construction of a phylogenetic tree based on the BLASTP results (Fig. 4b).
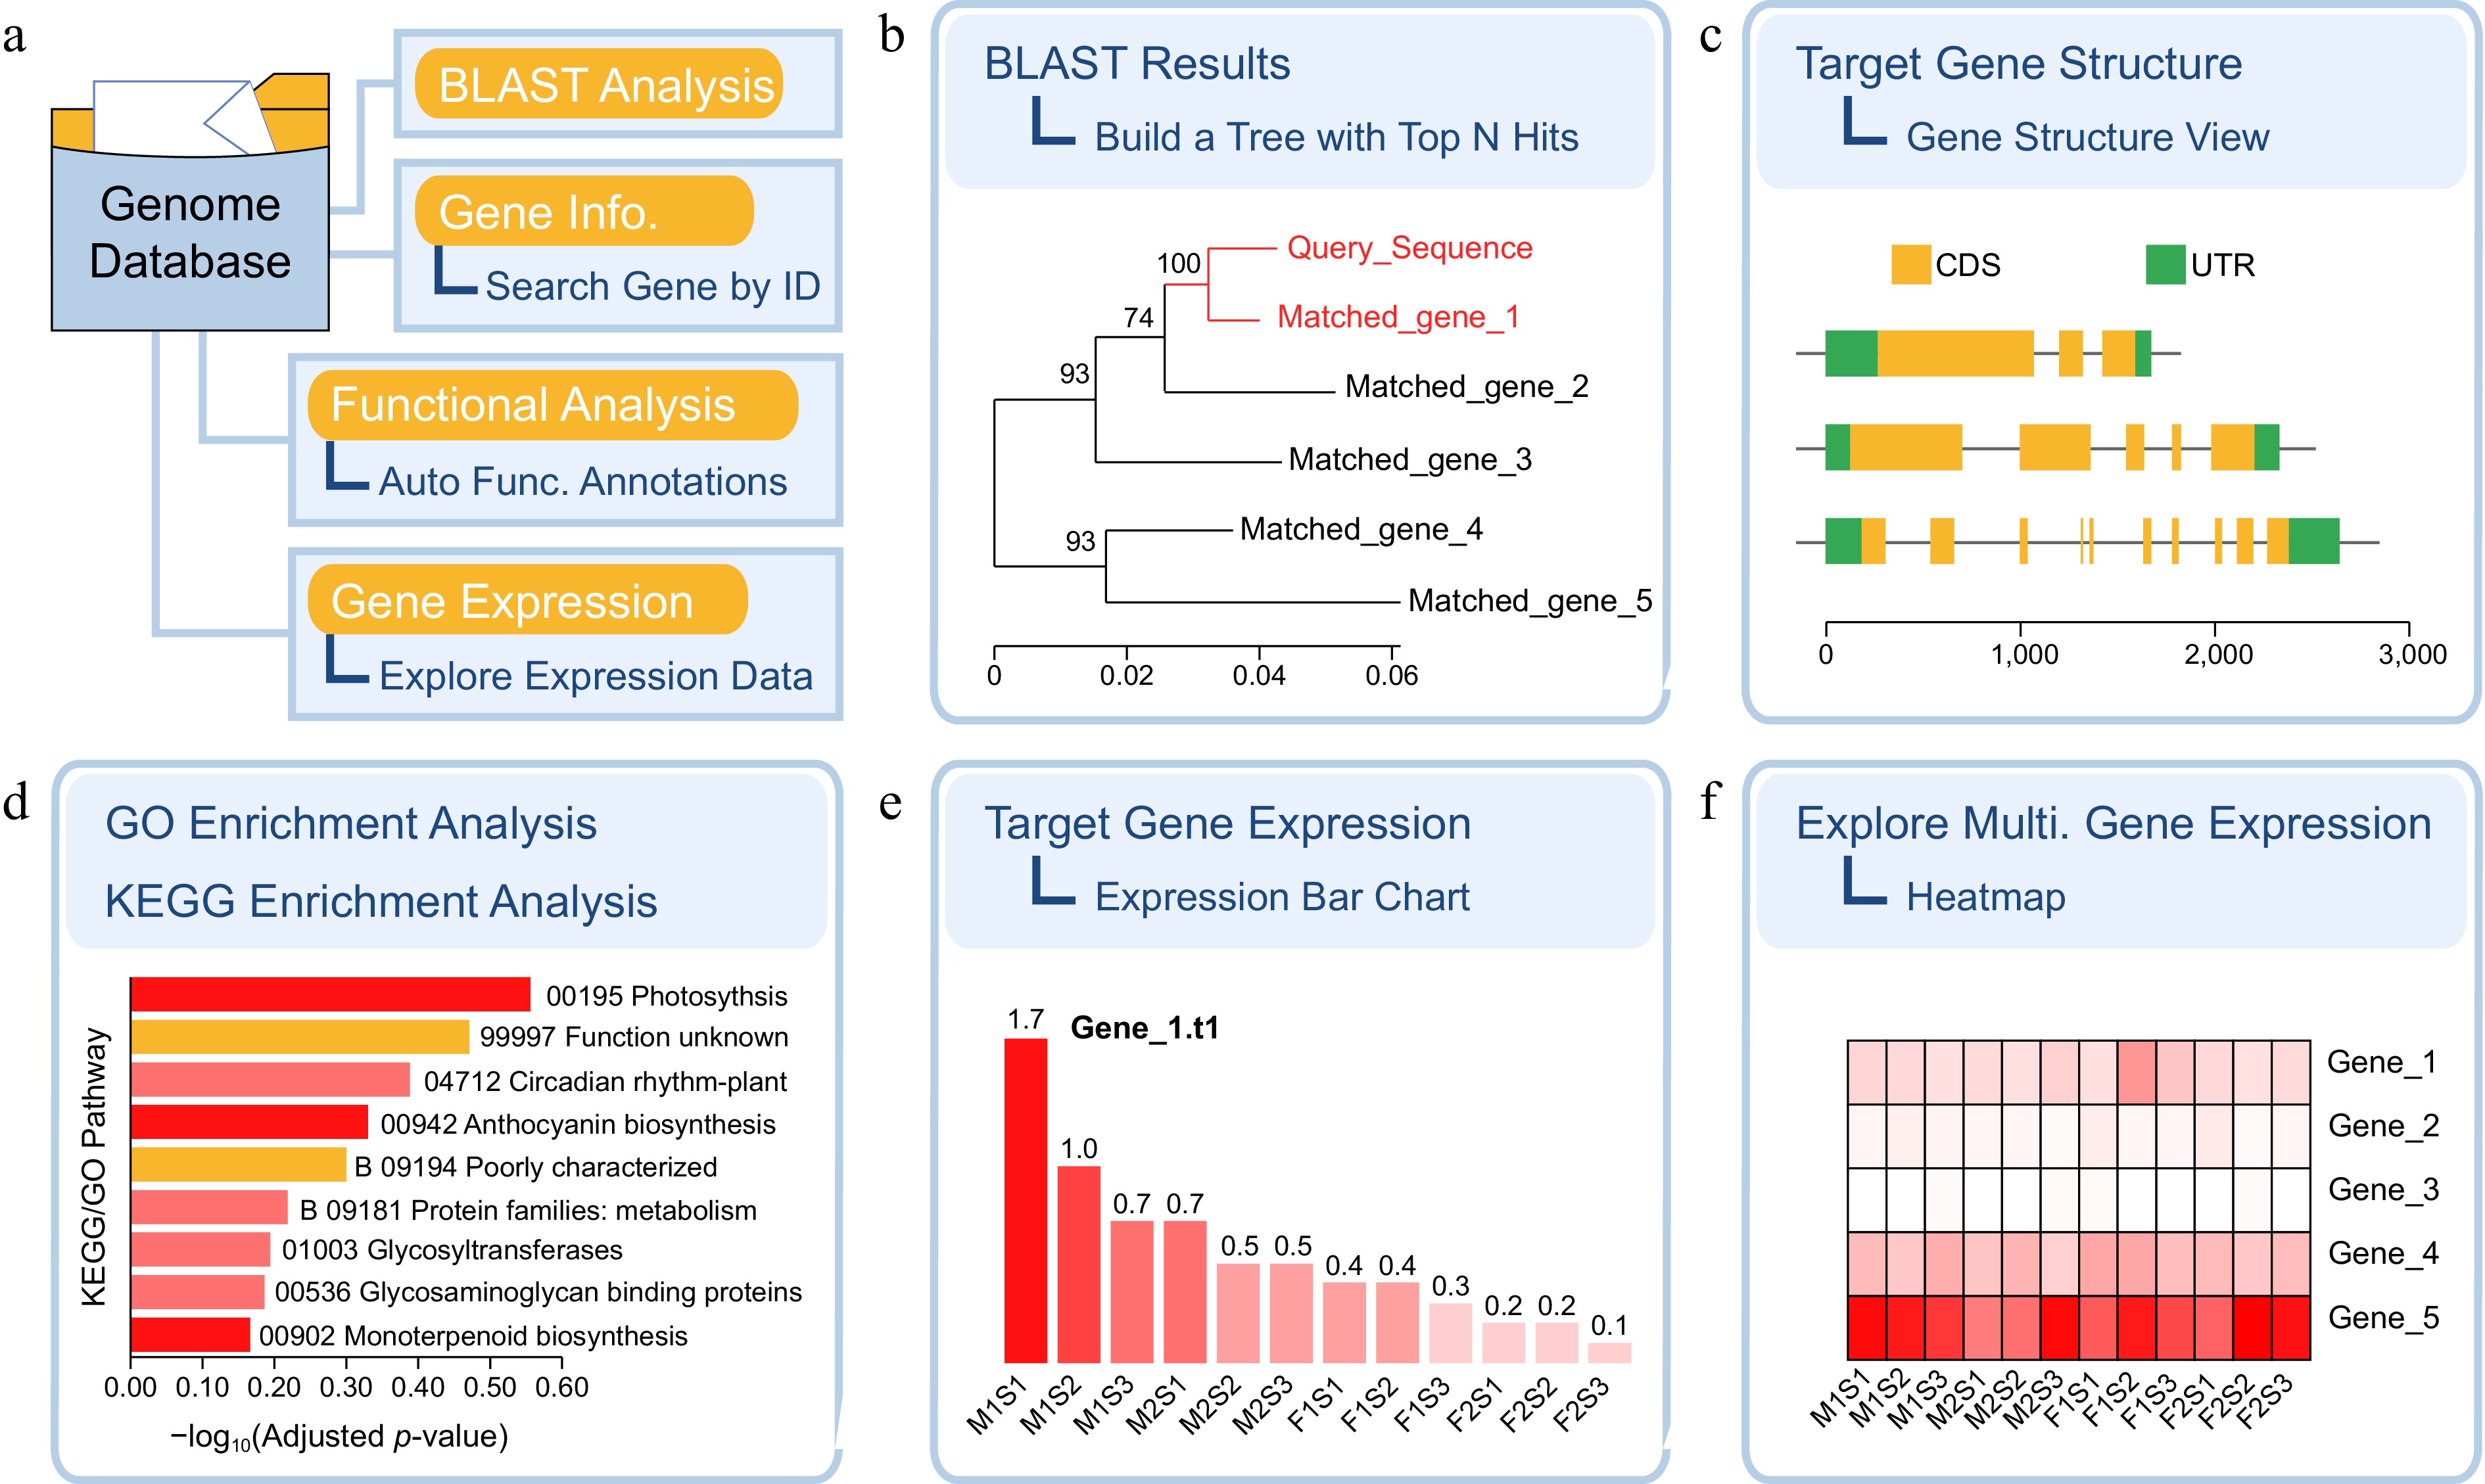
Figure 4.
Genome data exploration functions and representative outputs supported by SGH. (a) Four classes of functions supported by the genome database. (b) Sequence alignment and phylogenetic tree construction, (c) gene structure analysis, (d) functional enrichment analysis of gene sets, (e) single gene expression pattern analysis, and (f) multiple gene expression pattern analysis, respectively.
To improve user efficiency, we integrated a Java implementation of eggNOG-mapper[15] software for gene function annotation. We also provide downloadable sequence databases for plants, animals, fungi, and other groups, which lowers the barrier to use and reduces computational resource demands. Thus, SGH can help users complete gene function annotation for a species, including protein function annotation, GO annotation[19], and KEGG annotation[20], without additional preparation. Using the Explore Annotations function, users can manage and parse annotation results, and rapidly perform GO and KEGG enrichment analyses for gene sets of interest with visualization of the results (Fig. 4d). In addition, SGH integrates tools for exploring gene expression data. Users can interactively examine expression matrices in a heatmap table and generate publication-quality expression heatmaps (Fig. 4f).
Multi-genome comparative analysis features
-
Genome assemblies and annotations are now readily available for many species. Comparative genomic analysis has therefore become a routine task. For multiple genome datasets, SGH integrates Circos visualization and gene synteny analysis, two common functions used in comparative genomic analysis (Fig. 5a). SGH integrates the Advanced Circos function from TBtools-II and provides genomic feature tracks, including gene density, GC content, and intragenomic synteny. This enables rapid generation of basic genomic Circos plots with a single operation (Fig. 5b, c). In addition, SGH uses a Java implementation of the MCScanX[18] algorithm to support fast local synteny analysis between two genomes in a single operation, together with visualization of the results (Fig. 5d). To support more flexible and convenient comparative synteny analysis across multiple genomes, the Multiple Synteny module provides a draft layout function. Users can use this interface to define the layout for visualizing synteny across multiple genomes (Fig. 5e). All of these visualization functions directly invoke the JIGplot modules from the TBtools-II platform and natively support the generation of publication-quality figures.
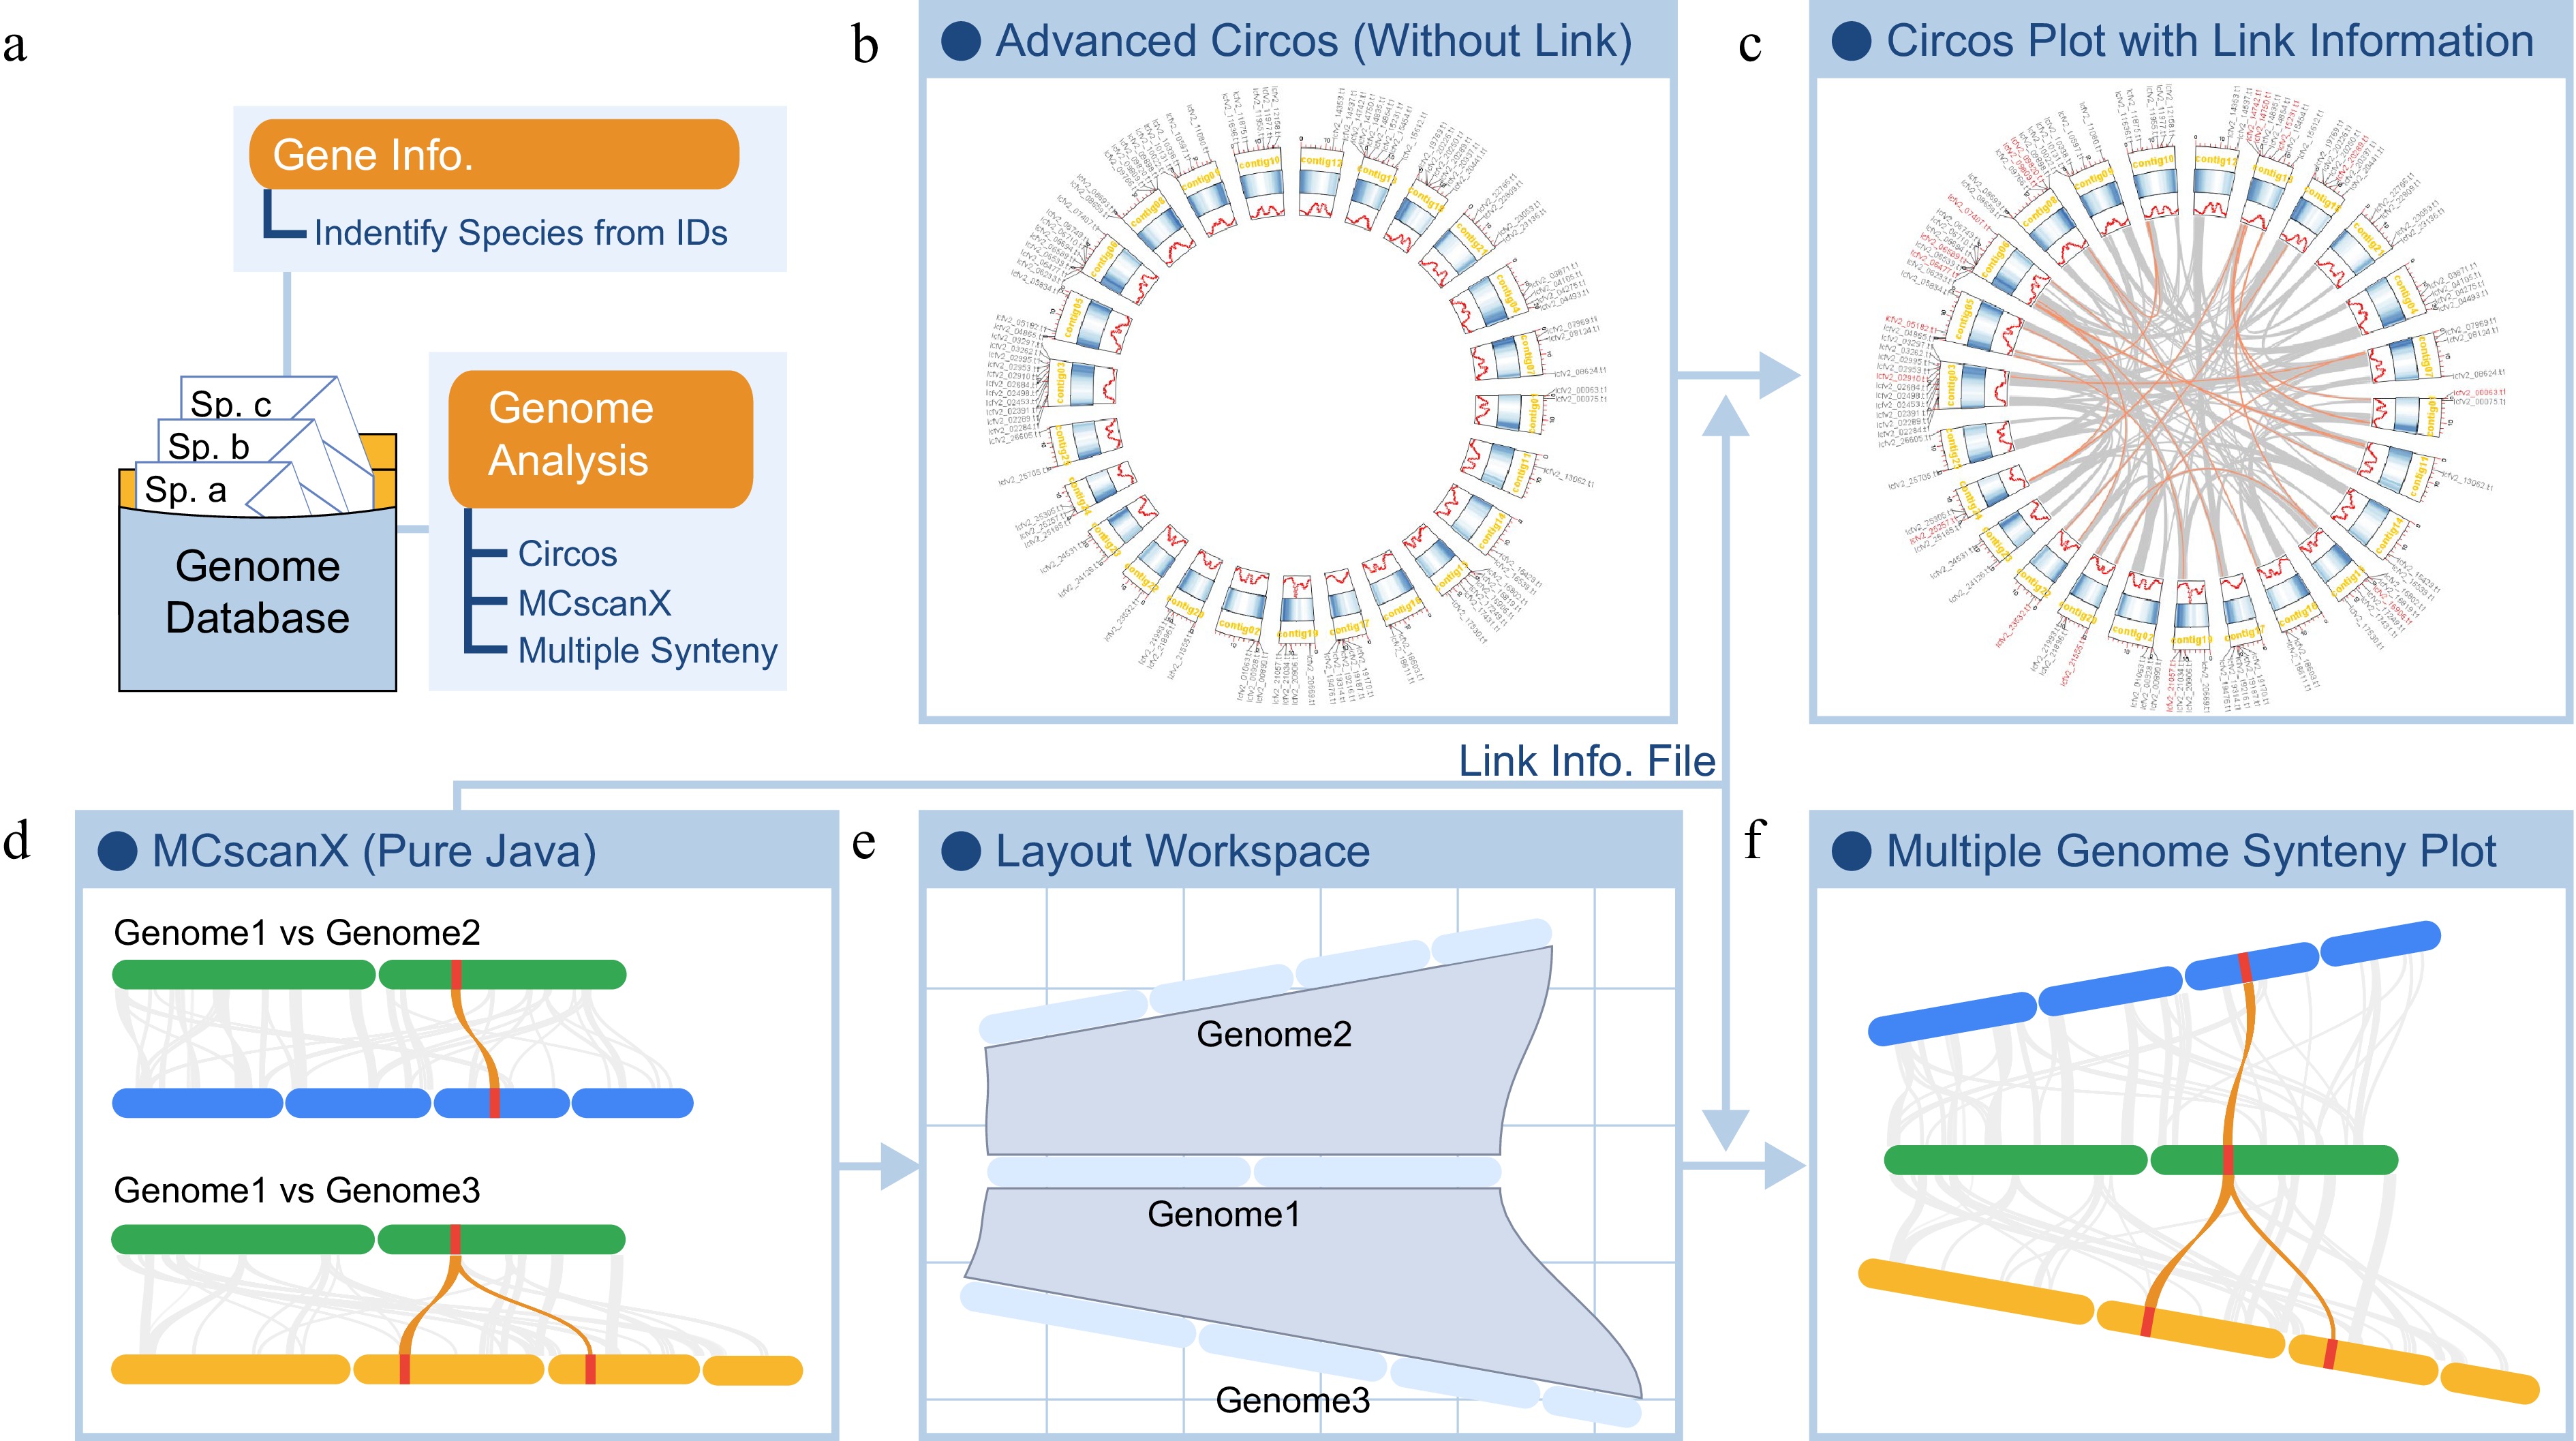
Figure 5.
Genome synteny analysis and visualization supported by SGH. (a) Comparative genomics module of SGH. (b) Rapid Circos visualization of genomic features and (c) synteny information. (d) Genome synteny analysis and visualization between two species. The synteny output, namely the Link Info. File, provides an interface that can be automatically recognized and called by other functions. (e) Flexible layout and (f) visualization of synteny across multiple species.
Notably, all outputs of analysis generated by SGH are updated in real time in the file tree. Users do not need to manually configure the output paths or know the storage formats. Visualization results can be opened directly from the main interface through the context menu for rapid inspection.
Example of the workflow
-
Calcium ions (Ca2+) act as secondary messengers in plant growth and development, stress responses, and fruit quality formation[21]. Previous studies in pineapple (Ananas comosus) have shown that abnormal Ca2+ distribution is closely associated with physiological disorders, tissue translucency, and reduced storage quality in fruit[22]. In a study of the pineapple cultivar 'Comte de Paris', Shu et al. (2025) found that high expression of AcoCAX2 promoted Ca2+ accumulation in the fruit cells of pineapple and enhanced tissue structural stability, thereby suppressing the occurrence of watercore[23]. However, the related genes have not yet been systematically identified or analyzed for their expression patterns in other pineapple germplasm accessions. Here, we used three assemblies of different pineapple germplasm accessions, namely 'GP', 'BL', and 'LY', as examples to extend information related to Ca2+ accumulation and to demonstrate the practical features of SGH. The hardware configuration used for this example and the runtime of each function are summarized in Supplementary Table S1.
Importing the genome
-
SGH provides an efficient and convenient local data management interface, Species Collection. This interface automatically builds the directory structure for genome data and preserves imported data for long-term use. Users need only to provide a genome sequence in FASTA format and an annotation in GFF3 format to define a core data unit. Proteins, CDS, and transcript sequences, along with other derived files, are automatically organized within this directory structure. The procedure is as follows:
(1) (Optional) In Species Collection, click Config (Supplementary Fig. S1a), select the database storage path, and click Apply to complete the setup.
(2) In the Species Collection panel, click Import Genome (Supplementary Fig. S1b).
(3) Import the genome file and annotation file. Then enter the genome version and notes. In this example, the species name is Ananas comosus, the version is GP.v1.0.0, and the note is GP.
(4) Click Validate to check the input files. After validation, click Import Species to create the data unit.
(5) Repeat Steps 3 and 4 to create genome data units for 'BL' and 'LY'. The resulting view is shown in Supplementary Fig. S1b.
Homology search of CAX genes
-
By integrating BLAST with genome data interfaces, SGH enables one-click BLAST analysis and inspection of the results through graphical operations. In this case study, the four CAX genes identified by Shu et al., namely AcoCAX1 (XM_020248273.1), AcoCAX2 (XM_020241177.1), AcoCAX3 (XM_020226264.1), and AcoCAX4 (XM_020232476.1), were used as queries for homology searches in each of the three genome data units[23]. The procedure is as follows:
(1) Select Ananas comosus (GP.v1.0.0) and click BLAST Annotation (Supplementary Fig. S1c).
(2) Use the downloaded CAX protein sequences as input, and click BLAST to perform the search.
(3) Click Build a Tree with Top N Hits. Enter the number of genes for tree construction according to the number of unique hits, and then confirm to build the tree (Fig. 6a−c).
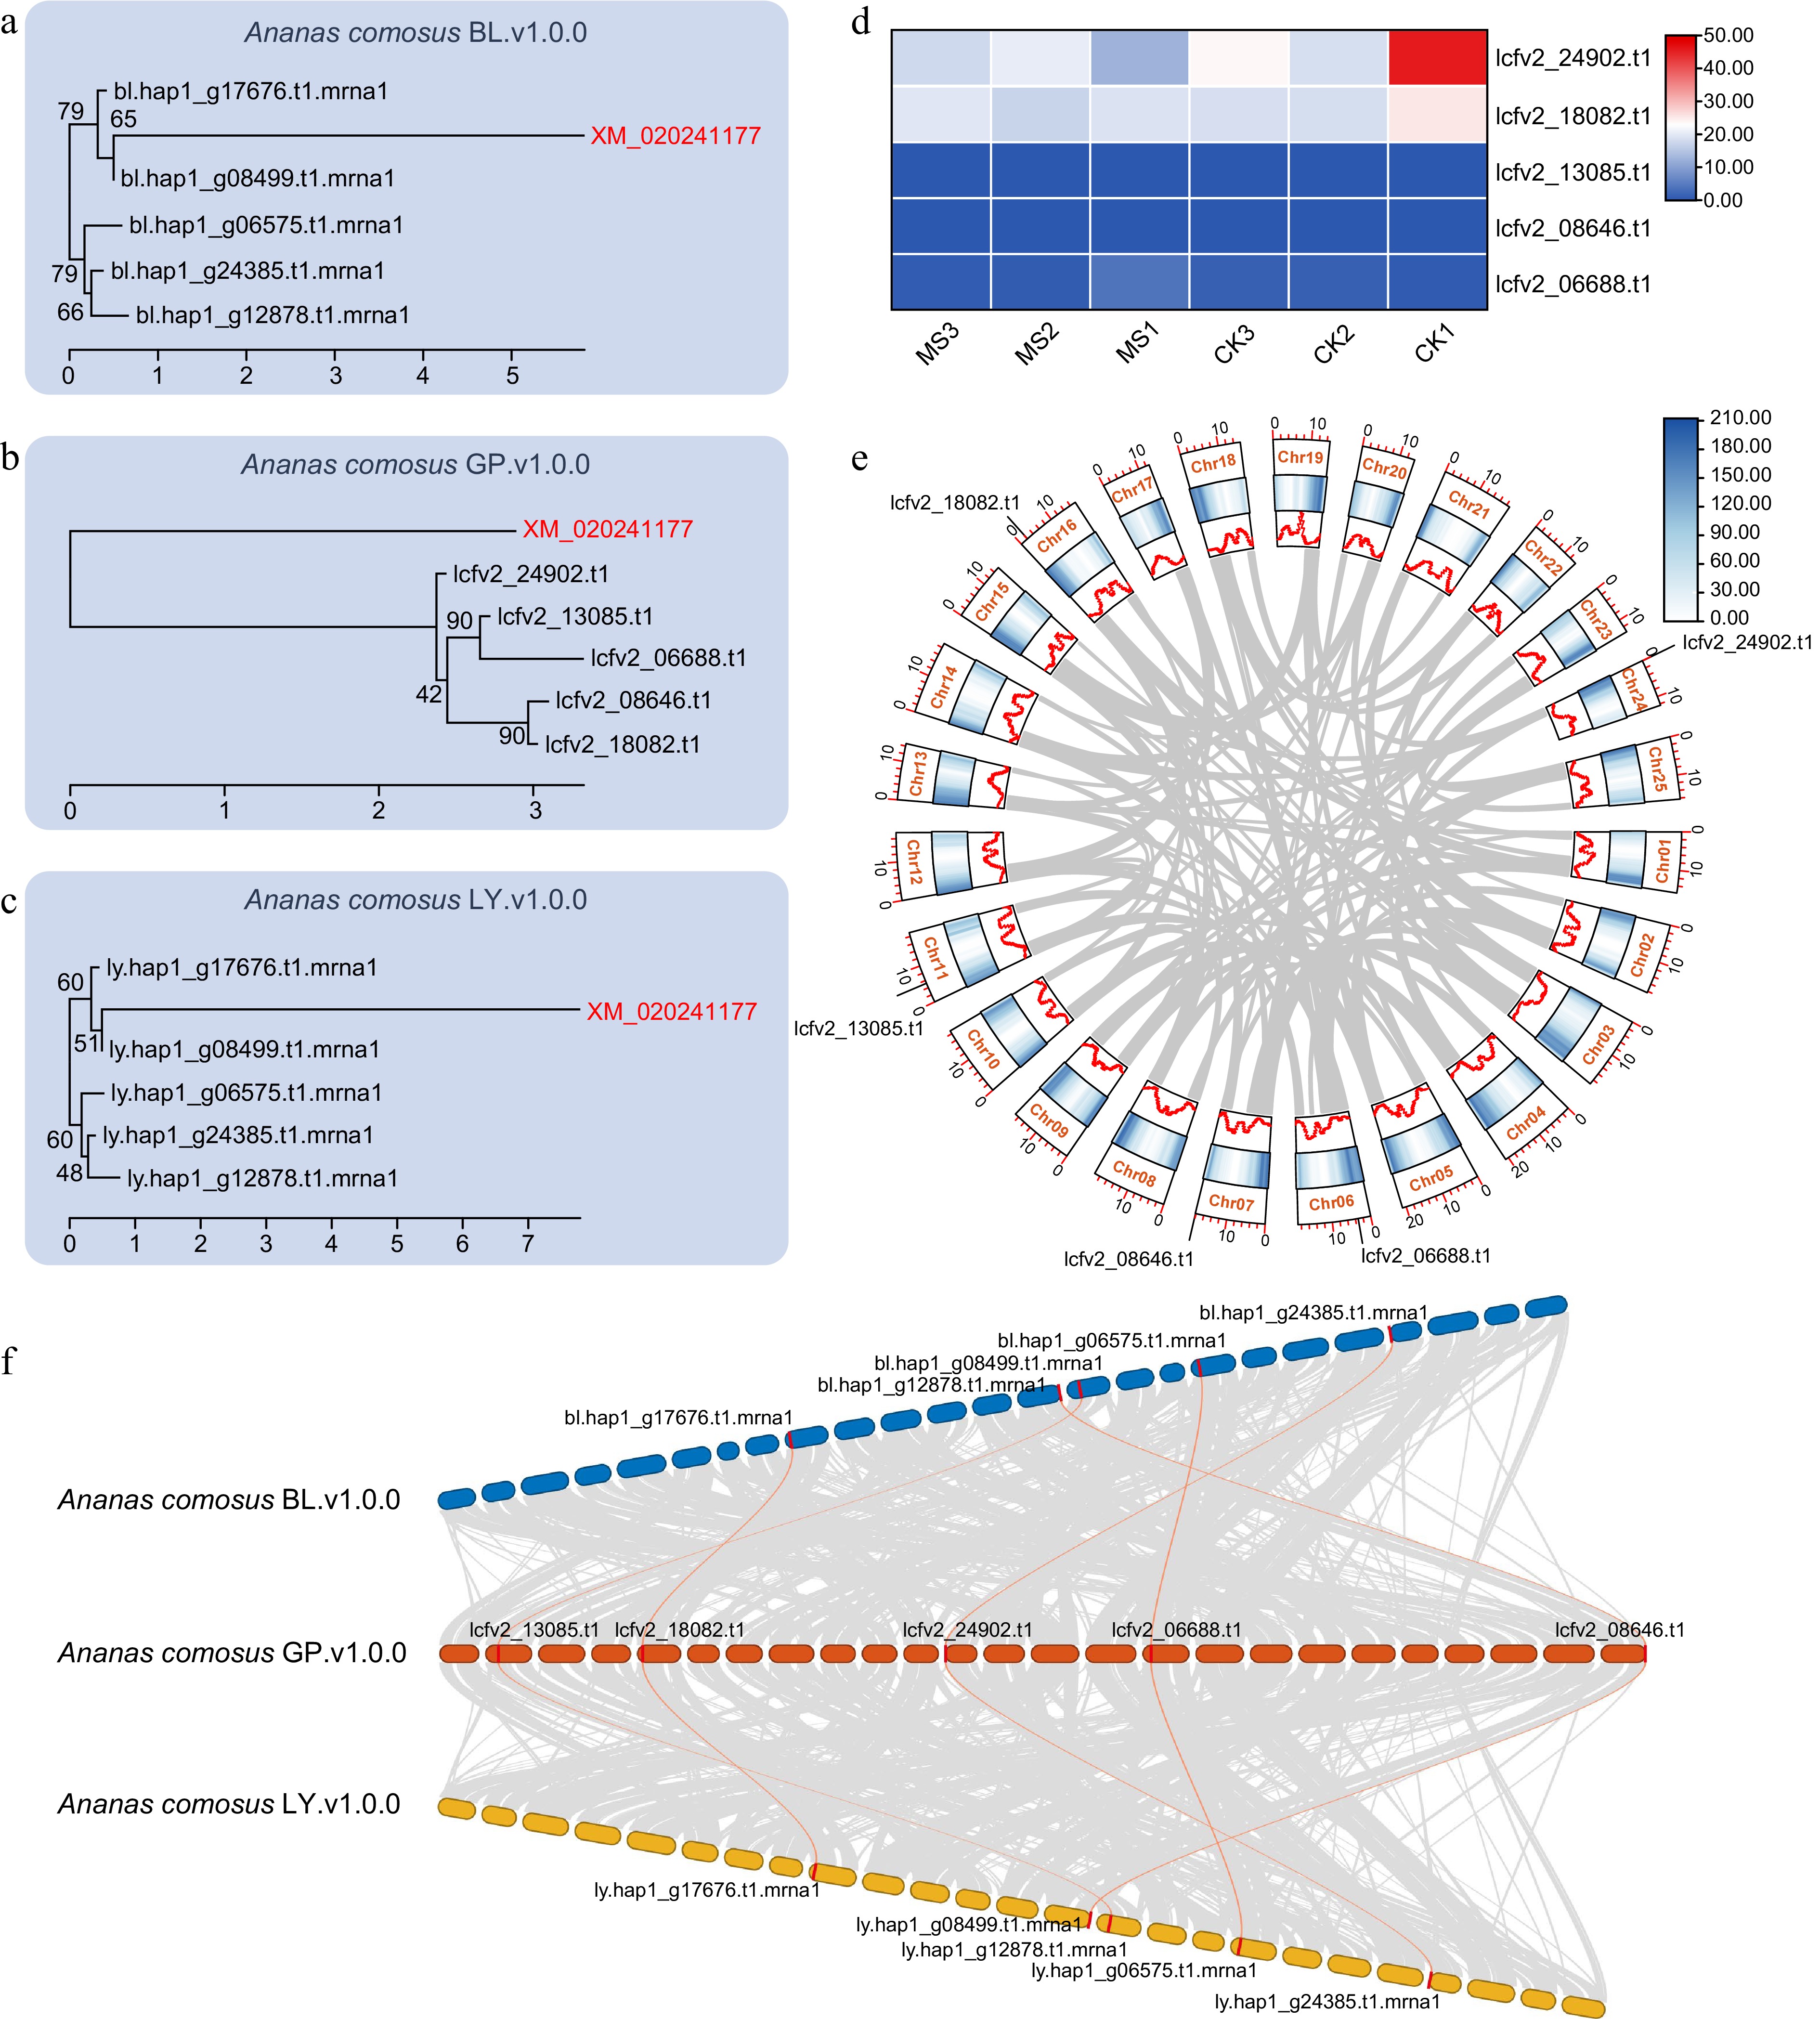
Figure 6.
Identification and evolutionary analysis of CAX genes in three pineapple germplasm accessions. Phylogenetic trees of CAX genes in (a) 'BL', (b) 'GP', and (c) 'LY', respectively, based on protein homology search results using XM_020241177 as the reference. (d) Expression levels of five candidate CAX genes in the flesh of normal fruit and mild watercore fruit in 'GP'. (e) Genomic Circos plot of 'GP'. From the inner to outer tracks, the plot shows the synteny links, GC content, gene density, and chromosomal positions of the five candidate CAX genes. (f) Synteny analysis of CAX genes among the three pineapple genomes.
(4) On the basis of the tree and BLAST results, select the transcript IDs to be saved in the Query ID column. Then click Copy Select Content in the context menu.
(5) Return to the main interface and open Create a Gene Set through the pathway File Operations & Functional Analysis > Gene Set > Create a Gene Set.
(6) Edit the gene set name, enter the copied transcript IDs, and click Create to save the selected results.
(7) Repeat Steps 1 to 6 to create the BL_CAX and LY_CAX gene sets in the 'BL' and 'LY' genomes, respectively (Supplementary Fig. S1d).
Expression analysis of candidate CAX genes
-
To improve the efficiency of gene mining, SGH integrates the importation of expression data with interactive analysis tools. This enables a one-step workflow from gene IDs to expression heatmaps. In this case study, we used transcriptome data from normal fruit (control, CK) and fruit mildly affected fruit with watercore (MS), as reported by Yao et al. (2022) to obtain a whole-genome expression matrix for 'GP'[24]. Based on this matrix, expression data were automatically imported into SGH, followed by expression pattern analysis of the candidate genes and heatmap visualization of the results. The procedure is as follows:
(1) Select Ananas comosus (GP.v1.0.0), navigate to Import Expression Data, and click the button (Supplementary Fig. S2a).
(2) Use the 'GP' whole-genome FPKM file as input, and click Import to complete data import.
(3) Navigate to Explore Expression Data, select the imported expression dataset, and click Explore Multi. Gene Expression to load the data.
(4) In Gene Input, select the saved GP_CAX gene set as input, and click Search to view the expression matrix in a tabular and graphical format (Supplementary Fig. S2c; Fig. 6d).
(5) Click Heatmap to visualize the expression patterns of the input genes as a heatmap (Supplementary Fig. S2d).
Chromosomal distribution and genomic Circos visualization of candidate CAX genes in 'GP'
-
Circos plots are widely used for genome visualization. However, they are not yet fully integrated with functions such as synteny analysis and displaying GC content. Users therefore need to connect these steps manually, which increases operational complexity and the risk of human manipulation error. SGH provides a one-step Circos plotting function. It can generate Circos plots with basic tracks directly from the genome data. In this case study, we used the Circos function to analyze and visualize the chromosomal distribution and syntenic relationships of CAX genes in 'GP'. The procedure is as follows:
(1) Select Ananas comosus (GP.v1.0.0), navigate to Circos, and click the button (Supplementary Fig. S3a).
(2) In GeneSet, select the GP_CAX gene set as the highlighted gene set. In TrackInfo, select GC Track, Gene Density Track, and Link in sequence (Supplementary Fig. S3b).
(3) Click Start to run the analysis (Fig. 6e).
(4) The files of the results are automatically saved in the AdvanceCircos folder and named by the start time of the run. Users can right-click the result file and select Open with Advanced to open it directly in the plotting interface.
Synteny analysis among the 'GP', 'BL', and 'LY' genomes
-
Conventional workflows for synteny analysis across multiple genomes require manual integration of the genome link information. They also lack an intuitive layout preview. As a result, users often need to arrange the layout according to their experience and rerun the analysis after repeated adjustment. SGH introduces a draft layout function. This function allows users to arrange the positions of multiple genomes before sequence comparison and supports batch execution of pairwise genome synteny analysis. It therefore reduces the operational burden on researchers. In this case study, we performed whole-genome synteny analysis and visualization of 'GP', 'BL', and 'LY'. The procedure is as follows:
(1) Select Ananas comosus (GP.v1.0.0), navigate to Multiple Synteny, and click the button (Supplementary Fig. S4a).
(2) In Genome Selection, drag Ananas comosus (BL.v1.0.0) and Ananas comosus (LY.v1.0.0) into the Layout Workspace for layout design.
(3) (Optional). In the layout interface, select any genome. Choose the corresponding gene set in Highlight Set, and edit the rotation angle in Layout Controls.
(4) Right-click Ananas comosus (BL.v1.0.0) and Ananas comosus (GP.v1.0.0) in sequence to create a synteny link between the two genomes (Supplementary Fig. S4b).
(5) Right-click Ananas comosus (LY.v1.0.0) and Ananas comosus (GP.v1.0.0) in sequence to create a synteny link between the two genomes (Supplementary Fig. S4b).
(6) Click Start to complete synteny analysis and visualization among the three genomes (Supplementary Fig. S4c; Fig. 6f).
(7) The files with the results are automatically saved in the MultipleCompare folder and named by the start time of the run. Users can right-click a result file and select Open with Multiple Synteny Viewer to reopen the interactive plotting interface.
-
In the postgenomic era, the rates of data generation and data updates have exceeded the pace at which researchers can explore these resources. Online databases such as the Ananas Genomics Database[12] provide platforms for data storage and download. By building indexes and query interfaces, they collect genome-related data in a relatively standardized manner. However, these databases usually focus on model species or widely studied species. Large amounts of data from nonmodel species and unpublished datasets still need to be stored and managed on local platforms. Software like System for Omics Data Access and Retrieval (SODAR) can manage large datasets and analysis files in local environments[25]. However, its deployment relies on large Linux systems and dedicated administrators, making it unsuitable for personal platforms. Unipro UGENE provides project management functions through a graphical user interface, but its functions mainly focus on sequence operations and cannot be readily connected to conventional genome analysis workflows[26]. We still lack a genome data management tool for individual users. As a result, researchers often need to manage these data manually. This requires them to understand genome-related data formats and user-defined standards, manually plan storage paths, and maintain records from memory or local documents. Such practice can readily lead to data dispersion, data loss, or the use of incorrect files.
SGH is a genome data management and analysis tool built around local data. It supports deployment across platforms, requires no coding, and provides an intuitive interface. Its lightweight design and genome-specific data model address the strong dependence on manual operations in local genome management and analysis. First, SGH stores different datasets in a standardized manner by pairing each genome with one corresponding annotation set. This substantially reduces the burden of directory planning and file documentation. Second, SGH provides an intuitive and interactive directory tree, which allows users to edit and manage stored files in a flexible and efficient way. In addition, SGH integrates multiple automated functions, enabling most operations to be completed through simple clicks. Users therefore do not need to manually identify and connect complex result files. As a cross-platform local tool, SGH supports Windows, macOS, and Linux, thereby reducing concerns about operating system compatibility. It keeps data within the user's own computing environment, allowing unpublished or sensitive datasets to be managed and analyzed without external transfer. In the case study, SGH also showed substantial ease of use across multiple workflows, including BLAST analysis, expression analysis, and synteny analysis. Together, these targeted designs and optimizations in SGH reduce the burden on users. With SGH, researchers can devote more time to experimental planning and research tasks, thereby improving overall efficiency across the research cycle.
Data-centered design improves the automation and intelligence of analytical functions
-
In genomic research, even well-established workflows such as synteny analysis still require separate tools for data mining and visualizing the results. Integrated platforms such as TBtools-II provide many functions with few dependencies[1]. However, users need to select tools and connect inputs and outputs manually at each step. The PhyloSuite v2 platform integrates separate sequence alignment and tree construction tools into an automated workflow based on data features such as GenBank records[27]. This design substantially simplifies the construction of phylogenetic trees from multiple gene sequences. However, genomic data are large and diverse in type, and many related tools are Linux command line programs. As a result, automated tools for genome analysis workflows have long been lacking.
Through strict and standardized management of data types, SGH closely integrates genomic data with analysis tools and enables a direct connection between upstream and downstream tools. This design differs fundamentally from that of TBtools-II, which is organized around individual analytical tools. In the synteny analysis example, users only need to select the genomes to be analyzed. The full workflow, from pairwise synteny comparison to visualization, can then be completed in a single step. In TBtools-II, however, these steps are separate, each requiring users to locate the function, prepare the inputs, and manage the outputs sequentially. In addition, SGH is implemented in Java and is well suited to the TBtools-II environment widely used by experimental researchers. It is easy to install and requires few external dependencies. This design also makes it more feasible to add new tools or build new analysis workflows in future versions.
Structured management of genome data enables AI readiness
-
In biological research, different biological questions and data types require corresponding tools. From this perspective, data and tools, or analytical functions, are often separated. In practice, for most data analysis tasks, a large part of the researchers' work is essentially converting the data format. In recent years, large language models (LLMs) have advanced rapidly, and increasing numbers of researchers have begun to use coding agents for data analysis. However, LLMs remain probabilistic models, and stable execution is difficult to ensure in complex environments[28]. Well structured data, deterministic functions, and clear documentation, especially their integration, can largely address this issue[29]. SGH provides a well organized genome data framework and a toolkit with clearly defined functions, meeting part of the requirements of AI-based research workflows. In future versions, SGH will not only build analysis workflows through hard-coded procedures, but will also provide more flexible data and function interfaces, together with reliable example documents and test datasets. These additions will support the integration of AI-assisted analysis and further improve the efficiency of exploring genome data by biological researchers.
-
We define a reference genome and its gene structural annotation as a single data unit and implement this model in Simple Genome Hub. By linking local genome management with data mining, analysis and visualization, Simple Genome Hub improves genome data exploration and provides a structured framework for future coding agents.
-
The authors confirm their contributions to the paper as follows: project conception: Chen C, Huang L, Wang Z; software function design and Java code implementation, figure preparation and manuscript writing: Chen C, Wang Z; tutorial manual preparation: Huang L, Liang Z, Wang Z; functional testing, efficient identification of the pineapple CAX gene family and expression analysis related to watercore: Liang Z, Tang S. All authors reviewed the results and approved the final version of the manuscript.
-
The source code of Simple Genome Hub has been deposited on GitHub (https://github.com/taaan-k/SimpleGenomeHub). The analysis steps used to obtain the whole-genome expression matrix for 'GP' in the identification and expression analysis of the pineapple CAX gene family are provided as Supplementary File 1. The detailed tree-building method and parameters used by the 'Build a Tree with Top N Hits' function are provided in Supplementary File 2. No other new data were generated in this study.
-
The authors declare that they have no conflict of interest.
-
accompanies this paper online at https://doi.org/10.48130/gcomm-0026-0021.
- Supplementary Table S1 Hardware information used for the running example and the running time of each function.
- Supplementary Fig. S1 Genome import and BLAST analysis results.
- Supplementary Fig. S2 Expression analysis of CAX candidate genes in 'GP'.
- Supplementary Fig. S3 Circos plot generation for the 'GP' genome.
- Supplementary Fig. S4 Synteny analysis among three pineapple genomes.
- Supplementary File 1 Generation of the whole-genome expression matrix for 'GP'.
- Supplementary File 2 Construction of a maximum-likelihood phylogenetic tree from the top BLASTP hits.
- Copyright: © 2026 by the author(s). Published by Maximum Academic Press, Fayetteville, GA. This article is an open access article distributed under Creative Commons Attribution License (CC BY 4.0), visit https://creativecommons.org/licenses/by/4.0/.
-
About this article
Cite this article
Wang Z, Liang Z, Tang S, Huang L, Chen C. 2026. Simple Genome Hub: a local platform for genome data management and analysis. Genomics Communications 3: e021 doi: 10.48130/gcomm-0026-0021 

Simple Genome Hub: a local platform for genome data management and analysis
- Received: 29 June 2026
- Revised: 17 August 2026
- Accepted: 19 August 2026
- Published online: 24 September 2026
Abstract: Reference genome datasets are essential for life science research, including studies of gene function, comparative genomics, evolution, and synthetic biology. As genome resources continue to grow, many studies now face a shift from limited access to excess data. The main challenge has therefore moved from data storage to data management. Online genome databases support access and analysis for well-studied species, but many genomes from less studied organisms remain difficult to manage and use. To address this need, we developed Simple Genome Hub, a cross-platform interactive tool for local genome data management and analysis. It uses one genome and one annotation set as the basic data unit. This design supports standard storage, version management, and direct access to local genome resources. Simple Genome Hub also integrates multiple analysis tools as plugins, allowing users to complete steps from data import and functional analysis to figure generation. Using CAX gene family identification across multiple pineapple (Ananas comosus) germplasm accessions and an expression analysis related to watercore as a case study, we show its utility in genome management, BLAST analysis, expression analysis, and synteny analysis. Simple Genome Hub will reduce the burden of genome data management and workflow integration, helping researchers focus on biological questions.