


-
The consumption of tea has increased rapidly in recent years, not only due to its unique flavor but it also a healthy beverage for daily life. For modern life, the incidence of dental caries has become a big problem year-on-year, gum bleeding, periodontal disease and other dental diseases have attracted more attention. Periodontal disease, a chronic dental infection, can greatly influence human health, causing dental caries, periodontal diseases and tooth loss. Dental caries result from bacterial infections, and have a deleterious effect on pulmonary disease[1] and hyperglycemia[2]. It is usually accompanied by plaque formation, dental inflammation, and tissue destruction. A population-based study showed that good oral condition was associated with a lower diversity of oral microbiome[3]. Abundant pathogenic species such as Porphyromonas gingivalis (P. gingivalis), Fusobacterium nucleatum (F. nucleatum), Prevotella intermedia, and Actinobacillus actinomycetemcomitans around plaque biofilm play a key role in the progress of periodontal disease. The suppression of oral periodontal pathogens can control plaque biofilms and the processes of periodontal diseases[4]. Antibiotic treatment is one of the current management approaches with periodontopathic bacteria but has some side effects such as the development of increased clinical resistance. Hence, there is a need for safe, effective drugs, free of side-effects.
With this in mind, plant flavonoids with a wide range of antioxidant and antibacterial potential have attracted great interest. Cranberry flavonols[5], cocoa polyphenols[6], curcumin as well as quercetin and its derivatives[7] exhibited excellent antibacterial capacities against a wide variety of oral pathogens. Tea contains a variety of natural antibacterial compounds. Clinical and biological studies have verified that tea could reduce dental caries through inhibiting bacterial growth and enzyme activities[8] and tea polyphenols greatly inhibited the adhesion of oral pathogens[9]. Ooshima et al.[10] found that oolong tea extract significantly inhibited plaque deposition among 35 human volunteers. Awadalla et al.[11] rinsed the oral cavity of dental patients with 2% green tea, Streptococcus mutans (S. mutans) count decreased by 20.9%, and the gingival bleeding index decreased by 52.5%, which confirmed the antibacterial properties and cavity prevention of green tea. Ben Lagha et al.[12] also found that green tea and black tea extracts, EGCG, and theaflavins all had excellent inhibition activity on the growth and virulence properties of F. nucleatum. Several hypotheses have been invoked to account for the underlying mechanisms of tea on salivary microbiota. It is known that tea polyphenols possess antimicrobial properties, which are believed to aid in the inhibition of certain bacteria, including some pathogens[8,9].
These plant flavonoids are one of several potential drugs for oral diseases as they are safe, available, and have limited side effects. The development of modern analytical and chromatography technology enables the isolation and purification of flavonoids and their derivatives, and hundreds of natural compounds are potentially available for investigation and application.
Acylated flavonoids are newly reported natural products which are found in the leaves of cabbage[13], spinach[14], Stenochlaena palustris[15], Eugenia jambolana[16], and legume[17]. In plants, acylation can increase the molecular stability of compounds and enhance biological functions[18]. The acylated flavonoids found in tea materials possess several health benefits including inhibition of alcohol dehydrogenase[19], reducing fat and stimulating weight loss[20], and regulating blood glucose and lipid metabolism[21]. Their isolation and purification on a large scale has not been widely conducted, however, which limits further studies on their efficacy and application. Extensively researched acylated flavonoids extracted from tea and combined with other antibacterial agents help to develop safe, practical and effective oral products and broaden the application of pharmacological components of tea in the field of stomatology and is of great importance.
In the present work, we used a combined chromatography technology to isolate two acylated flavonol glycosides (AFGs) from tea product Y303 material. Two AFGs were identified by liquid chromatography tandem mass spectrometry (LC-MS/MS) and their nuclear magnetic resonance (NMR) spectra and information about seasonal change and tea cultivar variation on the content of these derivatives were investigated. The effect of sunlight irradiance on the accumulation of these two compounds was also discussed. Moreover, the antibacterial activities of these compounds against key oral pathogens were studied, and their antibacterial action and mechanism are discussed.
-
Fifty tea cultivars which grow in the same tea garden were selected (Hangzhou, Zhejiang). These cultivars originated from tea producing provinces including Zhejiang, Fujian, Anhui, Hunan, Guangdong, Guizhou, and Jiangxi. The fresh tea leaves were collected on the same autumn day in 2019 and dried by microwave at 700-800 W for 30 s, twice and kept in a hot air-drying machine under 60 °C for 3−4 h (final water content of tea samples were lower than 6%). And fresh leaves of 'Fujian Shuixian', 'Meizhan', and 'Caicha' cultivars which were blended to make tea product Y303 were sequentially collected in spring, summer, early autumn, and late autumn from plants in the same tea garden and dried with the same method as described above.
A combined purification technology using macroporous resin and preparative high-performance liquid chromatography (HPLC) for AFGs isolation
-
One kilogram of tea product Y303 powder (< 0.15 mm) was extracted with 15 L 70% ethanol through an ultrasonic-assisted extracting machine in 1 h, over two cycles. To completely remove ethanol, the extracts were combined and concentrated with a rotary evaporator at 50 °C. Then the obtained aqueous solutions were further concentrated, and a final freeze-dried powder was obtained and stored at −80 °C for further separation (crude extract I). The macroporous resins of D101, AB-8, HPD-400, and HPD-500 were used for enrichment of two AFGs. The selection of resins was based on their adsorption and desorption capacities, and desorption ratio of two target compounds. The general operating procedure was followed as described by Fu et al.[22]. AB-8 resin was found to have the highest adsorption and desorption capacities for the target compounds and was used for further isolation.
Crude extract I from tea product Y303 was prepared at a moderate concentration and loaded into an AB-8 resin column and adsorbed for 1 h. The column was then washed with 2 bed volumes (BV) of deionized water and sequentially with 1 BV of different concentration of ethanol solution (20%, 40%, 60%, and 80%) at a flow rate of 1.5 BV/h. The eluate enriched with the two target compounds was identified by HPLC analysis and the enriched fractions were combined, concentrated by rotary evaporation, and vacuum freeze drying to obtain the crude extract II with a higher purity.
The crude extract II was dissolved in pure methanol, the solution was centrifuged and filtered with a 0.22 μm membrane and a 200 mg/mL solution (0.5 mL) was injected into the ÄKTA Purifier 100 preparation system (GE Healthcare Bio-Sciences AB, Sweden). The preparative conditions were as follows: Agilent SB-C18 column (10 μm, 250 × 21.2 mm), mobile phase A (0.1% formic acid in water)-phase B (0.1% formic acid in acetonitrile), gradient elution: 0−25 min, 25%−26.5% B; 25−45 min, 26.5%−27.5% B, flow rate 5 mL/min. The purified fractions containing the two target compounds named as F1 and F2 were combined, concentrated, freeze-dried, and then stored for further analysis.
Identification of F1 and F2 by ultra-performance liquid chromatography quadrupole time-of-flight mass spectrometry (UPLC-qTOF MS/MS) analysis
-
The purified F1 and F2 fractions were dissolved with methanol at a concentration of 0.1 mg/mL and identified with an AB Triple TOF 5600plus System (AB SCIEX, Framingham, USA). The Welch Ultimate XB-C18 (1.8 μm, 2.1 × 100 mm) column and mobile phases A (0.1% formic acid in water) and B (0.1% formic acid in acetonitrile) were used in acquisition mode and negative ion mode under the following conditions: scan range from m/z 100 to 2000 Da; the pressure of gas 1 (air) and gas 2 (air) were set to 50 psi, the pressure of curtain gas (N2) was set to 35 psi; the source temperature was 550 °C; ion source voltage (IS): −4.5 kV; primary scan: declustering potential voltage (DP): 100 V; focus voltage (CE): 10 eV; secondary scan: acquisition of mass spectral data using TOF MS-Product Ion-IDA mode, CID energy of 40, 60, and 80 eV. The exact mass calibration was performed automatically before each analysis employing an automated calibration delivery system.
NMR analysis
-
A Bruker BioSpin AG 1H-NMR (500 MHz) and 13C-NMR (125 MHz) spectrometers were employed for the structure identification of two purified compounds with 1H NMR and 13C NMR.
Analytical HPLC and UPLC-MS
-
Tea samples (1 g) were extracted with 15 mL 70% methanol using ultrasonic-assisted extraction for 30 min. The centrifuged and filtered extracts were analyzed for F1 and F2 using a Shimadzu LC-2010A HPLC or UPLC-MS system. Here, the Agilent ZORBAX SB-C18 column (5 μm, 4.6 × 250 mm), mobile phases A (0.1% formic acid in water) and B (0.1% formic acid in acetonitrile) were adopted. The HPLC elution procedure is shown in Supplemental Table S1. The purified F1 and F2 were prepared for making standard curves. Two standard equations of y = 9701518x + 61671 (r2 = 0.9999) and y = 8405234x + 5466 (r2 = 0.9991) were used for calculating the content of F1 and F2 in different tea samples, ranging from 0.02−0.2 mg/mL and 0.005−0.08 mg/mL for F1 and F2, respectively.
The UPLC-MS (Waters Corporation, Milford, MA, USA) was also used to analyze the target compounds in different tea extracts, equipped with a Welch Ultimate XB-C18 column (1.8 μm, 2.1 × 100 mm) with the mobile phases A and B and elution procedure as listed in Supplemental Table S2. A total of 10 μL of the sample solution was analyzed with a flow rate of 0.3 mL/min and recorded at 360 nm. The identified peaks were scanned by electrospray ionization (ESI) in a negative ion mode from m/z 100 to 2000. The MS conditions were: capillary voltage 3 kV, extractor voltage 4.0 V, cone voltage 30 V, ion source temperature 150 °C, desolvation temperature 300 °C, desolvation gas flow 600 L/h.
Determination of the minimal inhibitory concentrations (MIC)
-
The inhibitory potential of candidate compounds against the growth of P. gingivalis (ATCC 33277) and F. nucleatum (ATCC 25586) was tested by determining the MIC. A microdilution assay was used and followed the guidelines of the Clinical and Laboratory Standards Institute[23]. Two strains were inoculated on blood agar medium under anaerobic environment (80% N2, 10% CO2, 10% H2) at 37 °C for 5−7 days. Single colonies on the medium surface were picked and cultivated for further experiment. Standardized (OD600 = 0.1) dilutions of two strains (100 μL) were prepared and loaded into a 96-well plate. A serial concentration of tested compounds was diluted from 0.48 mM to 0.015 mM and 100 μL dilutions added to the bacteria samples in the 96-well plate. After 48 h incubation, the visible growth of each well was observed by eye and the MICs were determined as the lowest inhibitory concentration.
Determination of biofilm formation
-
One hundred microliters diluted P. gingivalis and F. nucleatum cultures at OD600 = 0.1 together with 100 μL tested compounds at 0.03, 0.06, 0.12, and 0.24 mM were added to a 96-well plate. Control wells with no compounds were also inoculated. After 48 h cultivation, the brian heart infusion (BHI) medium was removed by aspiration and each well was gently washed with sterile PBS buffer twice. Then, 100 μL of 0.2% crystal violet solution was added to each well and incubated for 15 min. The wells were washed with sterile PBS buffer 3 times to remove unbound crystal violet dye and dried at 37 °C. After completely drying, 100 μL of 33% acetic acid solution was added and incubated for 20 min. The well without tested compounds was used as control. Then all wells were measured at 570 nm, with a microplate reader. All experiments were conducted three times. The inhibitory rate of biofilm formation was calculated as follows:
Biofilm inhibition rate = (Control group OD−Treatment group OD)/ Control group OD * 100%
Determination of siderophore activity
-
For measuring the iron-chelating capacities of different compounds, the siderophore assay of Schwyn and Neilands[24] and Ben Lagha et al.[12] were adopted.
Statistical analysis
-
All measurements were carried out in triplicate (n = 3), and the values are presented as the mean ± SD, unless otherwise specified. One-way ANOVA with Turkey tests was applied to determine significant differences. GraphPad Prism (version 8.0) software was applied for statistical analysis. All results were considered statistically significant at p < 0.05.
-
Two candidate peaks F1 and F2 (RT = 14.951, 15.633; protonated/deprotonated ions m/z 1051.2838/1049.2775, 1034.2859/1033.2822) were initially identified from tea product Y303 extracts by UPLC-MS (Fig. 1). To identify their exact structures, these two compounds were isolated by resin column separation and preparative HPLC chromatography. Y303 tea extracts were initially obtained by ultrasound-assisted extraction which can greatly enhance material disruption, solvent penetration, and mass transfer[25], followed by concentrating and freeze-drying to obtain crude extract I. Considering the highest adsorption and desorption capacities of the two target compounds (Supplemental Table S3), AB-8 resin was selected to separate AFGs-rich fractions from crude extract I as described in Section 4.2. Sequential elution with water and gradient ethanol solutions, selectively removed the impurities such as phenolic acids, minerals, and sugars and the F1 and F2 rich fraction were obtained by eluting with 60% and 80% ethanol solutions. The collected eluates were analyzed by HPLC method and the fractions rich in F1 and F2 were combined, evaporated, and freeze-dried, to obtain crude extract II. This extract was further purified with a preparative HPLC program which showed a good separation of F1 (peak 8) and F2 (peak 11) from other non-target compounds (Supplemental Fig. S1). The separated F1 and F2 fractions were collected with an automatic fraction collector and quantified by the UPLC-MS system. The purified fractions (> 95%) of each monomer were concentrated, evaporated, and freeze-dried. The purity of F1 and F2 were verified as 98.77% and 97.08%, respectively (Fig. 2). The MS/MS data of F1 and F2 in negative mode are shown in Supplemental Table S4. To further explore their exact structures, the isolated compounds were subjected to 1H NMR and 13C NMR analysis (Supplemental Table S5).
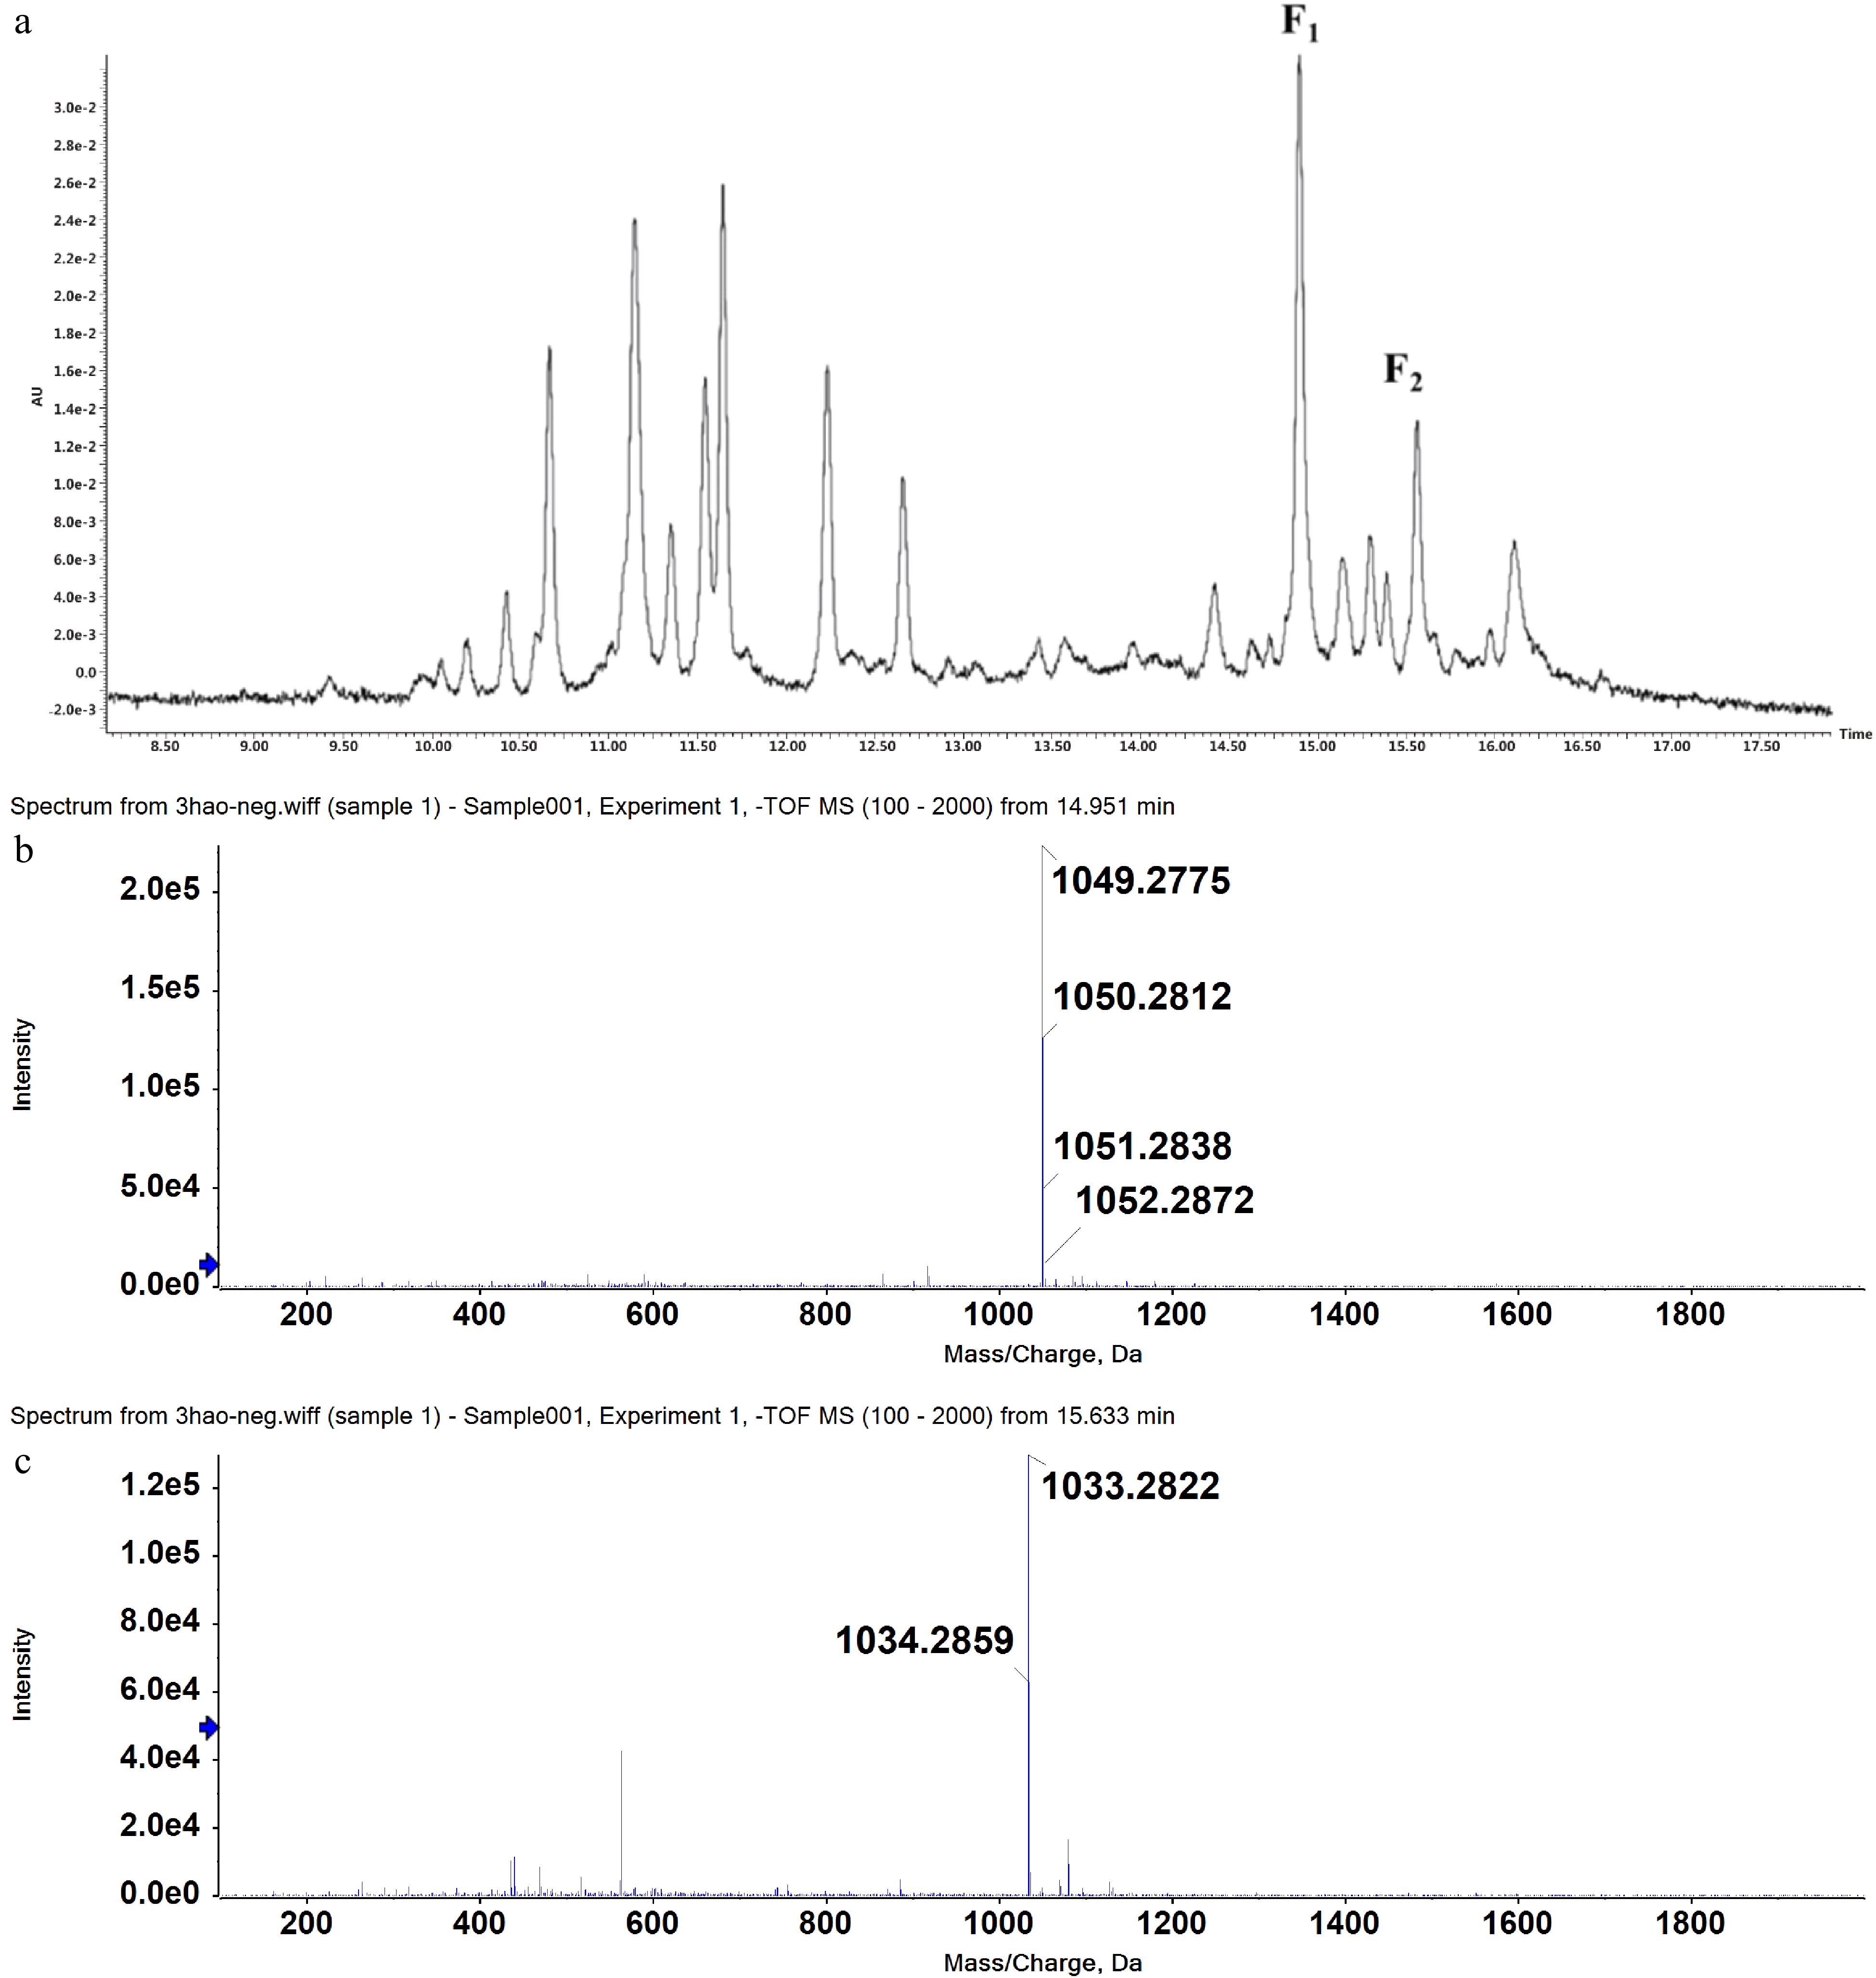
Figure 1.
UPLC chromatogram (UV detection at 360 nm) of ethanol extracts of tea product Y303 (a) and mass spectrometry scan results of peak F1 (b) and peak F2 (c).
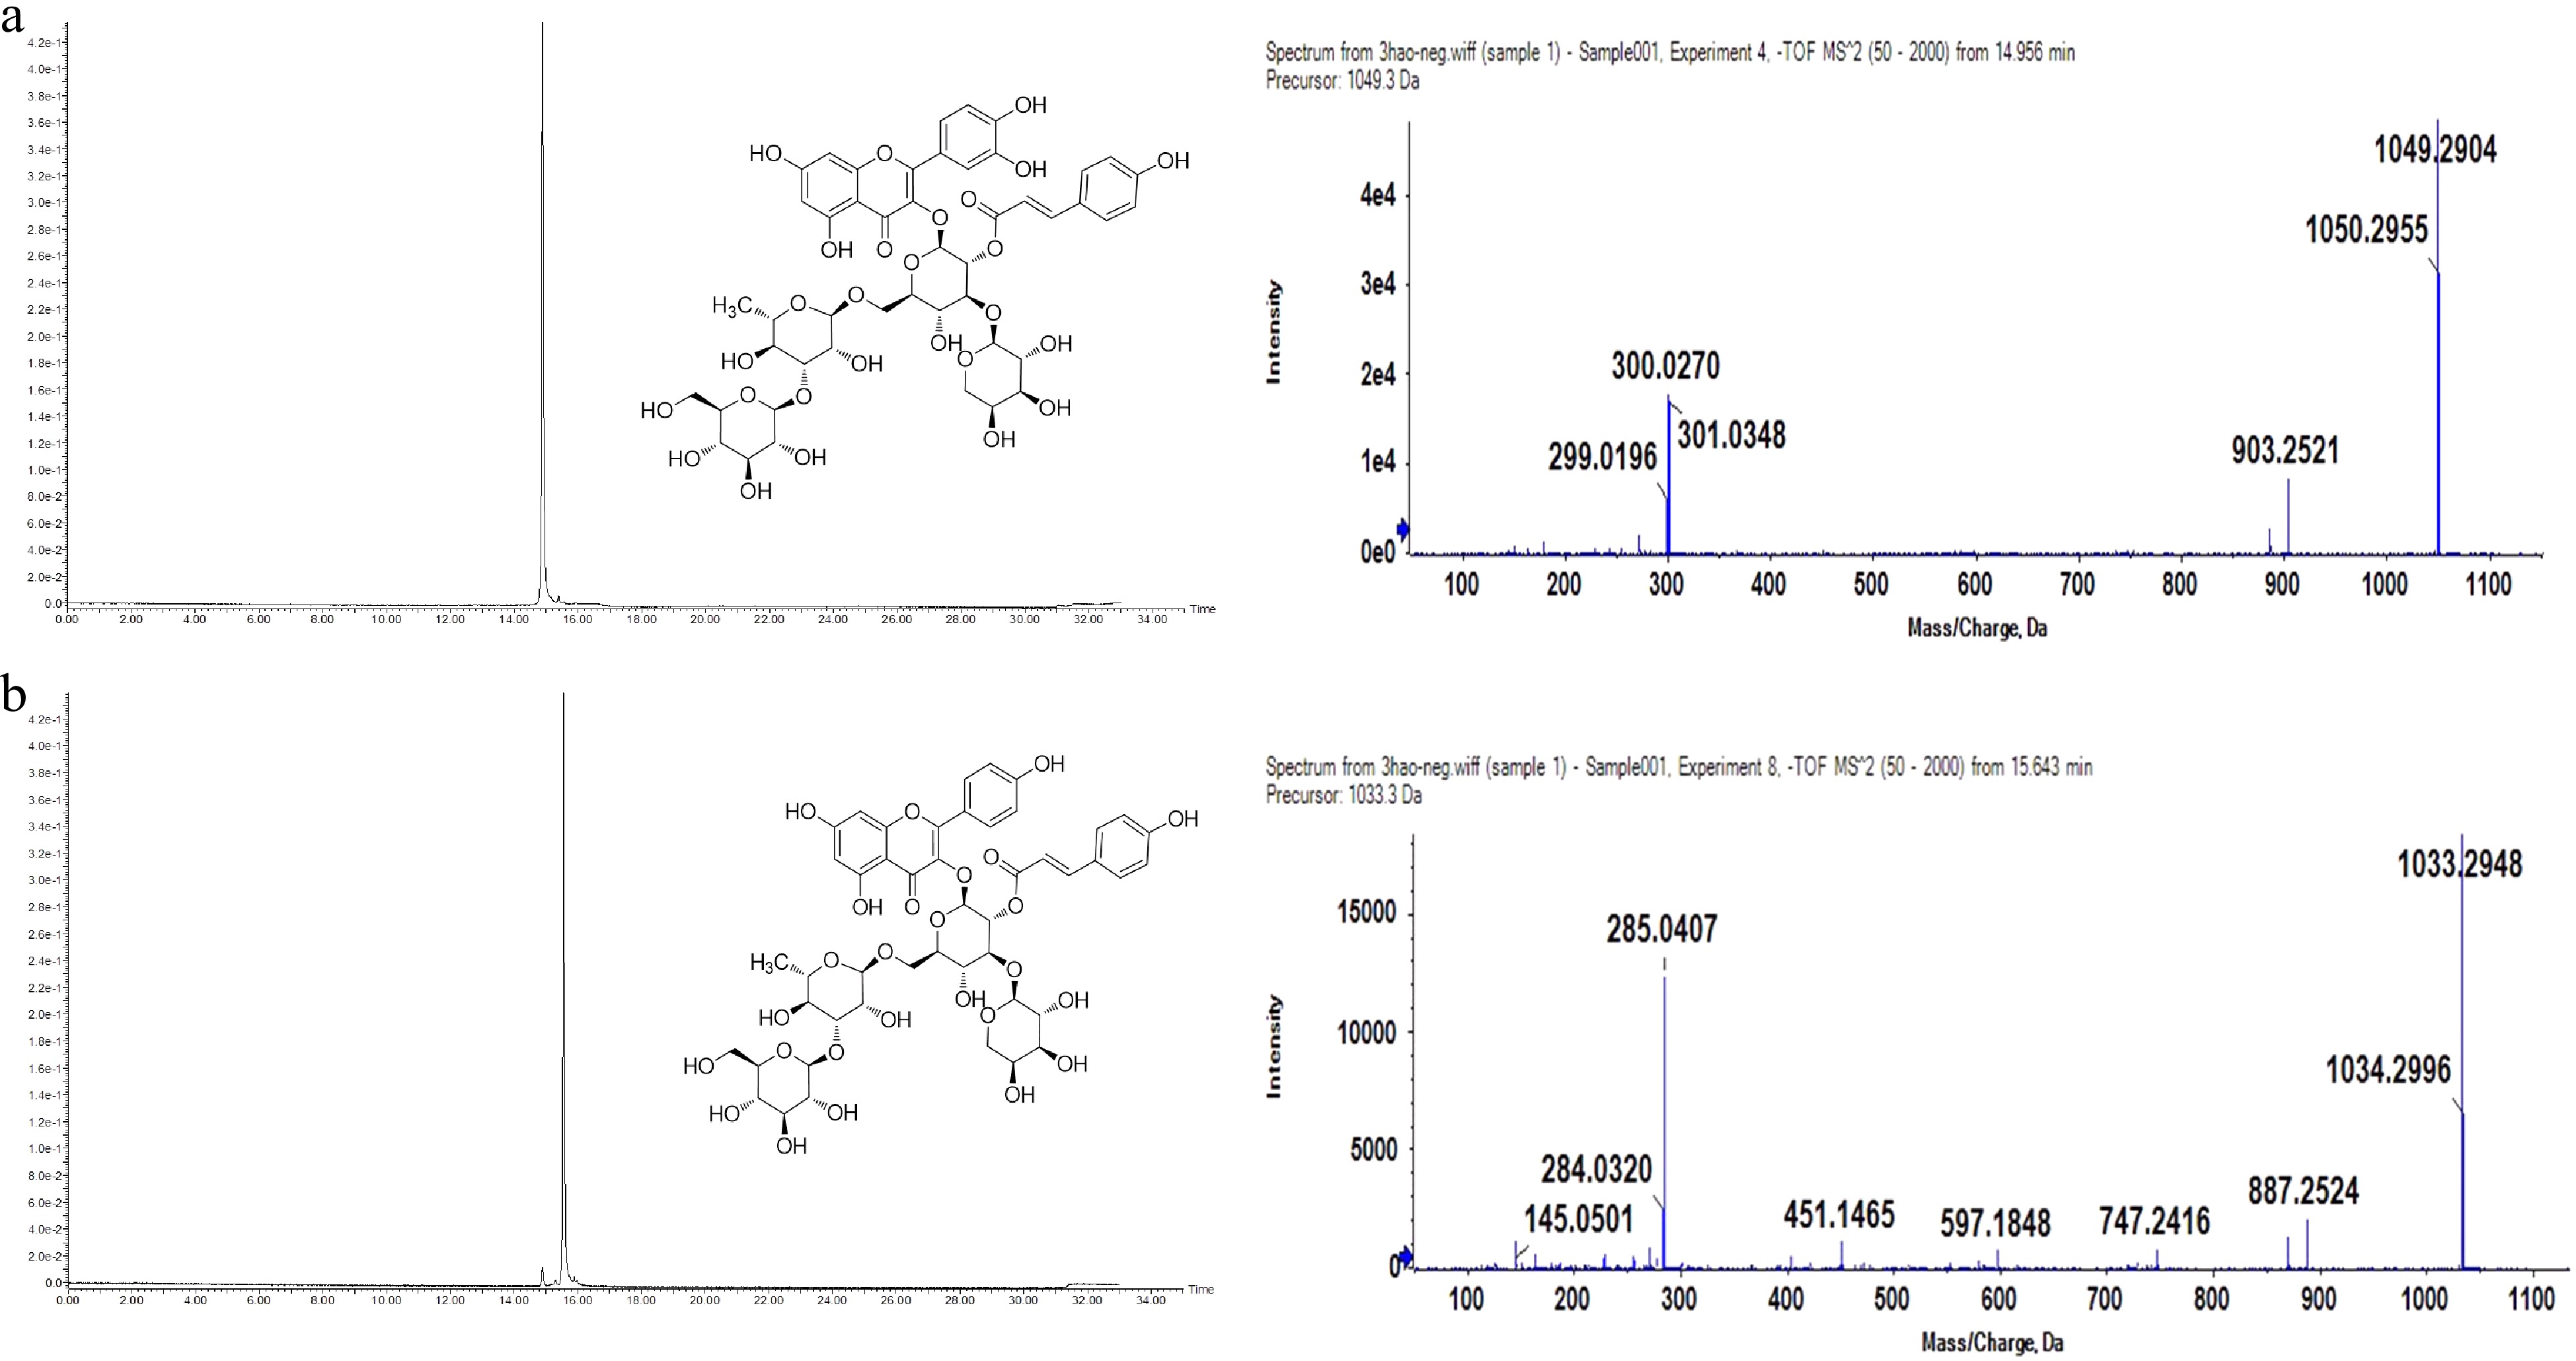
Figure 2.
UPLC (UV detection at 360 nm) and MS/MS chromatograms in negative ion mode of purified F1 (a) and F2 (b).
F1: Yellow amorphous powder, HRMS m/z [M-H]- 1049.2904, molecular formula C47H54O27.
13C NMR (125 MHz, MeOD) δ 177.62, 167.36, 164.28, 161.62, 159.86, 157.52, 157.02, 148.25, 145.92, 144.49, 133.56, 129.95, 125.95, 122.09, 121.85, 116.16, 115.38, 114.80, 113.78, 104.48, 104.16, 103.89, 100.90, 99.57, 98.43, 93.44, 83.07, 81.68, 76.12, 75.38, 74.10, 73.15, 72.49, 71.17, 70.83, 69.88, 69.52, 68.77, 68.10, 67.07, 65.81, 60.71, 16.58.
1H NMR (500 MHz, MeOD) δ1.13(d, J = 6.1 Hz), 3.26(m), 3.28(dd, J = 10.6 Hz), 3.3(s), 3.43(d, J = 4.6 Hz), 3.45(s), 3.48(s), 3.50(s), 3.52(m), 3.54(s), 3.55(d, J = 2.0 Hz), 3.55(dd, J = 6.8, 3.9 Hz), 3.55(m), 3.63(s), 3.70(d, J = 4.2 Hz), 3.73(d, J = 4.2 Hz), 3.75(m), 3.86(s), 3.87(s), 3.87(td, J = 4.27, 10.35, 11.99 Hz), 3.99(dd, J = 3.3, 1.7 Hz), 4.34(d, J = 7.0 Hz), 4.45(d, J = 7.7 Hz), 4.61(d, J = 1.6 Hz), 5.23(dd, J = 9.46, 7.94 Hz), 5.56(d, J = 7.90 Hz), 6.14 (d, J = 2.06 Hz), 6.34(d, J = 2.12 Hz), 6.39(d, J = 15.88 Hz), 6.8(d, J = 8.39 Hz), 6.88(d, J = 8.43 Hz), 7.46(d, J = 8.62 Hz), 7.55(dd, J = 8.47, 2.21 Hz), 7.60(d, J = 2.22 Hz), 7.68(d, J = 15.94 Hz).
The 1H and 13C NMR spectral patterns of F1 were identical to a published quercetin tetraglycoside derivative[19]. It was confirmed as quercetin 3-O-[(E) -p-coumaroyl- (1→2)] [α-L-arabinopyranosyl- (1→3)] [β-D-glucopyranosyl- (1→3) -α-L-rhamnopyranosyl (1→6)]-β-D-glucopyranoside, and the structural formula is shown in Fig. 2.
F2: Yellow amorphous powder, HRMS m/z [M-H]- 1033.2948, molecular formula C47H54O26.
13C NMR (125 MHz, MeOD) δ 177.65, 167.21, 164.35, 161.67, 159.95, 159.88, 157.62, 157.07, 145.84, 133.38, 130.94, 129.91, 125.93, 121.47, 115.38, 114.86, 113.78, 104.47, 104.23, 103.91, 100.84, 99.45, 98.49, 93.50, 82.88, 81.71, 76.14, 75.41, 74.08, 73.11, 72.50, 71.14, 70.80, 69.86, 69.46, 68.83, 68.13, 68.09, 67.02, 65.80, 60.67, 16.58.
1H NMR (500 MHz, MeOD) δ1.12(d, J = 6.1 Hz), 3.25(d, J = 6.2 Hz), 3.27(s), 3.39(s), 3.43(d, J = 4.2 Hz), 3.45(s), 3.48(d, J = 3.1 Hz), 3.50(s), 3.52(d, J = 6.0 Hz), 3.54(d, J = 2.0 Hz), 3.55(s), 3.55(s), 3.59(m), 3.60(d, J = 3.2 Hz), 3.70(d, J = 4.1 Hz), 3.73(dd, 7.3, 3.2 Hz), 3.76(d, J = 6.4 Hz), 3.87(s), 3.87(s), 3.88(d, J = 5.9 Hz), 4.00(dd, J = 3.3, 1.7 Hz), 4.37(d, J = 7.0 Hz), 4.45(d, J = 7.7 Hz), 4.62(d, J = 1.7 Hz), 5.21(dd, J = 9.5, 8.0 Hz), 5.61(d, J = 7.90 Hz), 6.19(d, J = 2.1 Hz), 6.35(d, J = 2.11 Hz), 6.37(d, J = 15.9 Hz), 6.39(d, J = 8.8 Hz), 6.39(d, J = 8.8 Hz), 6.84(d, J = 8.6 Hz), 7.49(d = 8.7 Hz), 7.72(d, J = 15.9 Hz), 8.01(d, J = 8.8 Hz), 8.01(d, J = 8.8 Hz).
Therefore, it can be confirmed that F2 is kaempferol 3-O-[(E) -p-coumaroyl- (1→2)] [α-L-arabinopyranosyl- (1→3)] [β-D-glucopyranosyl- (1→3) -α-L-rhamnopyranosyl (1→6)]-β-D-glucopyranoside[21], which has four glycosyls attached a p-coumaryl moiety. The structural formula is shown in Fig. 2.
Bai et al.[21] extracted Lu'an GuaPian tea (9 kg) with 80% aqueous acetone three times and concentrated to a water-soluble extract. This water-soluble extract was applied to MCI-Gel CHP20P gel column chromatography (CC), Silica gel CC, Sephadex LH-20 CC and Toyopearl CC, then 18.7 mg compound 1 (F1) and 5.6 mg compound 9 (F2) were obtained. In the above study, the workload of initial extracting materials is relatively large. Complex column chromatography is used for separating AFGs with higher purity. In the present work, F1 and F2 with high purity can be obtained through a relatively simple process. High purities of F1 and F2 are helpful to a better quantitative detection with the HPLC or UPLC method. It is also convenient to the quantification of these two AFGs in different tea cultivars and different season samples. Besides, simple experimental steps and instruments make two AFGs in bulk in industrial production possible, large scale production will further promote their application. Using tea as a raw material to extract AFGs with high safety and limited side effects, leads to good practical significance and market prospects.
Seasonal changes in the contents of F1 and F2
-
Tea product Y303 is a type of refined tea which is blended with 'Fujian Shuixian', 'Meizhan', and 'Caicha' cultivar tea materials. To explore the difference of AFGs in these cultivar tea materials, the tea samples made from 'Fujian Shuixian', 'Meizhan', and 'Caicha' cultivars were obtained individually from the same tea garden and prepared with the same drying method. These tea materials from spring, summer, early autumn, and late autumn were extracted by methanol and analyzed by HPLC, and the contents of F1 and F2 were calculated using standard curves. Interestingly, 'Fujian Shuixian' tea had the highest F1 and F2 content of the three cultivar teas and 'Caicha' tea had the lowest amounts of F1 and F2 (Fig. 3a & b). A clear seasonal change of F1 and F2 was found in all three cultivar teas. The contents of F1 and F2 increased from spring to autumn and reached their highest amounts in late autumn. 'Fujian Shuixian' cultivar tea samples had relatively high amounts of F1, ranging from 0.93 mg/g to 1.1 mg/g in early and late autumn compared to spring and summer values which ranged from 0.48 mg/g to 0.81 mg/g. The same trends were also found in 'Meizhan' and 'Caicha' tea samples and the highest accumulation of F1 was observed in late autumn in all three cultivars. Compared to F1, the levels of F2 were relatively stable, increasing from spring and reaching their highest levels in late autumn of 0.41, 0.30, and 0.20 mg/g in 'Fujian Shuixian', 'Meizhan', and 'Caicha', respectively. The accumulation of these two AFGs in autumn is in agreement with the results showing that 2"-galloylated flavonol 3-O-glycosides in developing persimmon leaves reached the highest levels at the end of harvesting data with a corresponding decrease in non-galloylated flavonol glycoside[26]. Liu et al.[27] also found that AFGs such as quercetin-3-O-(6"-malonyl)-glycoside and kaempferol-malonyl-hexoside III in buds and leaves of black currant variety 'Mikael' increased during the whole growing season. Bouderias et al.[28] suggested that the significant boost of flavonol glycosides in autumn grapevine leaves might be a requirement for their antioxidant role related with environmental stress such as incident sunlight irradiation.
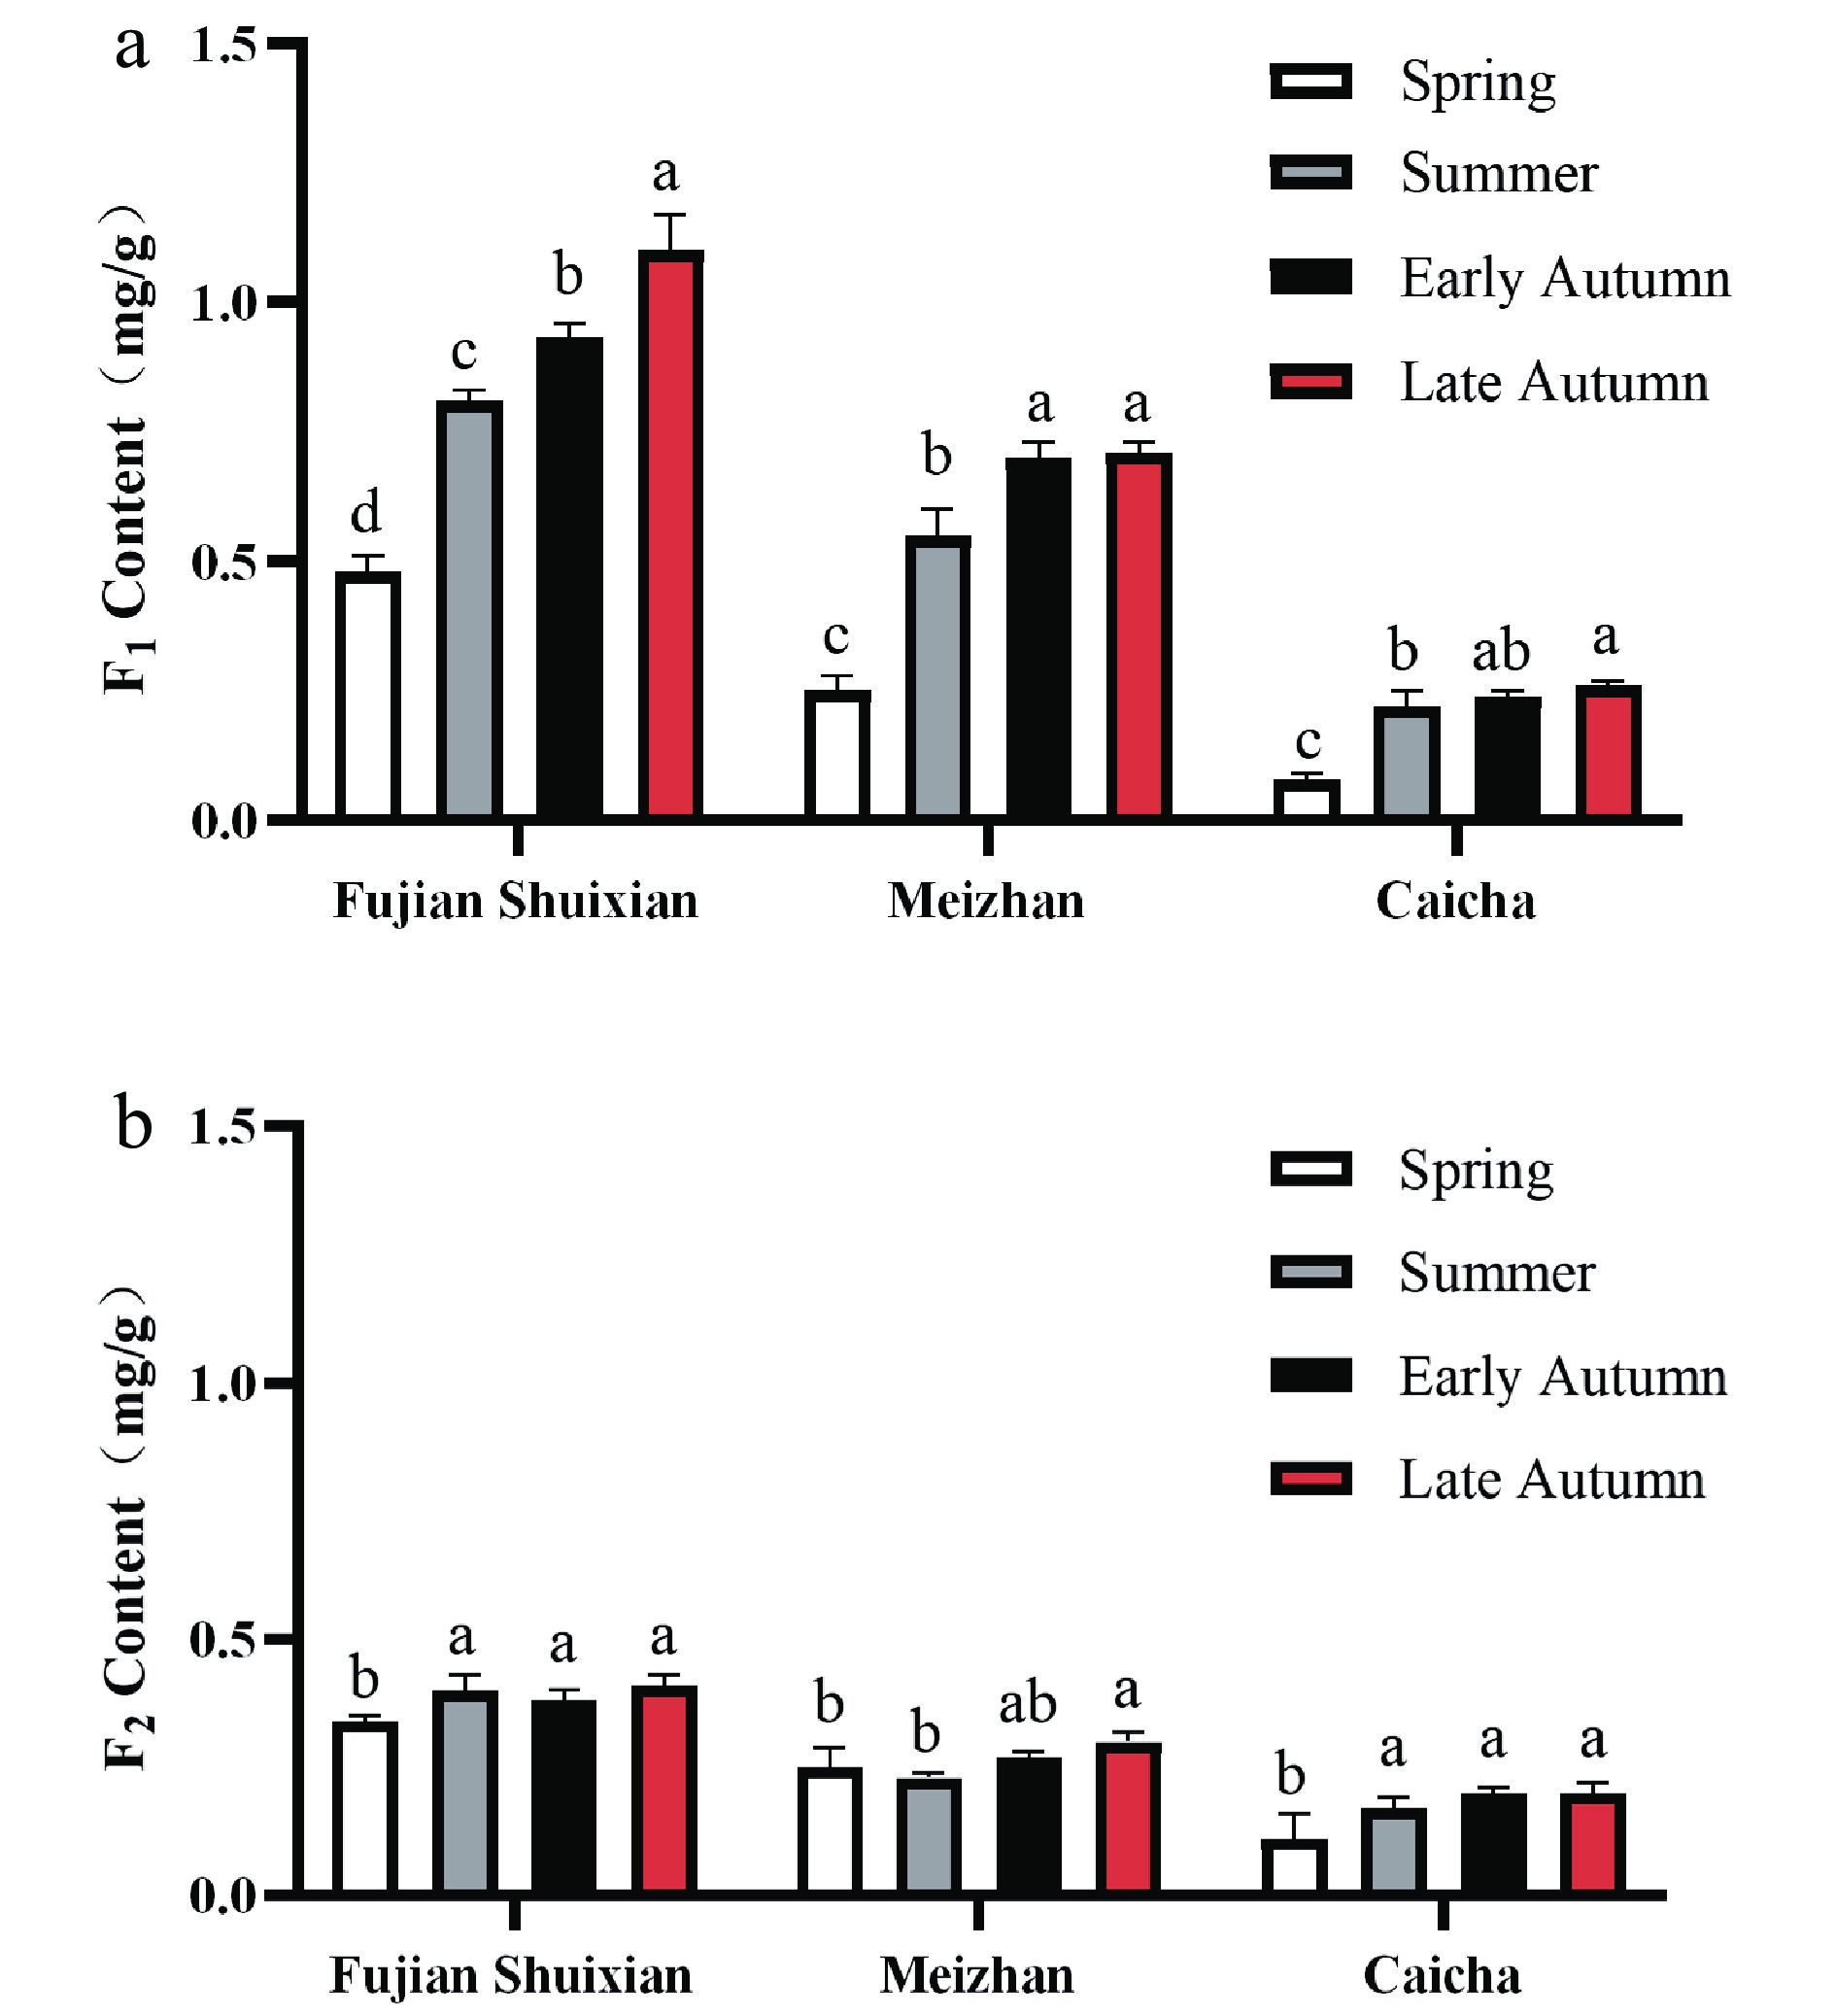
Figure 3.
Seasonal variation of two acylated flavonol glycoside in cultivar teas blended to form tea product Y303. Different letters (a, b, c) for the same cultivar indicate significant difference (p < 0.05).
The same interesting result from our unpublished data was found in that there was an least a 3-fold decline in F1 content when the 'Fujian Shuixian' tea cultivar was covered with black nylon net (80% of sunlight was excluded). This result also showed that the decrease in sunlight intensity resulted in a declined content of AFG. The impact of light irradiation on plant flavonoid biosynthesis has been widely studied. Abundant flavonol acylation was found to occur in UV-stressed Scots pine[29] and sunlight-irradiated Arabibopsis accessions[30]. The present results indicate a close relationship between light irradiation and acylation of flavonol.
Changes of F1 and F2 content in different tea cultivars
-
The cultivar differences in these two AFGs stimulated our interest to explore their distribution in other tea cultivars. Hence, fresh leaves of fifty tea cultivars widely cultivating in Zhejiang, Fujian, Anhui, Hunan, Guangdong, Guizhou, and Jiangxi provinces and growing in the same tea garden were collected on the same autumn day and dried for further analysis. The contents of F1 and F2 in each cultivar are listed in Supplemental Table S6 and the results are displayed as a heatmap (Fig. 4). This chart highlights the notable variation in F1 and F2 among different tea cultivars. In general, the F1 content ranged from 0−1.35 mg/g and F2 content ranged from 0−1.17 mg/g. 'Zhenghe Dabaicha' had the highest F1 content of 1.35 mg/g. 'Longjing 1', 'Tiantai Nanshanzhong', 'Zhenong 21', 'Ruian Qingmingzao', 'Bibo', 'Maoxie', 'Meizhan', 'Benshan', 'Fujian Shuixian', 'Qimen Fuxikouzhong', 'Hunan Yuntaishan', and 'Lushan Yunwu' had relatively high F1 content at around 1.0 mg/g. In contrast, F1 levels were undetectable in 'Yingshuang', 'Jingfeng', 'Fuding Dahaocha', 'Qilan', 'Lvya Foshou', and 'Ziya Foshou' samples. 'Wannong 95' had the highest F2 level of 1.17 mg/g, followed by 'Zaohuangcha' 0.64 mg/g and 'Zhenghe Dabaicha' 0.55 mg/g, respectively. F2 was undetectable in 'Jingfeng', 'Zisun', 'Fuding Dahaocha', 'Qilan', 'Lvya Foshou', and 'Ziya Foshou'. Generally, the level of F1 was higher than that of F2 in most tested tea cultivars, although 'Wannong 95' had an especially high F2 level which was about 2-fold above its F1 level. The content of tea flavonol glycosides have been analyzed by many researchers. Jiang et al.[31] analyzed the content of flavonol glycosides from green tea, oolong tea and black tea commercial samples by UHPLC. The abundance of kaempferol rhamnodiglucoside varied from 0.392 mg/g to 1.183 mg/g in green tea, quercetin glucorhamnoglucoside changed from 0.759 mg/g to 0.844 mg/g in oolong tea, quercetin glucoside ranged from 0.805 mg/g to 1.410 mg/g in black tea samples. Wu et al.[32] quantified the content of six flavonol glycosides from four tea cultivars, the results showed that myricetin 3-O-galactoside was the major component reaching the highest level at 2.018 mg/g in second leaves of the 'Shuchazao' cultivar. Zheng et al.[33] reported 13 flavonol glycosides in green tea, oolong tea, and black tea made from four cultivars, the highest level of kaempferol-3-O-glucosyl-rhamnosyl-glucoside was observed at 1.251 mg/g. Hence, the content of two AFGs obtained from this work are comparable to those flavonol glycosides.
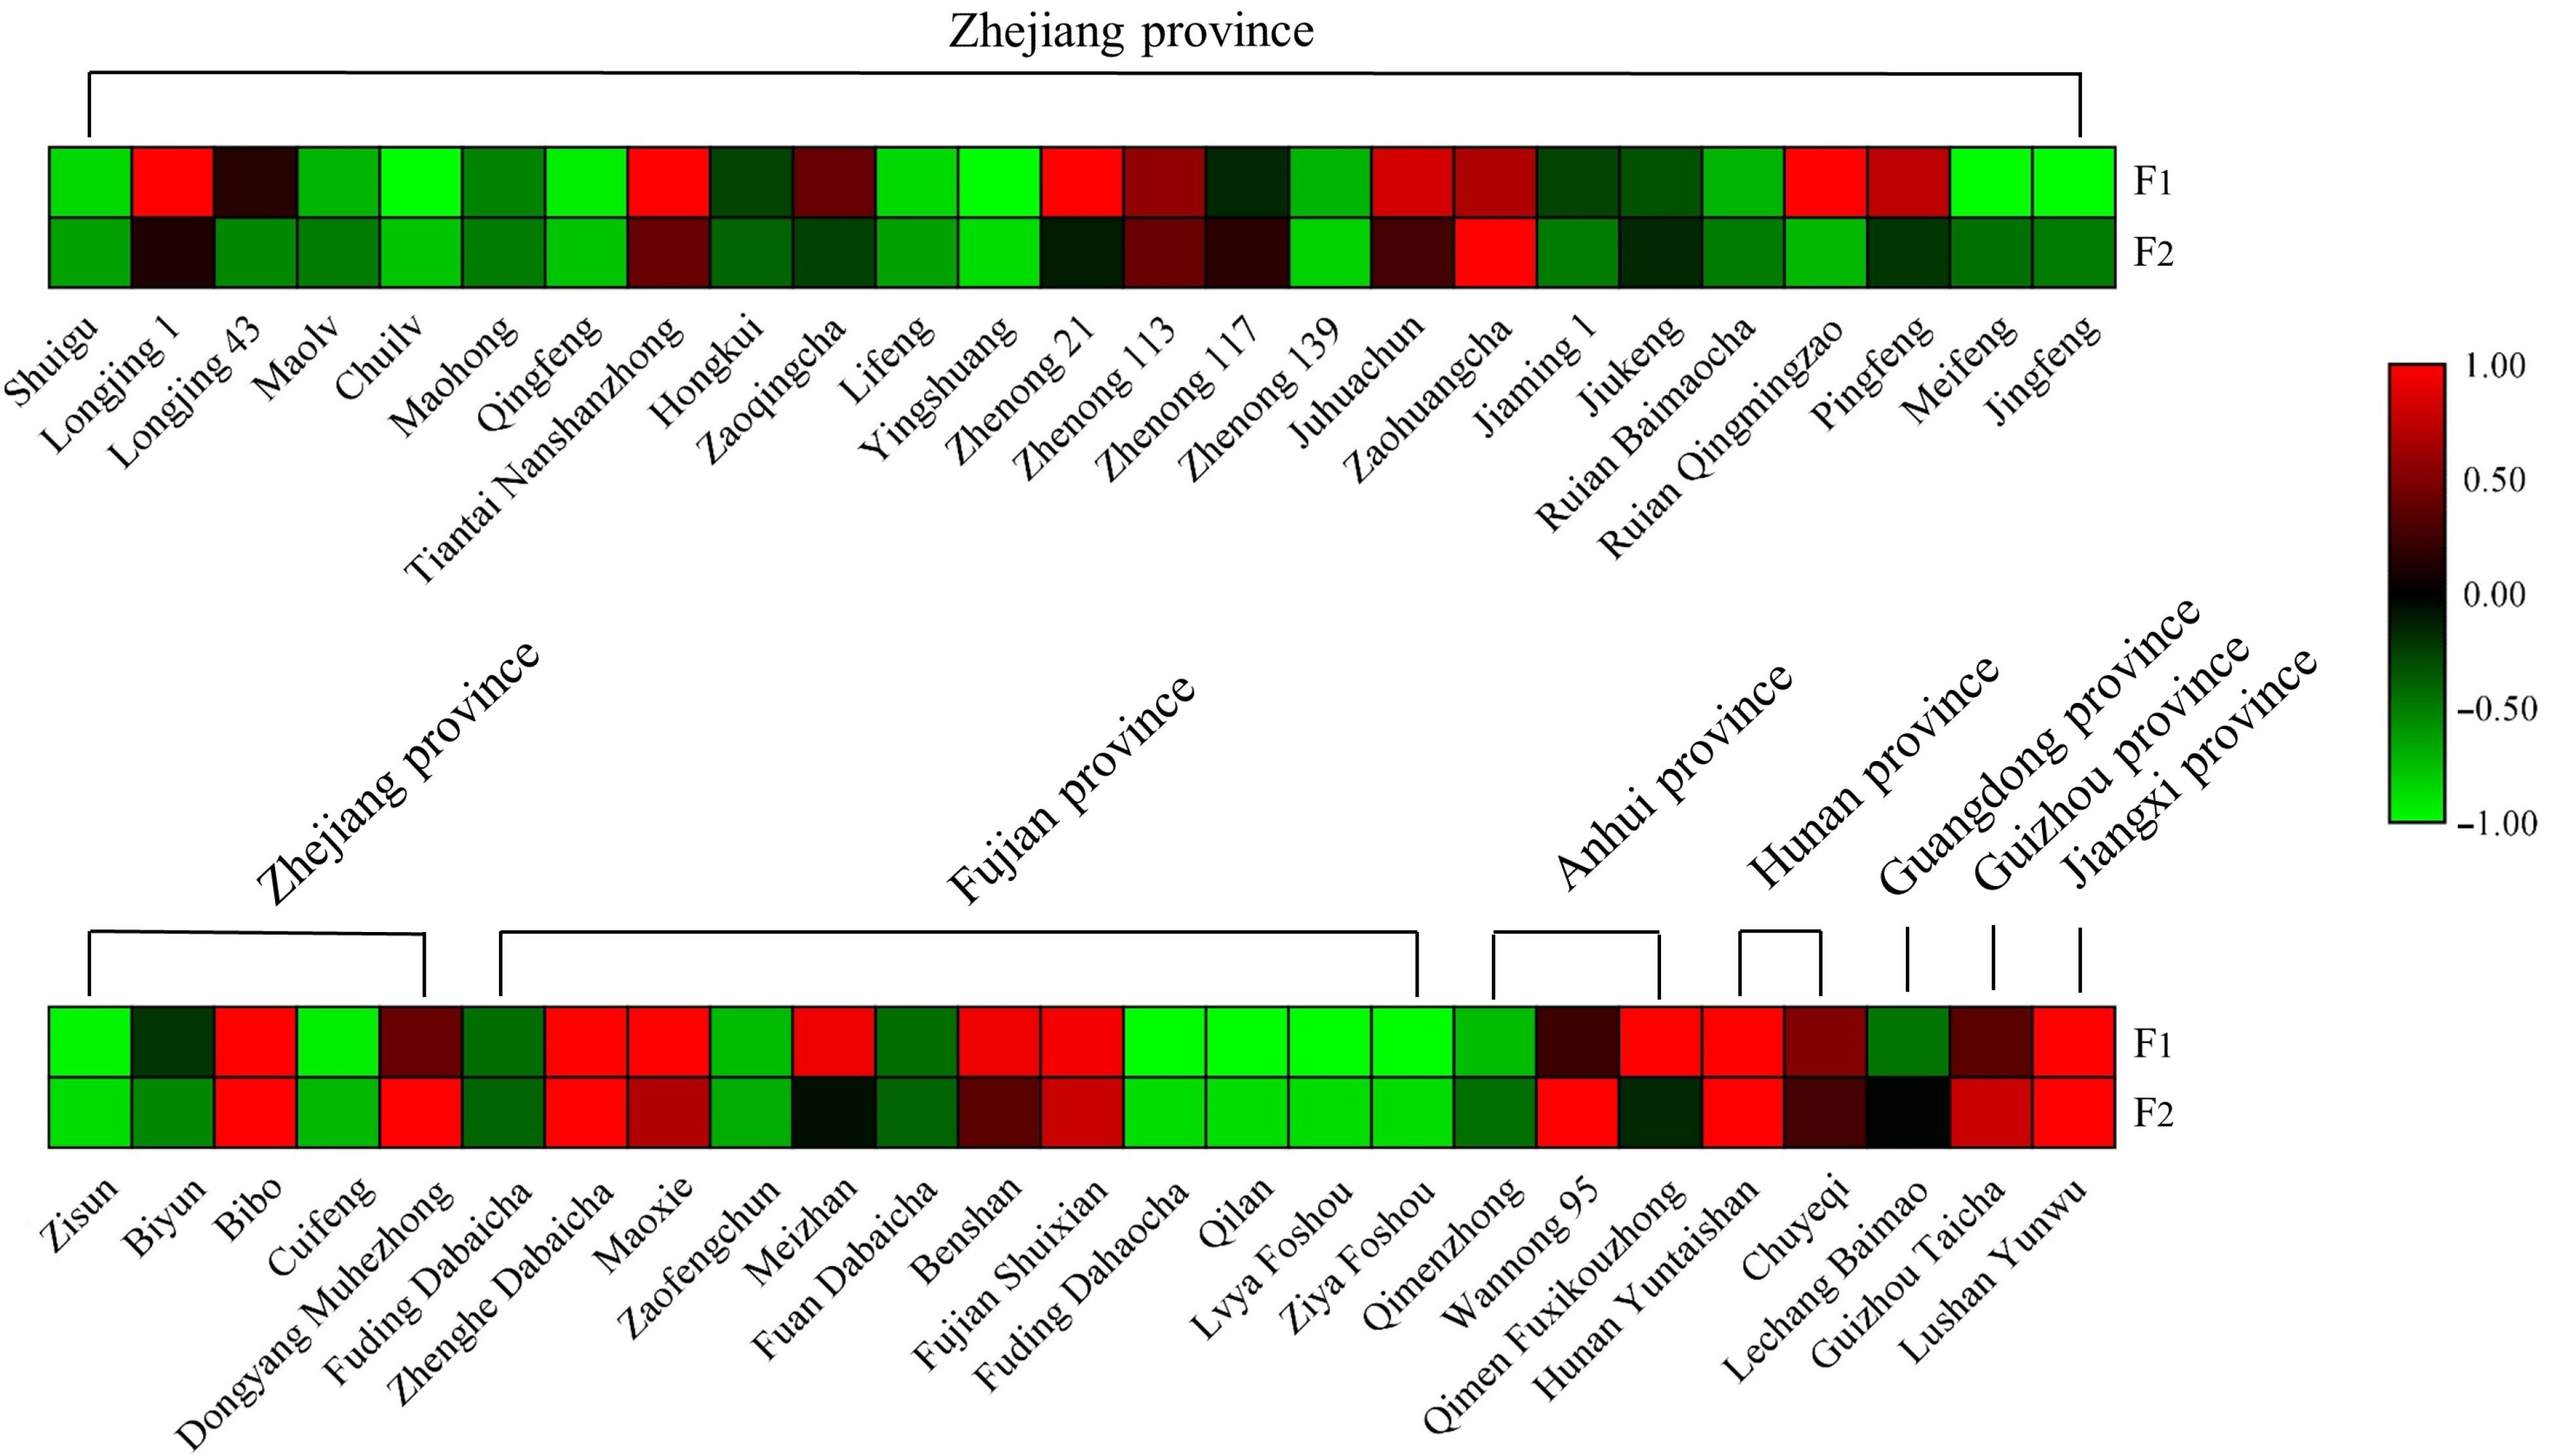
Figure 4.
Heat-map of the content of F1 and F2 in different tea cultivars.
Furthermore, fifty cultivars originated from different provinces and have complex genetic backgrounds, and no other detailed information is available, such as a specialized physiological role of flavonol glycosides in particular cultivars that could explain the observed results. Jungblut et al.[29] found that the acylated flavonol 3-O-glucoside in the epidermal layer of Scots pine (Pinus sylvestris) needles could dramatically increase the absorption of UV-B. Intriguingly, Tohge et al.[30] also found a class of acylated-flavonols in Arabidopsis accessions selected from those grown in natural sunlight and they suggested acylated modification in flavonoids was an adaption strategy to reduce UV stress in plants. The cultivars of 'Ruian Qingmingzao', 'Bibo', 'Maoxie', 'Meizhan', 'Benshan', 'Fujian Shuixian', and 'Hunan Yuntaishan' which have relative high contents of F1 originated from places with high sunlight irradiation (from Chinese meteorological data) and the question of whether the accumulation of AFGs is related to sunlight irradiation requires further investigation.
Antibacterial activities against P. gingivalis and F. nucleatum and biofilm development of F1, F2, and their aglycones
-
The antibacterial activity of F1 and F2 against two principle periodontopathic bacteria, P. gingivalis and F. nucleatum, was investigated by determining the minimum inhibitory concentration (MIC) for each compound. The MIC values of two purified compounds and their aglycones, quercetin and kaempferol, are shown in Supplemental Table S7. For P. gingivalis, quercetin had the lowest MIC value of 0.03 mM, while kaempferol's MIC value was higher than 0.48 mM. F1 and F2 had the same MICs which were lower than that of kaempferol, but higher than that of quercetin. Thus, F1, F2, and quercetin could efficiently inhibit the growth of P. gingivalis. The MICs of F1, F2, quercetin, and kaempferol against F. nucleatum were 0.12 mM, 0.24 mM, 0.12 mM, and 0.48 mM, respectively. Compared to kaempferol, F1, F2, and quercetin again had higher antibacterial activities against F. nucleatum and these two AFGs had an equivalent inhibitory activity to quercetin.
Based on the MIC values of tested compounds, the biofilm inhibitory rates of four tested compounds on P. gingivalis and F. nucleatum were evaluated by crystal violet staining. The results in Fig. 5a showed that all compounds had a dose dependent effect on P. gingivalis and increasing the concentration of test compounds produced a stronger inhibitory rate. Apart from kaempferol, 0.12 mM of F1, F2, and quercetin strongly inhibited the biofilm formation of P. gingivalis by more than 75% and F1 and quercetin at a concentration of 0.24 mM could inhibit biofilm formation of P. gingivalis by over 80%. As depicted in Fig. 5b, all tested compounds could inhibit over 70% biofilm formation of F. nucleatum at a high concentration of 0.24 mM. F2 at 0.12 mM had the highest inhibitory value (60%) of all tested samples. Compared to the inhibitory values of F. nucleatum, the tested samples seemed to have a greater inhibitory effect on P. gingivalis biofilm.

Figure 5.
Effects of F1 and F2 and their aglycones on inhibition of biofilm formation by P. gingivalis (a) and F. nucleatum (b). Control is the treatment without drugs, and the vertical axis is the inhibition rate of biofilm production (%), different letters (a, b, c) for the same compound indicate significant difference (p < 0.05).
Numerous published works have focused on the evaluation of the anticariogenic potential of medicinal plants. The primary factor in periodontal disease is biofilm formation and its dynamic complexity. Theoretically, inhibition of the early steps in this process can result in the prevention of periodontal diseases, as has been the focus in developing vaccines against this pioneer microorganism species. Inhibition of the formation of biofilm is the key step required to reduce the pathogenic effect of bacteria. P. gingivalis is one of the key members for early colonization in biofilm formation. F. nucleatum plays a key role as a 'bridge' between early and late colonizers in the oral biofilm[34]. By bridging the gap between these two separate groups of oral bacteria, the adhesin genes of F. nucleatum act outside the commonly observed narrow range of individual inter-species interactions, and join many bacteria together to form a single community[35].
To prevent oral disease, the effective removal of plaque biofilm in the oral cavity plays a key role in dental caries prevention. Lots of plant flavonoids were reported to adhere to hard and soft oral tissues, microbes' proteins, and prevent biofilm formation on tooth surfaces[36,37].
In previous studies, flavonol aglycones and their glycosides showed good antibacterial capacities on key oral pathogens. Patra et al.[38] evaluated the antibacterial activities of quercetin and quercetin 3-glucoside, the results showed that they both had strong growth inhibition activity against the oral pathogen S. mutans. Muhammad et al.[7] evaluated the antibacterial potential of quercetin, quercetin-3-O-glucoside, quercetin 3-O-glucuronide, kaempferol 3-O-rutinoside, kaempferol 3-O-glucuronide, kaempferol 7-O-neohesperidoside according to planktonic minimum inhibitory concentration (PMIC) and planktonic minimum bactericidal concentration (PMBC). These compounds showed different antibacterial effects on different stains, and quercetin was proved to be an excellent antibacterial agent which could inhibit periodontal pathogen growth and biofilm formation by affecting the metabolic activity and architecture of mature, multispecies, pathogenic biofilm.
Here, two isolated AFGs were found to have the equivalent inhibitory abilities on the growth of P. gingivalis and F. nucleatum, with a similar effectiveness to quercetin. These two compounds also have good inhibitory activities on the biofilm formation of two oral pathogens in a dose-dependent manner. Different from flavonol glycosides, these two AFGs had a special p-coumaryl moiety. Tiliroside, which has a 6"-O-p-coumaroyl moiety, was reported to have higher antioxidant and cytoprotective activities, and enhanced Fe-chelating ability than astragalin which doesn't have p-coumaroyl moiety[39]. The specific mechanism of p-coumaryl moiety on antibacterial activity is worthy of further research.
Ferric carrier activity of F1 and F2
-
To further explore the antibacterial mechanism of two AFGs, chelating iron ability were tested with the siderophore assay described in Method 2.8. The ferric carrier activities of F1 and F2 are shown in Fig. 6 and the reference iron carrier produced by rhodococcus, ferrichrome was used as a positive control. The results showed that compared with the negative control, F1 and F2 had significant chelating iron capacity in the concentration range of 0.0075−0.06 mM (p < 0.05). The iron chelation rate of F1 and F2 increased significantly with the increase of concentrations, within the range tested. With concentrations above 0.06 mM, the iron chelation rates were greater than 50% and F1 and F2 had similar capacities as ferrichrome, indicating that they were good iron carriers.
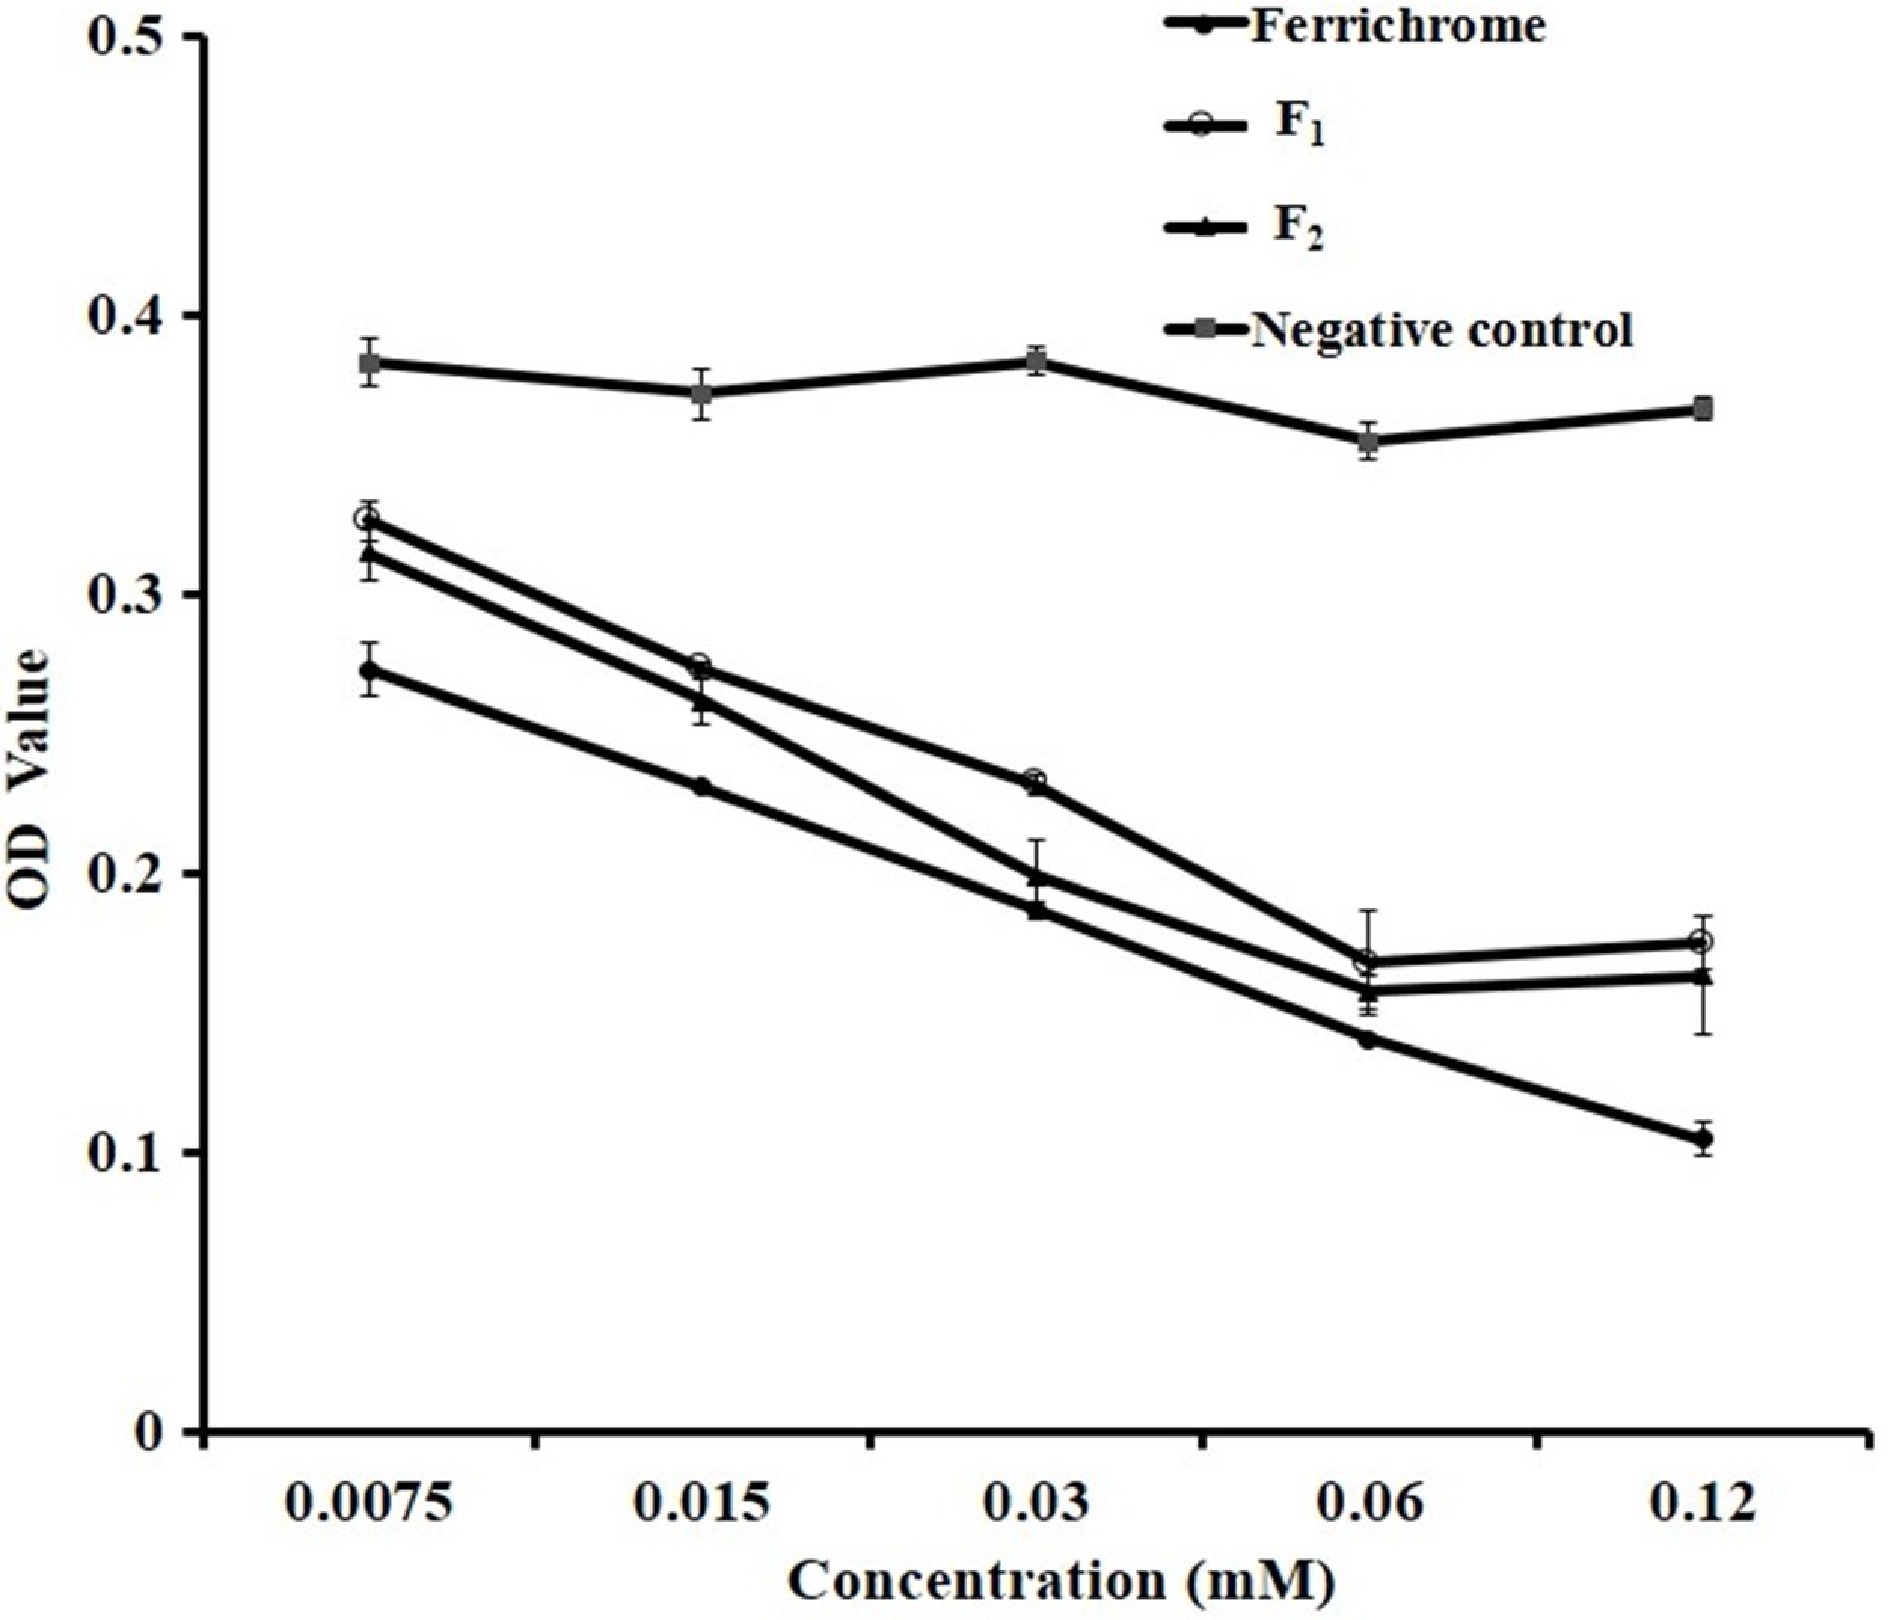
Figure 6.
Iron chelation activity of F1 and F2.
Availability of iron is of critical importance for the growth of microorganisms[40]. Under anaerobic conditions, oral pathogens such as P. gingivalis preferentially obtain ferrous irons and store them at the cell surface for survival. Chelating these irons from oral pathogens could play a very important role in their growth inhibition and biofilm formation. EGCG and theaflavins exhibited pronounced iron-chelating activities which contributed to their antibacterial effects on F. nucleatum[12]. Here, F1 and F2 showed comparative iron-chelating activities as published tea polyphenols. This result provided a clear antibacterial verification of these novel flavonoids against oral pathogens.
-
In the present study, we combined chromatography methods for purifying F1 and F2 from Camellia sinensis over 97% purity. This work is the first to use AB-8 resin and preparative HPLC for isolating AFGs and the first report of the identification of tea cultivars which are rich in F1 and F2. The accumulation of these AFGs was affected by seasonal change and related to sunlight irradiation. Importantly, the effectiveness of F1 and F2 as antibacterial and anti-biofilm agents against two key oral pathogens was demonstrated, establishing their possible application in oral diseases prevention.
This work was supported by the Collaborative Innovation Center of Chinese Oolong Tea Industry [Grant No. 2015-75], the Natural Science Foundation of Zhejiang Province [Grant No. LY16C200004], the Key Research and Development Projects in Zhejiang Province 'Industrialization Model Projects on Exploring Functional Components and Related Products from Tea Flowers and Fruits' [Grant No. 2018C02012]. We are grateful to Wenfeng Chen from Fujian Tea Import & Export Co., Ltd. and Haitao Huang of Hangzhou Academy of Agricultural Sciences and Technology for sample collecting and preparing. We are grateful to Prof. Donald Grierson from the University of Nottingham (UK) for suggestions on the manuscript and careful revision of the language.
-
The authors declare that they have no conflict of interest.
-
# These authors contributed equally: Feifei Zhou, Leiyu Yang, Yingjie Gu
- Supplemental Table S1 Gradient elution protocol for HPLC analysis.
- Supplemental Table S2 Gradient elution protocol for UPLC analysis.
- Supplemental Table S3 Static adsorption properties of different macroporous resins.
- Supplemental Table S4 MS/MS data of F1 and F2 in negative mode.
- Supplemental Table S5 1H and 13C NMR spectroscopic data for F1 and F2 in CD3OD.
- Supplemental Table S6 Contents of F1 and F2 in different tea cultivars (mg/g).
- Supplemental Table S7 Comparison of antibacterial activity of F1, F2 and their aglycones.
- Supplemental Fig. S1 The preparative HPLC chromatogram (UV detection at 360 nm) of crude extract Ⅱ.
- Copyright: © 2023 by the author(s). Published by Maximum Academic Press, Fayetteville, GA. This article is an open access article distributed under Creative Commons Attribution License (CC BY 4.0), visit https://creativecommons.org/licenses/by/4.0/.
-
About this article
Cite this article
Zhou F, Yang L, Gu Y, Ge Z, Huang Y, et al. 2022. Characterization and quantification of two acylated flavonol glycosides from Camellia sinensis and their antibacterial effect on oral pathogens. Beverage Plant Research 2: 1 doi: 10.48130/BPR-2022-0001 

Characterization and quantification of two acylated flavonol glycosides from Camellia sinensis and their antibacterial effect on oral pathogens
- Received: 16 September 2021
- Accepted: 15 December 2021
- Published online: 04 January 2022
Abstract: Acylated flavonol glycosides (AFGs) are a new group of flavonoids with multiple pharmacological functions. In the present work, two AFGs were isolated with a combined chromatography technology from Camellia sinensis and identified as quercetin tetraglycosides with one p-coumaryl moiety (F1) and kaempferol tetraglycosides with one p-coumaryl moiety (F2) by ultra-performance liquid chromatography tandem mass spectrometry (UPLC-MS/MS) and nuclear magnetic resonance (NMR). F1 and F2 with high purity and quantity can be obtained through relatively simple steps, which is of great significance in industrial production and application. The quantification of two AFGs in different tea cultivars and different season samples was conducted using the high-performance liquid chromatography (HPLC) method. Among fifty tested tea cultivars, the contents of F1 and F2 were extremely high in 'Zhenghe Dabaicha' and 'Wannong 95', but these were undetectable in some tea cultivars. Relatively high contents of AFGs were found in autumn harvested tea samples which might be related to sunlight irradiation. Further in vitro experiments showed that F1 and F2 monomers were effective on inhibiting growth and biofilm development of Porphyromonas gingivalis and Fusobacterium nucleatum. This antibacterial activity was proven to involve the chelation of iron. These results provide useful information on AFGs-rich tea resources and new insights of AFGs into effective agents against oral diseases.