


-
Apples (Malus x domestica Borhk) are an ancient crop species, with evidence of domestication dating to at least 3,000 years ago[1]. Today, apples are the world's third most valuable fruit crop worth USD
${\$} $ Molecular breeding tools offer valuable strategies for breeders to reduce breeding costs and more efficiently improve crops. For complex traits controlled by numerous small effect loci, the use of genome-wide genetic markers is now widely used in a genomic selection (GS) framework[3]. For traits controlled by a small number of large effect loci, however, marker assisted selection (MAS) using a small number of markers, can significantly decrease costs during apple variety improvement[4,5]. Ideally, genetic markers used for MAS are causal alleles that control traits targeted for improvement. However, many genetic markers used for apple breeding are only linked to desirable traits based on genetic mapping studies but have not been shown to be causal[6,7]. Thus, there remains uncertainty about the degree to which markers used for MAS in diverse apple germplasm accurately predict phenotypes and are effective in reducing breeding costs.
In recent years, molecular techniques such as gene editing have become valuable tools for crop improvement, allowing researchers to make targeted changes to DNA sequences in elite germplasm in numerous crops[8−10]. While a number of barriers must be overcome before genome editing can be effectively applied for apple cultivar improvement, the approach holds tremendous promise for apple cultivar improvement, possibly through gene knock-outs[11] or targeted allele swaps mediated via the application of base editors[12]. In most cases, gene editing will require the identification of causal genetic variants for commercially important traits, however few have been previously identified. To date, genetic mapping studies in apple have generally lacked the sample size, diversity and marker density required to identify causal genetic variants at nucleotide resolution. The discovery of causal genetic variants underpinning important agricultural traits thus continues to be a challenge in apple, and ultimately limits the ability of breeders to make improvements in key agricultural traits via genome editing technologies.
To advance apple improvement via gene editing, it is critical to identify causal alleles controlling important agricultural traits. Ripening time, phenolic content, and softening are three important fruit traits in apple as they impact labor management, fruit nutrition, and fruit storage, respectively. Numerous genetic mapping studies have investigated these traits in the past[6,7,13−15] and they are likely to remain target traits for apple improvement in the future. Therefore, an understanding of the genetic architecture and causal genetic variants underlying these traits is important for future apple variety improvement.
Numerous attempts have been made to map the causal alleles underpinning ripening time, phenolic content, and softening in apple. Multiple genome wide association studies (GWAS)[16−19] and functional genomics evidence[7] suggest that NAC18.1 (MD03G1222600), a transcription factor on chromosome 3, is a key gene involved in ripening time variation in apple. However, the causal allele(s) in or around NAC18.1 responsible for ripening time variation remain unknown. Similarly, the causal allele(s) for phenolic content in apple remain elusive, despite a number of investigations proposing leucoanthocyanidin reductase (LAR1), on chromosome 16[13,15,20] as a candidate gene for phenolic content production. While QTLs associated with fruit softening have been identified on multiple chromosomes, and the genes PG1 and ERF have been either functionally validated or proposed as putatively causal in determining the storability of apple fruits[21−23], causal alleles for softening also remain unknown. Despite numerous attempts through both linkage mapping and GWAS, the precise locations of causal genetic variants underlying these three traits remain unknown.
The discovery of causal alleles for key traits in apple has remained challenging in large part due to the costs of gathering high quality phenotype and genotype data across sufficiently diverse populations. With the rapid expansion of high-throughput DNA sequencing in recent years, whole genome sequencing of pooled DNA samples has become a powerful cost-effective approach to identify allele frequency differences between populations that differ in phenotype. By pooling DNA samples from extremes of a phenotype distribution, genomic regions with extreme allele frequency differences between pools are identified as loci that potentially harbor causal genetic variants for the phenotype of interest. This method has been successfully used to identify causal loci in non-model organisms such as geese, watermelon, and cannabis[24−26]. In apple, pool-seq approaches have been used to investigate the genetic basis of acidity, weeping, and internal browning traits[27−29]. Here, we use a pooled-sequencing approach[30] to evaluate allele frequency differences between sub-populations of apples from a diverse population that vary markedly for ripening time, polyphenol production, and softening. Allele frequency differences and a modified chi-squared test[31] were used here to scan the genome for regions with the largest allele frequency differences between groups, and genes in these regions were curated and discussed.
-
DNA was extracted from leaf tissue collected from Canada's Apple Biodiversity Collection (ABC) in Kentville, Nova Scotia, Canada, as described in Migicovsky et al.[7]. For each phenotype examined here (ripening time, phenolic content, and softening), 50 M. domestica accessions from the ABC with the most extreme phenotypic values were selected from each tail of the phenotype distribution (Fig. 1), forming two groups of 50 accessions (except in cases where DNA extraction failed) for each phenotype. DNA from accessions within each of the selected groups was combined into a pool, with DNA from each sample represented in equimolar concentration. DNA extraction and pooling was performed by Platform Genetics Inc. A total of six equimolar DNA pools were formed: late harvested (N = 50), early harvested (N = 49), high phenolic content (N = 50), low phenolic content (N = 49), low softening (N = 50), high softening (N = 50). For phenotypic selection, apple phenotype measurements from 2017 measured by Watts et al.[32] were used. Ripening time was measured as the Julian day of the year in which the fruit were deemed ripe and ready for harvest. Phenolic content was measured as micromolar of gallic acid equivalents per gram of fresh weight (μmolGAE/g) via a Folin–Ciocalteu assay. Softening was measured as the percent change in firmness between harvest and 3 months post-storage, as measured by a penetrometer. Details of the germplasm used, the experimental design of the orchard, and the phenotyping protocols are provided in Watts et al.[32].
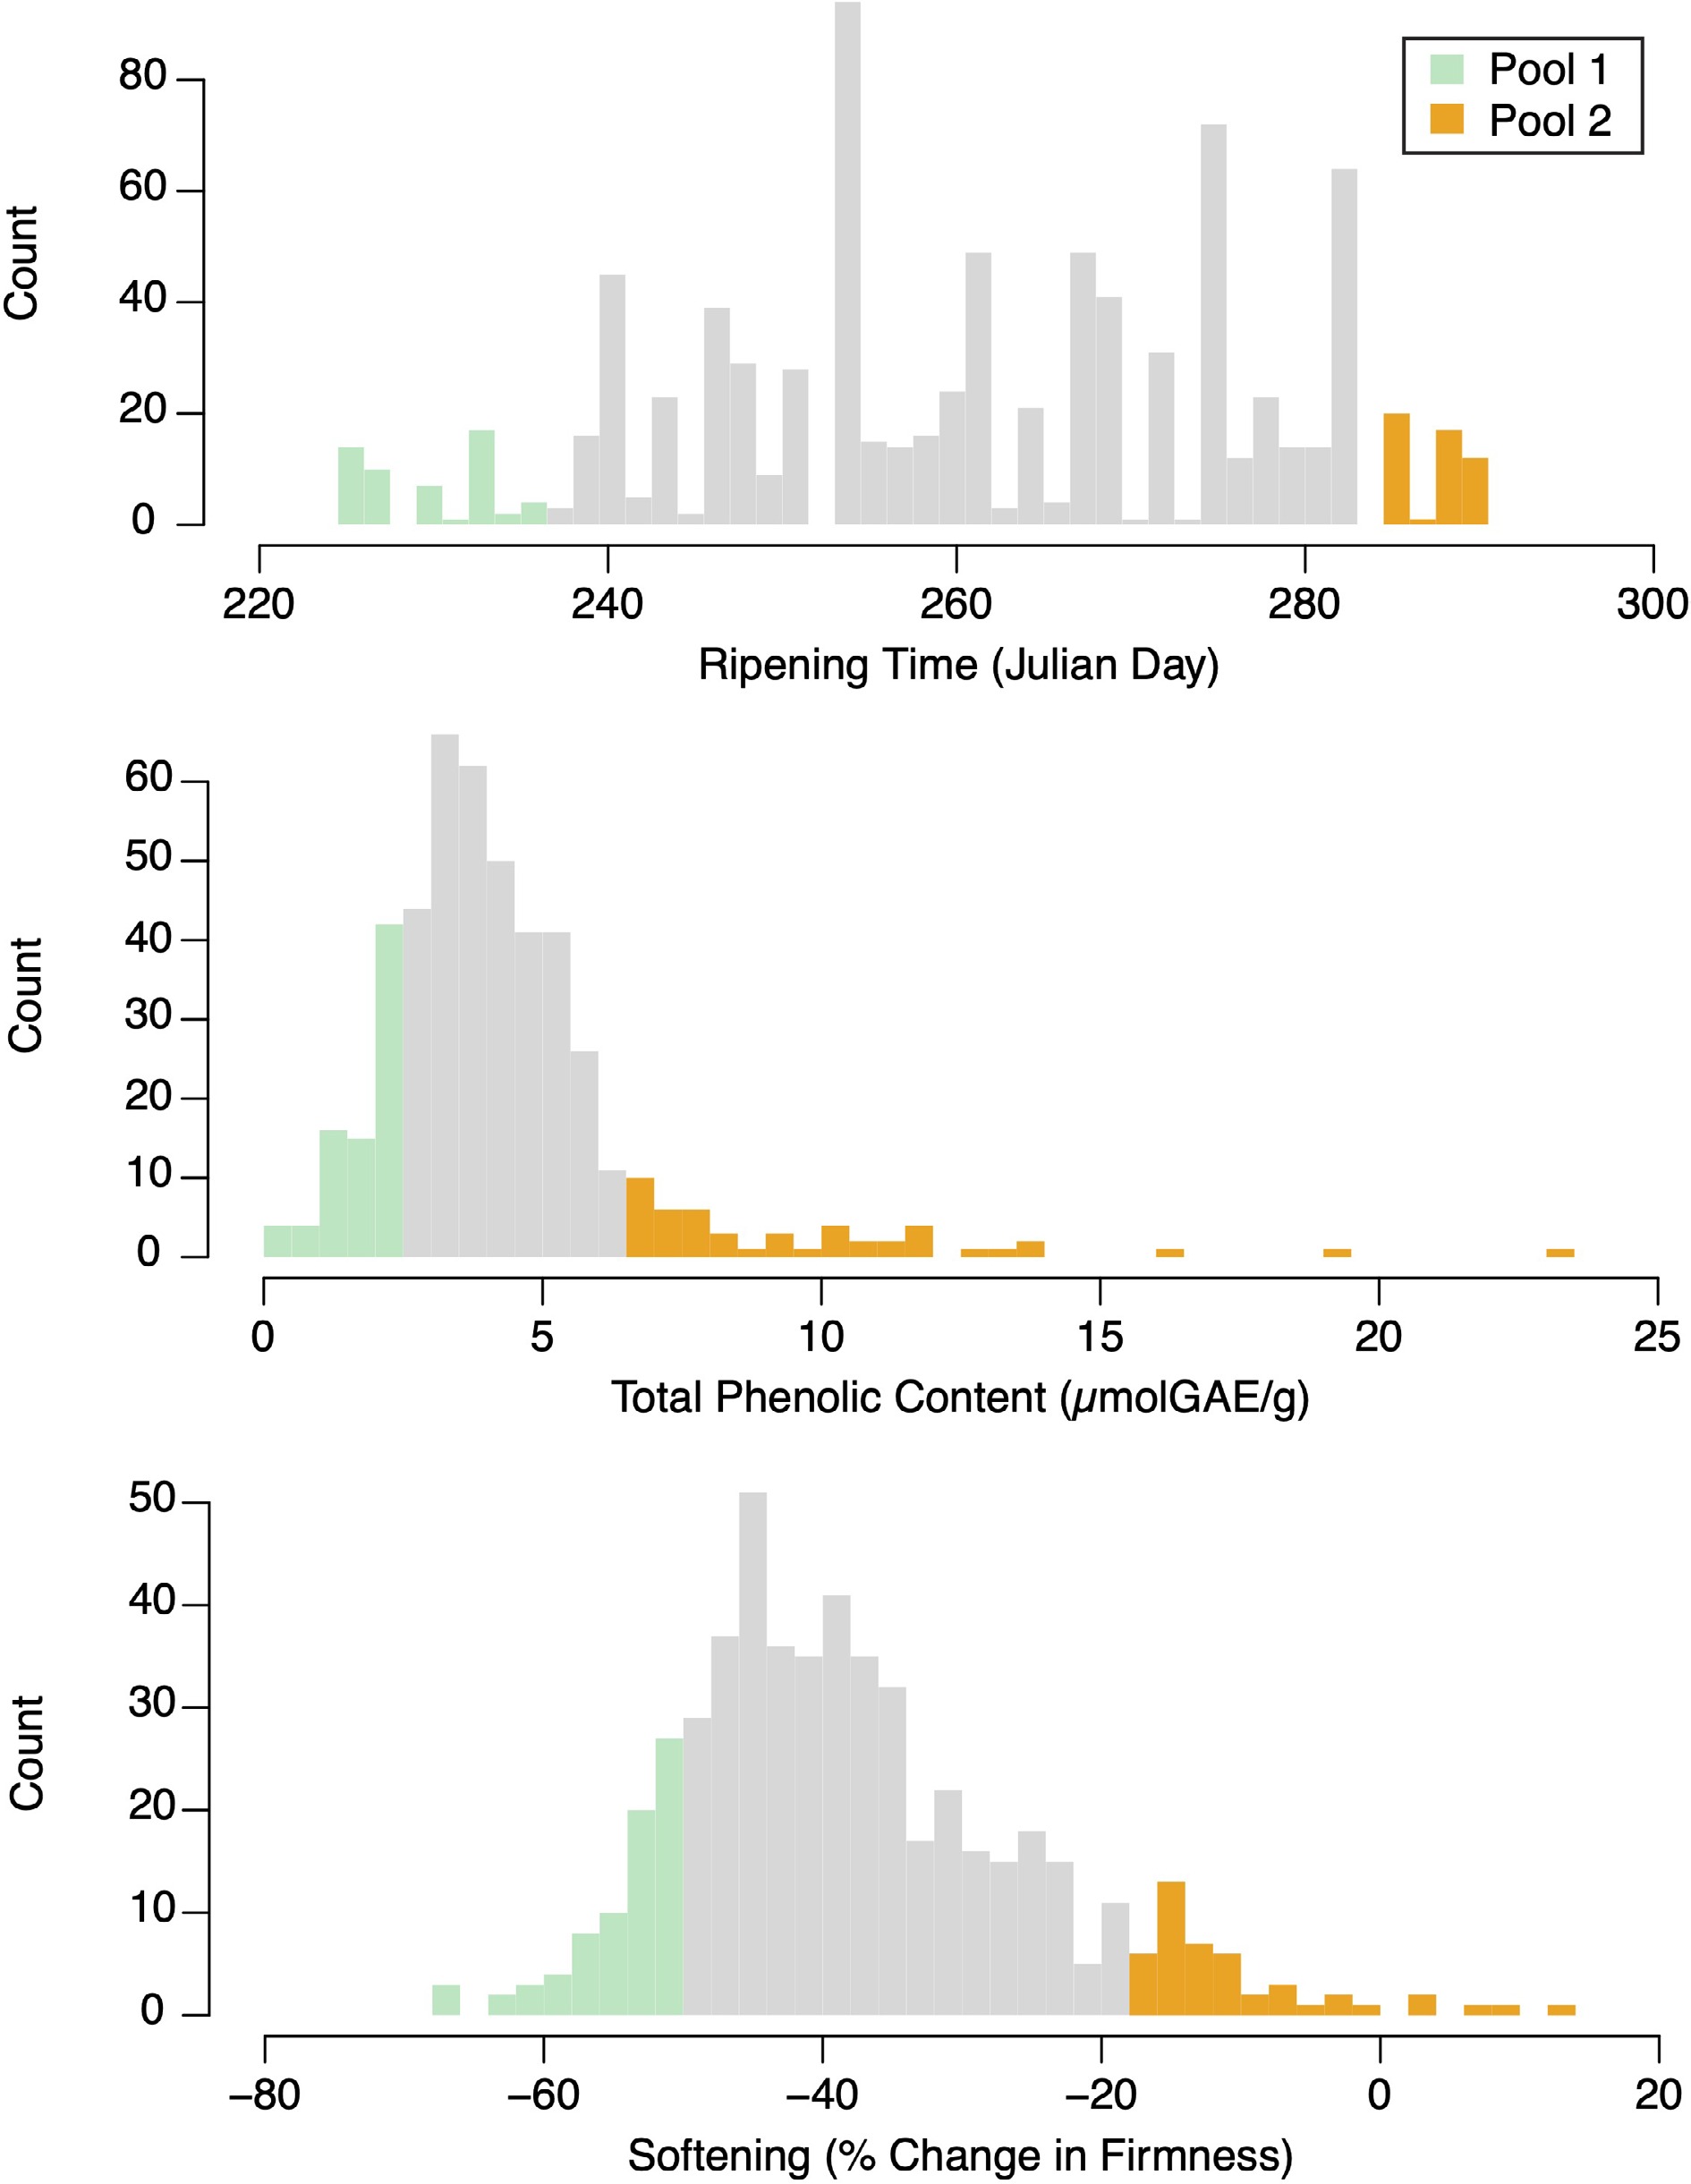
Figure 1.
Phenotype distributions for ripening time, phenolic content, and softening. Green and orange bars represent accessions selected for pooled sequencing.
Pooled libraries were prepared and whole genome sequencing was performed by the McGill Genome Centre. DNA libraries were prepared using a Lucigen PCR-free NxSeq kit. Each pool was sequenced on a single lane of Illumina NovaSeq6000 S4 v1.5 PE150 in high output mode.
Sequence data pre-processing, mapping and variant calling
-
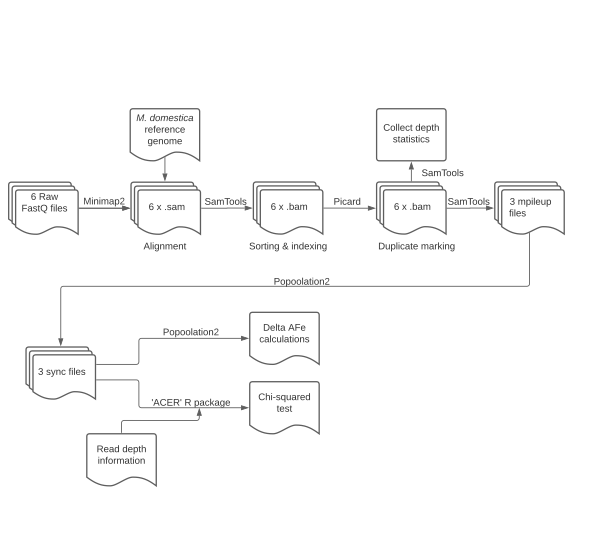
FastQ files from each pool were aligned to the Golden Delicious double haploid reference genome[33] using the MiniMap2 alignment tool[34]. Binary Alignment Map (BAM) files were produced following the GATK Best Practices guidelines (
https://gatk.broadinstitute.org ). Mapped BAM files were coordinate sorted and indexed with Samtools sort and index functions[35]. Sequencing duplicates were marked with Picard MarkDuplicates (http://broadinstitute.github.io/picard/ ). Samtools was used to produce three mpileup files, one for each of the three phenotypes. The Popoolation2 pipeline[30] was used to produce three sync files from each mpileup file (Supplemental Fig. S1). To reduce the number of false positive variants, only variants supported by a read depth of 50-500x in each pool with a combined alternate allele count of at least 10 were considered for downstream analyses[25,36].Allele frequency estimation, candidate region identification, and gene model curation
-
Allele frequency estimates (AFe) for each pool were generated for each site in the genome using the snp-frequency-diff.pl script within Popoolation2[30]. Delta-AFe values were calculated as the absolute difference of AFe at each variant between pools. AFe and delta-AFe values were calculated and analyzed with the poolSeq package in R[37]. Allele counts at each position were used to conduct a modified chi-squared test (CST) in R using the adapted.chi.squared function within the ACER package[31]. Delta-AFe values and CST p-values for each variant site were visualized using the qqman package in R[38]. Candidate regions for each phenotype were defined as regions of the genome within 20 kb of the top and bottom 0.001% of delta-AFe and CST p-values, respectively. Gene annotations were produced by Daccord et al.[33].
Gene Ontology (GO) enrichment analysis
-
To identify candidate genes involved in each phenotype, protein coding genes within 20 kb of variants within both the 0.001% lowest CST p-values and 0.001% highest delta-AFe values for each phenotype were curated and reduced to a unique set (MD IDs) (Supplemental Tables S2, S3, S4). This resulted in 21, 385, and 321 candidate genes for ripening time, phenolics, and softening, respectfully. Genome wide annotations as well as annotations for genes associated with top hits from each phenotype were imported using the topGO package in R[39]. Gene enrichment in biological process ontology was tested using the topGO package with algorithm parameters 'weight01', to account for GO hierarchy, and 'fishers' as the test statistic.
-
Ripening time, phenolic content, and softening trait values were each roughly normally distributed in the ABC population, with the phenolic content distribution showing an extended tail containing apples with high phenolic content (Fig. 1). Ripening time in the population ranged from 225−290 Julian days, with a mean ripening time of 261 Julian days. The early and late pools ranged from 225−236 (mean 229) and 282−290 (mean 289) Julian days, respectively. The mean value for total phenolic content in the ABC population was 4.34 μmolGAE/g. The low and high phenolic content pools had phenolic content values that ranged from 0.3−2.2 (mean 1.4) and 6.1−27.9 (mean 10.0) μmolGAE/g, respectively. On average, apples lost about a third of their firmness during storage: change in firmness within the population ranged from −67.7% to 13.4%, with a mean change in firmness of −37.8%. The high and low softening pools had percent change in firmness values that ranged from −67.7 to −51.1% (mean −56.2%) and −19.7 to 13.4% (mean −10.9%), respectively.
Genome sequencing and variant calling
-
DNA sequencing produced a combined 2.8 billion reads comprising more than 864 billion base pairs of DNA sequence. Mapping rates for the libraries varied from 95.96% to 96.54%. Read depth for pools ranged from 128.4−184.6x (Supplemental Table S1). Average read depth across all six pools was 150.4x (Supplemental Fig. S2). After filtering for positions with read depths within the acceptable read depth range (50-500x), we obtained 81%, 82% and 81% coverage of the apple reference genome for ripening time, phenolic content, and softening, respectively. The mean number of variants called for each phenotype was 25,506,587 (Supplemental Table S1).
Candidate region identification
-
The highest observed delta-AFe value for ripening time was 0.923 found on chromosome 4. Chromosomes 3, 4, 7, and 16 harbored variants with delta-AFe values greater than 0.8 (Fig. 2a). Two notable peaks, on chromosomes 3 and 4, were identified by delta-AFe and CST analysis (Fig. 2a, b). The signal on chromosome 3 consists of a 76.7 kb region, from 30,656,169 to 30,732,938 bp (Fig. 2c). Within this window, 259 variants had delta-AFe values > 0.8. The variant with the highest local delta-AFe (0.907) was an A/G SNP at bp 30,702,958, approximately 4.7 kb upstream of a NAC transcription factor previously associated with ripening time[7,18,19]. The same variant scored the lowest local CST p-value (1.81 × 10−126). The second peak on chromosome 4 spanned approximately 10 kb (Fig. 2d). This signal contains a C/A SNP located at 1,482,075 bp, with the single highest delta-AFe (0.923) and lowest CST p-value (9.39 × 10−127) for ripening time. This variant window contained 12 variants with delta-AFe values > 0.8. None of the variants from the peak on chromosome 4 were within annotated gene-coding regions, however the peak is within 15 kb of the coding region of a histidine kinase gene (MD04G1013100) and a methionine tRNA ligase gene (MD04G1013000). Twenty-one unique genes, nine of which had associated GO terms, were within candidate regions for ripening time. We report significantly enriched GO terms (Supplemental Table S2) for genes in these regions, which included metabolic processes and phosphatidylinositol phosphate biosynthetic processes.

Figure 2.
Manhattan plots for genome wide delta-AFe and chi-squared test p-values for ripening time. (a) Delta-AFe values and (b) chi-squared test p-values from variants detected across the genome. (c), (d) Zoom-in plots for signals on chromosome 3 and chromosome 4. Yellow bars indicate gene coding regions. Red bar outlines the NAC18.1 coding region. The red dot is the D5Y SNP, a putatively causal non-synonymous mutation previously identified in the NAC18.1 gene6. 'R' on the X-axis of the genome-wide plots indicates the 'random' chromosome containing contigs that remain unanchored to the reference genome.
For phenolic content, four candidate regions were identified: chromosomes 4, 7, 8 and 16 harbored variants with delta-AFe values greater than 0.7 (Fig. 3a). The variant with the single highest delta-AFe between pools (0.784) was a C/T SNP at 3,857,519 bp on chromosome 4 (Fig. 3c), within the 3’-UTR region of a Tetratricopeptide repeat (TPR)-like superfamily protein gene (MD04G1034700). The signal on chromosome 4 is also within 11.5 kb of two Transcriptional factor B3 family protein (MD04G1034500, MD04G1034600) genes and a glutathione peroxidase 2 (MD04G1034400) gene. A signal on chromosome 8 was identified (Fig. 3d) and contained a T/C SNP at 28,726,105 bp with the smallest p-value (9.8 × 10⁻³⁰) for phenolic content and a delta-AFe of 0.766. There were seven variants with delta-AFe values above 0.7 in this region on chromosome 8. Of these variants, none were within coding regions of genes, and the nearest gene was Ubiquinol-cytochrome C reductase hinge protein gene (MD08G1223400) approximately 8.9 kb downstream. Another signal on chromosome 8 was identified containing five variants with delta-AFe values above 0.7, the highest of which is 0.77 at 11,325,518 bp. This group of variants does not fall within any annotated gene coding regions, but is within 5 kb of suspected coding regions of two genes of unknown function (MD08G1122700 and MD08G1122800). Two candidate regions were detected on chromosome 16 (Fig. 3a, b): a single variant with the highest delta-AFe (0.77) on chromosome 16, and a group of variants forming a 49 kb window (3,839,333-3,889,319 bp) approximately 1.1 MB downstream of the aforementioned variant. The single variant was a T/C SNP at 2,727,461 bp, 46 bp upstream of an unannotated gene (MD16G1038200). Within the large window of variants on chromosome 16 (Fig. 3e), a C/A SNP at 3,864,330 bp had the smallest p-value (4.9 × 10⁻²⁹) and had the highest local delta-AFe (0.75). This variant was the only variant in the region with a delta-AFe greater than 0.7, while seven other variants had delta-AFe > 0.6. While the SNP with the strongest signal in this region was not within the coding region of any gene, it was 668 bp upstream of a UDP-Glycosyltransferase superfamily protein (UGT) gene (MD16G1054500). Additionally, multiple variants within the candidate region on chromosome 16 were within coding sequences of Tetratricopeptide repeat (TPR)-like superfamily protein (MD16G1054700) and a UGT protein (MD16G1054400). Additionally, another four UGT genes (MD16G1054300, MD16G1054400, MD16G1054500, MD16G1054600) are within 7.1 kb of the variant with the highest delta-AFe at this locus. 358 unique genes, 188 of which had associated GO terms, were within candidate regions for phenolic content. We report the top 10 GO enrichment terms (Supplemental Table S3), which included menaquinone biosynthetic processes, heme A biosynthetic processes, and polyamine metabolic processes.
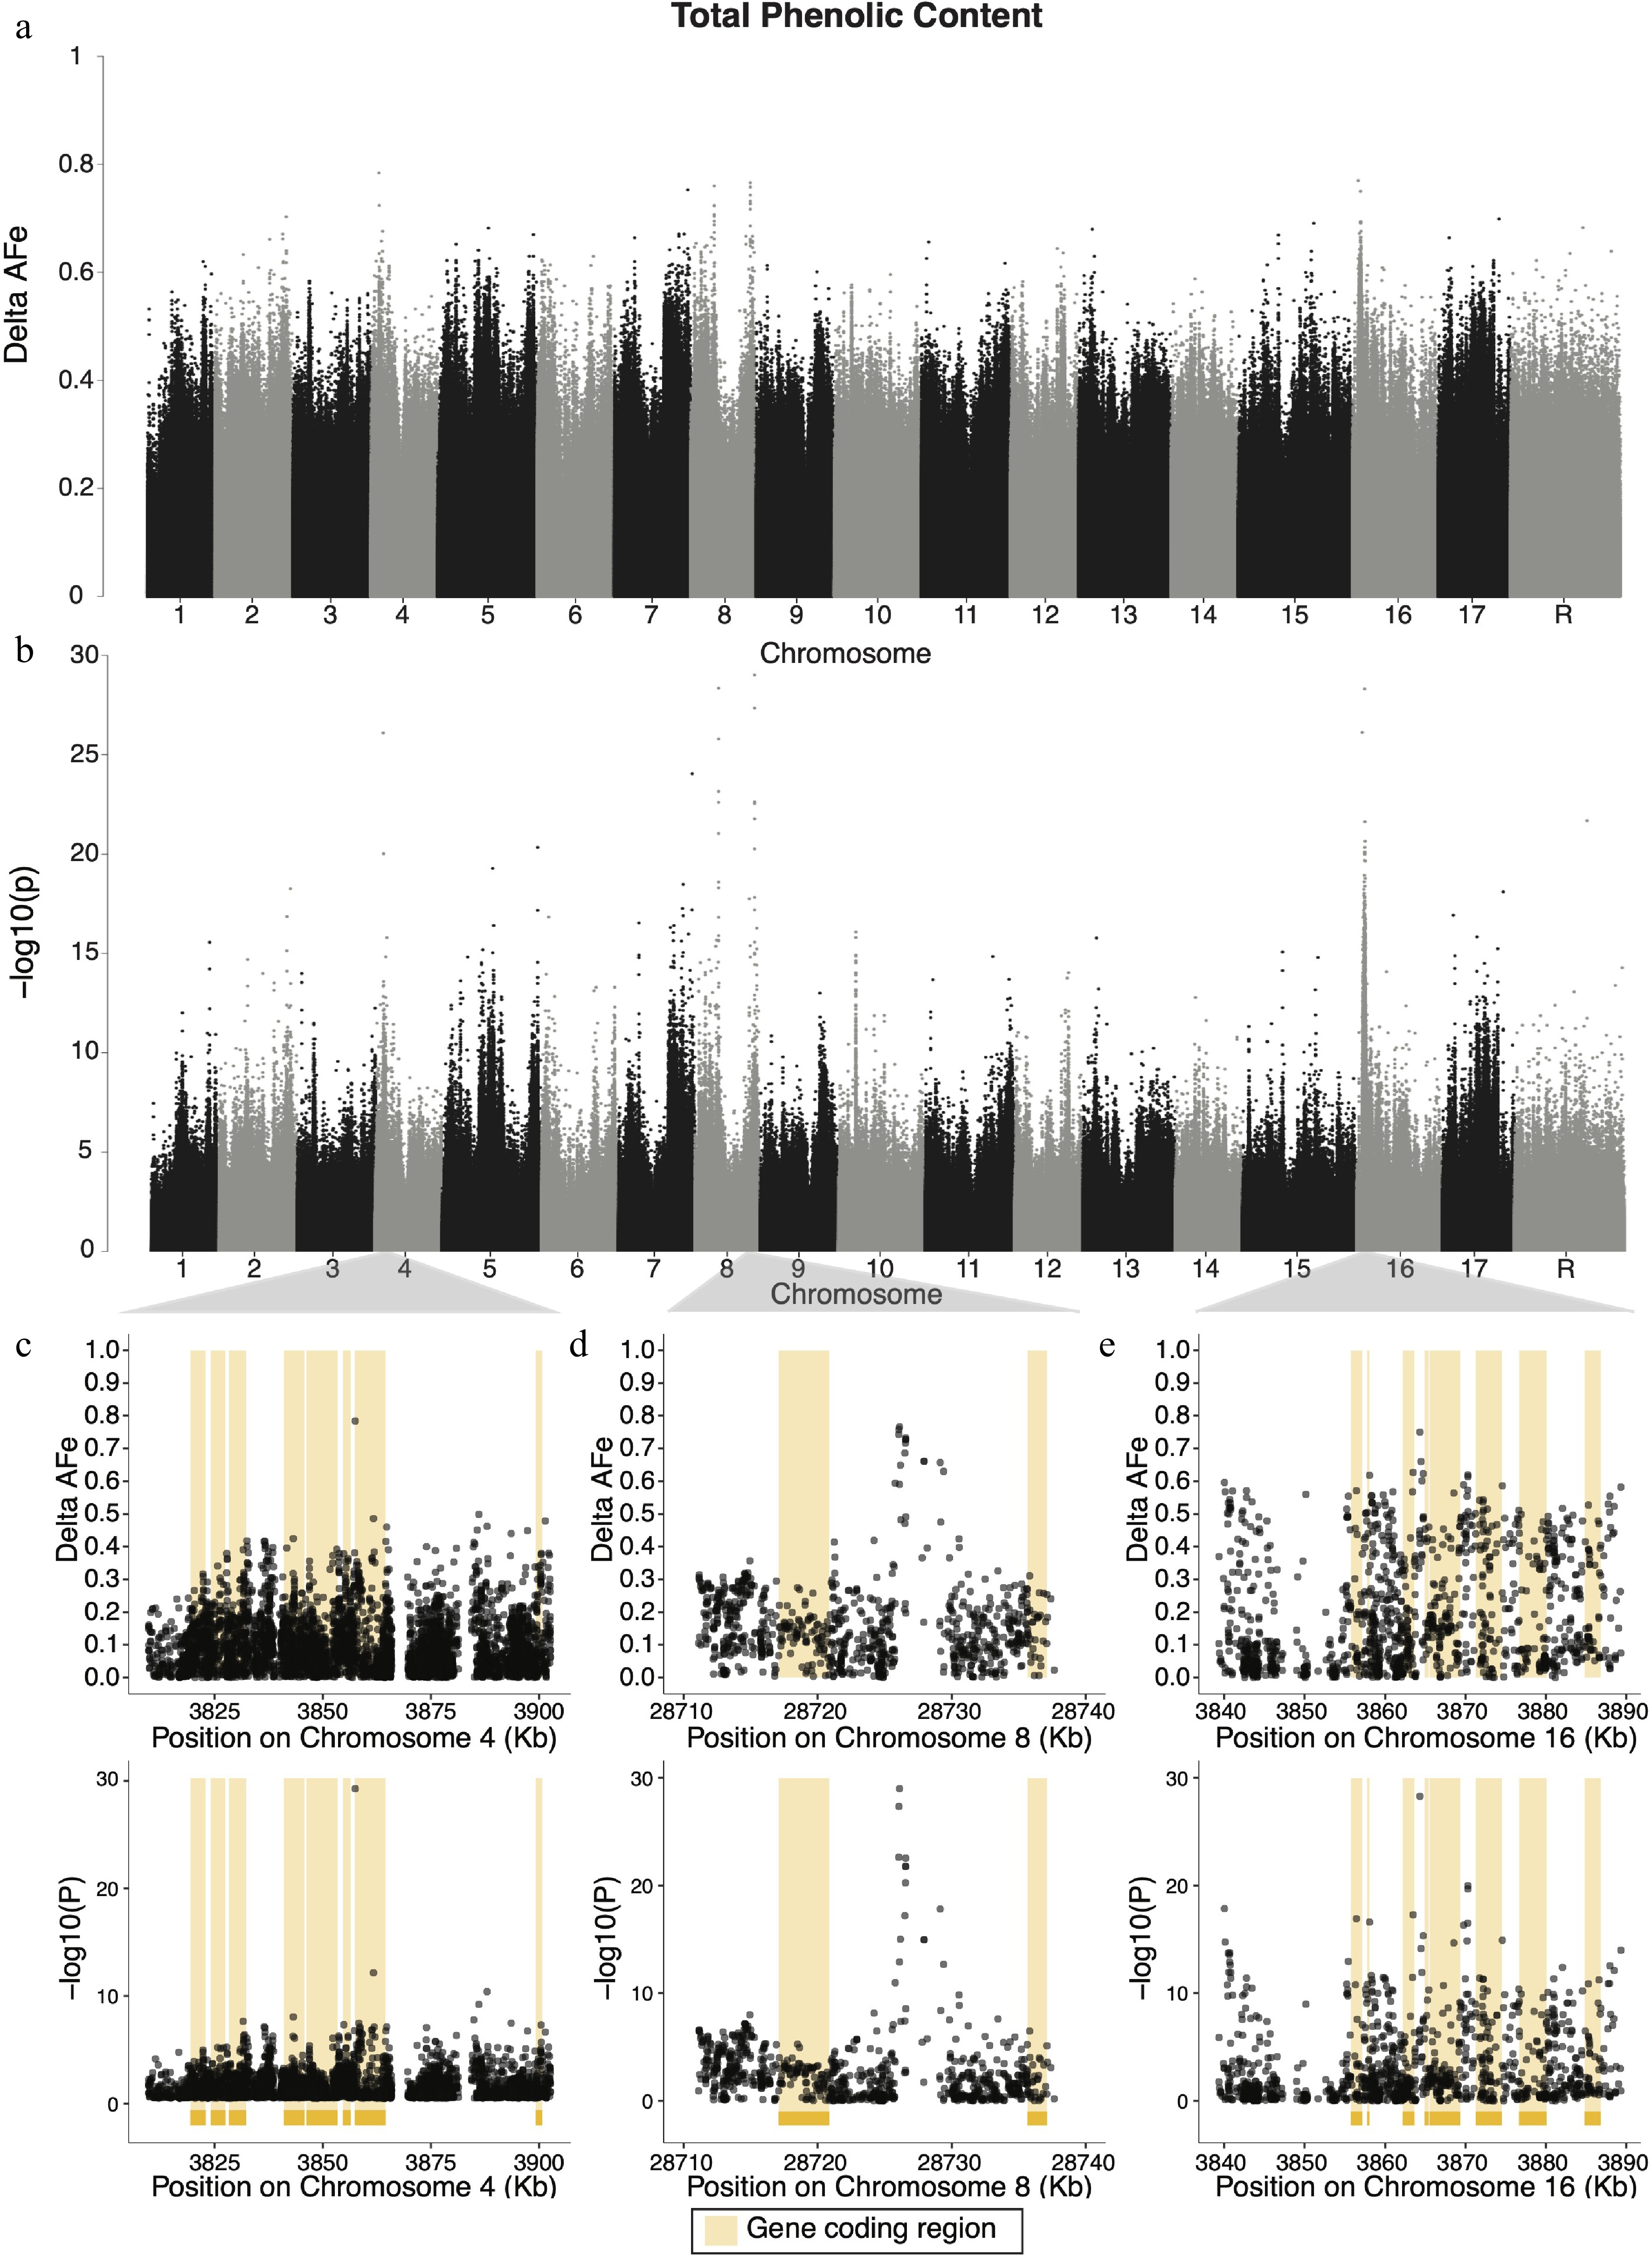
Figure 3.
Manhattan plots of delta-AFe and chi-squared test p-values for phenolic content. (a) Delta-AFe values and (b) chi-squared test p-values from variants detected across the genome. (c), (d) Zoom-in plots for signals on chromosome 4, chromosome 8, and 16. Yellow bars indicate protein coding regions.
Candidate regions for apple softening during storage were identified on chromosomes 6, 10, 12, and 17 (Fig. 4a, b). The strongest signal for softening was on chromosome 17 (Fig. 4d), and the variant with both the lowest p-value (1.95 × 10−43) and highest delta-AFe (0.807) for softening was a G/A SNP at position 9,760,456 bp on chromosome 17. This signal spanned an approximately 1.6 kb region, from 9,758,808−9,760,456 bp. Eight other variants in this region had delta-AFe values > 0.7. This signal overlaps with a gap (approximately 5.5 kb) of variants (Fig. 4d) as reads from the high softening pool, on average, failed to satisfy the minimum read depth cut off (average depth 38x) in this region, while reads from the low softening pool aligned to this region with sufficient depth (average depth 52×). The coding regions of a Sterile alpha motif (SAM) domain-containing protein (MD17G1113700), vacuolar protein sorting 11 (MD17G1113900), as well as two other unannotated genes (Supplemental Table S4) were within 10 kb of the signal on chromosome 17. The variant on chromosome 6 most strongly associated with softening was a C/T SNP at 30,803,965 bp, had a delta-AFe of 0.734 and a p-value of 7.8 × 10⁻²⁵. The signal in this region spans roughly 12.9 kb (30,803,965−30,816,936 bp) (Fig. 4c). The nearest gene to this signal is approximately 18 kb downstream and encodes a 5S RNA (MD06G1167800). 321 unique genes, 158 of which had associated GO terms, were candidate regions for softening. We report the top 10 GO terms for enrichment for these genes (Supplemental Table S4), which included mitochondrial fission, regulation of DNA-templated transcription, leaf senescence, and cold acclimation.
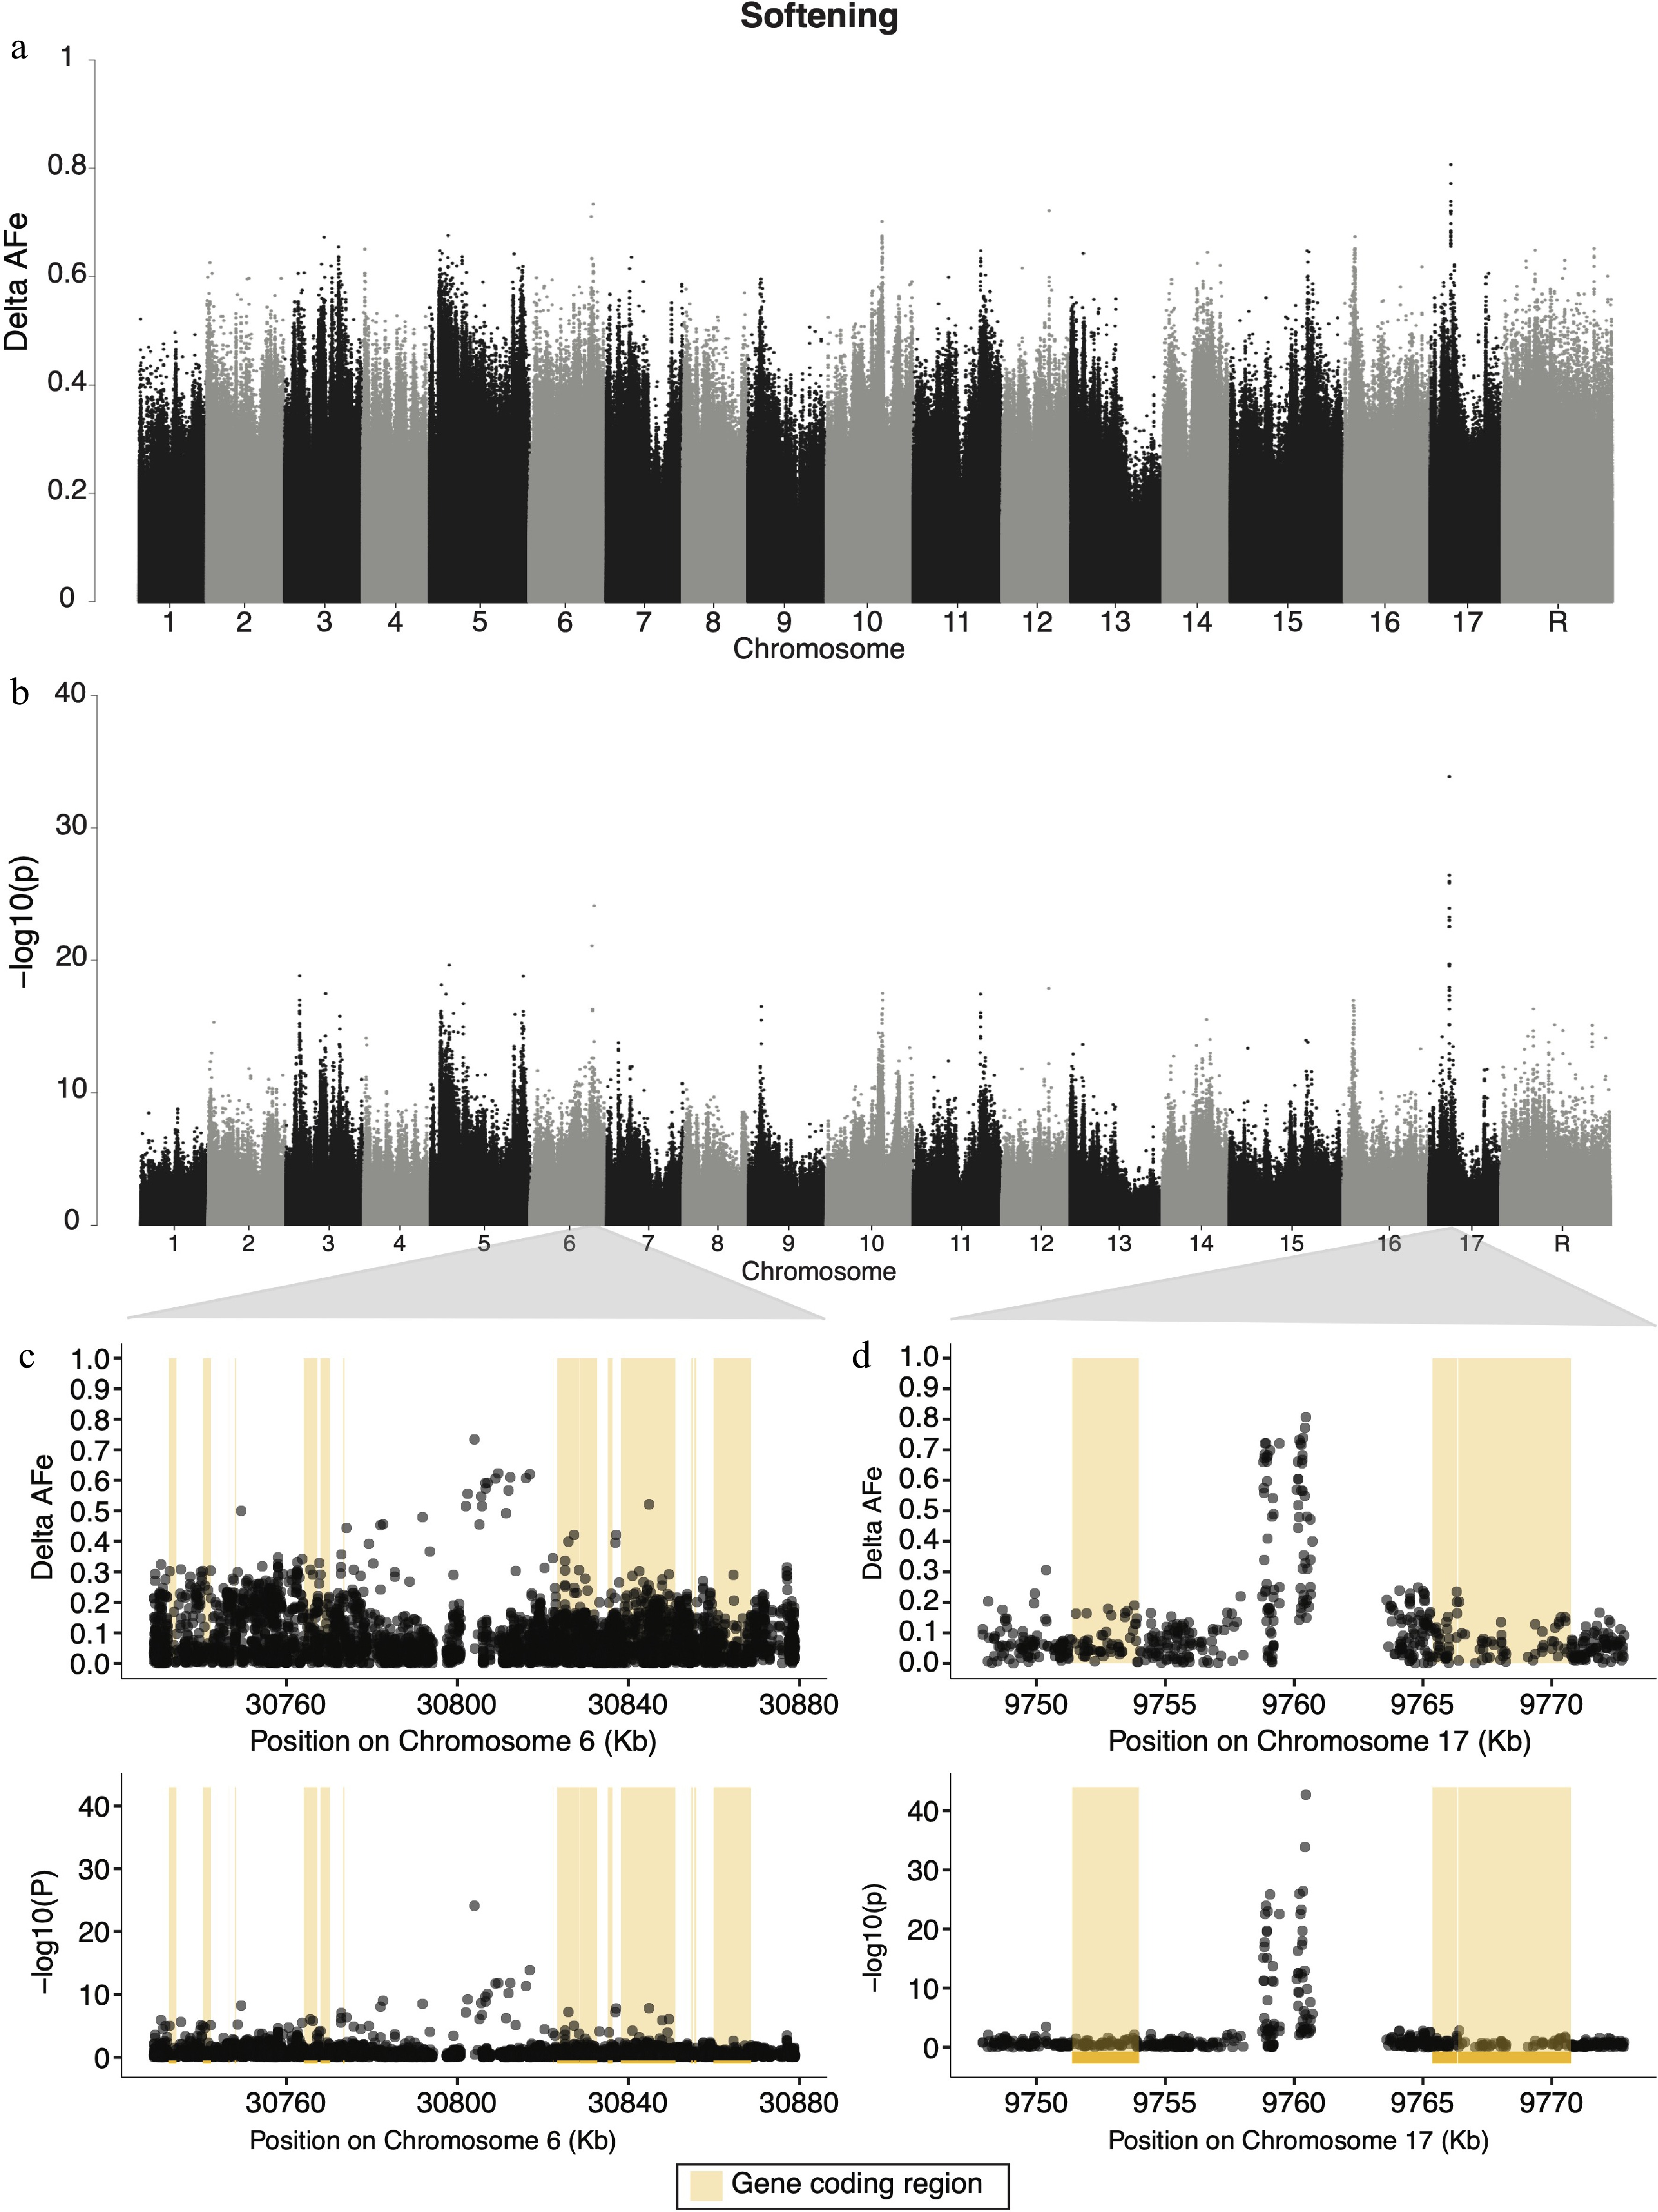
Figure 4.
Manhattan plots for genome wide delta-AFe and chi-squared test p-values for apple softening. (a) Delta-AFe values and (b) chi-squared test p-values from variants detected across the genome. (c), (d) Zoom-in plots for signals on chromosome 6 and chromosome 17. Yellow bars indicate protein coding regions.
-
We aimed to identify candidate genes and putatively causal variants underpinning three economically important apple phenotypes: ripening time, phenolic content, and softening. Here, we used a pool-seq approach[30], a cost-effective WGS method that has been successfully employed to identify putatively causal alleles for phenotypes in other plant species[24,25,40], to scan the genome for regions of genetic differentiation between groups of individuals with extreme phenotypes. Candidate regions discussed below were defined as regions of the genome within 20 kb of the strongest signals from our genome-wide scan for each trait.
Further evidence that NAC18.1 impacts ripening time in apple and a novel signal on chromosome 4
-
There is strong evidence that ripening time in apple is controlled by a transcription factor on chromosome 3, NAC18.1[7,17,18], the homolog of the well-studied NOR ripening gene in tomato. Numerous variants in the coding region of this gene have been discovered in apple[7], however, no strong evidence of causal variant(s) underlying ripening time has been revealed to date. Our pool-seq approach successfully identified a candidate locus encompassing the NAC18.1 region on chromosome 3. The candidate region for ripening time is a roughly 80 kb window of variants showing high delta-AFe values (Fig. 2c). While hundreds of high delta-AFe variants exist within the coding region of nearby genes, including the previously identified nonsynonymous SNP D5Y within NAC18.1 (Fig. 2c)[7], the most extreme delta-AFe and CST p-values for ripening time did not lie within the coding region of NAC18.1. The strongest signal within the chromosome 3 window was 4.6 kb upstream of the gene NAC18.1, which suggests that the causal variants for ripening time may be regulatory variants impacting the expression of NAC18.1. Thus, our results suggest that ripening time in apple is likely impacted by genetic changes in regulatory elements that affect the expression of NAC18.1 rather than non-synonymous changes to its coding region. Our findings here are similar to those in peach, in which genomic variation approximately 10 kb upstream of a NAC transcription factor has been found to influence the ripening period of peach fruit through modulated gene expression[41].
Additionally, a 4 kb gap in variant detection appears approximately 20 kb upstream of NAC18.1 (Fig. 2c). Read depths from the early ripening time pool fell below the depth threshold in this region (see Methods), resulting in a segment within the chromosome 3 signal in which no variants were called (Fig. 2c). This gap in variant calling was caused by low sequence coverage in the early harvest pool, but not in the late harvest pool. This observation suggests that a deletion of sequence upstream of the NAC18.1 locus may result in earlier harvested apples. This is consistent with observations in peach in which a tandem repeat variant is associated with elevated NAC expression in early-ripening accessions[41]. Similar gaps in delta-AFe values were identified in a pool-seq approach examining cannabinoid synthesis in cannabis and suggest that presence/absence variants may be involved in that phenotype[25]. A recent study demonstrated that the presence/absence of TEs can impact the regulation of transcription factors, ultimately influencing plant traits like flower colour[42]. Taken together, our results suggest genetic variation in the regulatory region of NAC18.1 is likely playing a key role in ripening time in apple.
We also detected a candidate region on chromosome 4 for ripening time, which represents a novel locus for this phenotype. The strongest signal in this region does not include variants within coding regions of any nearby genes, but could indicate variants impacting gene regulation. The closest gene to the top hit on chromosome 4 is a histidine kinase (MD04G1013100), belonging to a family of multi-functional proteins that often play a role in signal transduction and cellular reception in plants[43]. Given that apple ripening is regulated in large part by cell signaling and plant hormones[44,45], it follows that variation in or near genes related to signal transduction and reception may lead to variation in ripening time. A recent RNA-seq study determined that genes on chromosome 4 likely impact ripening period in apple[46]. The top hit on chromosome 4 in the present work is approximately 0.5 Mb downstream of a Homeodomain-like superfamily gene (MD04G1008300) that has been previously been linked to the early ripening phenotype in a mutant Hanfu apple variety[46]. Because this Homeodomain-like superfamily gene is over 0.5 Mb downstream from our strongest signal on chromosome 4, it remains unclear if this gene and the signal detected in the present work are linked.
The signal on chromosome 4 was unexpected given that numerous previous genetic mapping studies of apple ripening time[13,18,23] identified only a single peak near NAC18.1 on chromosome 3 but never yielded a signal on chromosome 4 for ripening time. The signal on chromosome 4 was likely detected in the present study due to the higher marker density obtained here compared to previous studies that relied on relatively low-density genotyping-by-sequencing (GBS) data. The variants that make up the signal on chromosome 4 fall in a region of the genome that lacked markers completely in previous mapping studies (Supplemental Fig. S3). While this signal could be an artifact of erroneous read mapping or reference genome misconstruction, we suggest that this novel candidate region for apple ripening time on chromosome 4 is worthy of future investigation.
Signals for phenolic content production detected across the genome
-
Multiple candidate genomic regions for total phenolic content were detected, including signals on chromosomes 4, 7, 8 and 16 (Fig. 3a, b). This suggests a complex genetic architecture underlying total phenolic content involving numerous loci, consistent with both the way in which the phenotype was measured and the complexity of phenolic content production in apple fruit. Total phenolic content captures the total reductive potential of apple tissue and therefore measures the collective concentration of many phenolic compounds. Given that the measure of total phenolic content captures the cumulative reductive capacity of multiple secondary metabolites, it is unsurprising that we detect numerous candidate regions for this phenotype across the genome.
The candidate region containing the variant with the largest delta-AFe value for total phenolic content was detected on chromosome 4. This signal is a single SNP (Fig. 3c) in the 3'-UTR region of a
(TPR)-like superfamily protein gene (MD04G1034700). TPR motifs facilitate protein-protein interactions and TPR-containing proteins have long been implicated in complex plant processes and plant hormone signaling networks including cytokinin and gibberellin responses as well as ethylene biosynthesis[47−49]. Because the production of phenolic compounds is often linked to stress and various environmental cues, it is possible that this (TPR)-like superfamily protein plays a role in hormone signaling networks that influence polyphenol production. 3'-UTR regions are untranslated regulatory regions of mRNA, and 3'-UTR sequences can impact polyadenylation, translation efficiency, and stability of mRNAs[50]. Therefore, while the exact role of TPR-like superfamily protein remains unclear, the variant detected here may be influencing translational regulation of the (TPR)-like superfamily protein and downstream total phenolic content production. We also detected two candidate regions for total phenolic content on chromosome 8 (Fig. 3a, b). The first region, located at approximately 11.3 Mb, consisted of multiple variants with high delta-AFe values. However, none of these variants fell within protein coding regions and the nearest coding regions are unannotated. It is possible that one or both of the unannotated genes in the region are involved in phenolic content production, but without proper annotation, their involvement in phenolic content production remains uncertain. The second region on chromosome 8, located at approximately 28.7 Mb, consists of a peak of variants centered around a T/C SNP at 28,726,105 bp, which had the smallest CST p-value for the phenolic content phenotype. The nearest gene to this signal is a Ubiquinol-cytochrome C reductase hinge protein gene (MD08G1223400), approximately 8.9 kb downstream of the top SNP in the region. By measuring total phenolic content with the Folin–Ciocalteu assay, it is assumed that redox potential from substrates other than polyphenols is approximately constant across cultivars. However, if there is variation in reducing substrates other than polyphenols, then signals in the genome contributing to variance in non-polyphenolic substrates may be detected instead. Given that Ubiquinol-cytochrome C reductase encodes a key enzyme in the oxidative phosphorylation process within the mitochondria, the signal we detected at this locus may be picking up on genetic variation contributing to the amount of Ubiquinol-cytochrome C reductase produced in the cell rather than genetic variation contributing to phenolic content production. To our knowledge, while many other attempts to map phenolic content production in apple have been made[13,15,29,51], only one has provided evidence for the involvement of chromosome 8[20], suggesting that at least one of the signals found on chromosome 8 could be an artifact of measuring other reducing compounds in apple. Further investigations in discovering genes underlying phenolic content in apple would be wise to use phenotyping methods such as liquid chromatography–mass spectrometry or high-performance liquid chromatography, which can accurately quantify specific polyphenols.
Two candidate regions were also detected on chromosome 16 (Fig. 3a, b). The first region consisted of a cluster of variants around 3.8 Mb (Fig. 3e) and the second of a single variant at 2.7 Mb. The former cluster, a 50 kb window of variants with high delta-AFe and CST p-values (Fig. 3e), is roughly centered around a C/A SNP at 3,864,330 bp. Notably, there are four annotated UGT gene coding regions within 7.1 kb of this SNP. UGTs belong to a large gene family that produce glycosides by catalyzing the transfer of sugar subunits between molecules[52]. Some UGTs are understood to catalyze the final steps in producing phenolic compounds in apple including phloridzin, quercetin glycosides, cyanidin pentoside, and kaempterol glycosides[51,53]. One of the UGTs in this region is UDP-glycosyltransferase 89B1, also known as flavonol 3-O-glucosyltransferase, which catalyzes the glucosylation of flavonols[54] and contributes to the production of diverse phenolic compounds[55]. Further, flavonol 3-O-glucosyltransferase has been previously implicated in the production of anthocyanin in strawberries and apple[56,57]. Moreover, decreased expression of flavonoid 3-glucosyltransferase was found to be associated with lower anthocyanin production in sweet cherry (Prunus avium), a closely related species[58]. This is consistent with previous linkage mapping studies in apple that have suggested UGTs as candidate genes for phenolic content production in apple[20]. Taken together, the strong signal detected in this cluster of UGT genes suggest that UGTs on chromosome 16 may play a role in phenolic compound production in apple fruit. Further, variation impacting one or more UGTs on chromosome 16 could explain the QTL for kaempferol glycosides and phloridzin observed by Khan et al. [51]. We propose that UGTs on chromosome 16 represent strong candidate genes for polyphenol production in apples.
The variant with the single highest delta-AFe value on chromosome 16 was a T/C SNP at 2,727,461 bp. This SNP is approximately 1.1 Mb upstream of the UGT cluster discussed above, but only 678 kb upstream of LAR1, a gene identified by multiple previous studies as a strong candidate gene for phenolic content production in apple[13,15,20]. In other plant species, LAR1 is directly involved in the production of catechin, a precursor component of procyanidins[59]. McClure et al.[13] suggested that LAR1 may be involved in the production of many apple polyphenols after detecting signals near LAR1 for multiple individually measured phenolic compounds. Linkage mapping experiments have also implicated a QTL hotspot on chromosome 16 for phenolic content that includes LAR1[15,20]. Khan et al.[51] provided evidence that differences in LAR1 expression, rather than coding region variation, was responsible for differences in polyphenol production among apple accessions. We did not detect a strong signal in the LAR1 region in this study, however this is not the result of low sequence read depth in the LAR1 region. It is possible that the SNP detected here is impacting a regulatory element and influencing LAR1 expression, but given the distance between this variant and LAR1 (189 kb), we view this explanation as improbable. Instead, it seems more likely that this variant is picking up a signal related to another gene in the region, perhaps a transcription factor, that acts upstream of LAR1, as postulated by Khan et al[51]. Despite the relatively high marker density employed in this experiment, the precise location of variants on chromosome 16 affecting phenolic content in apple remain unclear.
Multiple loci implicated in apple fruit softening
-
We found signals of allelic differentiation between softening pools on chromosomes 5, 6, 10, 16, and 17 (Fig. 4a, b). Evidence of loci on multiple chromosomes affecting softening is consistent with the hypothesis that fruit firmness is multigenic[14]. Of the signals detected in the present study, those on chromosomes 6 and 17 were the strongest (Fig. 4a, b). The candidate region on chromosome 6 spans roughly 13 kb, with the nearest protein coding sequence 18 kb downstream. As none of the variants with the highest AFe values from this region were within the coding sequences of nearby genes, this signal may be detecting genetic variation in regulatory elements. While there are numerous genes within 20 kb in either direction of this signal (Supplemental Table S4), a group of three Tetratricopeptide repeat (TPR)-like superfamily proteins (MD06G1168400, MD06G1168500, MD06G1168800) about 20 kb downstream are noteworthy. Proteins with TPR domains are common in plant hormone signaling[60−62], and since fruit softening is largely driven through hormone-mediated ripening[49], it could be that these
(TPR)-like superfamily proteins are impacting softening related pathways in apple. Linkage experiments have identified QTLs for fruit firmness on chromosome 6 in the past[14,63], but could not identify putatively causal genes. Our results are in agreement with these linkage studies, and suggest that a locus on chromosome 6 plays a significant role in fruit softening. We detected a candidate region for softening on chromosome 17 made up of two narrow regions of variants with high allelic differentiation between pools (Fig. 4d). The signal in this region is approximately 6 kb downstream of coding sequences for both a Sterile alpha motif (SAM) domain-containing (MD17G1113700) gene as well as a vacuolar protein sorting 11 (vps11) (MD17G1113900) gene. The former is from a family of plant proteins that is still not fully understood, but known to function in a vast number of cellular processes in plants, from DNA protection to stomatal light response[64]. The latter, vps11, belongs to a large family of proteins involved in diverse cellular processes from virus resistance to leaf growth and senescence in plants[65,66]. Interestingly, the narrow regions that make up the signal on chromosome 17 are formed of variants in a region of low variant detection (Fig. 4d) due to low read depth in the high softening pool. As seen in other pool-seq studies in plants[25], large differences in read depths between pools may indicate a region containing structural variation. Here, such a difference could indicate that the signal on chromosome 17 is driven by presence/absence variation or a complex genomic rearrangement responsible for variation in softening among accessions. This signal, and the discrepancy in read depth between pools, could represent a transposable or repetitive element that is largely absent in the high softening group, and present in the low softening group, for example. Further mapping studies using diverse germplasm with high-density marker data is required to understand the structure of this genomic region and its relationship to fruit softening.
Chromosome 10 has been suggested to harbor alleles responsible for apple fruit softening by multiple groups[23,67−70], and a signal on chromosome 10 is detected in the present study (Fig. 4a, b). Previous attempts to map fruit softening in the diverse apple population used here have detected SNPs associated with softening near an ethylene response factor (ERF) (MD10G1184800)[23]. However, the strongest signal on chromosome 10 in the present study is 972 kb upstream of ERF, and closer to PG1 (Supplemental Fig. S4), a well-studied fruit firmness gene[71], which has been suggested by many groups as a promising candidate gene for apple softening[67−69]. In fact, a variant in PG1 is considered by many as a 'functional SNP' and is frequently used to predict firmness in apple germplasm[72]. Further, Di Guardo et al. [21] have provided evidence that expression of PG1 is correlated with apple fruit softening. Interestingly, the variant on chromosome 10 most strongly associated with softening in the present study is 451 kb upstream of PG1. This suggests that the signal we detect may be caused by a long-range regulatory element impacting PG1 expression, consistent with the relationship proposed by Di Guardo et al.[21]. However, given the density of genetic variants in the present work, the rapid LD decay in our population[73], and the questionable utility of PG1 variants to predict fruit firmness[7,23,74], it is also possible that this signal is detecting another gene that influences fruit softening nearby. The strongest signal detected on chromosome 10 in the present study is immediately upstream of a Long-chain fatty alcohol dehydrogenase family protein (MD10G1176100). This family of genes is known to be involved in the production of fatty alcohols, which contribute to forming plant cuticular waxes[75,76]. Plant waxes are important for preventing non-stomatal water loss[77], and have been implicated in contributing to the storability of blueberry fruits[78]. While there is some evidence that wax composition impacts apple softening[79], the link between the production of waxes on the peel of apple and fruit storability remains unclear. Nonetheless, we suggest that Long-chain fatty alcohol dehydrogenase family protein should be considered as a candidate gene for apple fruit softening.
The discovery of many regions of the genome associated with softening is in agreement with previous studies suggesting that this trait is multigenic. QTLs for softening have been mapped to chromosomes 5, 6, 10, and 16[14,21−23,63,71,80], all of which are detected in the present work. Given the complexity of fruit softening during storage and the number of loci discovered, our work is in agreement with previous suggestions that the genetic architecture of apple softening is multigenic.
It is worth noting that in the present study, DNA sequencing reads from each of the pools covered roughly 80% of the reference genome, meaning that nearly 20% of the positions in the reference genome were not considered in the present analysis. This leaves a considerable portion of the genome unexamined. Future works should aim to examine as much of the genome as possible, perhaps through the use of pangenomes or alternative DNA sequencing methods.
-
To date, there have been few causal alleles discovered in apple. With the rise of gene editing technologies and the continued desire for improved fruit varieties, the discovery of causal alleles is key for accelerated fruit improvement. In this study, we scanned the genome for genetic differentiation between groups of diverse individuals with the aim of finding regions of the genome responsible for ripening time, phenolic content production, and fruit softening. Our study provides further evidence that NAC18.1 is involved in controlling ripening time, suggests that variation impacting regulation of NAC18.1 may be causal, and implicates a novel locus for ripening time on chromosome 4. Further, this investigation identified multiple loci across the genome related to phenolic content production, and suggests that a cluster UGT genes on chromosome 16, among others, are responsible for variation in phenolic content production. Finally, the strong signals detected on multiple chromosomes in the present work suggest a complex genetic architecture for softening, and implicates many candidate genes, including a gene related to fruit wax production on chromosome 10. Together, the genomic resolution provided by the data in this work sheds light on the genomic control of important phenotypes and will support future efforts to enable genomics-assisted improvement of apples.
-
The datasets generated during and/or analyzed during the current study are available in the NCBI SRA repository (
www.ncbi.nlm.nih.gov/sra/PRJNA929465 ). This work was supported by the National Science and Engineering Research Council of Canada.
-
The authors declare that they have no conflict of interest.
- Supplemental Fig. S1 Bioinformatic workflow of the pool-seq GWAS.
- Supplemental Fig. S2 Read depth histograms for each phenotype pool. Red bars indicate read depth cutoff limits (50x and 500x).
- Supplemental Fig. S3 Overlap of variants from the present study and previous mapping experiments using GBS studies (Migicovsky et al. 2022).
- Supplemental Fig. S4 Manhattan plots for softening signal on chromosome 10. Delta-AFe (A) and CST p-values (B) are represented by black dots, red bars indicate coding regions of Long-chain fatty alcohol dehydrogenase family protein (LCFAD) (MD10G1176100), PG1, and ERF (MD10G1184800), respectively.
- Supplemental Table S1 Genome coverage table. Various position read mapping data including total genome coverage by position, total genome coverage by percent, and average read depth.
- Supplemental Table S2 Ripening time extended results. Ripening time top variant hits, candidate genes, and top GO enrichment terms.
- Supplemental Table S3 Total phenolic content extended results. Total phenolic content top variant hits, candidate genes, and top GO enrichment terms.
- Supplemental Table S4 Softening extended results. Softening top variant hits, candidate genes, and top GO enrichment terms.
- Copyright: © 2023 by the author(s). Published by Maximum Academic Press, Fayetteville, GA. This article is an open access article distributed under Creative Commons Attribution License (CC BY 4.0), visit https://creativecommons.org/licenses/by/4.0/.
-
About this article
Cite this article
Davies T, Myles S. 2023. Pool-seq of diverse apple germplasm reveals candidate loci underlying ripening time, phenolic content, and softening. Fruit Research 3:11 doi: 10.48130/FruRes-2023-0011 

Pool-seq of diverse apple germplasm reveals candidate loci underlying ripening time, phenolic content, and softening
- Received: 21 February 2023
- Accepted: 18 April 2023
- Published online: 10 May 2023
Abstract: Ripening time, softening, and phenolic content are phenotypes of considerable commercial importance in apples. Identifying causal genetic variants controlling these traits not only advances marker-assisted breeding, but it is also an essential step for the application of gene editing technologies in apples. To advance the discovery of genetic variants associated with these phenotypes, we examined allele frequency differences between groups of phenotypically extreme individuals from Canada’s Apple Biodiversity Collection using pooled whole genome sequencing (pool-seq). We sequenced pooled DNA samples to an average read depth of 150x and scanned the genome for allelic differentiation between pools. For each phenotype, we identified >20 million genetic variants and identified numerous candidate genes. We identified loci on chromosomes 3 and 4 associated with ripening time, the former suggesting that regulatory variants upstream of a previously identified transcription factor NAC18.1 may be causal. Our analysis identified candidate regions on chromosomes 4, 8, and 16 associated with phenolic content, and suggested a cluster of UDP-Glycosyltransferase family genes as candidates for polyphenol production. Further, we identified regions on chromosomes 17 and 10 associated with softening and suggest a Long-chain fatty alcohol dehydrogenase family gene as putatively causal.
-
Key words:
- Apple /
- Genetic mapping /
- Ripening time /
- Softening /
- Phenolic content /
- Pooled sequencing