


-
Myxomycetes (plasmodial slime molds) are a group of approximately 1,000 amoebozoan species that form macroscopic spore-bearing fruiting structures (sporocarps) associated with dead and decaying vegetation across terrestrial habitats worldwide[1]. Coarse woody debris, leaf litter, and twigs are the most studied substrates upon which, during the reproductive stage of their life cycle, myxomycetes produce sporocarps[2]. Since these substrates are irregularly distributed in natural systems, field-based myxomycete biodiversity assessments have largely adopted an opportunistic sampling strategy as explained by Cannon & Sutton[3]. Ecological evaluations carried out over the last few decades have attempted different levels of standardization by implementing plots and transects of various styles to minimize the errors associated with field sampling[4]. However, little research on the methodologies used to record myxomycetes in field conditions has been carried out and most researchers do not have strong empirical basis for the design of field experiments.
The development of myxomycete sporocarps in nature is a complex sporadic temporal and spatial event influenced by numerous poorly understood factors. Researchers have treated this unpredictability as a type of random error (see the comments on the idea of homogeneity of niche distribution in Rojas et al.[5]). This approach is problematic because both substrate quality and availability are determined by the system's characteristics (i.e., elevation, topography, proximity to streams) therefore their impacts are not random, but systematic. For instance, studies carried out during the last few decades have shown that the production of myxomycete sporocarps is affected by the distribution of nutrients in the system[6, 7], the distribution of substrates[8, 9] and the distribution of microenvironments[5,10]. As such, the variability of sporocarp occurrence observed in different myxomycete studies based on field collections can potentially be reduced, or controlled to some extent, by means of experimental design.
The present study was developed as a strategy to quantify some of the potential pitfalls of field methodologies for long-term myxomycete monitoring using sporocarps. As such, the main objectives of this study were to evaluate two sampling methodologies on the structure of obtained myxomycete data in a Neotropical forest and to analyze the potential effect of forest characteristics on the generated data as a proxy for the selection of collecting sites. In recent years, the development of molecular techniques of detection for myxomycetes in field conditions[11] has allowed researchers to increase the taxonomic definition of studies. However, traditional methods that document sporocarp development under natural conditions in the field can facilitate a worldwide effort to document myxomycetes because they are easier and cheaper to implement. Since the latter two elements of scientific activity are core ideas of the Sustainable Development Goals (
https://sdgs.un.org/goals ), any effort to improve methodological aspects of biological surveys, particularly for understudied groups of organisms are innovative and relevant. -
A total of 51 species of myxomycetes in 20 genera were recorded in the two years of study for an overall species to genera ratio of 2.55. Of the total number of species, 34 were recorded during the first year and 44 during the second, to give ratios of species to genera of 2.61 and 2.44, respectively (Table 1). The total number of records for the complete study was 2002, from which 916 (45.8%) were observed during the first year and 1086 (54.2%) during the second. The overall values for both the Shannon and Simpson Diversity Indices were 2.49 and 0.86 for the first year, and 2.50 and 0.85 for the second. No differences in the indices were found between years (t = −0.10, d.f. = 1,980, p = 0.91 for the Shannon's Index), and the Bray-Curtis similarity index was 0.84 between the two sets. The Hill number profiles (Fig. 1) showed that species with typical abundances (q = 1) were similar between years, and dominant species (q = 2) were slightly lower during the second year.
Table 1. Complete list of myxomycetes species recorded in the present study arranged by year/ methodological approach and forest section as described in the section 'Materials and Methods'. Ecological summary metrics are provided at the bottom.
Species / ecological indicators First year (rotating locations) Second year (fixed locations) Total F1 F2 F3 F1 F2 F3 Arcyria cinerea (Bull.) Pers. 30 46 23 22 33 32 186 Arcyria denudata (L.) Wettst. 7 11 14 19 30 24 105 Arcyria incarnata (Pers. ex J.F. Gmel.) Pers. 1 1 Arcyria insignis Kalchbr. & Cooke 1 2 3 Ceratiomyxa fruticulosa (O.F. Müll.) T. Macbr. 25 20 15 66 60 30 216 Clastoderma debaryanum A. Blytt 1 1 Comatricha nigra (Pers. ex J.F. Gmel.) J. Schröt. 1 1 3 5 Comatricha tenerrima (M.A. Curtis) G. Lister 2 4 2 5 1 1 15 Craterium aureum (Schumach.) Rostaf. 1 1 Craterium leucocephalum (Pers. ex J.F. Gmel.) Ditmar 2 2 Cribraria cancellata (Batsch) Nann.-Bremek. 1 6 1 5 5 7 25 Cribraria intricata Schrad. 7 2 1 8 3 8 29 Cribraria tenella Schrad. 5 2 3 5 9 3 27 Cribraria vulgaris Schrad. 1 1 Diderma hemisphaericum (Bull.) Hornem. 5 1 2 8 Didymium bahiense Gottsb. 9 8 10 9 6 9 51 Didymium clavus (Alb. & Schwein.) Rabenh. 2 6 2 1 11 Didymium difforme (Pers.) Gray 3 3 Didymium dubium Rostaf. 1 1 Didymium minus (Lister) Morgan 4 2 1 7 Didymium squamulosum (Alb. & Schwein.) Fr. & Palmquist 2 6 10 17 5 2 42 Fuligo septica (L.) F.H. Wigg. 1 1 Hemitrichia calyculata (Speg.) M.L. Farr 70 70 98 100 113 140 591 Hemitrichia serpula (Scop.) Rostaf. ex Lister 5 1 4 1 11 Lamproderma scintillans (Berk. & Broome) Morgan 1 3 1 5 5 15 Lycogala conicum Pers. 2 2 Lycogala epidendrum (L.) Fr. 3 4 5 22 24 14 72 Lycogala exiguum Morgan 1 1 2 Metatrichia vesparia (Batsch) Nann.-Bremek. ex G.W. Martin & Alexop. 3 3 Perichaena depressa Lib. 1 1 Physarella oblonga (Berk. & M.A. Curtis) Morgan 1 1 Physarum album (Bull.) Chevall. 3 19 2 6 10 3 43 Physarum bogoriense Racib. 1 3 4 Physarum compressum Alb. & Schwein. 15 13 12 20 7 55 122 Physarum didermoides (Pers.) Rostaf. 12 8 4 4 9 8 45 Physarum galbeum Wingate 2 2 Physarum globuliferum (Bull.) Pers. 1 1 Physarum javanicum Racib. 1 7 5 13 Physarum melleum (Berk. & Broome) Massee 2 1 3 Physarum pusillum (Berk. & M.A. Curtis) G. Lister 2 3 1 1 1 8 Physarum stellatum (Massee) G.W. Martin 1 1 Physarum tenerum Rex 3 3 Physarum viride (Bull.) Pers. 2 6 6 1 4 19 Stemonitis axifera (Bull.) T. Macbr. 3 2 5 3 1 14 Stemonitis fusca Roth 8 10 2 13 16 7 56 Stemonitis splendens Rostaf. 1 1 Stemonitopsis aequalis (Peck) Y. Yamam. 57 84 62 2 2 2 209 Stemonitopsis hyperopta (Meyl.) Nann.-Bremek. 3 3 Tubifera microsperma (Berk. & M.A. Curtis) G.W. Martin 13 13 Trichia decipiens (Pers.) T. Macbr. 2 2 Trichia favoginea (Batsch) Pers. 1 1 Number of records 272 358 286 347 269 370 2002 Number of species 24 30 26 30 28 27 51 Simpson Diversity Index 0.85 0.87 0.81 0.87 0.88 0.85 0.87 Shannon Diversity Index 2.38 2.6 2.24 2.61 2.55 2.43 2.53 Chao 1 Maximum number of species 25 33 29 50 28 29 62 
Figure 1.
Diversity profile curves constructed with observed data for both years of study. The Order q value of 0 is associated with species richness, a value of 1 indicates typical abundances and a value of 2 is related with dominant species.
During both years of study, the forest section corresponding with F1 showed the lowest number of records, although differences were not significant (F(2,9) = 0.48, p = 0.62). For the first year, F2 was associated with the highest number of both records and species, whereas for the second year, most records were associated with F2 and F3, and the highest number of species was observed in F1. Overall, 21 species (41.2%) were only recorded in one forest section during one single year, with five species observed only during the first year and 16 recorded only during the second year. Of those species, the majority were observed in both F1 (8 species, 38%) and F2 (8 species, 38%), with only five (24%) recorded in F3. Consequently, low values for both evaluated diversity indices were observed in F3 during both years, with the lowest during the first year (Table 2).
Table 2. Results of the surveys carried out in the present study arranged by location and methodological strategies used during the two years of investigation. The highest three values for each column are shown in bold.
Location code Visits/year Average number of records/visit Total number of recorded species* Simpson's
Diversity IndexShannon's
Diversity IndexShannon's
Evenness IndexF1-1 Four (first year) 8.3 11 0.80 1.91 0.62 F1-2 Four (first year) 13.8 10 0.81 1.86 0.64 F1-3 Four (first year) 16.3 19 0.88 2.55 0.67 F1-4 Four (first year) 11.8 12 0.82 1.99 0.61 F1-5 Four (first year) 6.3 8 0.72 1.62 0.63 F1-6 Four (first year) 11.8 10 0.76 1.78 0.60 F2-1 Four (first year) 19.0 17 0.86 2.33 0.60 F2-2 Four (first year) 17.0 19 0.87 2.43 0.60 F2-3 Four (first year) 9.0 10 0.82 1.95 0.70 F2-4 Four (first year) 12.5 15 0.87 2.39 0.73 F2-5 Four (first year) 22.5 17 0.78 1.97 0.42 F2-6 Four (first year) 9.5 12 0.81 2.02 0.63 F3-1 Four (first year) 16.3 17 0.85 2.22 0.54 F3-2 Four (first year) 13.3 11 0.76 1.77 0.53 F3-3 Four (first year) 8.5 9 0.75 1.71 0.61 F3-4 Four (first year) 7.8 8 0.70 1.53 0.58 F3-5 Four (first year) 15.5 11 0.78 1.87 0.59 F3-6 Four (first year) 10.3 12 0.85 2.14 0.71 F1-1 Twelve (second year) 18.9 25 0.93 2.96 0.77 F1-2 Twelve (second year) 21.3 20 0.88 2.51 0.61 F2-1 Twelve (second year) 26.2 22 0.89 2.53 0.57 F2-2 Twelve (second year) 15.0 21 0.90 2.74 0.74 F3-1 Twelve (second year) 19.7 19 0.88 2.49 0.64 F3-2 Twelve (second year) 21.7 24 0.88 2.66 0.59 * This metric considered all species recorded in each location, independent of survey effort. Since the effort for the fixed locations during the second year represented three times the effort in the same locations during the first year, a higher number of species was naturally expected. As such, the values are comparable within each year, but not necessarily between years. Over the first year of study, when rotation of locations within each forest section took place, the three locations with the highest number of records accumulated in all four visits corresponded with codes F2-1, F2-2 and F2-5, all of them contiguous and in the F2 section of the forest. The three locations with the lowest number of records made in all four visits were F1-1, F1-5 and F3-4, mostly in the F1 forest section. For the second year of study, when no rotation of locations took place, results were consistent. The highest values were recorded in F2-1 and the lowest values in F1-1. When the number of species recorded were analyzed, for the first year the highest values were observed in F1-3, F2-2 and F2-5 and the lowest values were recorded in F1-5, F3-3 and F3-4. For the second year the highest values were associated with F1-1 and F3-2 whereas the lowest values were observed in F3-1. With such results, the most species- and record-rich locations were F2-1, F2-2 and F2-5 and the poorest were F1-5, F3-1 and F3-4.
Given the similarities between years, when the complete dataset was analyzed in relation to the functional variables associated with the different forest sections (Table 3), both the number of records and species richness for all studied locations were highly correlated with the average tree density (r > 0.94) and basal area (r > 0.85, Fig. 2). In contrast, the average distance between trees showed negative strong correlations with the number of records (r = −0.96) and species richness (r = −0.94). In general, biomass and soil carbon showed the lowest correlation values with either the number of records or species richness but exhibited remarkably high correlation values with both Shannon's and Simpson's Diversity Indices (r > 0.95 in all cases). The last two indices also showed a strong positive correlation with tree diameter (r > 0.88) and a strong negative correlation with canopy openness (r < −0.96).
Table 3. Quantification of the functional variables studied herein arranged by forest section and associated ecological metrics of the myxomycete assemblages recorded in them.
Functional variable Forest section F1 F2 F3 Average tree diameter (cm) 125.2 123.1 101.9 Canopy height (m) 19.6 17.6 21.2 Canopy openness (%) 20.7 17.1 8.0 Tree horizontal distance (m) 7.1 4.6 6.9 Total basal area (m2/hectare) 522 765 449 Number of trees/hectare 608 733 608 Biomass (tons per hectare) 48.9 49.8 32.9 Soil carbon (tons per hectare) 24.0 24.4 16.1 Leaf litter depth (cm) 2.6 3.2 2.9 Number of records 619 727 656 Number of species 33 38 32 Simpson's Diversity Index 0.87 0.89 0.83 Shannon's Diversity Index 2.57 2.69 2.38 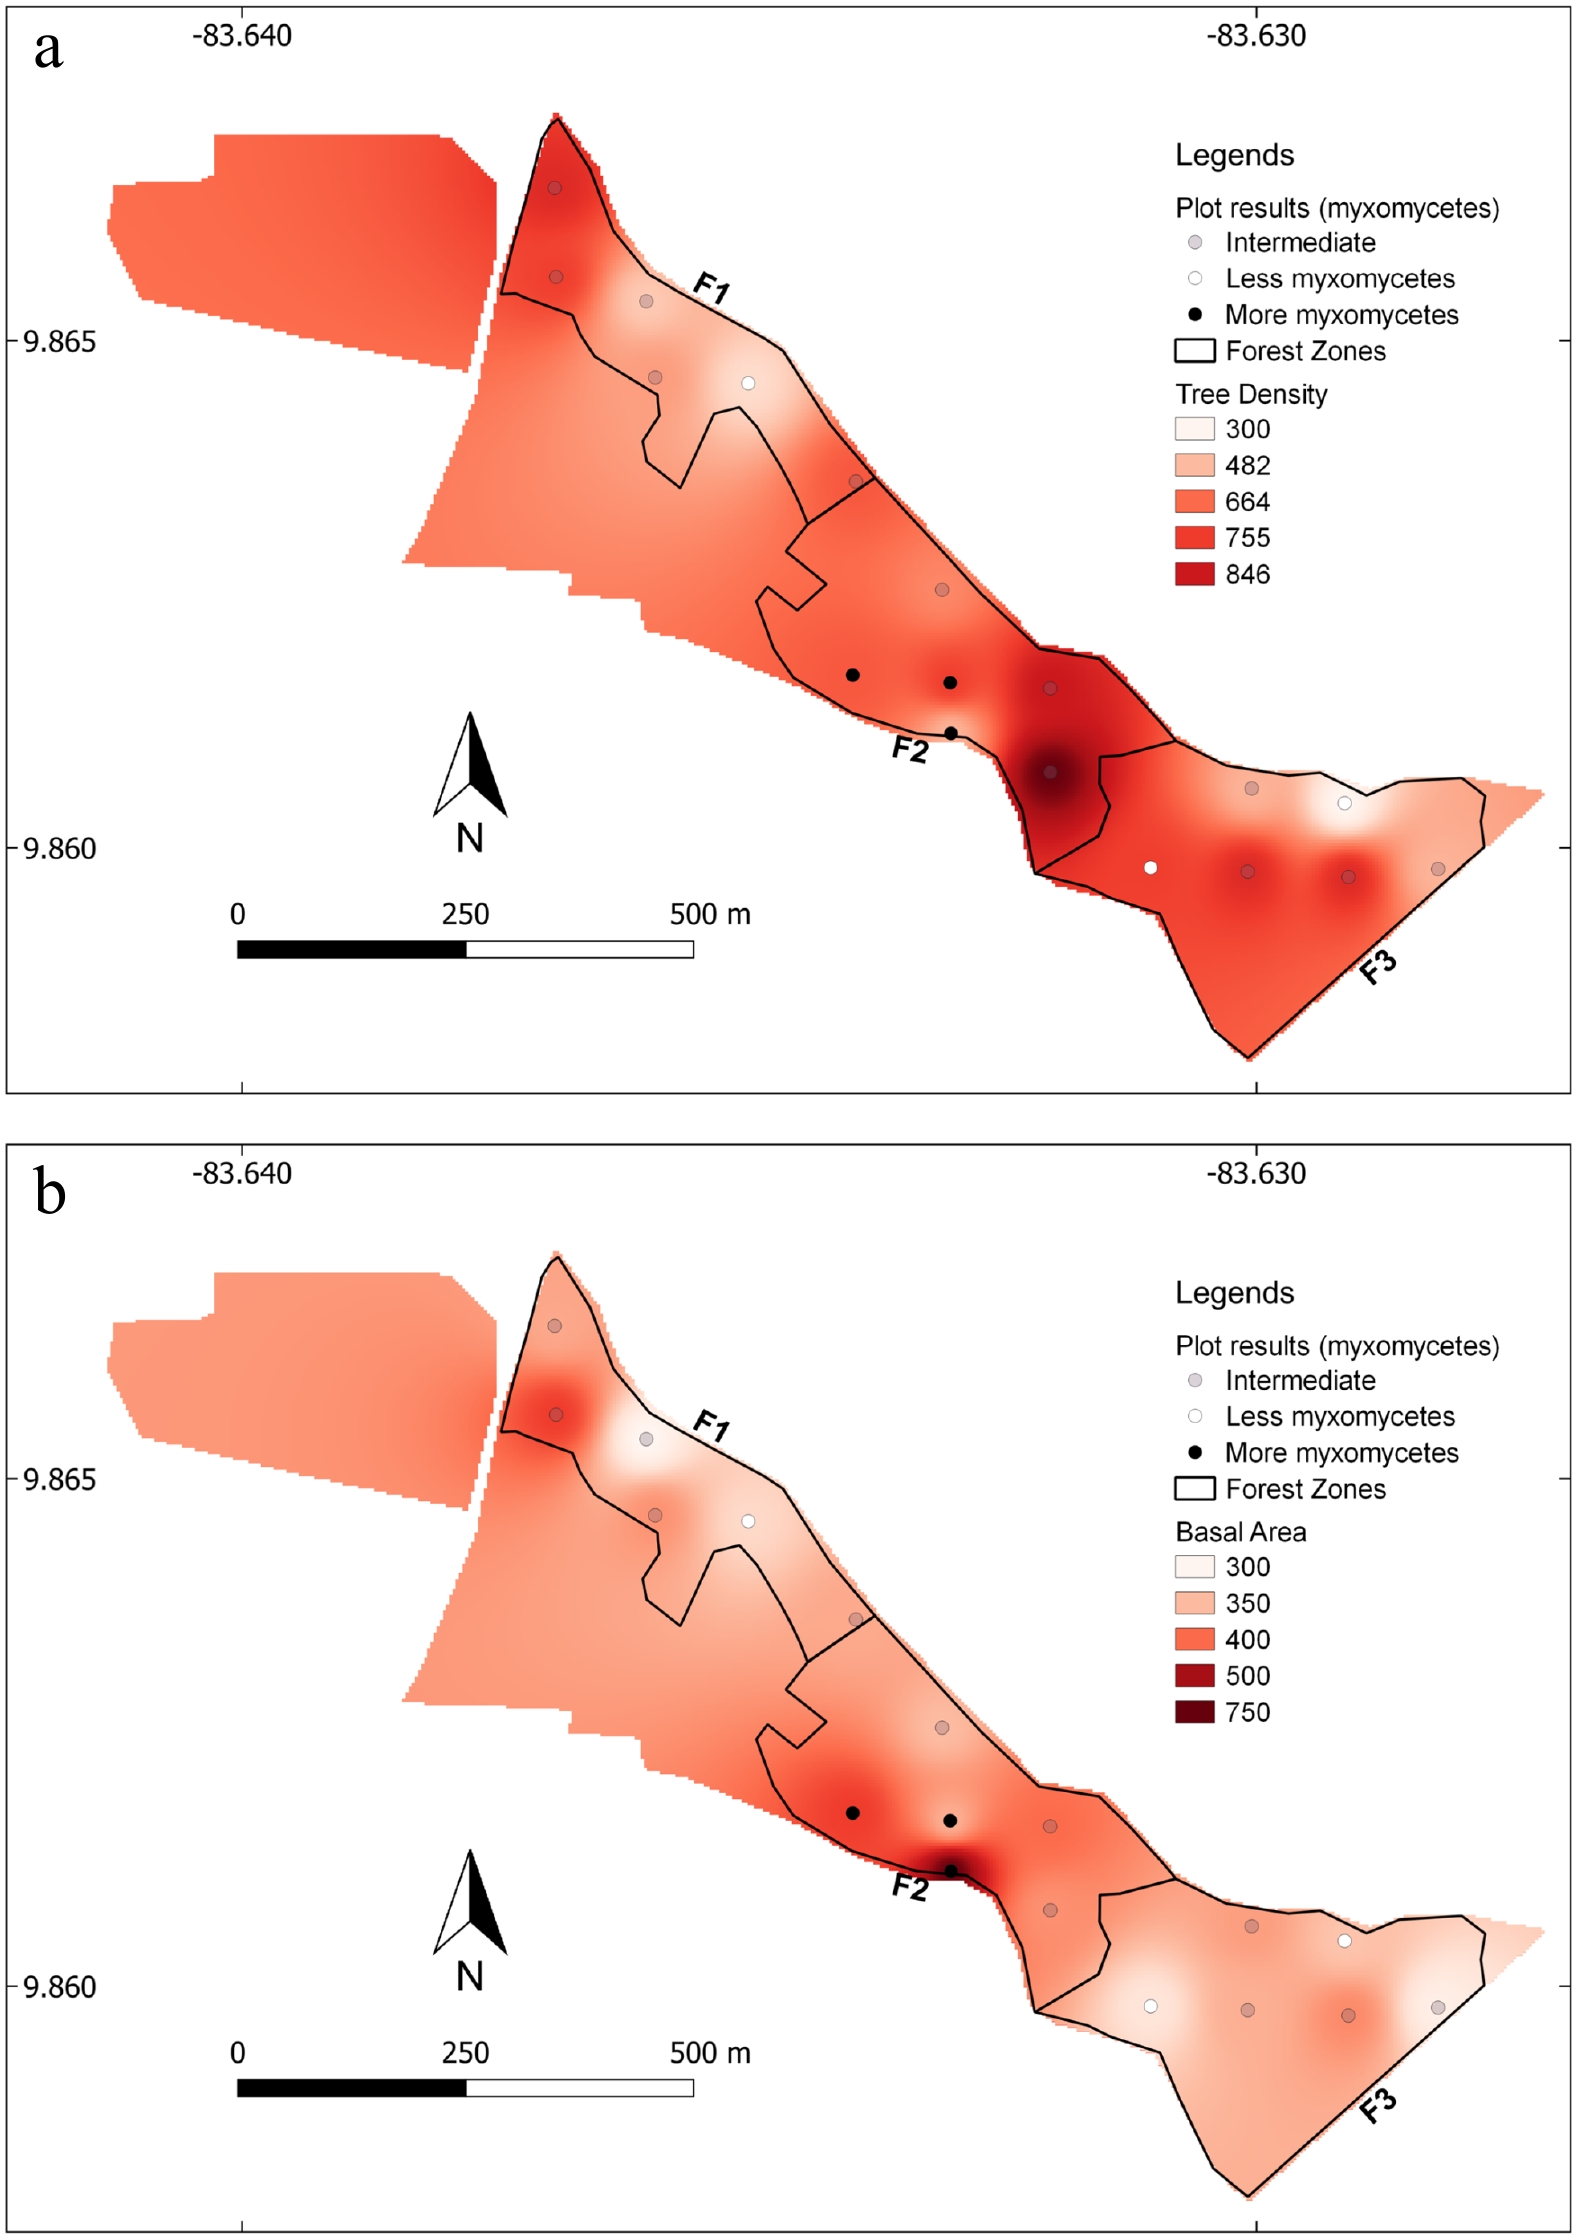
Figure 2.
Image of the studied forest sections showing the differences in tree density (a) count per hectare, and basal area (b) in m2 per hectare for the entire forest patch and the position of the studied locations arranged in terms of integrated results from both years of study (both species richness and diversity).
The Principal Components Analysis on the forest data revealed that tree diameter, leaf litter depth and tree density were the three most important variables, accounting for about 70% of the variability in the functional dataset. As such, all the most productive locations for myxomycetes showed a combination of mid to high tree diameters with mid to high leaf litter depth (Fig. 3a shows first-year data). Contrastingly, mid to low values for both functional characteristics of the forest were associated with the poorest locations. When sampling effort was considered in the analysis and only the six studied locations on both years were considered, results showed that the average number of records per visit tended to decrease as tree diameter increased (Fig. 3b). Interestingly, the number of records per visit tended to increase as a function of leaf litter depth (Fig. 3c), suggesting the balancing effect of the most important functional characteristics of the forest on the observed results (summarized in Fig. 3a). In both latter examinations, second-year results were significantly higher than first-year results, in terms of average number of records (t = 2.72, d.f. = 10, p = 0.02).

Figure 3.
Arrangement of studied locations based on the most important functional characteristics of the forest. (a) Scatterplot based on the two most important principal components showing the richest (red diamonds) and poorest (green diamonds) locations during the first year. (b) Scatterplot of the locations studied during both years based on tree diameter and the normalized number of records. (c) Scatterplot based on leaf litter depth and normalized effort.
When the simulations of partial sampling were carried out, results showed that 73%−82% of the total number of species for the first year were accumulated by randomly sampling one third of the locations. For the second year, the value oscillated between 63%−70% of the total. Similarly, the range of completeness for the number of records oscillated between 31%−34% for the first year and 23%−41% for the second, based on the total value for each dataset (Fig. 4). With these simulated scenarios, both evaluated diversity indices practically reached 100% of the diversity value for the respective year with one third of the effort. No statistical differences in diversity were recorded between the results from simulations and the totals for each year. When the simulated effort increased to one half of the yearly effort, results showed that between 79%−91% and 70%−90% of the total species were observed for the first and second years, respectively. The accumulated number of records associated with each year was similar in both cases with a range between 43%−54%. Also, for the first year, the final value for the Shannon's Diversity Index oscillated between 97%−104%; whereas for the second year such value consistently reached 100%. In general, the dataset associated with rotating the sampling locations showed higher and less variable diversity and richness values than the dataset associated with the second year at one third of the sampling effort. Such differences disappeared when the sampling effort was increased to one half of the total for each year, making both strategies equivalent to generate data.
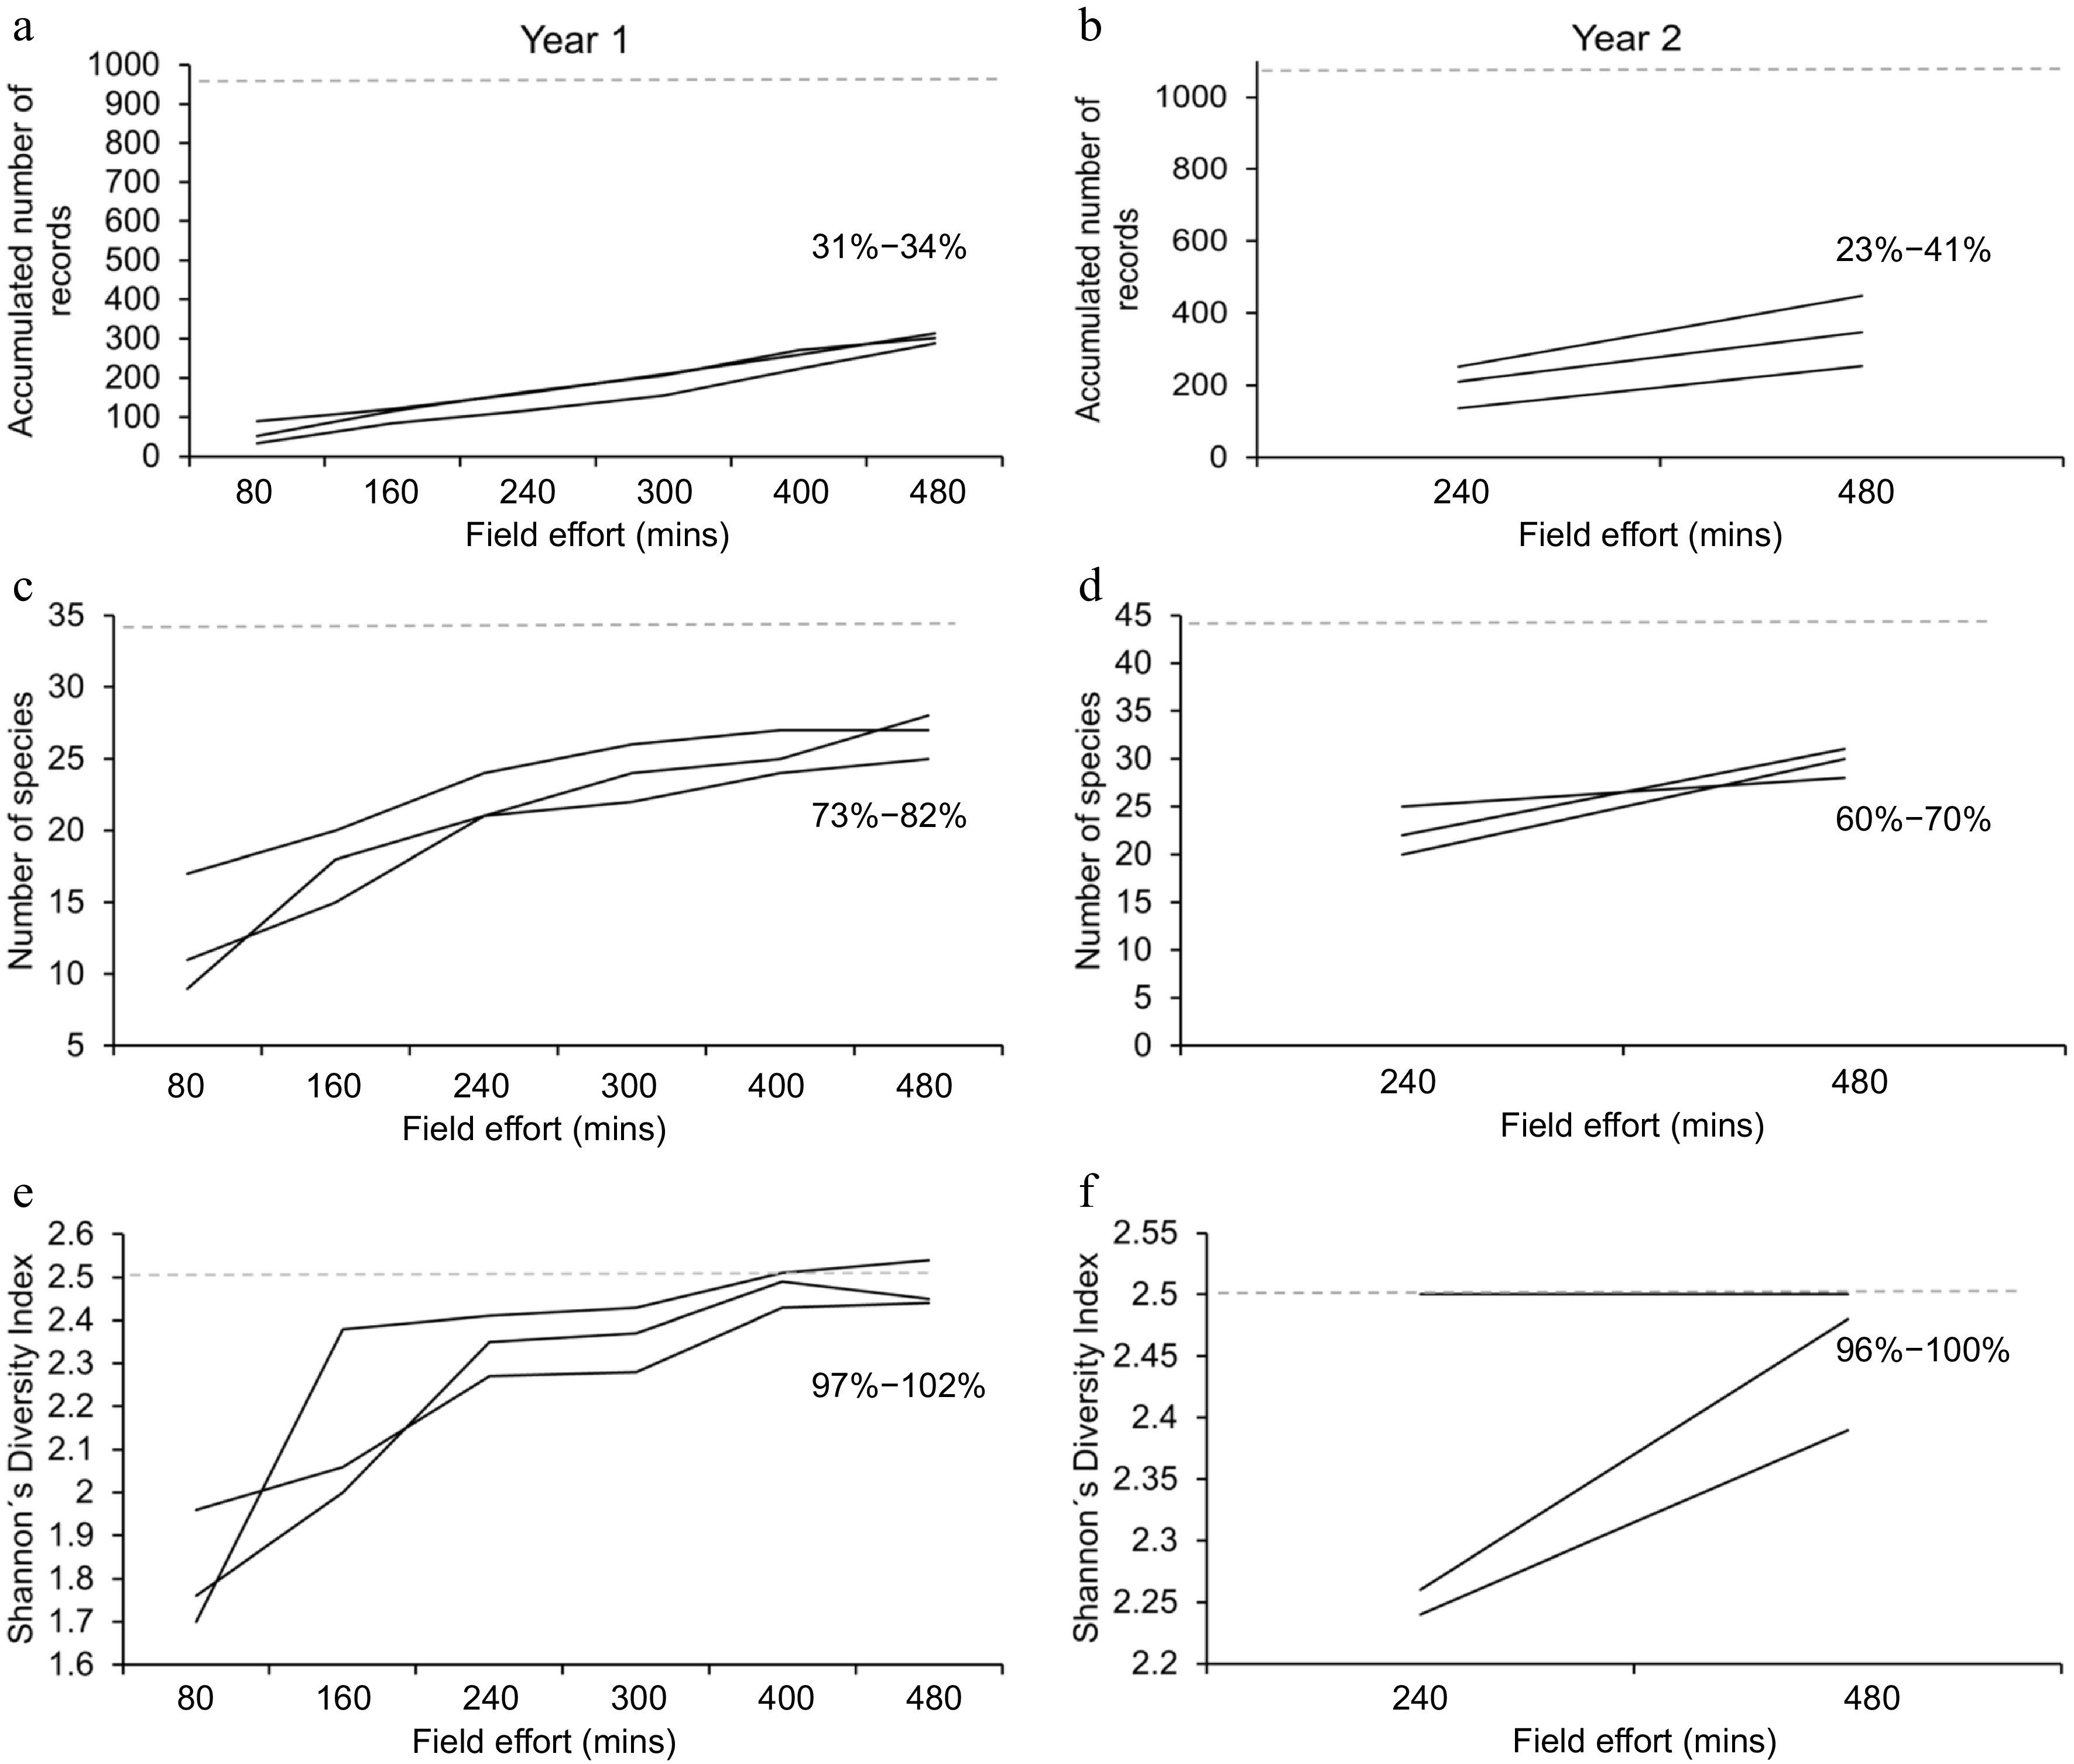
Figure 4.
Results of the simulations carried out with data from one third of the yearly effort. (a), (c) and (e) show the accumulated number of records, the number of species and the Shannon's Diversity Index for the first year, where location rotation took place. (b), (d) and (f) show the same results for the second year, where locations were sampled systematically. In each case, the three black lines represent each one of the three simulations and the dotted line represents the value observed at the end of one complete year of field work. The range of completeness for the set of simulations is shown in percentages.
-
It is remarkable that over 50 species of myxomycetes can be found in a successional tropical forest patch using the techniques explained in the present study. More accurately, a total of 66 species were recorded from the area after using other complementary recording techniques during a third year of investigation[12]. This result implies that a forest patch of 28 hectares can support about 6% of the global diversity of myxomycete morphospecies (based on resarch reported by Lado[13]). As impressive as it sounds, previous research shows that such a result is not that surprising. Rollins & Stephenson[9], for instance, found 21 morphospecies in only 6.25 m2 in a broadleaf temperate forest in Arkansas, USA. Myxomycetes, as other microorganisms, clearly have different spatial and nutritional requirements that translate into high diversity of forms in reduced natural spaces. However, the small size of their sporocarps and the common narrow temporal range of formation of these structures implies that revisiting study locations is necessary to increase the probability of recording some rarely fruiting species.
As observed in the data from this study, a large percentage of the recorded species (21 of 50) were only found in one forest section during one sampling year. Most of them (16) were recorded during the second year when a higher number of visits took place in each sampling location. Interestingly, both the ratio of species to genera and the effect of dominant species on the dataset were also lower during the second year. This showed that fewer but more intensively sampled locations increased the number of non-recorded species and genera. During the first year, when rotation of sampling locations took place, there was a spatial maximization of the effort, which contrasted with the temporal maximization sought during the second year. Based on the data, the second method seemed more adequate to record sporocarps of myxomycetes in the premontane tropical wet forest used for the evaluation. Only when the simulations were carried out and the effort was set at one third of the actual yearly effort, the results from the first-year approached higher values than those from the second year. This suggests that temporal variability, more than spatial heterogeneity should be maximized in the design of long-term studies in similar bioclimatic conditions.
Despite the latter, spatial heterogeneity still imposed a quantifiable influence on the analyzed data structure. As observed in the results, the F2 section seemed more favorable for myxomycete sporocarps to develop; and the F1 section did not promote their occurrence. The area coded as F2, as explained earlier, in addition to the two common tree species also had A. idiopoda, a native legume, whereas F1 had the introduced E. deglupta. The presence of specific plants is known to modify the structure of myxomycete communities, at least when recorded by means of sporocarps that have developed naturally in the field[8]. Likewise, forest structure can also affect their occurrence[5].
Either way, it is interesting to note that the F2 section had the lowest canopy height, the shortest horizontal distance between trees, the highest basal area and biomass, and the thickest leaf litter layer. In contrast, the F1 section showed the highest canopy openness, the largest horizontal distance, and the thinnest leaf litter depth. In this manner, the productivity of myxomycete sporocarps during the two years of investigation seemed to have been facilitated by the more developed succession taking place in the F2 section, likely boosted by the presence of the native legume tree. In a more in-depth structural analysis of the forest, Quesada-Chacón et al.[14] found that the smaller differences among sections in the studied forest patch can be attributed to tree composition. Mora-Chacón et al.[15] observed that soil characteristics also differed slightly among the three studied sections and that such differences can be the result of the management strategy (i.e., the tree species selected for reforestation). These previous results suggest that the post-reforestation processes taking place in the area of study have facilitated the F2 section to perform as the more mature section. In the present investigation, those processes have been quantified in terms of productivity and diversity of myxomycete sporocarps.
In this manner, the location of the 'best' or 'worst' sampling locations in the present study, also documented during the investigation, ended up being related to differences found within the forest characteristics. The present analysis did not consider the effect of climate and its temporality on the productivity of myxomycete sporocarps, but a separate evaluation of these issues for the same area[16] reported that local weather patterns, in particular precipitation and air humidity, have a strong effect on the species recorded at different times. As such, more than trying to define the specific conditions within the forest to produce sporocarps of myxomycetes, this study shows that locations with high or low values in Tables 1 & 2 seemed to be positioned in areas where certain forest conditions were found. Also, it is important to note that even at this level, results from the second year showed higher values for the number of myxomycete recorded per visit. However, for the latter to be visible with objectivity, sampling effort had to be considered.
-
The sampling methodology a researcher employs for myxomycete research can increase or decrease the probability of recording certain species.
This probability is a function of the complexity of the biosystem being investigated.
In the present study, a total of six locations – one per five hectares approximately – was enough to record myxomycetes efficiently over one year of study.
Frequent visitation of sampling locations maximized the probability of recording rarely occurring species that are likely influenced by temporal variability.
-
This study was carried out in a 28-hectare successional forest patch at the Finca Experimental Interdisciplinaria de Modelos Agroecológicos (FEIMA) near the city of Turrialba, in Costa Rica. The forest patch studied was reforested about 35 years ago (in the late 1980s) and is largely dominated by Erythrina poeppigiana (Walp.) O.F. Cook and Castilla elastica Sessé ex Cerv. trees. Based on secondary elements, there are three recognizable forest sections co-dominated by Eucalyptus deglupta Blume (section F1 in Fig. 5), Abarema idiopoda (S.F. Blake) Barneby & Grime (F2), and Enterolobium cyclocarpum (Jacq.) Griseb. (F3).
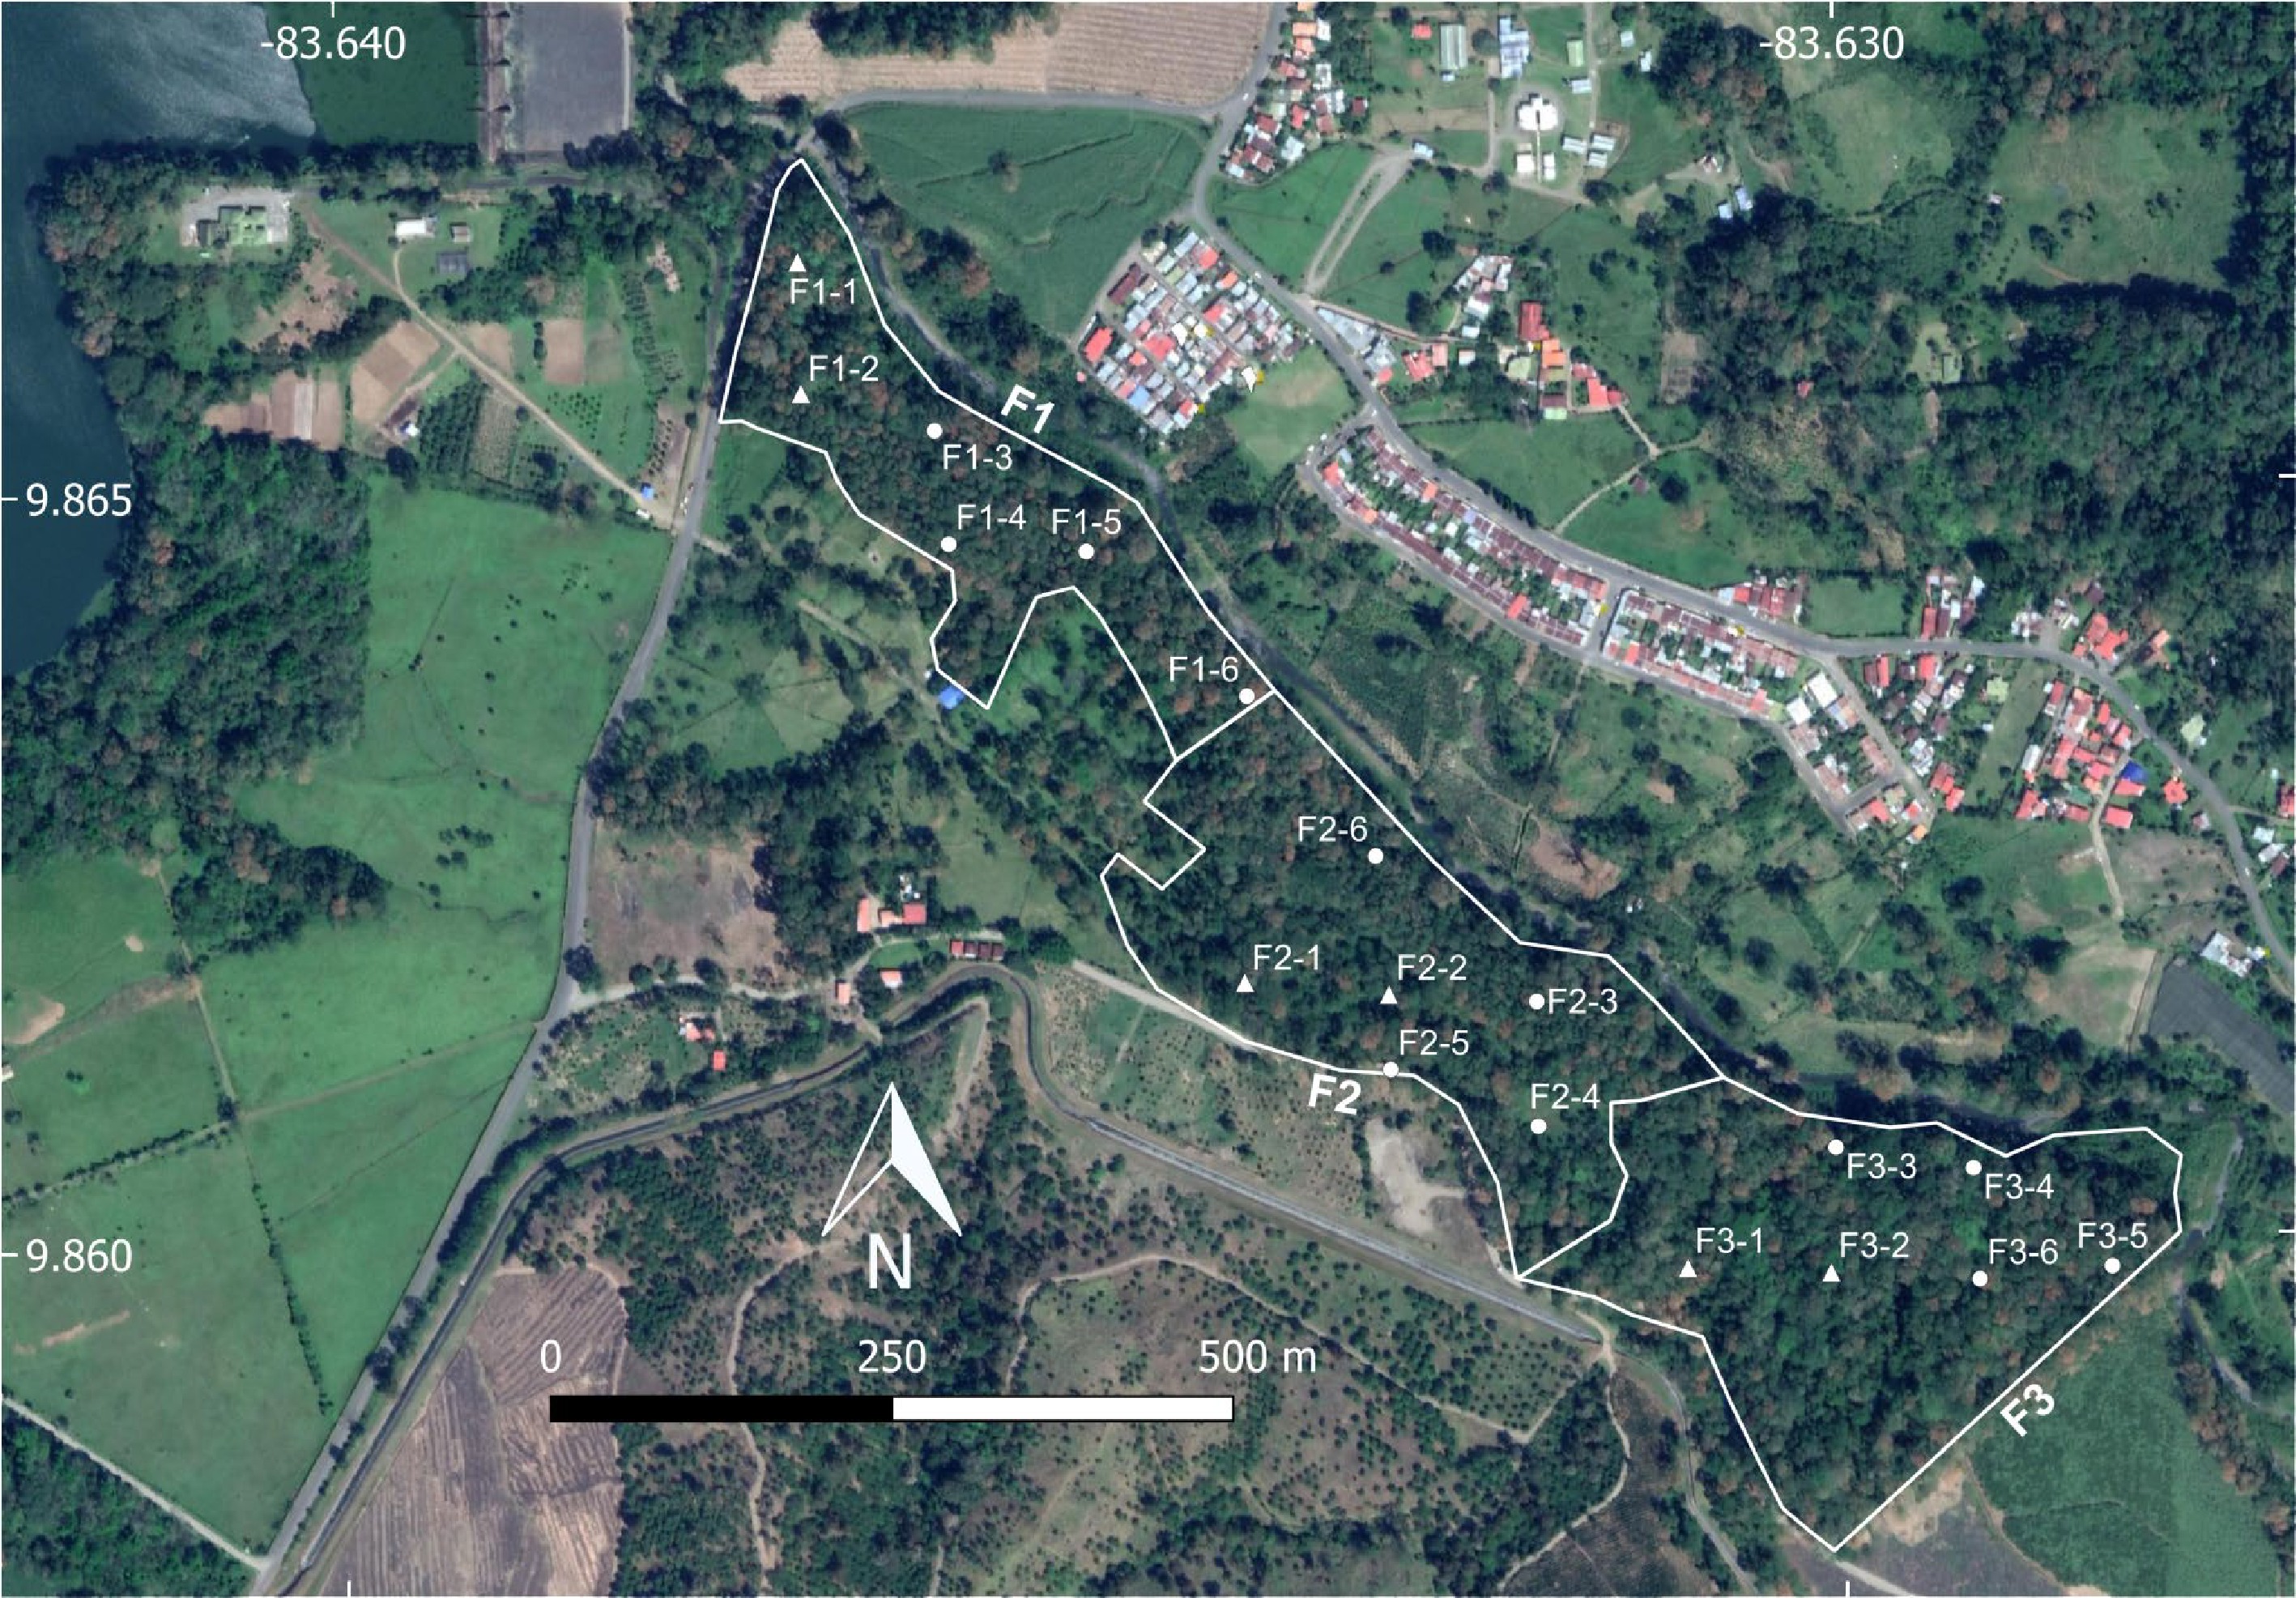
Figure 5.
Aerial view of the studied forested patch divided into the three sections mentioned in the section 'Materials and Methods' (F1, F2 and F3) showing the 18 collection locations used during the first year of study (triangles and circles) and the six used during the second year (triangles only) with their respective codes for identification. The rotation of locations carried out during the first year took place within each forest section.
In each one of the three forest sections, a series of six locations were randomly selected for a total of 18 locations in the complete forest patch. Two locations per forest section were surveyed monthly, for a total of six surveyed locations each month, during 24 months between February 2018 and January 2020. During each field trip, sporocarps of myxomycetes were surveyed by two or three people, for 20 min, in an area of about 1,000 m2 at each selected location. This strategy resulted in an effort of 120 min of field work each month, for a total effort of 48 h during the complete study. Surveyed substrates included coarse woody debris, leaf litter, twigs and living plants up to 1.5 m from the ground. Collected myxomycetes were deposited in the Myxogastrid Repository (INII) at the University of Costa Rica.
During the first year of study, a rotation of the surveyed locations within each forest section was established in such a manner that the same two locations visited on a given month, were revisited every three months for a total of four visits during the period. During the second year, the rotation system was not used and two neighboring locations, chosen randomly, were revisited every month, systematically (shown with triangles in Fig. 5). In this manner, the sampling location where sporocarps of myxomycetes were recorded, rotated within each forest section during the first year and was fixed during the second. This approach was used to evaluate the effect of the sampling strategy on the structure of the obtained datasets, aiming to provide empirical basis for long-term studies.
In each of the 18 locations, a series of functional variables of the forest were recorded and calculated, whenever appropriate, in units per hectare. These included a) tree density, b) tree diameter, c) distance between trees, d) total basal area, e) canopy height, f) canopy openness, g) biomass, and h) soil carbon. The methodology used for these determinations is explained in detail by Quesada-Chacón et al.[14]. This strategy was used to evaluate the effect of functional characteristics of the system where sporocarps were recorded from on ecological indicators associated with the sampling locations.
Statistical analyses
-
For analysis, myxomycete data from each of the 18 locations were pooled to create the profiles of species assemblages associated with the different sampling points. Similarly, data from each forest section were pooled. At each level, differences in the total number of records, number of species and both the Simpson and the Shannon diversity indices were evaluated between the sampling strategies used during the first and the second years. Diversity profiles were also compared with a t-test for numerical differences, with Hill numbers for structural differences, and with a Bray Curtis index of similarity for compositional differences. In the case of the first one, a cutoff value of 0.05 was used in the rejection of the null hypothesis. For the second analysis a q value = 0 is associated with species richness, q = 1 indicates the number of species with typical abundances, and q = 2 refers to the effective number of dominant species. The Bray-Curtis index oscillates between 0 and 1, with higher values indicating more similar communities.
Similarly, patterns in the pooled data associated with each location or forest section were evaluated using the measured functional variables by means of t-tests and ANOVAs for two or more than two group comparisons, respectively. For the latter, data corresponding with each year were considered different for the comparisons to take place at the same effort level. A Principal Components Analysis was also carried out with the forest variable data to summarize the variability in such dataset. This allowed further analyses to be associated with the most important variables discovered in the evaluations to assess a higher degree of complexity in the evaluations.
As a complementary strategy to generate empirical information on which of the two sampling methodologies would produce closer results to the full sampling effort, three simulations per year were created by randomly selecting studied locations and pooling the selected data. To compare the results between years, a standard effort of 480 min or 8 h of field work was used, equivalent to one third of the total field effort per year. As such, for the first year, six locations were selected for each simulation, whereas only two locations were selected for the second year. Comparisons of these simulations with the complete dataset for each year were carried out using the number of accumulated records and species, as well as both the Shannon's and Simpson's Diversity Indices. Final t-tests were used to compare diversity values between the simulated survey equivalent to one third of the yearly effort and the complete dataset for the respective year. The same method was repeated for a simulated effort of 720 h or 12 h, equivalent to one half of the total yearly effort in the case of each year.
This study was financed by project 570-B8-006 from Vicerrectoría de Investigación at the University of Costa Rica and partially conducted within the framework of an international research agreement between the two academic institutions represented by the authors. We would like to thank the valuable support of Shiori Nakajima from the Japanese International Cooperation Agency as well as Pedro Rojas and Werner Rodríguez from the University of Costa Rica.
-
The authors declare that they have no conflict of interest.
- Copyright: © 2022 by the author(s). Published by Maximum Academic Press, Fayetteville, GA. This article is an open access article distributed under Creative Commons Attribution License (CC BY 4.0), visit https://creativecommons.org/licenses/by/4.0/.
-
About this article
Cite this article
Rojas C, Rollins AW. 2022. The role of sampling methodology and site selection on myxomycete data from the Neotropics. Studies in Fungi 7:2 doi: 10.48130/SIF-2022-0002 

The role of sampling methodology and site selection on myxomycete data from the Neotropics
- Received: 03 December 2021
- Accepted: 21 May 2022
- Published online: 22 June 2022
Abstract: Myxomycete sporocarps are practical units that can be used to study the effect of environmental issues such as climate change, urbanization, and natural disasters on microorganisms. Recent scientific literature lacks empirical approaches to understand the impacts of sampling design and site selection on the data obtained in myxomycete field surveys. The present investigation was designed to generate useful data for the evaluation of methodological approaches. Myxomycetes were studied for two years in a tropical premontane wet forest in Costa Rica using two different sampling strategies and several collecting sites to evaluate potential differences in the results. Field collections were used to generate the dataset due to their usefulness for monitoring purposes. Sampling strategies had a smaller impact on the reported structure and composition of obtained species assemblages than site selection, but a combination of both clearly maximized the effort and provided the best results during the field surveys. Functional variables of the forest with direct influence on the myxomycete life cycle such as tree diameter and leaf litter depth impacted the results synergically. Simulations of surveys at two different levels of effort were compared with total yearly efforts and results showed that revisiting sampling sites maximized the field effort. Results demonstrated that the variability of sporocarp production in tropical forests should be considered in the design of long-term field experiments on myxomycetes.
-
Key words:
- Costa Rica /
- Ecology /
- Field survey /
- Myxogastrids /
- Slime molds