












-
Species interaction is one of the important determinants for biodiversity in natural communities, especially for coevolutionary interspecific interactions, which are suggested to shape much of the diversity on Earth[1]. For example, ectomycorrhizal fungal diversity was driven by diversification of host species[2]; asymmetric coevolution between plants and pollinators facilitates biodiversity maintenance[1]. Thus, understanding of coevolutionary interactions might be helpful to decipher the fundamental processes in generating and maintaining biodiversity[3].
Arbuscular mycorrhiza (AM) has been considered the oldest and most widespread symbiotic interaction in terrestrial ecosystems, in which arbuscular mycorrhizal fungi (AMF) form obligate mutualism with roots in > 80% of terrestrial flora[4]. In the mutualistic partnerships, fungi acquire photosynthetic carbon from their hosts in exchange for inorganic nutrients (e.g., phosphorus and nitrogen)[4,5]. AMF extensive hyphal networks can help plants extend the volume of soil resource capture. AMF can also provide some other benefits to plant hosts, e.g., increased tolerance towards adverse abiotic environments, as well as repelling herbivores or inhibiting nematodes and pathogens[6]. However, symbiotic benefits were dependent upon specific host-fungus compatibility, revealing that preferential partnerships drive functional outcomes[7]. AMF originated from the Ordovician and possibly had formed symbiosis with pre-vascular plants in the Devonian[8]. The findings of mycorrhizal associations with basal liverworts suggest that AM might be formed since the arrival of plants[9]. An experiment simulating high CO2 in the middle Paleozoic showed that AMF could promote growth and reproduction in basal liverworts[10], suggesting that AM symbiosis might have been an important driver of early plant terrestrialization. However, mycorrhizal responses of liverworts were reduced with a simulated Paleozoic CO2 decline, when vascular plants originated[11]. Achlorophyllous plants, another extreme end during plant evolution, rely entirely on AM symbiosis for carbon and nutrients[12]. Thus, AM symbionts might play key roles in plant evolution. However, less is known about how AMF coevolved with plants.
Some conserved mechanisms might have existed during the coevolution of AM symbiosis. For example, strigolactones, the AM fungal hyphal branching factor, were found in all the clades of green plants[13]. An AM fungus from the rhizosphere of the vascular plant Plantago could colonize the liverwort Pellia[14]. Similar AM structures were found between the basal liverworts and most vascular plants[15]. Homologs of three symbiosis-related genes have been traced to the last common ancestor of vascular plants and their vertically inherited descendants of land plants[16]. A mycorrhiza-specific phosphate transporter gene was also found to be conserved in phylogenetically distant plant species[17]. These conserved functional traits suggest that the evolutionary space might be strictly dictated by plants associating with some specific AMF phylotypes.
However, there might be some host-fungus preference for AM symbiosis. For example, some basal liverworts or myco-heterotrophytes were specialized to Glomus group A (currently defined as Glomeraceae). For vascular plants, carbon investment into AMF symbionts is proportional to their symbiotic efficiency, indicating host-mediated partner selection. The better fungal partners would transfer more nutrients (e.g., P or N) to their hosts in return for more carbohydrates through reciprocal rewarding strategies[18]. The host fungus preference was also frequently reported for fungal sporulation, host growth promotion, nutrient uptake, or resistance to herbivores and pathogens[19]. Such host-fungus preference might lead to community differentiation of fungal partners. A distinct AMF community was frequently reported for co-existing host partners at different plant taxonomic levels. For example, at the genotype level, the roots of different wheat cultivars harbored distinctive AMF symbionts[20]. At the congeneric species level, four Medicago species are associated with different AMF communities[21]. At the distant related species level, it is more common to find distinctive AMF composition in roots of co-existing host plants[22]. Subsequently, the preference between the host and a suite of fungal partners might affect the biodiversity of AMF at the ecosystem level[23].
We conducted a meta-analysis synthesizing evidence from 902 peer-reviewed articles and five databases to test the following hypotheses: (i) whether there is a phylogroup of AMF that is conserved and dominant in different plant phylogenetic lineages; if yes, to maintain the conservatism during evolution, we subsequently predicted that (ii) this suite of fungi has better symbiotic functioning than other AMF. Inspired by the reciprocal rewarding strategy, we further predicted that (iii) there is some mutual preference between members of such fungi and their host partners, and thus another hypothesis is derived; that (iv) this AMF phylogroup will have a greater species number than other phylogroups at the same taxonomic level.
-
Traditionally, AMF taxonomy was determined by spore traits (INVAM;
https://invam.wvu.edu/ ). However, increasing molecular studies suggested spore-based Glomus might be not a genus. The Glomus fungi was categorized into three clades (group A, B, and C) using molecular phylogenetics based on the SSU gene[24]. Recently, Glomus group A and B were defined as independent families, Glomeraceae and Claroideoglomeraceae, respectively. Glomus group C was merged into Diversisporaceae[25]. Here, we utilized the new taxonomy for subsequent analyses.Symbiotic conservatism during coevolution
-
We extracted all AMF small sub-unit (SSU) sequences and their host information from the MaarjAM database[26]. The internal transcribed spacer (ITS) sequences and their host information were retrieved from the dataset of Yang et al.[27] (also see Supplementary Data 1 and 2). The large subunit (LSU) sequences and their host information were collected from GenBank based on the dataset of Kivlin et al.[28] (see Supplementary Data 1 and 2).
AMF molecular taxa were defined with different methods for SSU, ITS, and LSU, respectively. For SSU sequences, we mapped sequences directly to Öpik et al.'s curated Virtual Taxa Database[26]. The ITS and LSU sequences were first aligned with Clustal X[29] and then manually edited in Genious Basic 5.0.3[30]. Fragments of 550 and 600 bp were maintained for ITS and LSU, respectively, for further analyses. OTUs (operational taxonomic units) were clustered from aligned sequences at 90% similarity for ITS and 95% for LSU regions[27]. We referred OTU from ITS and LSU as ITS-OTU0.10 and LSU-OTU0.05, respectively. The suffix was the cutoff value used for defining OTUs. The OTU assignment was performed with Mothur (v1.19.0)[31]. Representative sequence was selected for each VT, ITS-OTU0.10 and LSU-OTU0.05 with the 'get.oturep' command. Family-level taxonomy for Virtual Taxa (VT) representatives was assigned via BLAST queries against the MaarjAM database[26]. To confirm the family assignment of the representatives of ITS-OTU0.10 and LSU-OTU0.05, we constructed two Maximum Likelihood phylogenetic trees based on ITS-OTU0.10 and LSU-OTU0.05 representatives. Phylogenies were inferred using RAxML v7.0 under the 'GTRGAMMAI' model[32].
To test whether there is a conserved AMF phylogroup during coevolution, we first categorized host plants into eight phylogenetic groups: liverworts, hornworts, ferns, gymnosperms, photosynthetic monococyledons and dicotyledons, and non-photosynthetic monococyledons and dicotyledons (see Supplementary Data 1). Here, non-photosynthetic plants represent the myco-heterotrophytes. Each plant was treated as an independent sample in each host phylogenetic group. We then classified nine AMF phylogroups at the family level, including Glomeraceae, Acaulosporaceae, Claroideoglomeraceae, Diversisporaceae, Gigasporaceae, Archaeospoaceae, Paraglomeraceae, Ambisporaceae, and Pacisporaceae[33]. The proportion (%) of VT numbers in each AMF family was calculated for each sample (plant). The averaged proportion of each AMF family was defined as its occurrence in one host phylogenetic group. In addition, we further evaluated the proportion of each AMF family in the roots of their host partners with the data of VT (from 189 host species), ITS-OTU0.10 (from 78 host species), and LSU-OTU0.05 (from 42 host species), respectively.
Meta-analysis
-
To test the prediction of better symbiotic functioning of Glomeraceae, we synthesized a meta-analysis to evaluate the difference in symbiotic function between Glomeraceae and non-Glomeraceae taxa. We constructed a comprehensive dataset by compiling the literature. First, we retrieved journal papers by conducting searches on 10 May 2012 in Web of Science (
https://webofscience.clarivate.cn/wos ) and Google Scholar (https://scholar.google.com.hk ) utilizing the key terms without restriction for publication years: '(biomass OR phosphorus OR nitrogen) AND (arbuscular AND mycorrhiza*) AND (Glomus OR Acaulospora OR Gigaspora OR Scutellospora OR Diversispora OR Paraglomus OR Archaeospora)'. Publication year was not restricted for such searches. Finally, Chinese articles were collected from the CNKI database (www.cnki.net ) with the searching term 'mycorrhiza* AND biomass'. In total, these searches produced 4,325 articles.We then set the following criteria of inclusion for literature that satisfied our meta-analysis: (I) the article must contain ≥ 1 trials with pairwise comparisons of AMF-inoculated plants (experimental) vs non-inoculated controls. The control treatment was defined as host plants grown without AMF inoculation, while the experimental treatment was defined as plants grown in the presence of AMF. (II) Employ AMF isolates identified to the species level. (III) Exclude mixed-AMF treatments to preclude confounding effects. (IV) Omit fungicide applications due to incomplete AMF suppression (e.g., benomyl). (V) Report host metrics: shoot biomass (g·plant−1), N/P uptake, pathogen resistance, and reproductive data. In total, 902 publications met these criteria (see Supplementary Data 3−8). From these, trial-level data were extracted with additional rules: (I) Each publication constituted an independent statistical replicate, even for recurrent plant/AMF species. (II) Stress gradient endpoints (lowest vs highest treatment levels) were exclusively sampled to quantify threshold responses. (III) Each unique AMF-plant pair is treated as a distinct trial for multiple AMF-plant species pairs in one article[34]. (IV) For temporal experiments, AMF–plant pairs were evaluated exclusively at the terminal sampling point. (V) Identical AMF-plant species pairs at distinct geographic locations were treated as independent replicated trials. (VI) Trials retaining biological isolation of AMF effects were exclusively selected: treatments featuring AMF inoculation without soil microbiota co-treatments (e.g., rhizobia or Pseudomonas spp.). The literature selection was shown through a PRISMA flow diagram in Supplementary Fig. S1.
Mycorrhizal functioning was defined by the following two aspects. The first is the benefits provided by AMF to host plants, including growth promotion (e.g., biomass, N and P uptake), the tolerance towards abiotic and biotic stress (growth under stress conditions), and resistance to biotic stress (e.g., inhibition of nematodes and pathogens). The other is the benefits provided by host plants to AMF, i.e., carbon allocation. In order to present such symbiotic functioning more clearly, we categorized the experimental contexts into three types: no stress, abiotic stress, and biotic stress, as well as two substrate types: high- and low-sand content. If the source reference did not mention any stress treatments, we tacitly defined it as no stress. Abiotic stresses included drought, salt-alkaline, heavy metals, low pH, alkaline, low temperature, high temperature, shade, nutrient deficiency, anoxia, chemical pollution, and soil compaction, etc. Biotic stresses included herbivores, nematodes, and pathogens, etc. Sand content was calculated based on the reported sand:soil proportion. If no information was provided, it is classified as no sand addition. The proportion of sand addition ≥ 50% was defined as high sand, and < 50% as low sand.
To test the benefits of AMF to plants, we used biomass, P, and N content as predictors under no stress and abiotic stress. Under biotic stress, the performance of the plant, stressor, and mycorrhiza were utilized as predictors. Herein, plant performance was defined as biomass response to AMF under biotic stress, which could reflect AMF-mediated tolerance to biotic stress. Stressor performance was defined as a growth or reproduction response to AMF, which could reflect the resistance of host plants assisted by AMF. Herbivore performance was quantified using larval mass, fecundity (eggs laid per female), or survival rate. Nematode impact was assessed via root gall density (gall·g−1 root), egg density (eggs·g−1 root), or soil population density (individuals·cm−3 soil). Pathogen virulence was evaluated by necrosis incidence (%) or vascular discoloration severity (lesion length/area). Mycorrhiza performance was defined as the variation of colonization intensity with or without biotic stress, which could reflect the costs of AMF when they help plants to resist biotic stress. In addition, in order to test the benefits from plants to AMF, we used root colonization intensity to reflect the carbon allocation from host plants under no stress or abiotic stress. Root colonization intensity could positively reflect the biomass of AMF hyphae in roots. As is known, C biomass of AMF is completely from host plants; thus, the colonization intensity could indirectly reflect C allocation in host plants.
For all plant response variables (biomass, N/P uptake, etc.), we extracted mean values with associated dispersion metrics (SD, SE) and sample sizes (n). Digitizing of graphical data employed GetData (Graph Digitizer®,v2.26;
https://getdata-graph-digitizer.com ). When SDs were missing, we estimated them with the method of van Groenigen et al.[35]. We calculated the average coefficient of variation (CV) for each dataset, and then approximated the missing SD by multiplying the reported mean by the average CV and squaring it (see Supplementary Data 3−8).For each pair of prediction variables, we calculated Hedge's d as a metric of effect size. Hedge's d is an estimate of the standardized mean differences that is not biased by small sample sizes. In our dataset, the value was shown as zeros for plant growth-related variables; thus, Hedge's d is the most appropriate metric for effect size. From each pair of mean values (
$ \overline{X} $ $ d=\dfrac{({\overline{X}}^{E}-{\overline{X}}^{C})}{S}J $ where,
$ {\overline{X}}^{E} $ $ {\overline{X}}^{C} $ $ J=1-\dfrac{3}{4({N}^{C}+{N}^{E}-2)-1} $ The variance of Hedge's d, V(d) was calculated as[36]:
$ V(d)=\dfrac{{N}^{C}+{N}^{E}}{{N}^{C}{N}^{E}}+\dfrac{{d}^{2}}{2({N}^{C}+{N}^{E})} $ Zero d values signified no difference between control and experimental trials. Positive and negative d values suggested beneficial and detrimental effects of AMF on host plants, respectively.
All meta-analytical computations were executed in MetaWin 2.0[36] using random-effects frameworks[36]. Weighted mean effect size (Hedges' d+) and the 95% correspondence interval (CI) of d+ were calculated for each prediction variable. The statistical significance of d+ was evaluated through whether 95% CI overlapped zero with 9,999 iterations[36]. Category comparisons were examined by prandom associated to Qbetween statistics (Qb). We also tested whether the total heterogeneity (Qtotal; Qt) and the remaining within-group heterogeneity (Qwithin; Qw) were significant using a chi-squared test. One of the presumptions of meta-analysis is that trials are independent from each other[37]. However, like other meta-analysis studies, multiple trials from a single publication were included, which acknowledges potential non-independence due to shared methodologies or study contexts. In order to confirm whether such independence would affect our conclusions, we referred to the method of Vilà et al.[38] and constructed reduced datasets by randomly selecting one effect size per literature to run the analysis. Subsequently, we compared the effect size of reduced datasets with the whole datasets, based on 95% CIs. If no difference was found for the effect size of both datasets, it suggests that such independence would not exert influence on the final conclusions. A sensitivity analysis comparing three constrained biomass datasets (non-stressed plants, biotic stress, and abiotic stress) confirmed result stability: mean effect sizes and 95% CIs remained congruent with full-study data (data not shown). All data were therefore retained for final analyses.
In addition, public biases might also exert some adverse effect on conclusions in meta-analytical studies. Publication bias was assessed by examining the relationship between standardized effect sizes of raw data and sample size for all datasets. We found some slight publication biases for some of our datasets, including biomass and N uptake under no stress, as well as biomass, P and N uptake under abiotic stress (Spearman r = −0.035, p < 0.01 for biomass under no stress; Spearman r = 0.02, p < 0.01 for N uptake under no stress; Spearman r = −0.10, p < 0.01 for biomass under abiotic stress; Spearman r = 0.02, p < 0.01 for P uptake under abiotic stress; Spearman r = 0.03, p < 0.01 for N uptake under abiotic stress). The other datasets showed no relationship between standardized effect sizes and sample size, including P uptake under no stress, and three response variables under biotic stress (Spearman r = 0.06, p > 0.05 for P uptake under no stress; Spearman r = −0.06, p > 0.05 for plant performance under biotic stress; Spearman r = −0.02, p > 0.05 for stressor performance under biotic stress; Spearman r = 0.03, p > 0.05 for mycorrhiza performance under biotic stress). This suggested that there was no publication bias for these datasets.
For datasets exhibiting slight publication biases, we computed Rosenthal's fail-safe number—the hypothetical count of unpublished null-result studies required to reduce the aggregated effect size to non-significance. For the datasets with, we further estimated the fail-safe number. Fail-safe number is the number of studies that would be added to change the results of the meta-analysis from significant to non-significant[36]. The confidence of the results would be evaluated by comparing the fail-safe number with 5N + 10, where N is the total number of trials in the dataset. If the fail-safe number is greater than 5N + 10, it is suggested that publication bias would not affect the overall conclusions. The fail-safe numbers were much larger than 5N + 10 for all the above-mentioned five datasets: the fail-safe numbers were 466,521 and 64,487.5, while the values of 5N + 10 were 11,051 and 1,040 for biomass, and N uptake at no stress, respectively; the fail-safe numbers were 2,201,888.6, 93,904.7, and 19,422.7, while the values of 5N + 10 were 5,610, 1,175, and 525 for biomass, P, and N content under abiotic stress, respectively. Consequently, although minor publication biases were detected, fail-safe numbers indicate that biological interpretations remain unaffected.
For the benefits from host to AMF, root colonization intensity was used to reflect C allocation from host partners. Here, we conducted a data synthesis by collecting mycorrhizal root colonization data from articles under no stress and abiotic stress (see Supplementary Data 9). We compared the difference in root colonization intensity between Glomeraceae and non-Glomeraceae under no stress and abiotic stress. Normality was tested for both datasets with the one-sample Kolmogorov-Smirnov method (p = 0.24 for no stress, and p = 0.04 for abiotic stress). Data were distributed normally at no stress, thus, we used one-way ANOVA to compare the difference between Glomeraceae and non-Glomeraceae. However, the distribution of data was not normal for abiotic stress. We compared the difference between Glomeraceae and non-Glomeraceae with the following method: the 95% CIs of means for root colonization intensity were calculated for Glomeraceae and non-Glomeraceae with the following equation: 95% CI = 1.96 × SE. If no overlap of 95% CIs was found between Glomeraceae and non-Glomeraceae, it suggested that a significant difference existed between both AMF categories.
Host-fungus preference during coevolution
-
Based on the results of the above section, we subsequently analyzed the host-fungus preference during coevolution with Glomeraceae taxa. We first calculated the host range to reflect such a preference. Host range was defined as the occurrence of AMF across host plants, which was defined as follows:
$ \mathrm{Host\;range=} \mathit{N} _{ \mathrm{i}} \mathrm{/} \mathit{N} \times 100{\text{%}} $ where, Ni represents the total number of AMF taxa that were found in i host(s). For example, when i = 1, it means the total number of AMF taxa that only occur in one plant in the test dataset; while when i = 2, it means the total number of AMF taxa that are shared by two host plants in the test dataset, and so forth. N is the total number of AMF taxa in the test datasets. We assessed the host range of Glomeraceae taxa with the VT, ITS-OTU0.10, and the LSU-OTU0.05 datasets, respectively.
To test how Glomeraceae communities coevolve with host plants, we evaluated the relationship between pair-wise unifrac distance of Glomeraceae communities and pair-wise host genetic distance. The VT dataset was used for this analysis. The genetic distance reflects the phylogenetic relationship between host plants. Unifrac distance indicates the phylogenetic relationship between Glomeraceae communities. Two-tailed Pearson's correlation analysis and step-wise linear regression analysis were used to elucidate the relationship between the genetic distance of host partners and unifrac distance of Glomeraceae partners. These analyses were performed under SPSS 16.0 (SPSS Inc., USA).
Pair-wise genetic distance between host plants was calculated from the rbcL gene with the Kimmura-2-Parameter model implemented in the dnadist program in the Phylip package. The host dataset of VTs (189 species) was used to perform this analysis. rbcL is one of the most popular marker genes in plant phylogenetic studies. We retrieved rbcL sequences of each host species when it was available in GenBank. If not available, we used the rbcL sequences available for plant species in the same genus or the same family for institution (see Supplementary Data 1).
Unifrac distance represented the proportion of branch lengths on the phylogenetic tree exclusive to microbial communities associated with a single-host plant species[39]. This metric can reflect differences in the phylogenetic lineages associated with the roots of one host partner vs the others. Unifrac distance was calculated with the online tool Fast UniFrac based on phylogenetic information. The phylogenetic tree for calculating unifrac distance was constructed with the following procedure. First, a maximum likelihood phylogenetic tree was constructed with the representative VT sequences. This was performed in RAxML v7.0 with the 'GTRCAT_GAMMA' model. Then, the redundant sequence identifiers belonging to each VT were reinserted into this unique phylogenetic tree with the 'deunique.tree' command in Mothur v1.19.0.
AMF diversification
-
Diversification generates species diversity, including speciation and extinction. We used four marker genes to estimate the diversification rate of different AMF lineages at the family level. These markers included three non-coding (SSU, ITS, and LSU) and one coding (β-tubulin) gene. We retrieved 44 and 36 differently named AMF species for SSU and ITS sequences from GenBank, respectively. We also collected 50 and 49 differently named AMF species sequenced with LSU[40] and β-tubulin genes[41], respectively (see Supplementary Data 10).
In order to estimate the divergence time of different AMF lineages, we first constructed Maximum Likelihood trees with the 'GTRCAT_GAMMA' model with 1,000 bootstrap replications with SSU, ITS, LSU, and β-tubulin sequences, respectively. The DNA sequences of SSU, ITS, LSU, and β-tubulin of Mortierella verticillata were used as an outgroup when constructing each phylogenetic tree (see Supplementary Data 10). These trees were constructed under RAxML v7.0[32]. A relaxed molecular clock with Penalized Likelihood (PL) analysis was used to estimate the divergence time under the following calibration points: (1) a constraint of 590–600 MYA for the root of the tree (the split between Mortierella verticillata and Glomeromycota)[8]; (2) a minimum of 460 MYA for the age of crown node for Glomeromycota[8]; and (3) a minimum of 240 MYA for the crown node of Gigasporaceae[42]. The PL analysis was performed in r8s[43]. Analyses were implemented with the Truncated-Newton optimization algorithm and optimal rate-smoothing parameter (1.5e6 for SSU, 2.1e7 for ITS, 2.8e6 for LSU, and 2.0e5 for β-tubulin). The optimal smoothing parameters were determined by the cross-validation method in r8s[44]. In addition, the ages of the stem group and crown group were estimated for each phylogenetic tree, respectively.
Diversification rate was estimated with the method-of-moments estimator[44]. Here, we only estimated the diversification rate of the stem group. We did not estimate the crown diversification rate because our datasets did not include all AMF species. In theory, this might bias the estimation of the diversification rate. However, our datasets included all AMF genera; thus, it was feasible to estimate the diversification rate of the stem group. The diversification rate (r) was calculated with the following equation:
$ r=\dfrac{1}{t}\log [n(1-\varepsilon )+\varepsilon ] $ where, ε is the relative extinction rate, which is the ratio of speciation/extinction. According to Magallon & Sanderson[44], we bracketed this metric with 0.9 as the upper limit and 0 as the lower limit. The ε = 0 indicates no extinction, and the diversification rate equals speciation. t is the age of the stem group for each family, and n represents the number of species belonging to each family. For the diversification rate from the SSU gene, we used VT number from the MaarjAM database; similarly, the estimation of diversification rate with the ITS gene was based on the ITS-VT number[27]. Because LSU and β-tubulin were originally sequenced from AMF spores[40,41], we used species numbers counted from Index Fungorum to estimate the diversification rate of different AMF families based on both genes.
AMF diversity pattern
-
In order to evaluate AMF species richness in each family in natural conditions, we conducted surveys of the literature and public databases, respectively. AMF species richness data derived from both morphological (spore-based) and molecular (sequence-based) identification methods published in international journals were collected by searching Web of Science (
https://webofscience.clarivate.cn/wos/woscc/smart-search ) (Supplementary Data 11). The data of AMF species richness, collected by searching the CNKI database, were identified with spore traits and published in Chinese journals (www.cnki.net ) (see Supplementary Data 12). For the molecular diversity studies, we directly extracted the reported data of species richness defined with phylogenetics in the original literature (see Supplementary Data 11). In total, we collected 114 morphological and 92 molecular AMF diversity articles. The morphological studies included 58 international journal articles and 56 Chinese journal articles. The molecular studies included 63 publications with SSU genes, 16 with ITS genes, and 13 with LSU genes. We also searched the most popular databases and datasets used in AMF studies, including Index Fungorum (www.indexfungorum.org/names/Names.asp ), BEG (www.i-beg.eu ), INVAM (https://invam.wvu.edu ), MaarjAM (https://maarjam.botany.ut.ee/?action=about ), and ITS-VT[27]. Index Fungorum, BEG, and INVAM are databases storing AMF species information identified with spore traits. MaarjAM is a public database developed by Öpik et al.[26], and now mainly stores AMF molecular taxa based on SSU genes. ITS-VT is a dataset of AMF molecular taxa defined with ITS sequences. For publication surveys, each literature was treated as an independent sample. The species richness pattern was exhibited as the proportion of AMF taxa in each family to the total number in one study. For the survey of the database/dataset, the proportion of AMF taxa in each family to total number in one storage location was defined as another indicator of general AMF species richness patterns under natural conditions. -
With regard to the conservatism of AMF-host coevolution, the number of Glomeraceae taxa accounted for over 60% in different plant phylogenetic groups, except for hornworts (8.33%) (Fig. 1a). The proportion of Glomeraceae was 100% for ferns and non-photosynthetic monocotyledons (Fig. 1a). SSU-VT data showed that AMF taxa in plant roots averaged 83.96% belonged to Glomeraceae (Fig. 1b). ITS and LSU data further confirmed this high proportion. ITS-OTU0.10 averaged 82.19% in Glomeraceae, while LSU-OTU0.05 showed the proportion as high as 98.07% (Supplementary Fig. S2a, S2b).
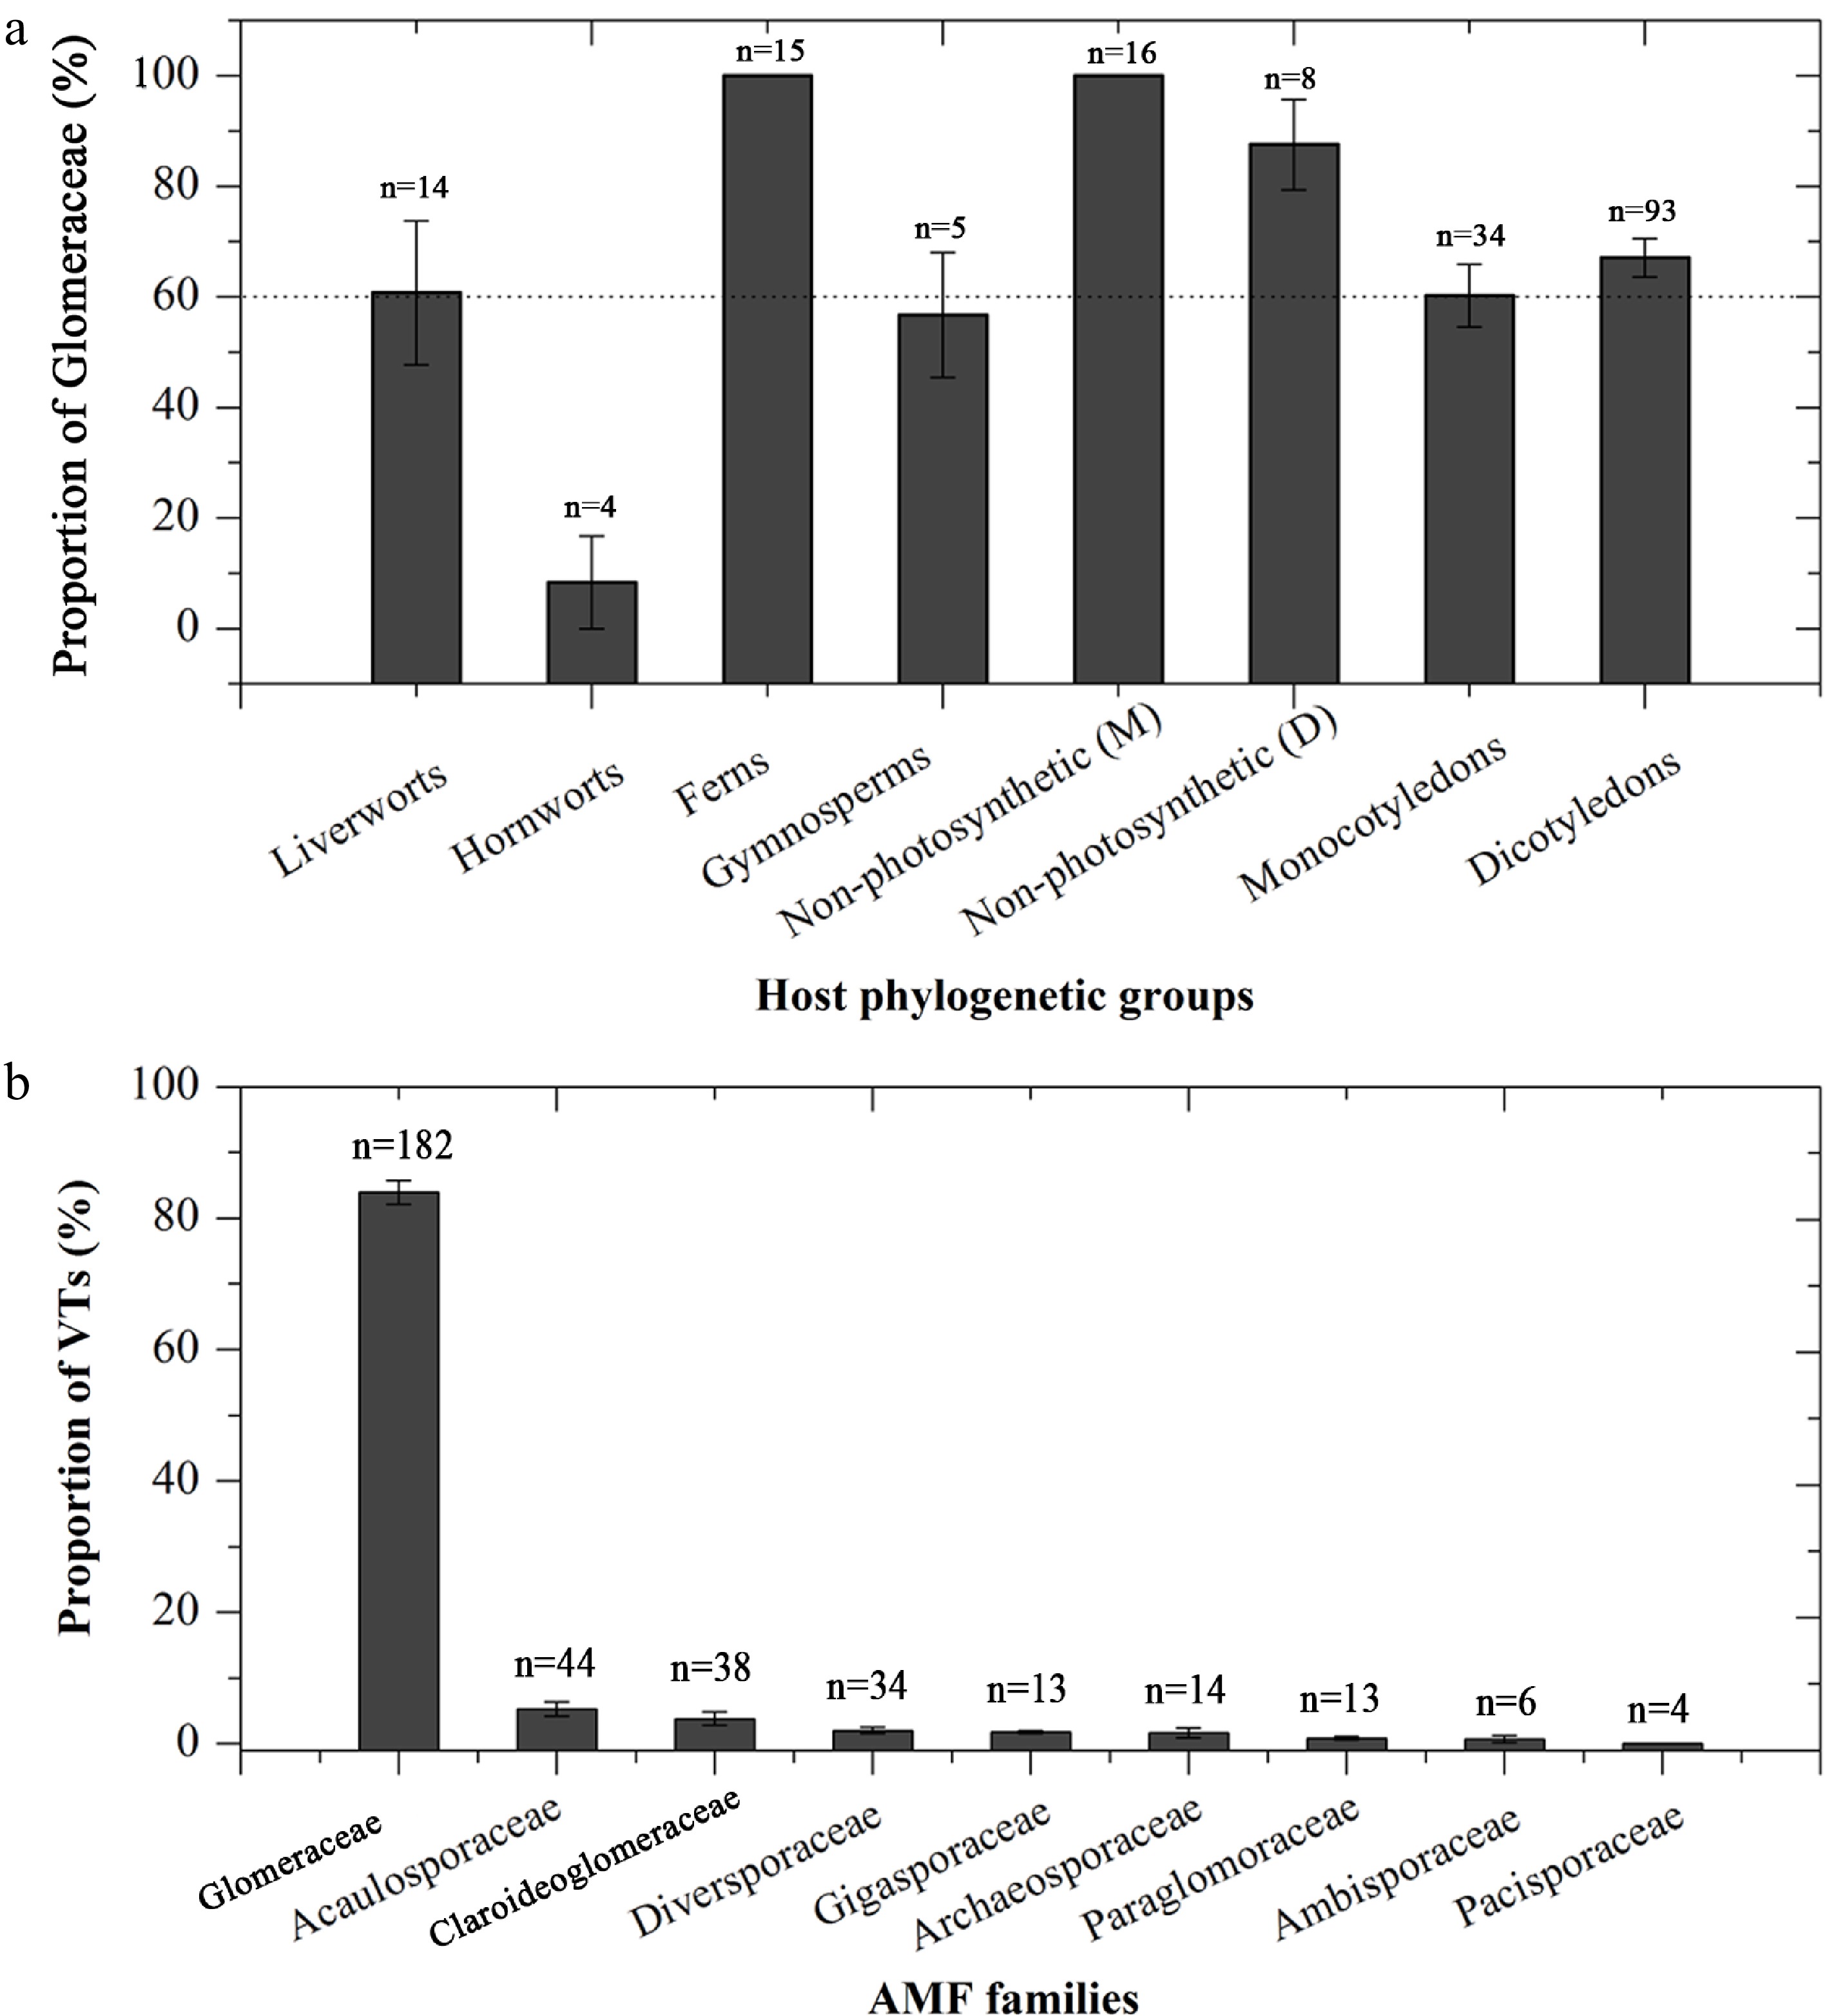
Figure 1.
(a) The conservatism of Glomeraceae among different plant phylogenetic groups, and (b) the average proportion of virtual taxa (VT) at different AMF families in roots from 188 plant species based on the MaarjAM database. Data are presented as mean ± SE.
A difference in functioning was shown between Glomeraceae and non-Glomeraceae (Figs 2, 3; Supplementary Table S1). Both Glomeraceae and non-Glomeraceae significantly enhanced plant growth and promoted P and N uptake under non-stress conditions (Fig. 2a). Glomeraceae showed better performance than non-Glomeraceae in plant growth promotion as well as P and N uptake (Qb = 109.47, prandom < 0.01 for biomass; Qb = 12.20, prandom < 0.01 for P uptake; Qb = 5.96, prandom < 0.05 for N uptake) (Fig. 2a). Under abiotic stress, both Glomeraceae and non-Glomeraceae significantly promoted plant growth and P uptake. However, significance was found for Glomeraceae but not for non-Glomeraceae for N uptake (Fig. 1a). Glomeraceae showed stronger symbiotic functioning than non-Glomeraceae in promotion of plant growth and nutrient uptake under abiotic stress (Qb = 33.77, prandom < 0.01 for biomass; Qb = 8.30, prandom < 0.01 for P uptake; Qb = 24.09, prandom < 0.01 for N uptake) (Fig. 4a). Meanwhile, Glomeraceae showed higher root colonization intensity than non-Glomeraceae under no stress, and abiotic stress (p < 0.01) (Fig. 2b). However, abiotic stress significantly decreased the root colonization intensity of Glomeraceae, but did not affect non-Glomeraceae (p < 0.01 for Glomeraceae; p > 0.05 for non-Glomeraceae) (Fig. 2b). In addition, the superiority of Glomeraceae still hold under different substrate conditions, particularly at soils with low sand content (Supplementary Fig. S3).
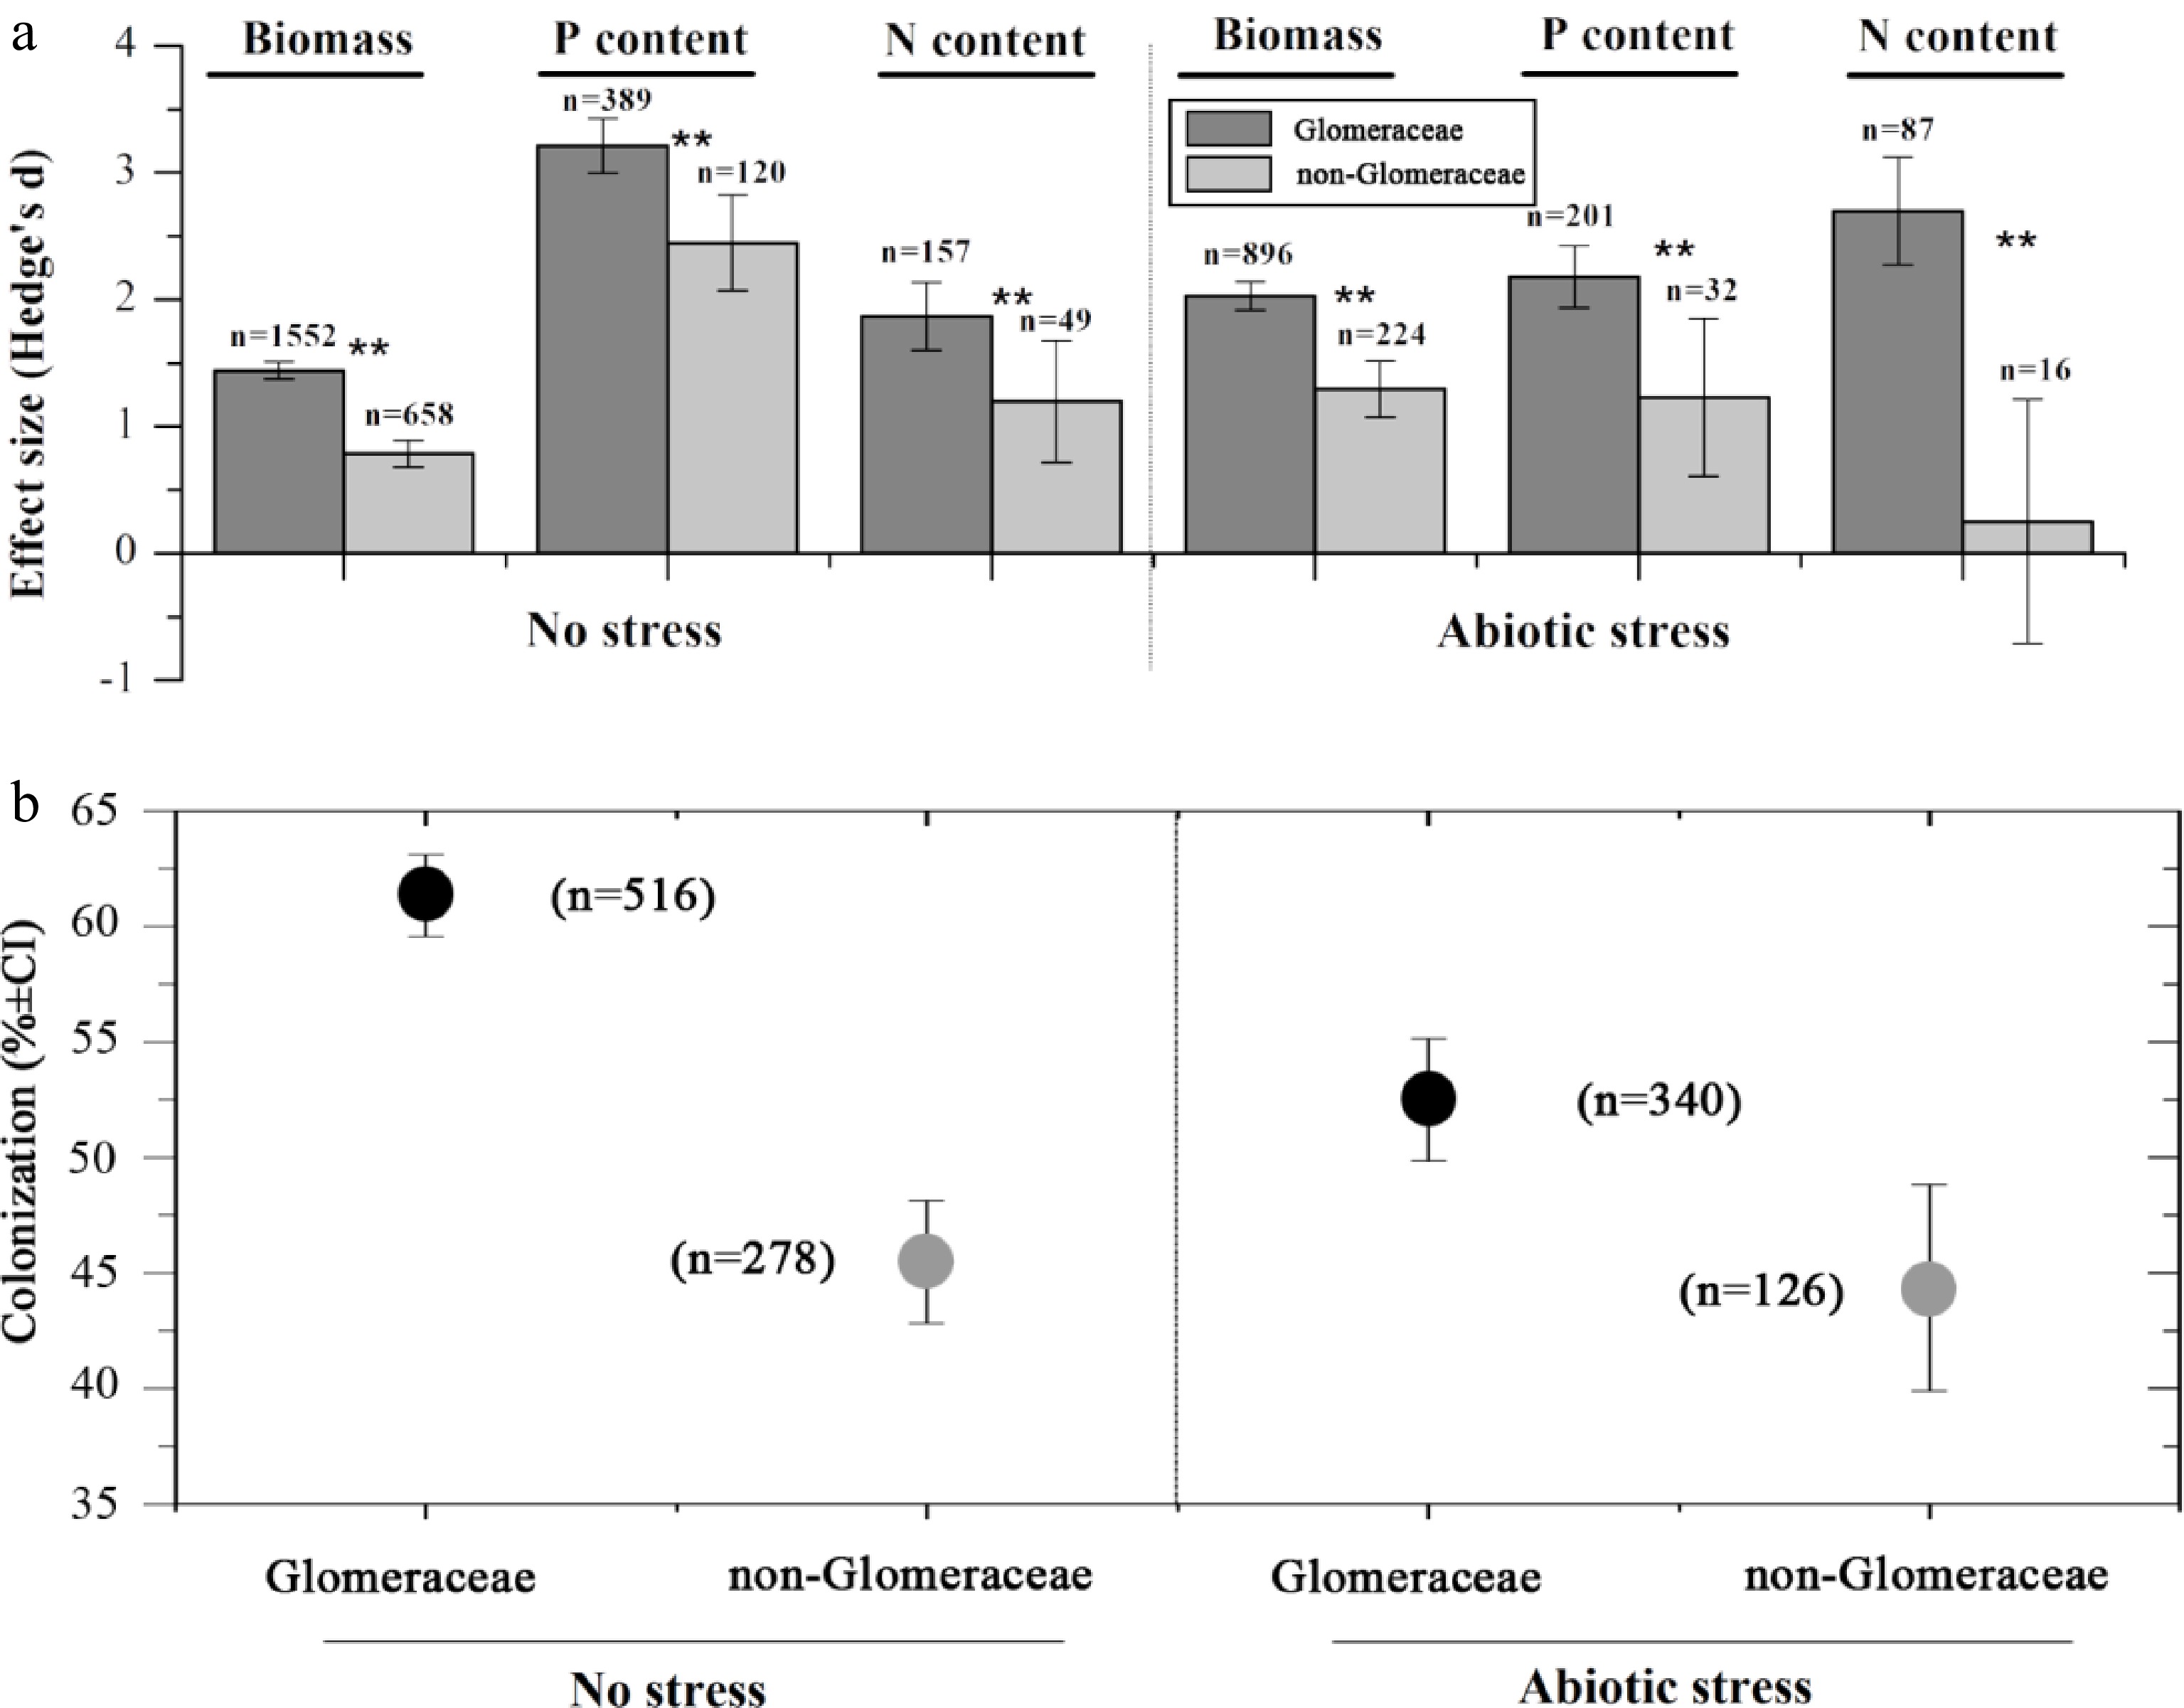
Figure 2.
Symbiotic functioning.
(a) Effects of Glomeraceae and non-Glomeraceae on biomass, P, and N content at no stress, and abiotic stress (Hedge's d ± 95% CI). (b) Colonization rate of Glomeraceae and Non-Glomeraceae at no stress, and abiotic stress (mean ± SE).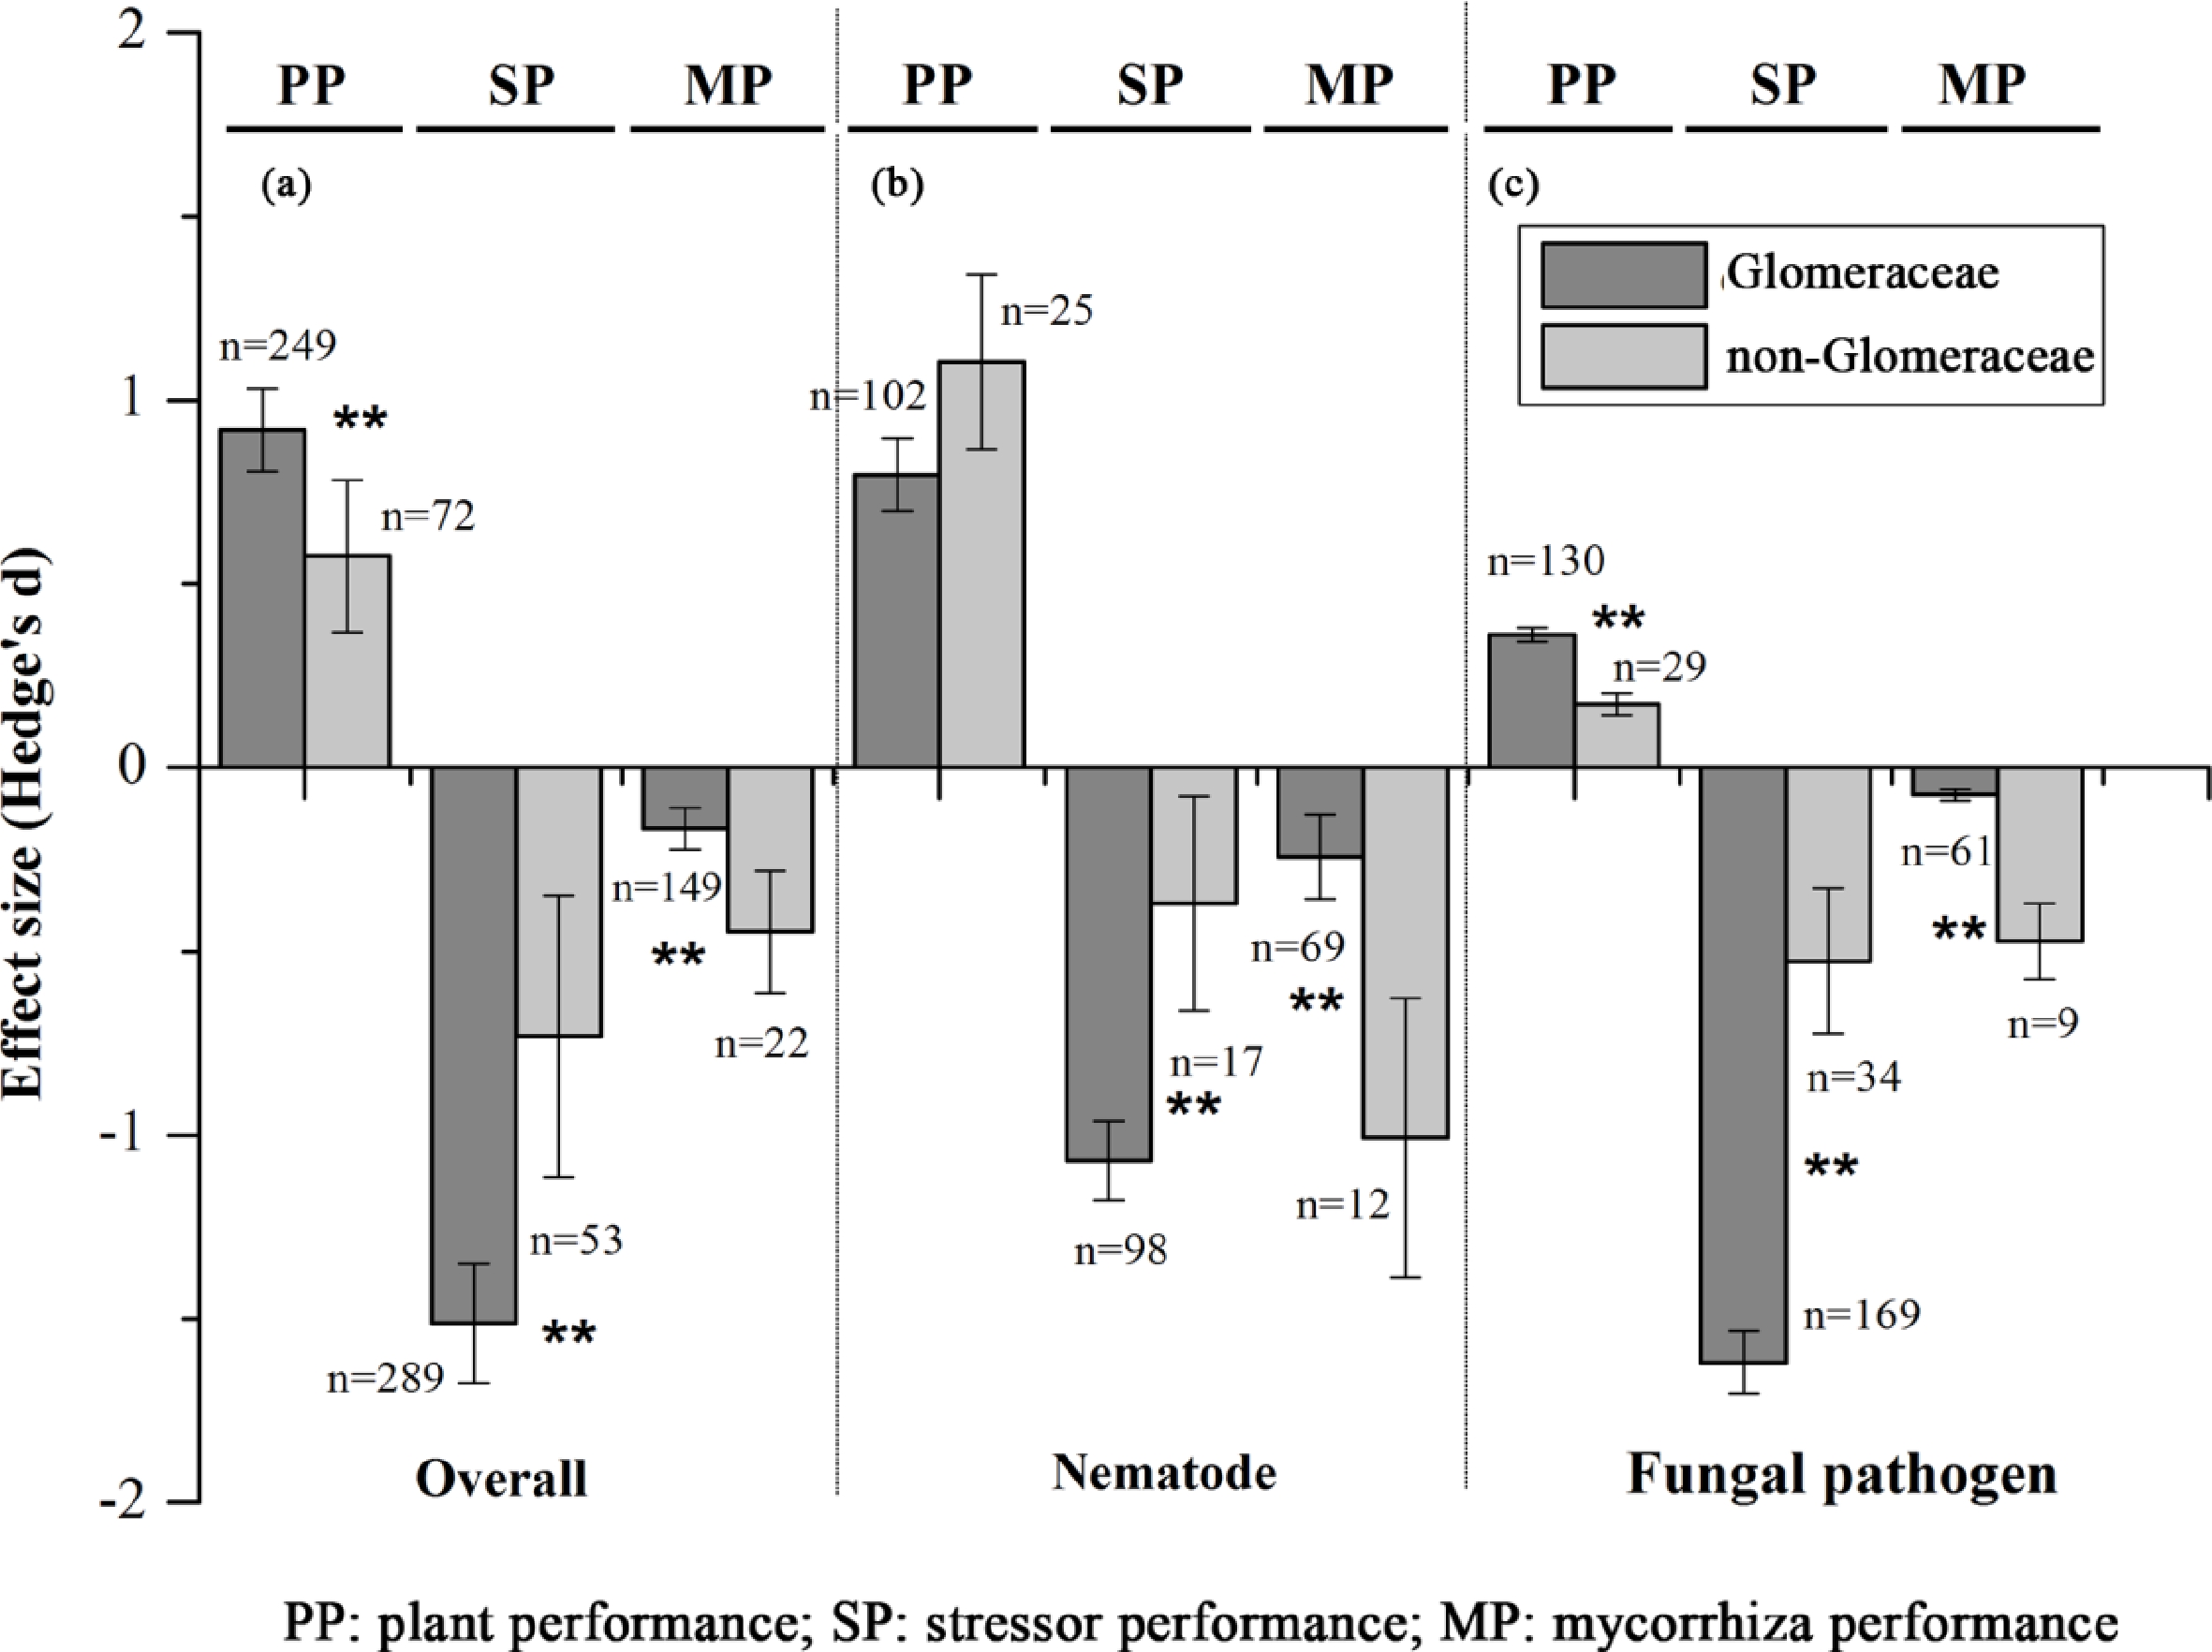
Figure 3.
Symbiotic functioning of Glomeraceae and non-Glomeraceae at biotic stress.
(a) Overall. (b) Nematode. (c) Fungal pathogen.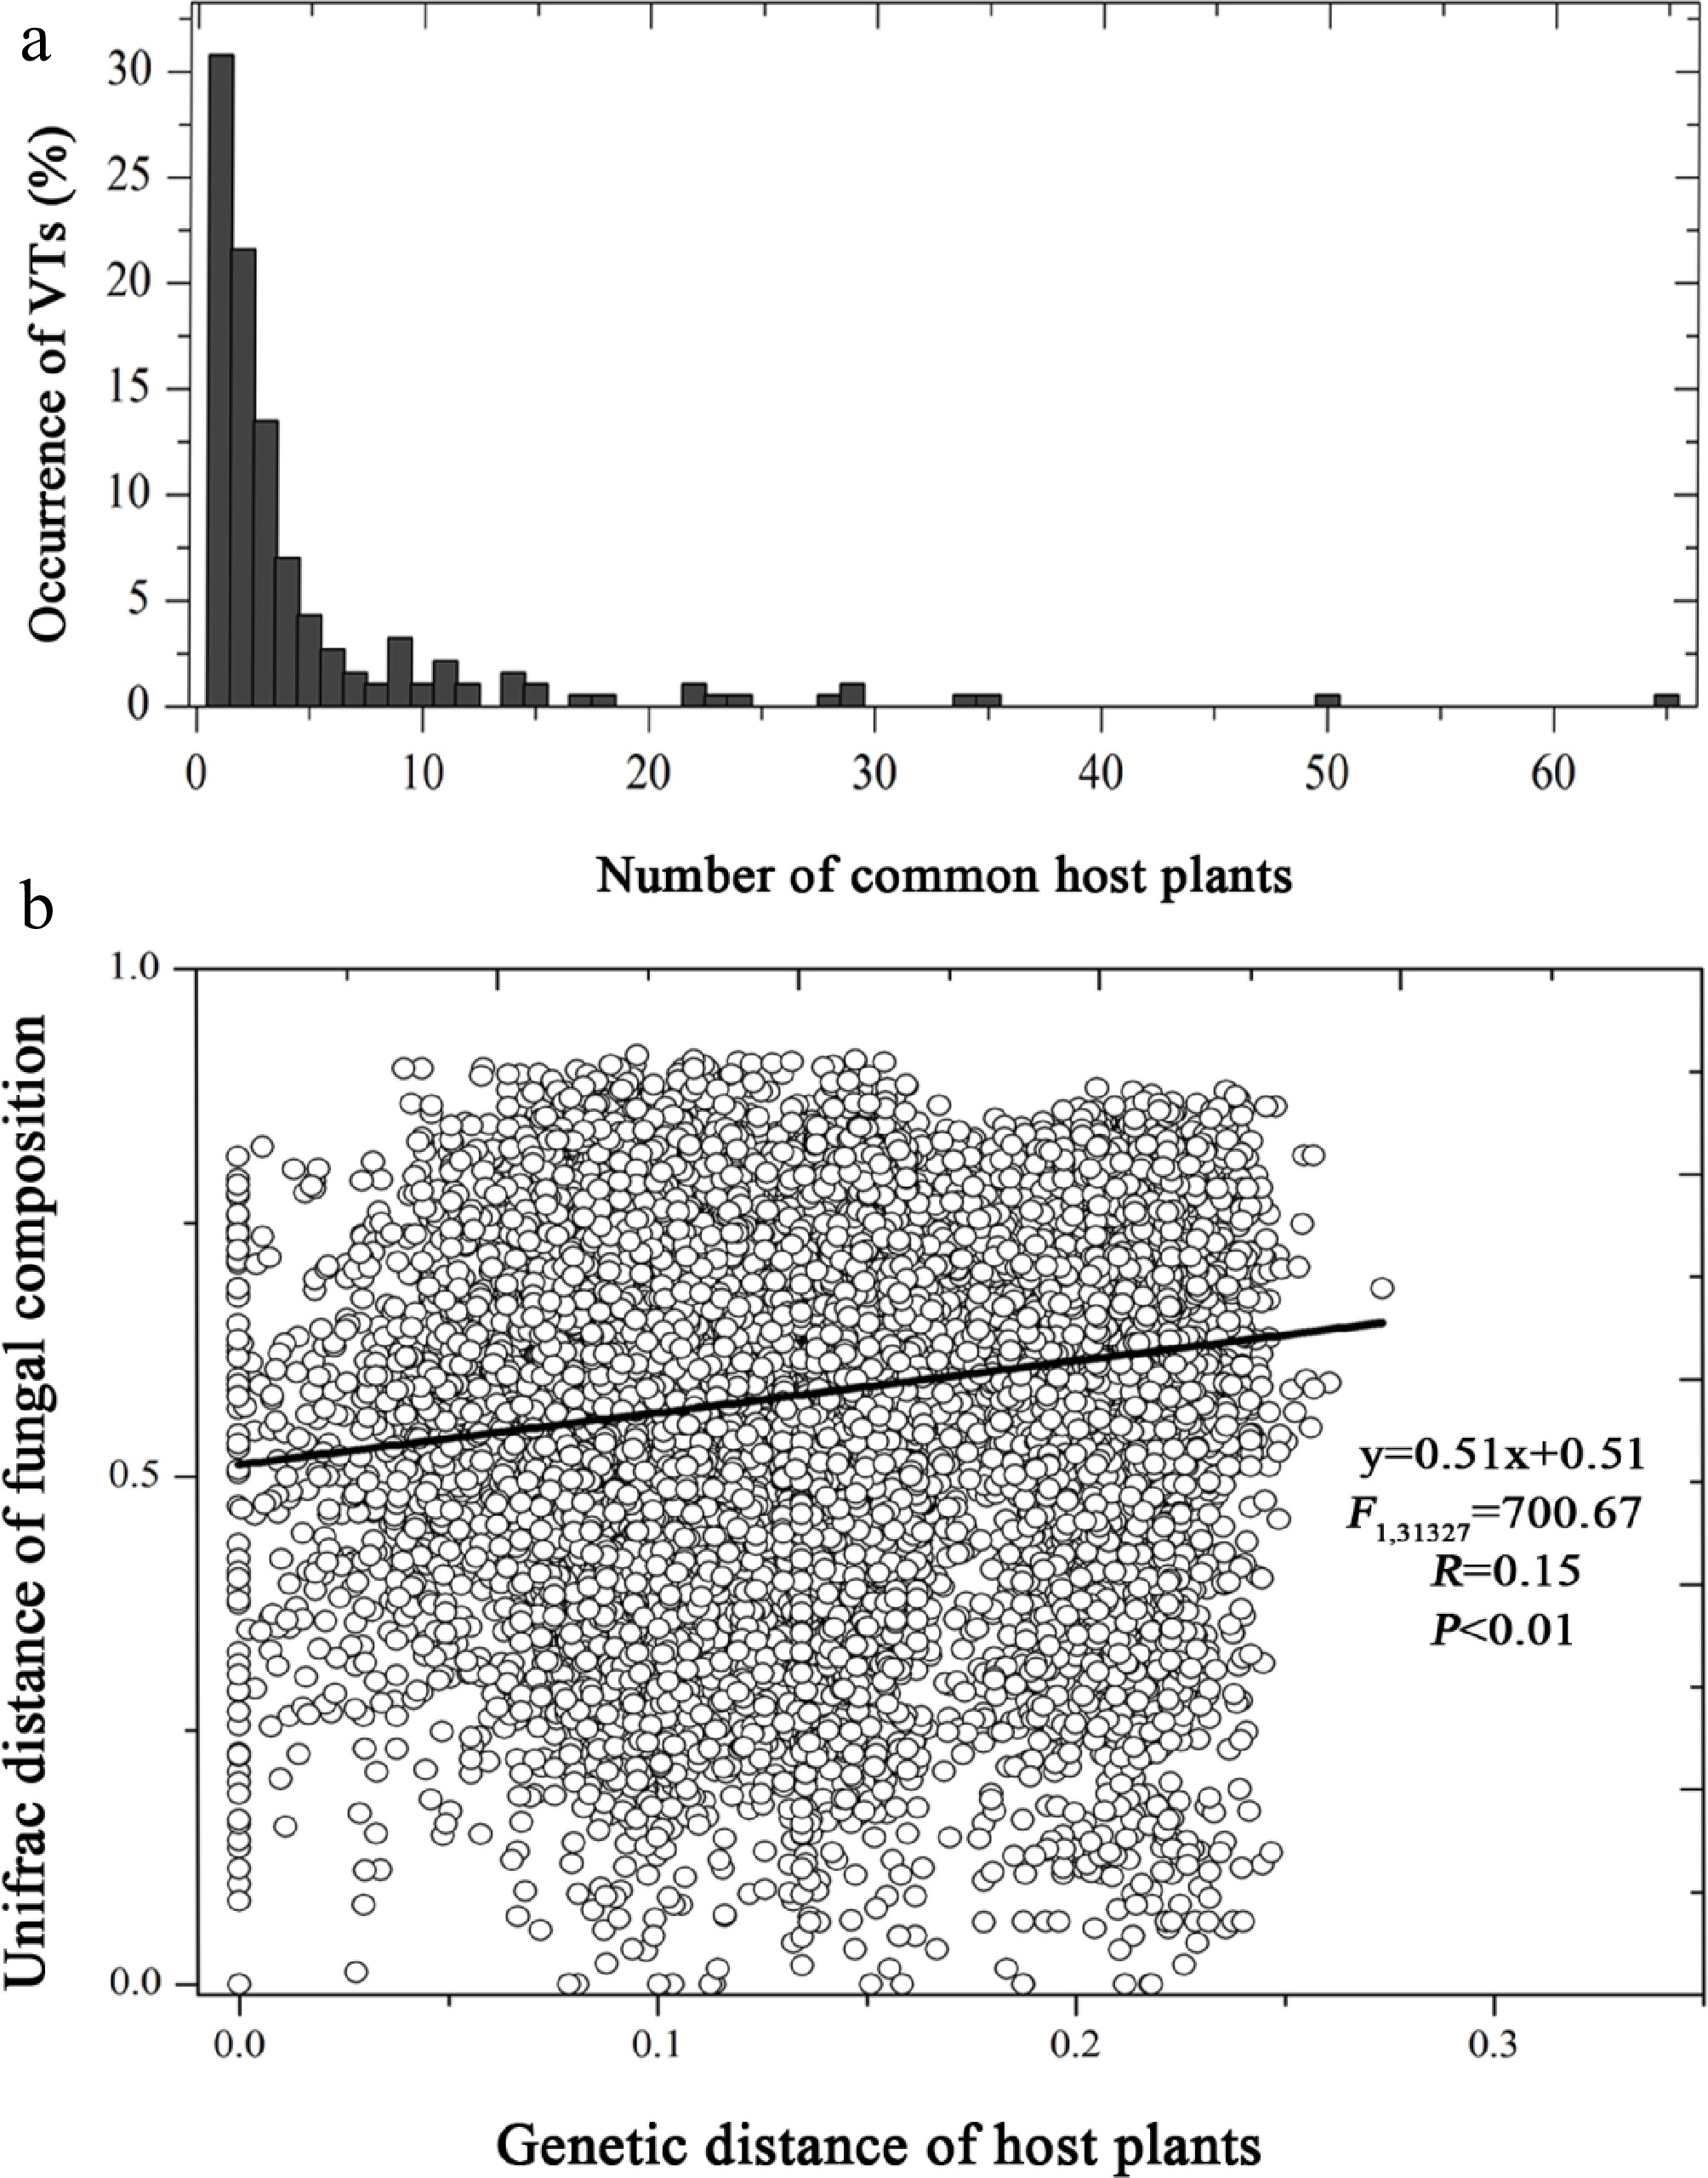
Figure 4.
(a) Host range of taxa in Glomeraceae family, and (b) the relationship of Glomeraceae fungal composition dissimilarity against genetic distance of host plants.
Overall, both Glomeraceae and non-Glomeraceae enhanced plant tolerance to biotic stresses and reduced the performance of biotic stressors (Fig. 3a). Glomeraceae showed higher growth promotion for plants and more inhibition for biotic stressors than non-Glomeraceae (Qb = 8.36, prandom < 0.01 for plant performance; Qb = 14.04, prandom < 0.01 for stressor performance) (Fig. 3a). Meanwhile, biotic stresses reduced the root colonization intensity of both Glomeraceae and non-Glomeraceae, but the reduction was less for Glomeraceae (Qb = 10.96, prandom = 0.00) (Fig. 5).
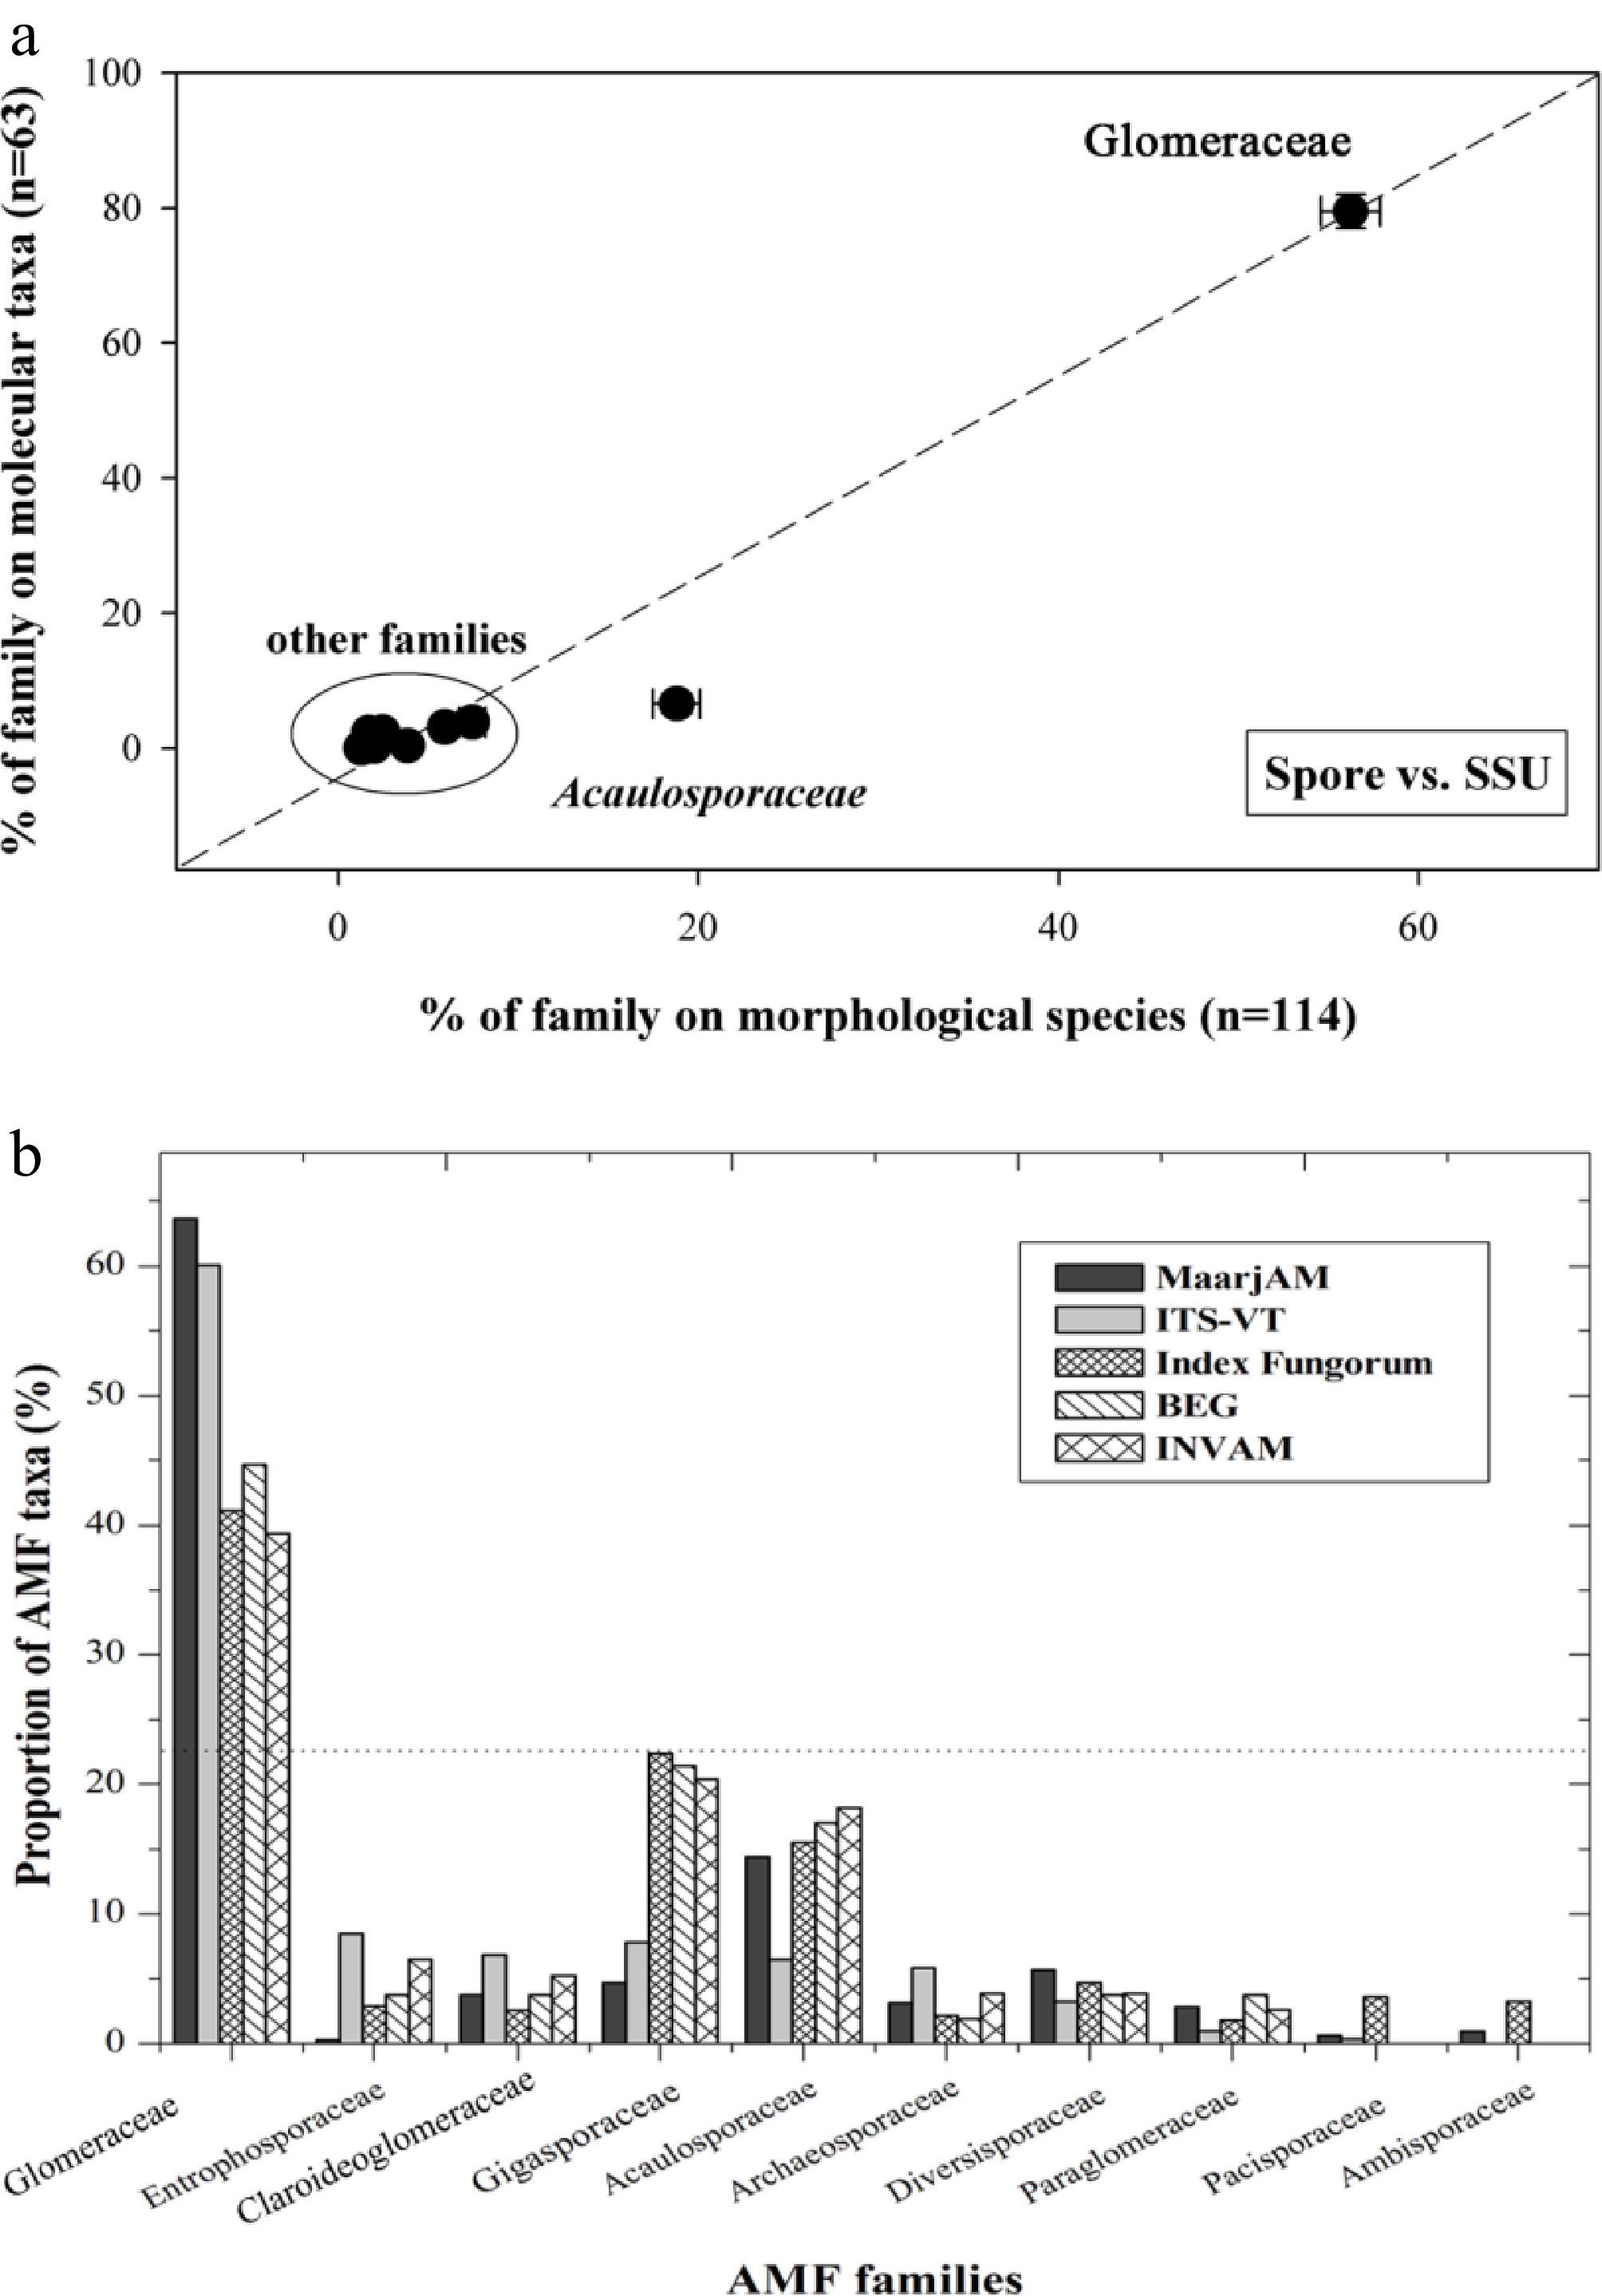
Figure 5.
AMF diversity at family level in natural communities.
(a) AMF species richness in published molecular and morphological diversity studies; (b) AMF species number stored in public databases and datasets.The effects of AMF were also analyzed separately for nematode and fungal pathogen (Fig. 3b, c). Both Glomeraceae and non-Glomeraceae enhanced the tolerance of host plants to nematode and fungal pathogens. However, the effect towards nematodes was not different between both AMF categories (Qb = 5.99, prandom > 0.05), while Glomeraceae showed a stronger effect towards fungal pathogens (Qb = 2.94, prandom < 0.05). The performance of nematodes and fungal pathogens were significantly inhibited by Glomeraceae and non-Glomeraceae, but Glomeraceae showed a stronger inhibitive effect (Qb = 22.53, prandom < 0.05 for nematodes; Qb = 106.86, prandom < 0.01 for fungal pathogens). Nematode and fungal pathogens also reduced mycorrhizal performance for both groups of AMF, but less reduction was shown for Glomeraceae (Qb = 17.60, prandom < 0.05 for nematodes; Qb = 76.00, prandom < 0.01 for fungal pathogens).
Host range analysis suggested that there was some preference between Glomeraceae taxa and their host plant species. SSU-VT data showed that 31% of Glomeraceae taxa only occurred in one host, 22% occurred in two hosts, and 14% occurred in three hosts (Fig. 4a). The values of host range were 61%, 20%, 8%, for ITS-OTU0.10, and 76%, 13%, and 3%, for LSU-OTU0.05, respectively (Supplementary Fig. S2c, S2d).
Pearson's correlation analysis suggested that there is a positive relationship between the genetic distance of host plants and the unifrac distance of Glomeraceae taxa composition (r = 0.15, p < 0.01). A positive linear relationship was also shown between pair-wise genetic distance of host plants and pair-wise unifrac distance of Glomeraceae taxa composition (F = 700.67, R = 0.15, p < 0.01) (Fig. 4b).
Net diversification rate of AMF families was estimated from SSU, ITS, LSU, and β-tubulin genes. Diversification analysis suggested that Glomeraceae was neither the oldest nor the youngest AMF lineage, but showed the highest net diversification rate based on the SSU gene (Table 1). Similar results were shown from ITS, LSU, and β-tubulin genes (see Supplementary Tables S2−S4).
Table 1. Net diversification rate of AMF families based on SSU gene.
AMF family Stem
ageCrown
ageTaxa
number§Relative extinction Rate = 0 Rate = 0.9 Acaulospraceae 250 230 46 0.0067 0.0030 Ambisporaceae 470 400 3 0.0010 0.0002 Archaeosporaceae 400 180 10 0.0025 0.0007 Claroideoglomeraceae 430 68 12 0.0025 0.0007 Diversporaceae 250 89 18 0.0050 0.0017 Gigasporaceae 340 240 15 0.0035 0.0011 Glomeraceae 300 230 203 0.0077 0.0044 Paraglomeraceae 450 89 9 0.0021 0.0006 § The taxa number data are based on VTs defined with SSU sequences from the MaarjAM database on May 22nd, 2012[26]. Data synthesis showed that Glomeraceae was over-dominant in natural AMF communities (Fig. 5 and Supplementary Fig. S4). The number of Glomeraceae taxa accounted for 56.22% for morphological species, 79.45% for SSU taxa, 73.06% for ITS taxa, and 67.69% for LSU taxa (Fig. 5a and Supplementary Fig. S4). Surveys for public databases/datasets showed that the number of Glomeraceae taxa accounted for 63.64%, 60.06%, 41.16%, 37.74%, and 35.06% for MaarjAM, ITS-VT, Index Fungorum, BEG, and INVAM, respectively (Fig. 5b).
-
Our analysis by compiling different studies demonstrated an average trend that the Glomeraceae family was conserved and dominant during AMF-host plant interactions in an evolutionary background. This dominant conservatism might be maintained by superior functioning benefits provided by mutual partners at the AMF family level. However, there is preferential selection between the taxa of Glomeraceae and their host partners. The composition of root-associated Glomeraceae taxa differentiated with increasing unrelatedness between host partners. This preference between Glomeraceae taxa and their host partners might make some contribution to the higher diversification rate than other AMF families, and the overdominance of Glomeraceae taxa in natural communities.
Conservatism at the AM fungal family level
-
Genetic machinery of mycorrhizal symbiosis has been predicted to be conserved, which might be strictly dedicated by some AMF taxa during coevolution with host plants[16]. Our results suggest that these fungi could be taxa in the Glomeraceae family. Glomeraceae taxa are over-dominant in all AMF families in different plant phylogenetic groups, with a proportion of over 60%, except for hornworts. Especially, ferns and non-photosynthetic monocotyledons showed much higher preference to Glomeraceae (Fig. 1). Therefore, Glomeraceae might be conserved during the evolution of mycorrhizal symbiosis. Such a conservatism could elegantly explain previously reported similar colonization strategies and mycorrhizal structures between liverworts and vascular plants, as well as vertical inheritance of mycorrhizal genes[14].
However, Glomeraceae originated late in Glomeromycotan phylogeny, which is later than the early land plants, e.g., the basal liverworts[45]. The fungal associations of liverworts are an ancient feature that might have originated around 400 MYA[46]. Therefore, the basal liverworts might form a mutually beneficial symbiosis with some early-originated AMF taxa (e.g., Paraglomeraceae or Archeosporaceae) for plant terrestrialization in the early Paleozoic (e.g., the Ordovician, 460 MYA)[8]. Nonetheless, liverworts might experience the loss of mycorrhizal association because of abrupt climate change (e.g., a great fall of CO2 concentration)[11], but possibly regained it with Glomeraceae in the mid-Paleozoic (360–380 MYA) when the climate was stable[10]. Our molecular clock calibration suggests that the divergence time of Glomeraceae is 300–380 MYA with different genes (Table 1, Supplementary Tables S2 and S3), which approximates the divergence dates of the extant liverworts from tracheophytes. From that time, Glomeraceae might vertically coevolve with plants from gametophytes (e.g., liverworts), to the 'lower' tracheophytes (e.g., ferns), and then to the 'higher' tracheophytes (e.g., gymnosperms and angiosperms) or even mycoheterotrophic epiparasites. Thus, our results could provide evidence supporting the vertical inheritance hypothesis for explaining conservatism in mycorrhizal structure and functioning[45].
The reason why such conservatism occurs for Glomeraceae but not other AMF families might be determined by its better symbiotic performance when coevolving with host plants. Our results suggest that Glomeraceae had stronger symbiotic functioning than other AMF families in delivering benefits to host partners. Glomeraceae promote plants to take up more nutrients (e.g., N and P) and facilitate plants for better growth, irrespective of being under no stress or abiotic stress. There are at least three hypothetical ways, not yet validated here, which can explain such a superiority under an evolutionary scenario.
First, Glomeraceae may initially colonize roots much faster than other AMF families. For example, some members of Glomeraceae colonized roots of hosts by 1 week, but 7 weeks might be required for some members of Gigasporaceae[47]. Such fast colonization might be determined by its regenerating strategies. Studies found that Glomeraceae species can regenerate from infective hyphae, root fragments, or spores, whereas most other AMF families (e.g., Gigasporaceae) lack propagules beyond spores. Spore dormancy mechanisms and germination constraints inherently slow AMF re-establishment kinetics, delaying root colonization[47].
Second, the distinct behavior of hyphal fusion might give rise to resilience priority of Glomeraceae after disturbance. Anastomosis to repair the disrupted hyphal networks has been suggested as a crucial mechanism for AMF combating adverse environments[48]. Glomeraceae have been shown to possess different patterns of anastomosis formation from other AMF families (e.g., Gigasporaceae)[49]. After disturbance events, Glomeraceae could quickly form septal plugs at both injured hyphal tips, then produce multiple new branches at the repaired tips, and finally reconnect the disrupted networks. However, the members of Gigasporaceae would slowly form septal plugs 50–300 μM away from the injured tips, regenerate a few new hyphal branches behind the septa, but could not repair the disrupted mycelium networks[49]. Thus, the hyphal fusion strategy might provide Glomeraceae with better plasticity to extend mycelium networks for exploring and exploiting new resources.
Finally, different hyphal architectures might lead to Glomeraceae with greater nutrient foraging efficiency. Greater extraradical mycelium is predicted to provide more benefits to their host partners. However, some examples against this prediction have also been frequently reported for comparison between Glomeraceae and Gigasporaceae[50]. This might be determined by mycelium architecture. Gigasporaceae has been found to produce larger external mycelium, but concentrated closer to the root systems of host plants[47]. Nonetheless, more delicate and diffuse hyphae are shown for Glomeraceae with less external biomass[47]. Such mycelium architecture might result in greater soil resource volume for Glomeraceae than Gigasporaceae.
Except for the above-mentioned advantage in nutrient uptake, the rapid root colonization of Glomeraceae also plays a role in conferring superior tolerance and resistance towards stress conditions. In response to abiotic stress, e.g., drought, salinity, or heavy metals, Glomeraceae's rapid colonization potentially triggers earlier transcriptional activation of tolerance genes, i.e., aquaporins, proline, or metallothionein[51]. Under the attack of biotic stressors, AMF could induce systemic resistance of host partners[52]. In addition, competitive inhibition for the resource or infective site is another mechanism for AMF-mediated resistance to biotic stressors[53]. Thus, taken together with our findings, the faster colonization of Glomeraceae might first induce such defense responses or competitive inhibition, and subsequently show stronger inhibition for the performance of biotic stressors (e.g., nematodes or fungal pathogens) with smaller cost.
Differentiation at fungal species level
-
Although the superiority of Glomeraceae is conserved across different plant phylogenetic groups, our findings suggest that the taxa in Glomeraceae may have high host specificity. Most Glomeraceae taxa showed a limited host range, suggesting that there is a host-fungus preference at the species level between both biotic partners. However, whether such a preference is shaped by phylogenetic constraint is still debated. Our results showed that there is a weak but significantly positive correlation between the dissimilarity of Glomeraceae composition in roots and the genetic distance of host plants (Fig. 4b). This suggests that distantly related plant species might differentiate in their Glomeraceae symbionts. The formation of such patterns might be the result of plant-plant interactions under natural selection. Weaker competition for resources (e.g., soil nutrients) was frequently observed between more distantly related plant species[54], thus leading to a stable co-existence in natural communities. Natural selection might also positively select such plant-plant interactions[55], which could maintain high plant diversity and subsequently produce larger ecosystem services. However, the underlying mechanisms of the variation of competition with relatedness of plants. Our results suggest that AMF might play key roles in the competition processes of their host plants. AMF can be treated as a component of the nutrient niche for plant species[55]. The fungal niche might differentiate with the relatedness of plant species. Therefore, plants differing in their fungal niches might increase AMF diversity, provide a more efficient exploitation, and thus reduce competition for soil nutrients in the shared rhizosphere[55].
Imbalanced diversity pattern
-
AMF diversity is an important determinant for plant community performance (e.g., productivity, stability, or diversity)[56]. Although researchers took great passion to decipher AMF diversity patterns, less attention was put on what forces shaped them in the past decades. Our study synthesized extensive AMF studies and generalized an 'imbalanced diversity pattern', which is the overdominance of Glomeraceae taxa in the natural communities. Our results suggest that this imbalanced diversity pattern might be structured by coevolving host-fungus preference. As mentioned above, plant partners always prefer the Glomeraceae family but differentiate in Glomeraceae species during their coevolution processes. Such reciprocal preference might affect the diversification rate of the Glomeraceae family.
Diversification was determined by two processes: speciation and extinction[44]. For the asymmetry in mycorrhiza, plant speciation might exert some active effects on AMF speciation[57]. Some early mycologists might not agree with this idea based on the observations that plant diversity was much higher than AMF diversity. However, we here argued that AMF may not diversify in step with plant species. When a new plant species originates, no selective pressure will be put on AMF if the association with the existing AMF could help the new host to deal with the surrounding adverse environments. Or else, the asymmetric nature of symbiosis might exert some selection pressure to drive AMF speciation. Considering the above mentioned preference, a higher speciation rate might be maintained for Glomeraceae than other families during coevolution with its plant partners. Meanwhile, some functional traits might lead to lower extinction rate of Glomeraceae than other AMF families, including small spores, vegetative hyphal fragments, and host preference, etc. These traits would make Glomeraceae more easily find their compatible host partners and thus reduce the risk of extinction. Therefore, it is justifiable to predict that Glomeraceae has higher diversification rate than other families based on possibly higher speciation but lower extinction. Indeed, this prediction can be supported by our results with different genes (SSU, ITS, LSU and β-tubulin) (Table 1, Supplementary Tables S2−S4). Thus, the coevolving host-fungus preference might accelerate the diversification rate of Glomeraceae, consequently leading to a greater species number than in other AMF lineages.
Limitations and future directions
-
One limitation of our analysis is that data on mycorrhizal functioning were mainly collected from vascular plants. Indeed, available publications are scarce for the mycorrhizal functioning of some early-originated or mycoheterotrophic plants. However, this limitation should not affect our overall conclusions because some case studies provided evidence that such plants preferentially form a symbiosis with Glomeraceae[12]. Especially, several studies have performed functional analyses of mycorrhiza for liverworts and mycoheterotrophytes. For example, Glomeraceae promotes growth and nutrient uptake of a complex thalloid liverwort[10,11]. Ferns (gametophyte stage) or mycoheterotrophytes are specialized to Glomeraceae for carbon, through mycelium networks interconnected with the surrounding green plants[12]. Certainly, we expect more experimental measurements for mycorrhizal functioning in early-originated plant species in future studies.
In addition, we have to acknowledge that second-hand data are used for our data synthesis and meta-analysis. Although we claim that we could guarantee the data quality using different methods (e.g., sensitivity analysis, fail-safe number), a non-negligible fact is that the source data are indeed confounded by different experimental contextual factors. We are convinced of our described coevolutionary preference patterns and imbalanced diversity patterns with our analyses of such large datasets. However, we still expect direct experimental evidence regarding such patterns with a broader evolutionary scale under similar conditions (e.g., climate and soil) in the future.
This study was funded by The 'Small Group' Flexible Aid Program for Xinjiang under the Autonomous Region's Innovative Talent Expansion Initiative for Intellectual Support, and the National Natural Science Foundation of China (Grant No. 31300373).
-
The authors confirm their contributions to the paper as follows: conceptualization, investigation, and writing – original draft: Yang H, Zhang Q, Hu X; writing – review and editing: Shen X; conceptualization, writing – review and editing, and supervision: Cui D. All authors reviewed the results and approved the final version of the manuscript.
-
The datasets generated during and/or analyzed during the current study are available from the corresponding author on reasonable request.
-
The authors declare that they have no conflict of interest.
-
accompanies this paper online at: https://doi.org/10.48130/abd-0026-0006.
- Supplementary Data 1 Host information of SSU,ITS,LSU in this study.
- Supplementary Data 2 Source references for host-AMF sequence _ITS,LSU_ used in this study.
- Supplementary Data 3 Data for meta-analysis at no stress.
- Supplementary Data 4 Source references for data used for meta-analysis at no stress.
- Supplementary Data 5 Data for meta-analysis at abiotic stress.
- Supplementary Data 6 Source references for data used for meta-analysis at abiotic stress.
- Supplementary Data 7 Data for meta-analysis at biotic stress.
- Supplementary Data 8 Source references for data used for meta-analysis at biotic stress.
- Supplementary Data 9 Colonization data used in this meta-analysis.
- Supplementary Data 10 Marker genes used for estimating diversification rate (tublin,SSU,ITS,LSU).
- Supplementary Data 11 Source references AM fungal morphological and molecular diversity in international journals.
- Supplementary Data 12 Source references AM fungal morphological diversity in Chinese journals.
- Supplementary Fig. S1 PRISMA flow diagram for meta-analysis.
- Supplementary Fig. S2 The average proportion of AMF taxa at different families (a, c) and average host range for each taxa (b, d).
- Supplementary Fig. S3 Plant growth response to inoculation of Glomeraceae and non-Glomeraceae fungi under soil substrates mixing sands with high and low proportion.
- Supplementary Fig. S4 The proportion of AMF species number in each family identified using morphological and molecular methods.
- Supplementary Table S1 Total heterogeneity (QT), between-group heterogeneity (QB) and with-in group heterogeneity (Qw) of effect size in studies under different stresses.
- Supplementary Table S2 Net diversification rate of AMF families based on beta-tubulin marker gene.
- Supplementary Table S3 Net diversification rate of AMF families based on LSU marker gene.
- Supplementary Table S4 Net diversification rate of AMF families based on ITS marker gene.
- Copyright: © 2026 by the author(s). Published by Maximum Academic Press on behalf of Yunnan Agricultural University. This article is an open access article distributed under Creative Commons Attribution License (CC BY 4.0), visit https://creativecommons.org/licenses/by/4.0/.
-
About this article
Cite this article
Yang H, Shen X, Cui D, Hu X, Zhang Q. 2026. Host-fungus preference shapes imbalanced arbuscular mycorrhizal fungal diversity. Agrobiodiversity 3(2): 71−81 doi: 10.48130/abd-0026-0006 

Host-fungus preference shapes imbalanced arbuscular mycorrhizal fungal diversity
- Received: 23 February 2026
- Revised: 14 April 2026
- Accepted: 11 May 2026
- Published online: 23 June 2026
Abstract: Plant-microbe interaction is important in shaping both partners' communities. However, how host-fungus preference affects the fungal community is not well defined in the mutualistic symbiosis of arbuscular mycorrhizas. Here, we used meta-analytical approaches with comprehensive surveys of literature and databases to decipher the effects of mutual partners' preference on the biodiversity of arbuscular mycorrhizal fungi (AMF). Our results demonstrated an average trend that the Glomeraceae family was conserved and dominated in the roots of different plant phylogenetic groups. The species number of Glomeraceae accounted for ~60% in different plant lineages except for hornworts, and for ~80% among different root-associated AMF families. Meanwhile, Glomeraceae exhibited a higher root colonization rate and superior symbiotic function, e.g., greater host growth promotion, N and P uptake, stress tolerance, and resistance to biotic stressors than non-Glomeraceae families. However, Glomeraceae species exhibited a limited host range, and more unrelated host species harbored more dissimilar Glomeraceae species. We further found that Glomeraceae had a higher diversification rate and greater species richness than other AMF families in natural communities. Our results suggested that the imbalanced AMF diversity pattern (overdominance of Glomeraceae) might be generated from the mutual preference between both partners at the fungal family level, but differentiation at the host species level.
-
Key words:
- Arbuscular mycorrhizal fungus /
- Host preference /
- Diversity /
- Diversification /
- Meta-analysis