


-
Lipids are a component of animal tissue cells and an important energy substance. They are indispensable for the growth, development, and reproduction of fish. In particular, carnivorous fish have a low utilization efficiency of carbohydrate[1,2]. Therefore, appropriate dietary lipid levels can promote feed protein efficiency, minimize nitrogen excretion, and contribute to their health[3,4]. However, a high-lipid diet also inhibits fish growth, induces oxidative stress, and causes liver and intestinal inflammation[5−7]. Therefore, exploring the appropriate dietary lipid level is the key to avoiding hepato-intestinal damage in fish.
Largemouth bass (Micropterus salmoides), belonging to the genus Micropterus of the order Perciformes, is a warm-water carnivorous fish. Because of its advantages of fast growth, strong adaptability, and short growth cycle, these fish have become one of the main varieties of large-scale freshwater fish in China. In 2025, China's freshwater aquaculture bass production exceeded 800,000 tons[8], yet larval survival rates remain under 10%[9]. Therefore, studying the different lipid levels required by larval fish and improving their disease resistance and survival rate through nutritional regulation is of great significance. Domestic and foreign studies have shown that 17.94% lipid levels could improve growth and hepato-intestinal health of juvenile largemouth bass (10.06 ± 0.00 g) and optimal growth at a 10% lipid level (13.38 ± 0.11 g) was linked to carnitine palmitoyl transferase I/adenosine monophosphate-activated protein kinase (CPT I/AMPK)-dependent metabolic modulation[10,11]. However, there have been no reports on the lipid requirements of largemouth bass larvae. In addition, our team has completed research on early development models[12], optimal protein levels[13], lysine and methionine requirements for largemouth bass larvae[14,15]. At present, there are limited data on the optimal nutrient requirements for largemouth bass larvae, and further research is still needed.
Therefore, on the basis of the lipid requirements of carnivorous largemouth bass larvae and our team's previous research, five granulated microdiets lipid levels ranging from 11% to 22% were set to study the growth, body composition, digestive enzyme activities, and hepato-intestinal health of largemouth bass larvae and to explore the optimal lipid level and provide an experimental basis for the design of effective granulated microdiets.
-
Fish meal and krill meal were used as protein sources, and fish oil, soybean oil, and soybean lecithin were used as the fat sources. Five kinds of diets with isonitrogen and isoenergy were designed with 55% protein content and different lipid levels. The fish were fed crude lipids at 11.22%, 13.22%, 16.25%, 19.28%, and 22.45%, denoted as L11, L13, L16, L19, and L22, respectively. The raw materials' composition and nutrients are shown in Table 1. The raw materials were crushed and screened through 80 mesh (0.18 mm). Vitamins, minerals, and other trace elements were mixed by the step expansion method, mixed with soybean oil and soybean lecithin, mixed with water, and pulped to make three kinds of granular materials screened with 20 mesh (0.85 mm), 40 mesh (0.435 mm), and 60 mesh (0.23 mm), respectively. The samples were cooled to room temperature and stored in an airtight bag in a freezer.
Table 1. Composition and nutrient levels of experimental diets (dry matter [DM] basis).
Items Diet L11 Diet L13 Diet L16 Diet L19 Diet L22 Ingredients Fish meal 60.00 60.00 60.00 60.00 60.00 Antarctic krill powder 10.00 10.00 10.00 10.00 10.00 Plasma protein powder 5.00 5.50 6.00 6.50 7.00 Flour 15.75 12.25 8.75 5.25 1.75 Triple alginate 3.00 3.00 3.00 3.00 3.00 Fish oil : soybean oil = 2:1 0.00 3.00 6.00 9.00 12.00 Soya bean lecithin 3.00 3.00 3.00 3.00 3.00 Ca(H2PO4)2 2.00 2.00 2.00 2.00 2.00 Choline choride 50% 0.25 0.25 0.25 0.25 0.25 Vitamin C ester 0.30 0.30 0.30 0.30 0.30 Vitamin premix1 0.20 0.20 0.20 0.20 0.20 Mineral premix2 0.50 0.50 0.50 0.50 0.50 Total 100 100 100 100 100 Proximate composition Moisture, % 3.63 2.94 3.11 3.24 3.54 Ash, % 13.57 12.61 13.09 11.97 12.53 Crude protein, % 54.81 56.90 56.04 55.23 55.67 Ethere extract, % 11.22 13.22 16.25 19.28 22.45 Gross energy, kJ/g 19.77 20.26 20.62 20.79 20.97 1 One kilogram of vitamin premix provided 8,000 IU vitamin A, 4 mg vitamin B1, 3.6 mg vitamin B2, 40 mg vitamin B5, 4 mg vitamin B6, 0.02 mg vitamin B12, 3,000 IU vitamin D3, 20 IU vitamin E, 2 mg vitamin K3, 0.15 mg biotin, 1.0 mg folic acid, 11 mg D-calcium pantothenate, 10 mg nicotinic acid, and 100 mg antioxidants. 2 One kilogram of the mineral premix provided 13 mg FeSO4·H2O, 60 mg ZnSO4·H2O, 1,200 mg NaCl, 32 mg MnSO4·H2O, 7 mg CuSO4·H2O, and 8 mg KI. Experimental design and feeding management
-
Largemouth bass larvae were purchased from Liang's Aquatic Seed Industry Co. Ltd. and transported to the cement pool facility of the Fisheries Research Institute, Guangdong Academy of Agricultural Sciences, for rearing. A total of 2,000 healthy fish with an initial body weight (IBW) of 0.06 g were randomly divided into 20 small grids (20 cm × 50 cm × 50 cm, 100 fish per cage) for 30 d. The daily feeding amount was satiated feeding (at 08:00, 11:00, 14:00, and 17:00 every day). Residual feed and feces were removed by siphoning daily, and 20% of the water volume was replaced every other day. The natural photoperiod from August to September was adopted, with dissolved oxygen at 6.0–9.0 mg/L, ammonia nitrogen at < 0.20 mg/L, nitrite at < 0.05 mg/L, and a water temperature of 28.6–30.1 °C.
Experimental sampling
-
Before sampling, we made the fish hungry for 24 h. All fish in each small net cage (four tanks per group) were counted and weighted to measure the final body weight (FBW) and thus calculate the weight gain rate (WGR), specific growth rate (SGR), feed intake (FI), and feed conversion ratio (FCR). Another six fish were randomly selected from each small net cage to detect the condition factor (CF) and viscerosomatic index (VSI).
For analysis of the digestive enzymes, liver biochemistry, and antioxidant enzyme activities, we randomly selected 30 larvae from each small net cage to obtain visceral somatic cell samples, which were then stored at −80 °C. Commercial kits (Nanjing Jiancheng Bioengineering Institute, China) were used to determine the contents of trypsin, lipase, amylase, γ-glutamyl transpeptidase (γ-GT), aspartate transaminase (AST), alanine transaminase (ALT), triglyceride (TG), glucose (GLU), malondialdehyde (MDA), catalase (CAT), total superoxide dismutase (T-SOD), lysozyme (LZM), alkaline phosphatase (AKP), glutathione peroxidase (GSH-Px), and peroxidase (POD), and their activities.
We randomly selected 30 larvae from each small net cage, which were weighed and dried for whole body composition analysis. We selected one fish from each small net cage, fixed 1 cm of the midgut in a 4% formaldehyde solution, prepared paraffin sections, and observed the morphological structure.
Laboratory analyses
-
The approximate components of diets and whole fish were determined using AOAC International's method. For the methods used to determine moisture, crude protein, crude lipid, and ash content, refer to Li et al.[3].
The intestinal tissue was dehydrated with ethanol, made transparent in a xylene solution, and cut into 5-µm sections. Paraffin intestinal tissue sections were prepared and scanned with PANNORAMIC panoramic section scanner after hematoxylin and eosin (H&E) staining to observe the morphology of the intestinal villi. CaseViewer 2.2 software was used to observe and measure the mucosal thickness and villus height under a 10× light microscope and muscle thickness under a 20× light microscope. The height of 10 intestinal villi, the width of the intestinal villi, and the thickness of the muscle layer were measured in each section. The width of the villi was divided into the base, middle, and tip were measured, and the average value was obtained as the measurement data for analysis. We counted the number of goblet cells using Image-Pro Plus 6.0 software.
Data calculations and statistical analysis
-
All data were summarized and calculated according to following equations:
$ \mathrm{Survival}\; \mathrm{rate}\; (\mathrm{SR},\text{%})=\mathrm{\frac{\mathrm{F}inal\ \mathrm{fish\ number}}{Initial\ fish\ number}\times1}00\ $ $ \mathrm{Weight}\; \mathrm{gain}\; \mathrm{rate}\; (\mathrm{WGR},\text{%})=\mathrm{\frac{FBW\left(g\right)-IBW\left(g\right)}{IBW\left(g\right)}}\times100\ $ $ \mathrm{Specific}\; \mathrm{growth}\; \mathrm{rate}\; (\mathrm{SGR},\text{%}/\mathrm{d})=\mathrm{\left(ln\ FBW\left(g\right)-\ ln\ IBW\left(g\right)\right)\times100/Days} $ $ \mathrm{Feed}\; \mathrm{conversion}\; \mathrm{ratio}\; (\mathrm{FCR})=\mathrm{\frac{FI\ \left(g\right)}{FBW\ \left(g\right)-\ IBW\ \left(g\right)}} $ $ \mathrm{Condition}\; \mathrm{factor}\; (\mathrm{CF},\; \mathrm{g}/\mathrm{cm}^3)=\mathrm{\frac{Body\ weight\ \left(g\right)}{Body\ length\ \left(cm^3\right)}} $ $ \mathrm{Viscerosomatic}\; \mathrm{index}\; (\mathrm{VSI},\text{%})=\mathrm{\frac{Visceral\ weitht\ \left(g\right)}{Body\ weight\ \left(g\right)}}\times100 $ $ \mathrm{Protein}\; \mathrm{retention}\; (\mathrm{PR},\text{%})=\mathrm{\frac{Fish\ protein\ gain\ \left(g\right)}{Prote\ in\ intake\ \left(g\right)}}\times100 $ $ \mathrm{Lipid}\; \mathrm{retention}\; (\mathrm{LR},\; \text{%})=\mathrm{\frac{Fish\ lipid\ gain\ \left(g\right)}{Lipid\ intake\ \left(g\right)}}\times100 $ Biological replicate was used as the statistical unit for physical indexes. The tank was used as the statistical unit for other analyses. Normally distributed data were analyzed by one-way analysis of variance (ANOVA) (SPSS 22.0, IBM Corp.) with a post hoc Duncan's test. Significant differences were set at p < 0.05, with the data presented as means ± standard errors of the mean (SEMs). A broken line model was established using Microsoft Excel software to determine the appropriate fat level for growth.
-
The FBW, WGR, and SGR of largemouth bass first increased and then decreased as the dietary lipid levels increased, and the L19 group was the largest (p < 0.05, Table 2). The CF of the L11 group was significantly greater than that of the other lipid groups, and FCR was decreased (p < 0.05). Among five groups, there were no obvious differences in SR and VSI (p > 0.05). The dietary lipid requirement estimated on the basis of SGR was 20.16% (y1 = 52.619x1 + 782.7, R12 = 0.886; y2 = −12.331x2 + 2092, R22 = 1; Fig. 1).
Table 2. Effects of lipid levels on the growth performance and morphometric parameters of largemouth bass (growth performance, n = 4; morphometric parameters, n = 24).
Items Group L11 Group L13 Group L16 Group L19 Group L22 IBW, g 0.06 ± 0.01 0.06 ± 0.00 0.06 ± 0.00 0.06 ± 0.00 0.06 ± 0.00 FBW, g 0.92 ± 0.06a 0.93 ± 0.04a 0.99 ± 0.05a 1.17 ± 0.05b 1.15 ± 0.06b WGR, % 1,426.44 ± 97.66a 1,446.76 ± 68.01a 1,558.94 ± 78.33a 1,854.21 ± 86.22b 1,814.01 ± 100.37b SGR, %/d 9.06 ± 0.22a 9.12 ± 0.15a 9.35 ± 0.16a 9.90 ± 0.14b 9.82 ± 0.19b SR, % 68.75 ± 7.09 64.60 ± 8.22 71.60 ± 5.40 72.40 ± 5.78 76.40 ± 4.63 FCR 1.58 ± 0.01b 1.59 ± 0.13b 1.24 ± 0.09a 1.19 ± 0.02a 1.18 ± 0.04a VSI, % 7.78 ± 0.65 7.86 ± 0.39 8.41 ± 0.38 9.78 ± 0.40 9.11 ± 0.44 CF, % 2.25 ± 0.12b 2.04 ± 0.03a 2.06 ± 0.03a 2.01 ± 0.07a 2.09 ± 0.04a In the same row, values with different lowercase superscripts indicate a significant difference (p < 0.05). The same applies in Tables 3–6 as well. 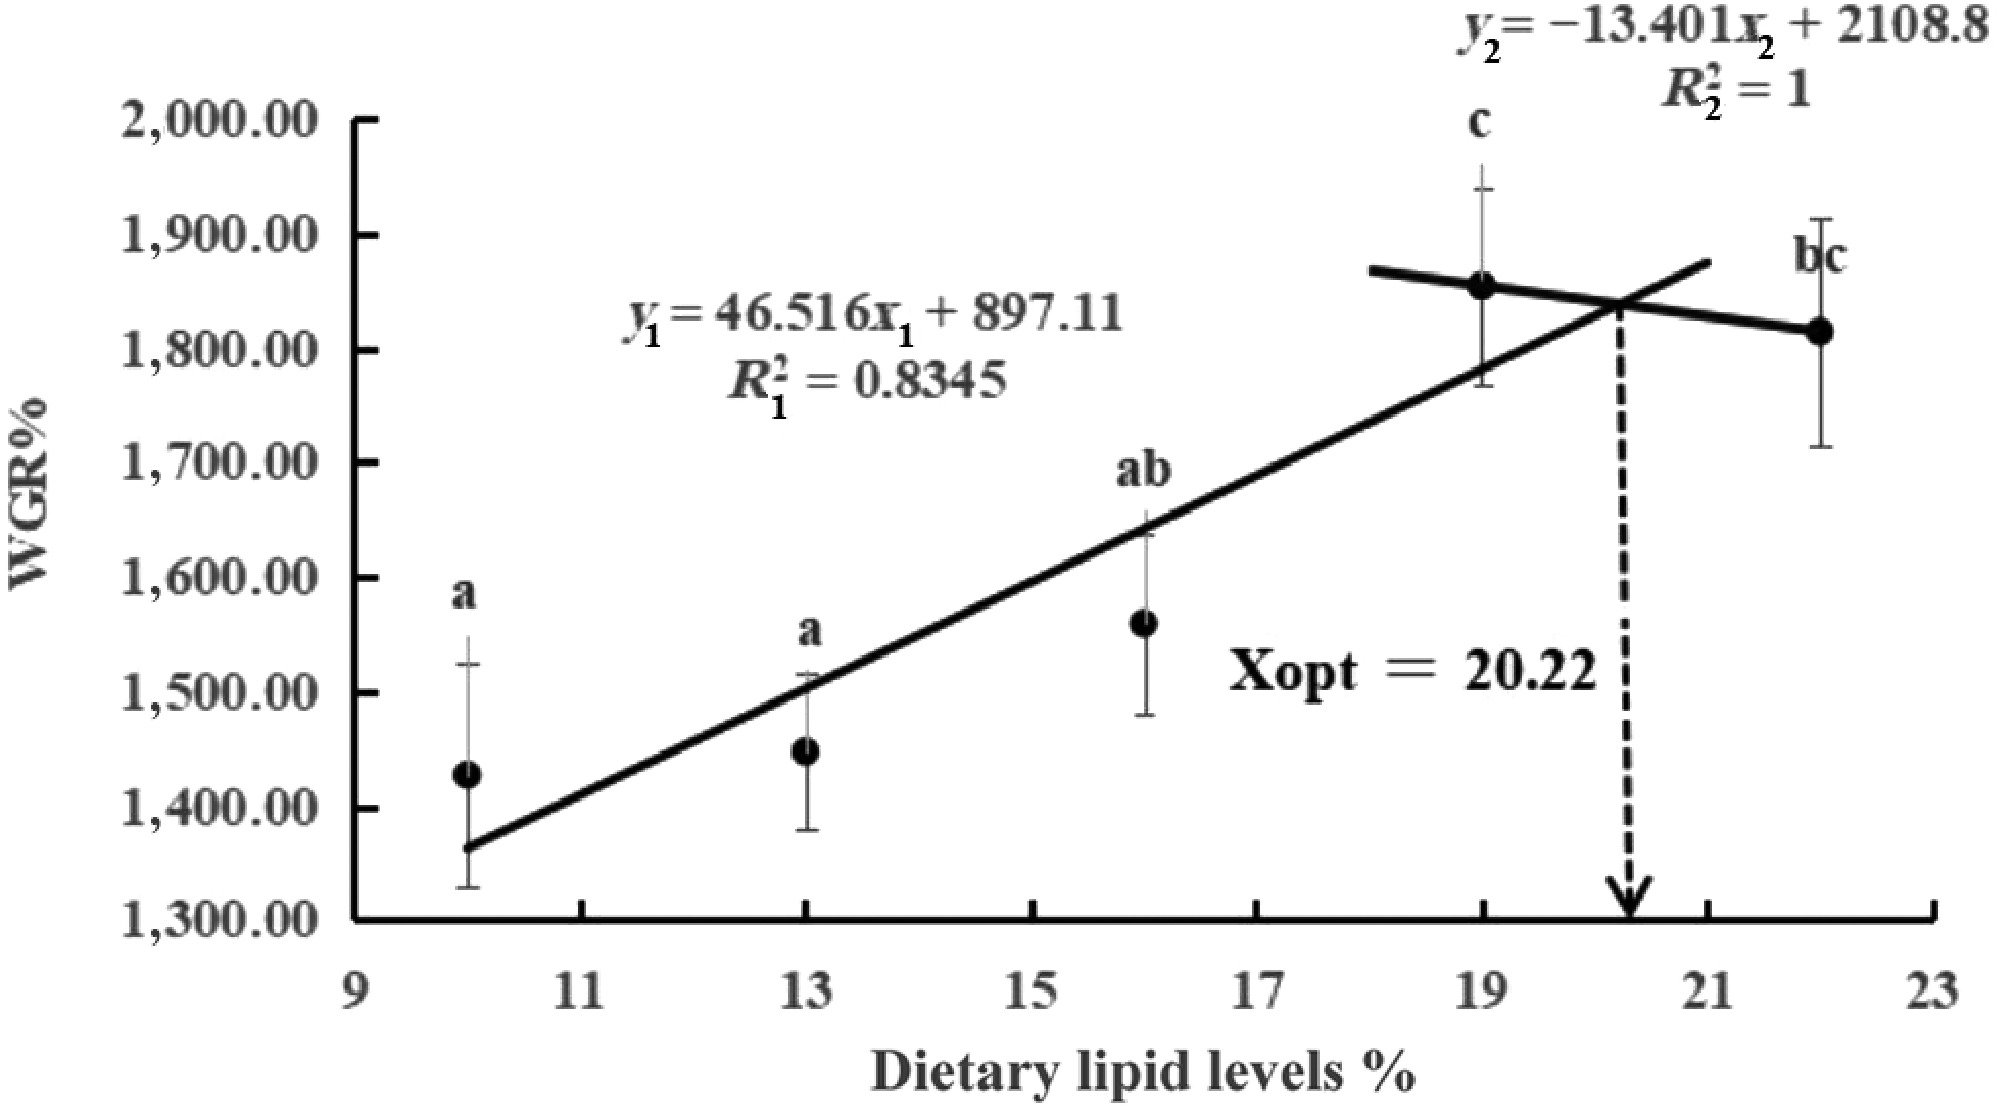
Figure 1.
Relationships between WGR (y) and dietary lipid level (x) for largemouth bass. The letters above the figure indicate significant differences among lipid levels (p < 0.05).
Body composition and nutrient retention
-
The crude lipid content of whole body composition increased as dietary lipid levels increased, while the moisture content showed the opposite changes (p < 0.05). The PR and LR showed an upward trend (p < 0.05). The crude protein and ash content were not significant compared with 11% and 22% lipids (p > 0.05, Table 3).
Table 3. Effect of lipid level on body composition and nutrient retention of largemouth bass (n = 4).
Items Group L11 Group L13 Group L16 Group L19 Group L22 Moisture, % 81.61 ± 0.18d 79.45 ± 0.93bc 80.48 ± 0.37cd 78.15 ± 0.42ab 77.1 ± 0.94a Crude protein, % 13.05 ± 0.18 14.09 ± 0.68 13.05 ± 0.22 14.09 ± 0.24 14.32 ± 0.58 Crude lipid, % 1.99 ± 0.11a 2.95 ± 0.10b 3.39 ± 0.13c 4.50 ± 0.07d 5.32 ± 0.13e Ash, % 3.04 ± 0.06 3.29 ± 0.15 2.91 ± 0.04 3.11 ± 0.09 3.19 ± 0.17 PR, % 22.97 ± 0.42a 24.99 ± 1.30ab 23.42 ± 0.50a 25.53 ± 0.47ab 26.31 ± 1.18b LR % 17.81 ± 1.01a 22.8 ± 0.80bc 21.81 ± 0.91b 24.53 ± 0.32cd 25.19 ± 0.66d Digestive enzymes and protein metabolism enzyme activities
-
According to Table 4, the lipase content in the L22 group was significantly higher than that in the L11 group. There were no significant differences in trypsin, amylase, and γ-GT content among the five lipid groups (p > 0.05).
Table 4. Effects of lipid level on digestive enzymes and protein metabolic enzyme activity of largemouth bass.
Items Group L11 Group L13 Group L16 Group L19 Group L22 Digestive enzyme activity Trypsin, U/mg protein 2.36 ± 0.31 2.17 ± 0.41 2.02 ± 0.43 1.99 ± 0.29 1.86 ± 0.35 Lipase, U/mg protein 20.28 ± 2.18a 27.23 ± 4.24ab 27.41 ± 4.94ab 28.27 ± 15.69ab 34.68 ± 6.07b Amylase, U/mg protein 1.58 ± 0.18 1.59 ± 0.25 1.82 ± 0.22 1.79 ± 0.17 1.77 ± 0.15 Protein metabolic enzyme activity γ-GT, U/L 11.48 ± 2.29 12.22 ± 2.69 11.84 ± 2.22 10.49 ± 1.47 11.23 ± 2.19 Liver biochemical and immune antioxidant indexes
-
Changes in fish liver biochemical and immune antioxidant indexes are presented in Table 5. The AST and ALT contents in the L22 group were significantly lower than those in the other lipid groups (p < 0.05). The TG and GLU activities first increased as dietary lipid levels increased and then decreased (p < 0.05). Furthermore, the MDA content was highest in the L22 group, and the AKP of the L19 group was significantly lower than that of the L11 group (p < 0.05). There were no significant difference in CAT, GSH-Px, T-SOD, POD, and LZM among the dietary treatments (p > 0.05). The dietary lipid requirements estimated on the basis of ALT was 16.06% (y3 = −2.6651x32 + 85.629x3 − 566.91, R32 = 0.886; Fig. 2).
Table 5. Effects of lipid levels on physiological biochemistry and immune antioxidant indexes of largemouth bass.
Items Group L11 Group L13 Group L16 Group L19 Group L22 Physiological biochemistry ALT, U/g protein 53.92 ± 2.47b 103.92 ± 3.29d 128.43 ± 10.55e 80.94 ± 2.09c 13.82 ± 0.34a AST, U/g protein 115.2 ± 7.02d 75.08 ± 25.07c 58.54 ± 2.70b 47.13 ± 1.01b 28.64 ± 1.27a TG, mmol/g protein 0.74 ± 0.10a 1.01 ± 0.1b 1.29 ± 0.05c 0.76 ± 0.03a 1.16 ± 0.04bc GLU, mmol/g protein 0.72 ± 0.07a 1.04 ± 0.26ab 1.82 ± 0.09c 0.99 ± 0.04ab 1.52 ± 0.18bc Antioxidant indexes CAT, U/mg protein 11.07 ± 1.20 10.06 ± 0.68 9.81 ± 0.71 12.36 ± 0.95 11.54 ± 0.10 GSH-Px, U/mg protein 1.13 ± 0.20 1.17 ± 0.34 1.62 ± 0.42 1.35 ± 0.30 1.41 ± 0.18 T-SOD, U/mg protein 147.04 ± 6.13 148.36 ± 3.78 158.22 ± 9.01 164.77 ± 9.09 164.59 ± 7.12 POD, U/mg protein 1.15 ± 0.21 1.07 ± 0.07 1.26 ± 0.12 1.28 ± 0.10 1.18 ± 0.10 MDA, mmol/mg protein 2.63 ± 0.14a 2.88 ± 0.21ab 2.94 ± 0.32ab 3.36 ± 0.46ab 5.28 ± 1.82b Immune indexes AKP, U/mg protein 3.26 ± 0.37b 2.95 ± 0.26ab 2.62 ± 0.28ab 2.15 ± 0.19a 2.57 ± 0.29ab LZM, U/mg protein 53.94 ± 4.24 48.55 ± 3.63 52.72 ± 2.31 57.47 ± 3.33 56.17 ± 3.82 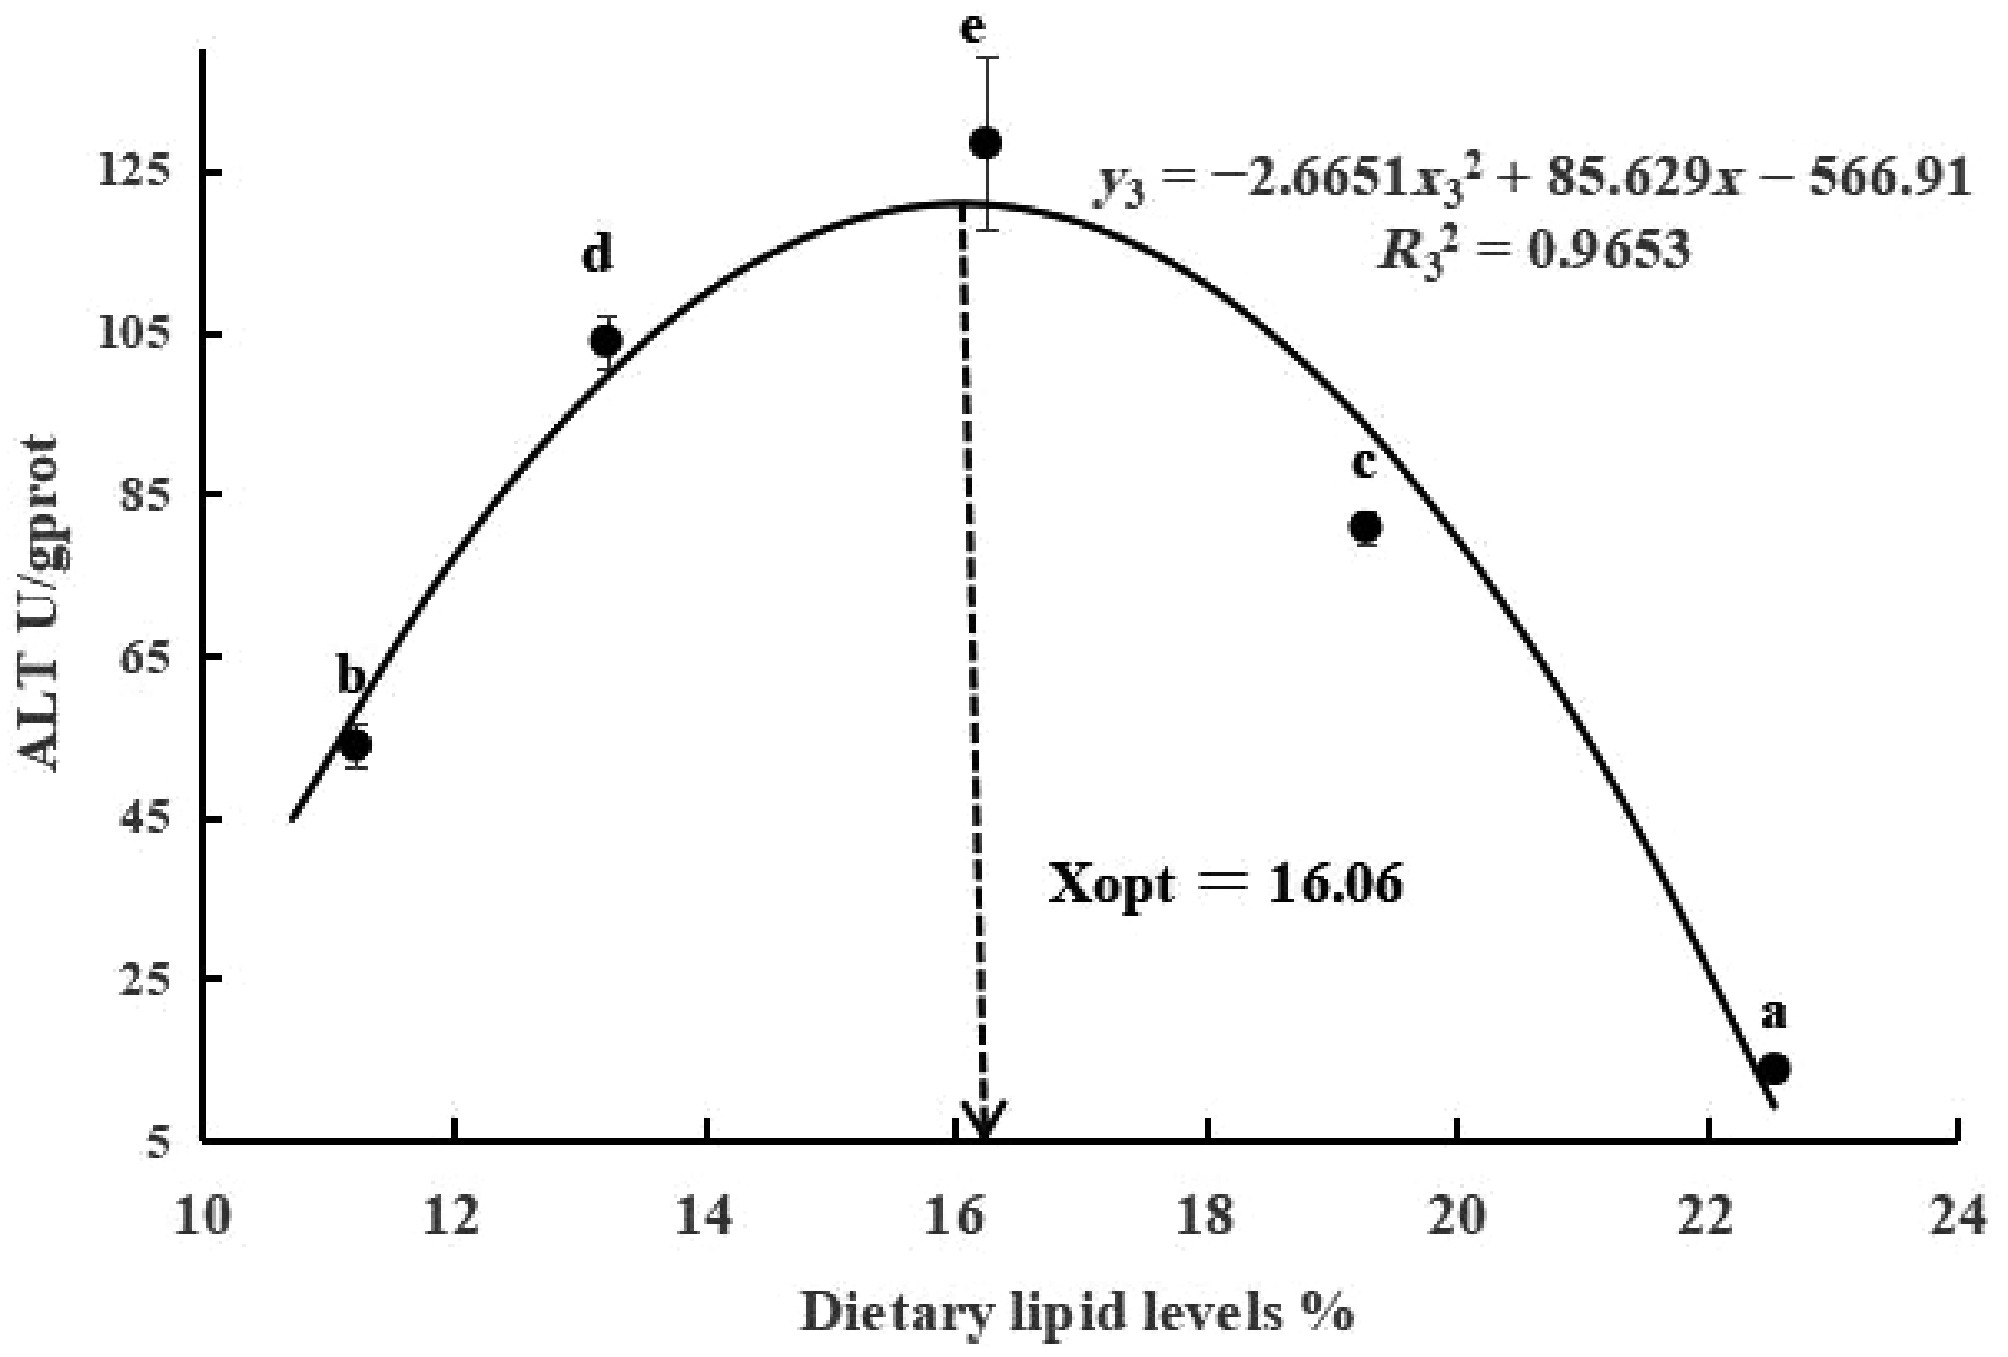
Figure 2.
Relationships between ALT (y) and dietary lipid levels (x) for largemouth bass. The letters above the figure indicate significant differences among lipid levels (p < 0.05).
Intestinal morphology
-
According to Table 6, compared with those in the other lipid groups, the width of intestinal villi in the L16 group were significantly greater (p < 0.05), and villus height, muscular thickness, and goblet cell number were not different among all the groups (p > 0.05). The morphology of the intestinal tissue of largemouth bass is shown in Fig. 3, and the villus structure of each group's intestines was intact and well developed.
Table 6. Effects of lipid levels on the intestinal structure of largemouth bass (n = 40).
Items Group L11 Group L13 Group L16 Group L19 Group L22 Villus height, μm 233.69 ± 11.79 210.18 ± 12.89 229.85 ± 10.70 241.71 ± 9.89 246.19 ± 15.93 Villus weight, μm 59.61 ± 3.04a 67.88 ± 1.97b 76.87 ± 3.35c 61.89 ± 1.34a 61.36 ± 2.53a Muscle thickness, μm 26.08 ± 2.71 23.86 ± 1.36 23.89 ± 1.40 24.46 ± 2.44 25.99 ± 1.56 Goblet cells, number 231.75 ± 1.01 248.20 ± 0.91 248.00 ± 1.01 222.40 ± 0.91 287.00 ± 1.01 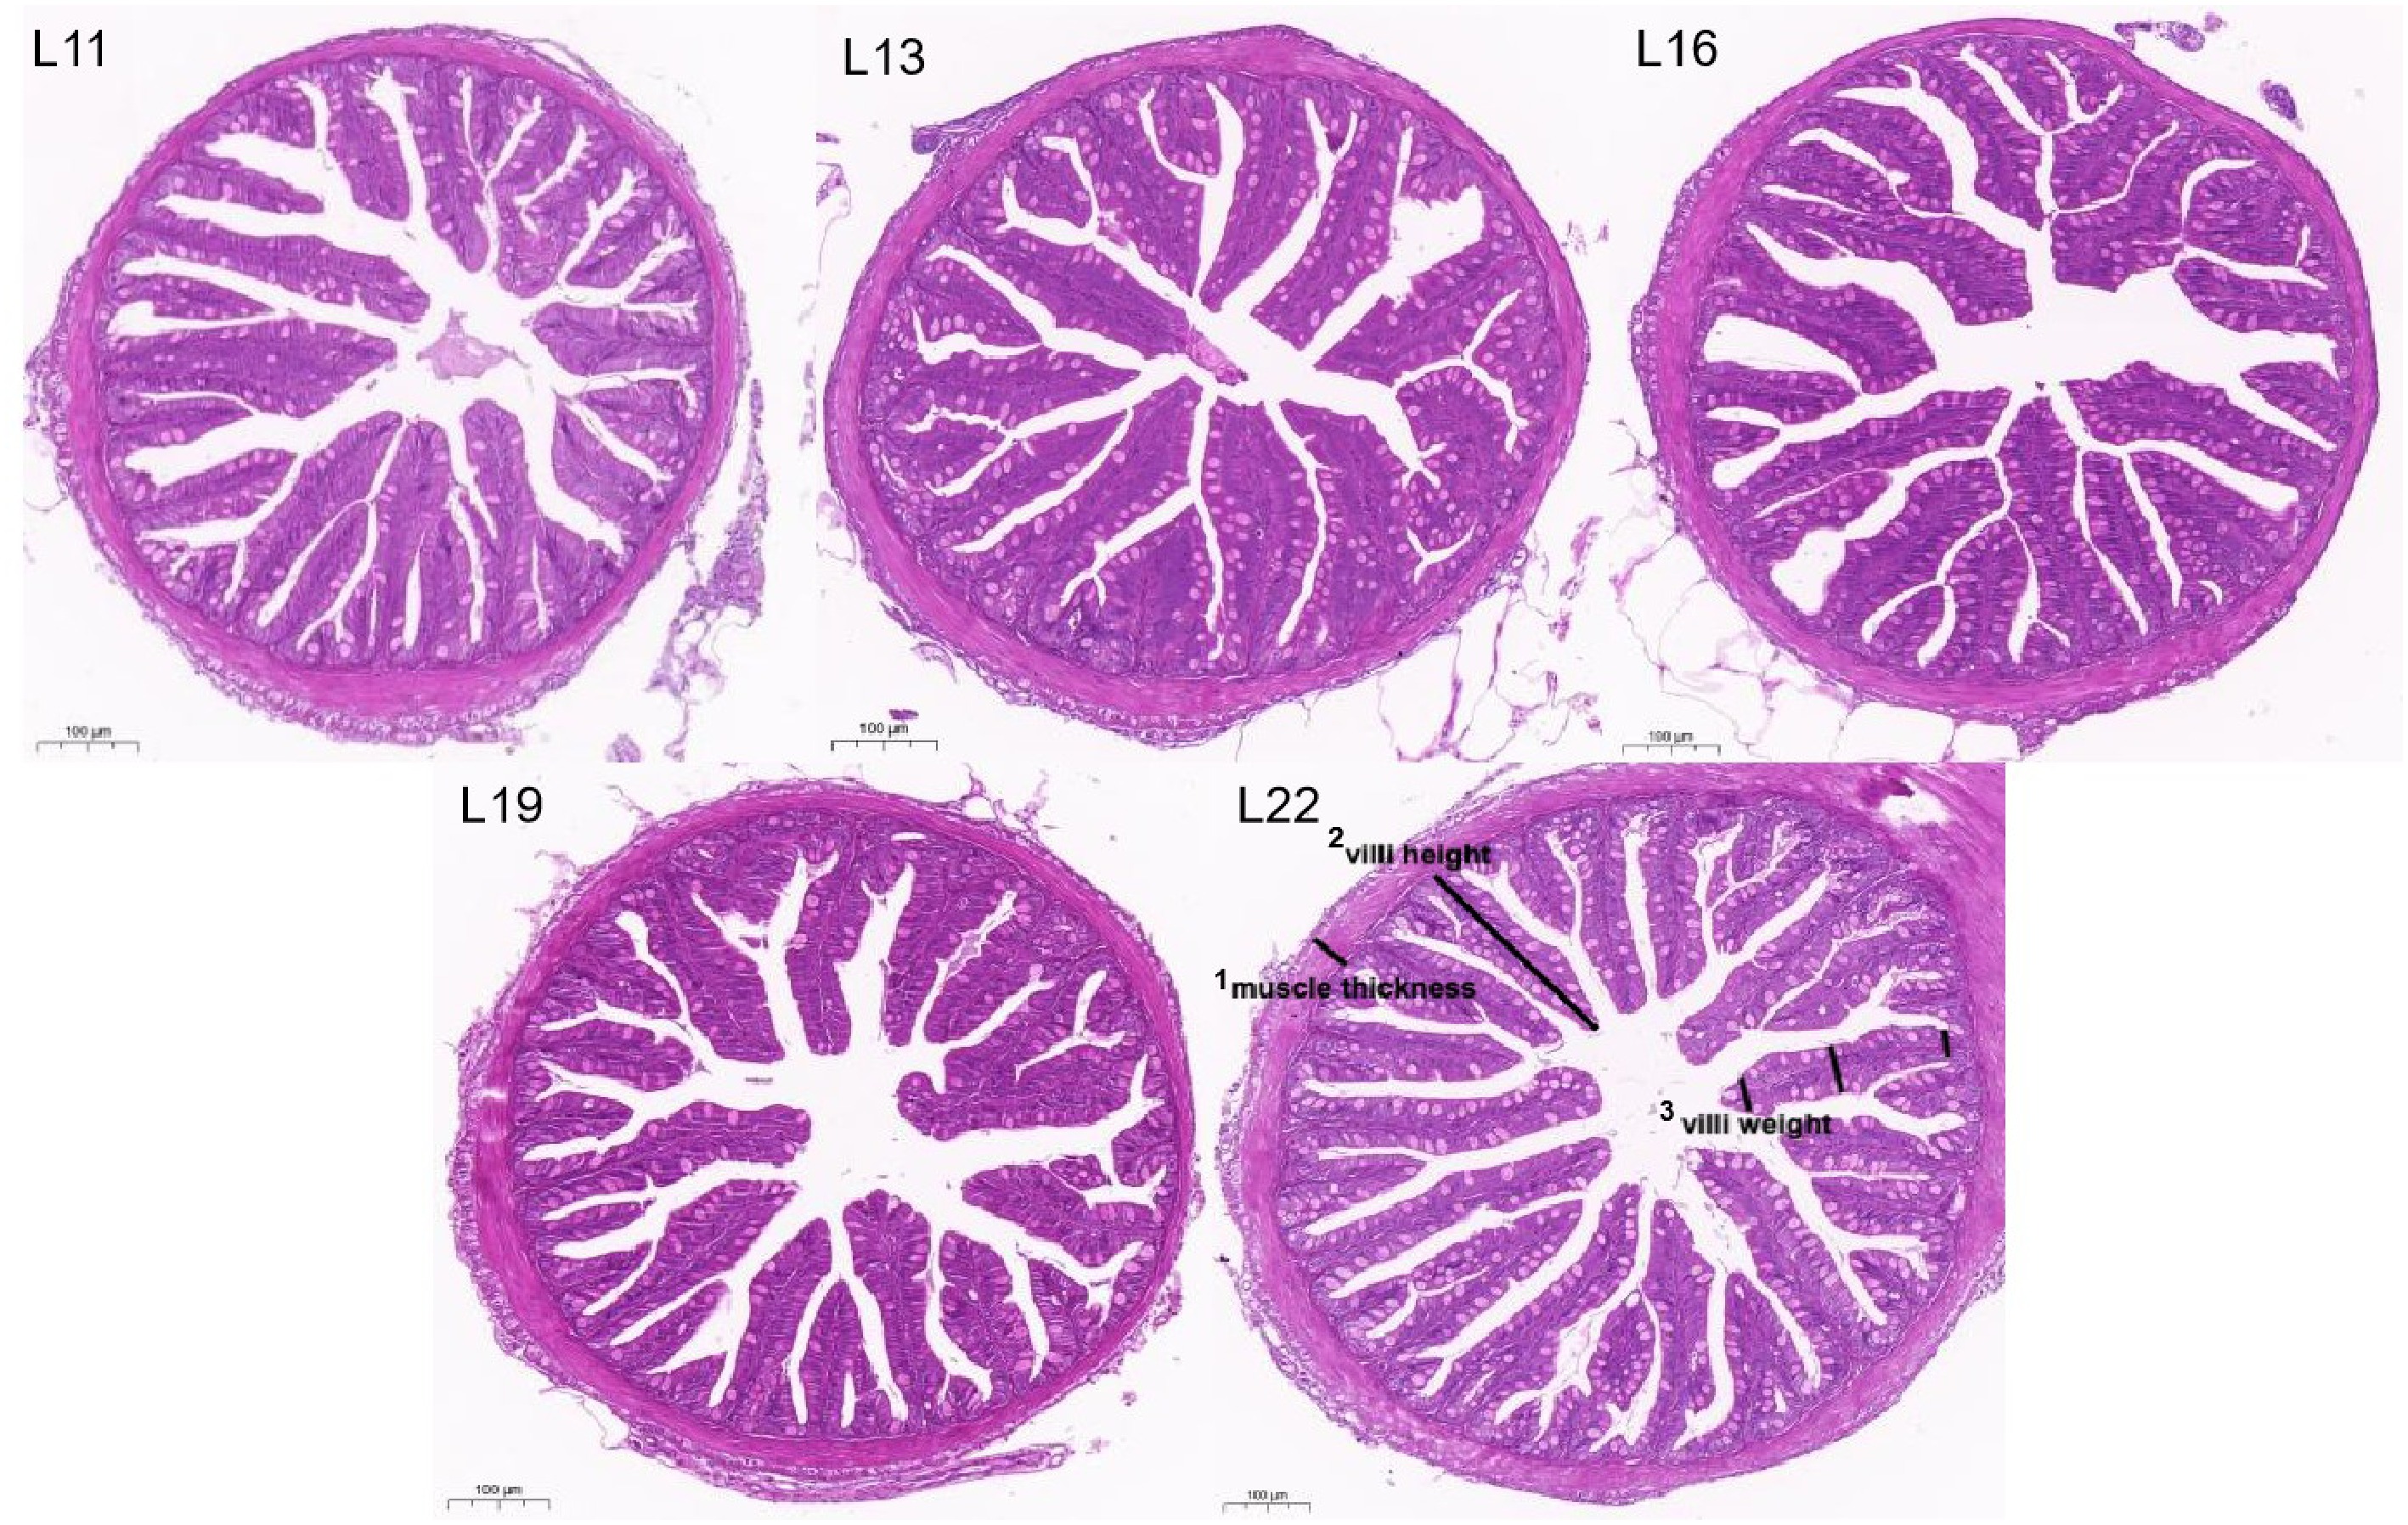
Figure 3.
Intestinal morphology and structure in largemouth bass from each group (H&E staining, 10× magnification). 1 Muscle thickness: The thickness of the annular and longitudinal muscles of the intestine, i.e., the vertical distance from the base of the submucosa to the serosal layer. 2 Villus height: vertical distance from the base to the tip of the intestinal villi. 3 Villus weight: the distance from the main villus of the intestine to its small branching structures.
-
Growth performance is one of the key indices for evaluating the quality of aquatic feed formulations. In the present experiment, as the level of dietary lipids increased, the SGR and WGR of larval largemouth bass initially increased and then decreased, similar to the research results of many fish species[16−19]. The hypothesized explanation suggests that when fish fail to consume sufficient exogenous lipids, their overall food intake decreases, leading to slowed growth. Alternatively, when energy availability is inadequate, the organism prioritizes survival over growth, resulting in reduced energy allocation to body length and weight gain. At optimal dietary lipid levels, the appropriate lipid content in aquatic diets can be fully utilized by the fish, providing essential fatty acids, lipid-soluble vitamin carriers, and precursors for growth-related genes, which promotes the rapid growth of the fish and enabling them to adapt to complex external environments[20]. Meanwhile, when the lipid level was excessively high in the L22 group, the VSI content in larval largemouth bass was significantly elevated. This condition may lead to oxidative stress and inflammation in the liver, indicating that further research is necessary in the future. According to the growth performance index, the optimum lipid level for larval largemouth bass (0.06–1.17 g) was 20.16%, which was higher than the suitable lipid content for juvenile largemouth bass (34–112.16 g, 14%)[21]. Thus it can be seen that carnivorous fish larvae have a faster metabolism and a higher demand for lipids than juvenile fish, which promote their rapid growth and provide basic data for precise nutrition of larval fish. Similarly, the results of this study were consistent with those for pikeperch (Sander lucioperca)[22,23] but opposite to those of carp (Carassius auratus gibelio)[24]. It is speculated that the reason may be that compared with carnivorous fish, the digestive system of omnivorous fish larvae is underdeveloped, resulting in lower absorption and digestion capacity for lipids.
As the main components of the fish body, moisture, crude protein, crude lipid, and ash content can indicate the nutritional status of the fish body[25]. Routroy et al.[19] found that in Anabas testudineus Bloch., both crude lipid (0.34–2.46 g) and protein contents (8.17%–8.30%) increased, while moisture content decreased with increasing dietary lipid levels. The results of that report were similar to the results of this study, indicating that during the larval stage, suitable lipids in the diet can sufficiently meet the protein and lipid requirements for energy metabolism, growth, and development in largemouth bass, thereby promoting rapid growth. The PR and LR in this experiment once again validated this finding. At the same time, L22 can promote the lipid and protein metabolism of largemouth bass larvae, but inhibits the protein synthesis of juveniles (13.38–41.82 g, 10%)[11]. This indicates that although the digestive structure of largemouth bass larvae is not as complete as that of juveniles, their metabolic capacity is stronger than that of juvenile fish, providing a new idea for preparing microdiets.
In our research, lipase activity increased with increasing lipid levels, while trypsin and amylase activity in largemouth bass did not show significant changes. However, research on and larval lumpfish (Cyclopterus lumpus, 1.7–60 g, 6.7%–18%)[26], blue gourami (Trichogaster trichopterus, 0.61–7.69 g, 8%)[27], and juvenile Asian red-tailed catfish (Hemibagrus wyckioides, 3.20–30 g, 9.4%–11.1%)[28] has found that a high-lipid diet can improve trypsin activity. The differences between our research results and those of other studies may be due to variations in the breeding species and size, the breeding environment, and lipid sources. γ-GT was a key enzyme involved in the final hydrolysis and assimilation of intestinal proteins in fish[29,30]. In this study, γ-GT remained stable, indicating that the lipid gradient designed did not reduce the digestion and absorption capacity of protein in larvae in our experiment. Moreover, the intestine is a crucial digestive site for aquatic animals, and the intestinal morphology of largemouth bass reflects its capacity for food digestion and absorption. However, there are currently no relevant data on the effects of dietary lipid levels on its intestinal health. Previous studies have shown that a reasonable level of lipids in the diet can optimize the intestinal structure of fish[31,32]. In this experiment, the villus width of the L16 group was the highest, consistent with the research results above. The speculated reason is that healthy fish intestines can more effectively digest and absorb the nutrients present in feed, improve feed utilization and conversion rates, and promote their growth[33,34].
The activities of liver ALT and AST directly reflect the health status of the fish liver and indirectly reflect the efficiency of protein synthesis, and are often used as effective indicators to evaluate nutritional status[35−37]. As the lipid content increased, the AST content decreased. This may be because the low-lipid diet (L11) failed to meet the energy demands required for normal growth and development in fish, triggering a compensatory protein metabolism response that upregulated AST production. Within an appropriate range of lipids, changes in AST content remain stable. High lipid levels (L22) can cause oxidative stress in fish, which may lead to a decrease in liver AST content and an increase in serum AST content[38], thereby reducing liver damage. Further investigations are warranted to elucidate the mechanistic interplay between hepatic and serum transaminase dynamics in piscine systems. In addition, in this study, the activities of ALT, TG, and GLU first increased and then decreased. This indicated that at appropriate lipid levels, the ability of fish to absorb carbohydrates, lipids, and proteins was enhanced. When the lipid level is too high, the free fatty acids in fish also increase, and their fat breakdown reaction was smaller than the synthesis reaction, leading to excessive fat deposition in the body and causing oxidative damage. Therefore, based on the ALT activity, the results of the quadratic regression analysis indicated that the optimal dietary lipid level was 16.06%.
MDA is a lipid peroxidation product and is considered a biomarker for evaluating oxidative stress and lipid peroxidation in aquatic animals[39]. Fan et al.[38] and Li et al.[40] both found that with increasing lipid content, the MDA content continued to rise in juvenile Amur grayling (Thymallus arcticus grubei Dybowski, 4.64–10.41 g, 16.52%–16.62%) and Amur sturgeon (Acipenser schrenckii, 4.16–59.6 g, 20.31%), which was similar to the results of this experiment. This may be a result of excessive exogenous fat causing antioxidant stress in fish, resulting in excessive levels of polyunsaturated fatty acids in the body. After being attacked by oxygen free radicals, a large amount of lipid peroxides were generated, leading to an increase in MDA. Additionally, AKP is an important indicator of nonspecific immunity, playing a crucial role in the body's immune response to foreign pathogens and also participates in lipid metabolism and processing[41,42]. In this study, the AKP activity decreased in the L22 group, indicating that the immune system of fish fed a high-lipid diet was weakened. The specific mechanism by which high levels of lipids affect the body's immune function still needs further research. In conclusion, the liver function of the L22 group of largemouth bass was negatively affected. Most indices in their antioxidant and immune systems remained within self-regulatory ranges, suggesting no immediate impact on normal growth in the short term; however, certain indicators were disrupted, indicating that fish larvae are unsuitable for long-term high-lipid diets.
-
In summary, on the basis of the WGR of largemouth bass larvae, the most suitable lipid level was 20.16%. According to liver biochemical indicators, the appropriate dietary lipid level was 16.06%. This was beneficial for accurately adjusting the nutritional needs of larval largemouth bass, optimizing their feed formula, and promoting the large-scale development of the aquaculture industry.
This study was funded by the Guangzhou Science and Technology Plan Project (202002020018) in Guangdong Province.
-
All programs were reviewed and preapproved by the Animal Welfare Ethics Committee of the Institute of Animal Science (Fisheries Research Institute) of Guangdong Academy of Agricultural Sciences (GAAS20220602) approval date: 2 June 2022. The research strictly adhered to the principles of 'replacement, reduction, and refinement' to minimize harm to the animals, with their health and wellbeing prioritized throughout the experimental process.
-
The authors confirm their contributions to the paper as follows: project management, funding procurement, and manuscript review and editing: Wang G; investigation: Li Y, Xie Y, Liang H, Chen X, Hu J, Zhu X, Wang G; formal analysis: Li Y, Xie Y, Liang H, Chen X, Hu J, Zhu X; writing – original draft: Li Y, Xie Y. All authors reviewed the results and approved the final version of the manuscript.
-
The datasets generated during and/or analyzed during the current study are available from the corresponding author on reasonable request.
-
The authors declare that they have no conflict of interest.
- Copyright: © 2026 by the author(s). Published by Maximum Academic Press on behalf of Nanjing Agricultural University. This article is an open access article distributed under Creative Commons Attribution License (CC BY 4.0), visit https://creativecommons.org/licenses/by/4.0/.
-
About this article
Cite this article
Li Y, Xie Y, Liang H, Chen X, Hu J, et al. 2026. Optimum level of lipid in granulated microdiets for largemouth bass (Micropterus salmoides) larvae. Animal Advances 3: e011 doi: 10.48130/animadv-0025-0036 

Optimum level of lipid in granulated microdiets for largemouth bass (Micropterus salmoides) larvae
- Received: 19 May 2025
- Revised: 11 July 2025
- Accepted: 14 August 2025
- Published online: 10 March 2026
Abstract: This experiment was conducted to investigate the optimum lipid requirement for largemouth bass larvae. A total of 2,000 larval largemouth bass (0.06 ± 0.01 g) were randomly divided into five groups with four replicates per group. The fish were fed lipid contents of 11.22%, 13.22%, 16.25%, 19.28%, and 22.45%, denoted as L11, L13, L16, L19, and L22, respectively. The rearing trial lasted for 4 weeks. The results showed that with the dietary lipid levels increased, the weight gain rate (WGR) and specific growth rate (SGR) of largemouth bass first increased and then decreased, and the L19 group was the largest. The feed conversion ratio (FCR) decreased. The condition factor (CF) of the L11 group was significantly higher than that of other groups (p < 0.05). According to the line model calculation, when the lipid content was 20.22%, the WGR reached its maximum value. Increasing dietary lipid levels elevated crude lipid content, while moisture content significantly decreased (p < 0.05). The protein retention (PR) and lipid retention (LR) showed an upward trend (p < 0.05). The lipase content in the L22 group were significantly higher than that in the L11 group (p < 0.05). The aspartate transaminase (AST) and alanine transaminase (ALT) content in the L22 group was significantly lower than those in other groups as dietary lipid increased (p < 0.05). With increasing lipid levels, the activities of triglyceride (TG) and glucose (GLU) first increased and then decreased (p < 0.05). Furthermore, the L22 group had a higher malondialdehyde (MDA) than the other groups (p < 0.05). The alkaline phosphatase (AKP) of the L19 group was significantly lower than that of the L11 group (p < 0.05). ALT was correlated with the dietary lipid level, and the regression equation was y3 = −2.6651x32 + 85.629x3 − 566.91. The width of intestinal villi in the L16 group was significantly higher than that in the other groups (p < 0.05). In summary, on the basis of the growth performance of largemouth bass larvae, the suitable dietary lipid level was 20.16%. According to liver biochemical indicators, the appropriate dietary lipid level was 16.06%.