


-
Soil carbon pool, a key component to achieve carbon neutrality required for the Paris Agreement, stores a substantial portion of total carbon (~80%, 2,500 Gt C) in terrestrial ecosystems (3,170 Gt C)[1]. Even slight changes in the stability and bioavailability of soil C can dramatically alter atmospheric CO2 concentrations and further impact global climate. Indeed, approximately 14% of anthropogenic carbon (C) emitted to the atmosphere between 2009 and 2018 was associated with soil carbon destabilization[2]. Therefore, implementing C–neutral strategies, such as carbonaceous soil amendment, has perceived potential for GHG mitigation and concurrent soil C sequestration.
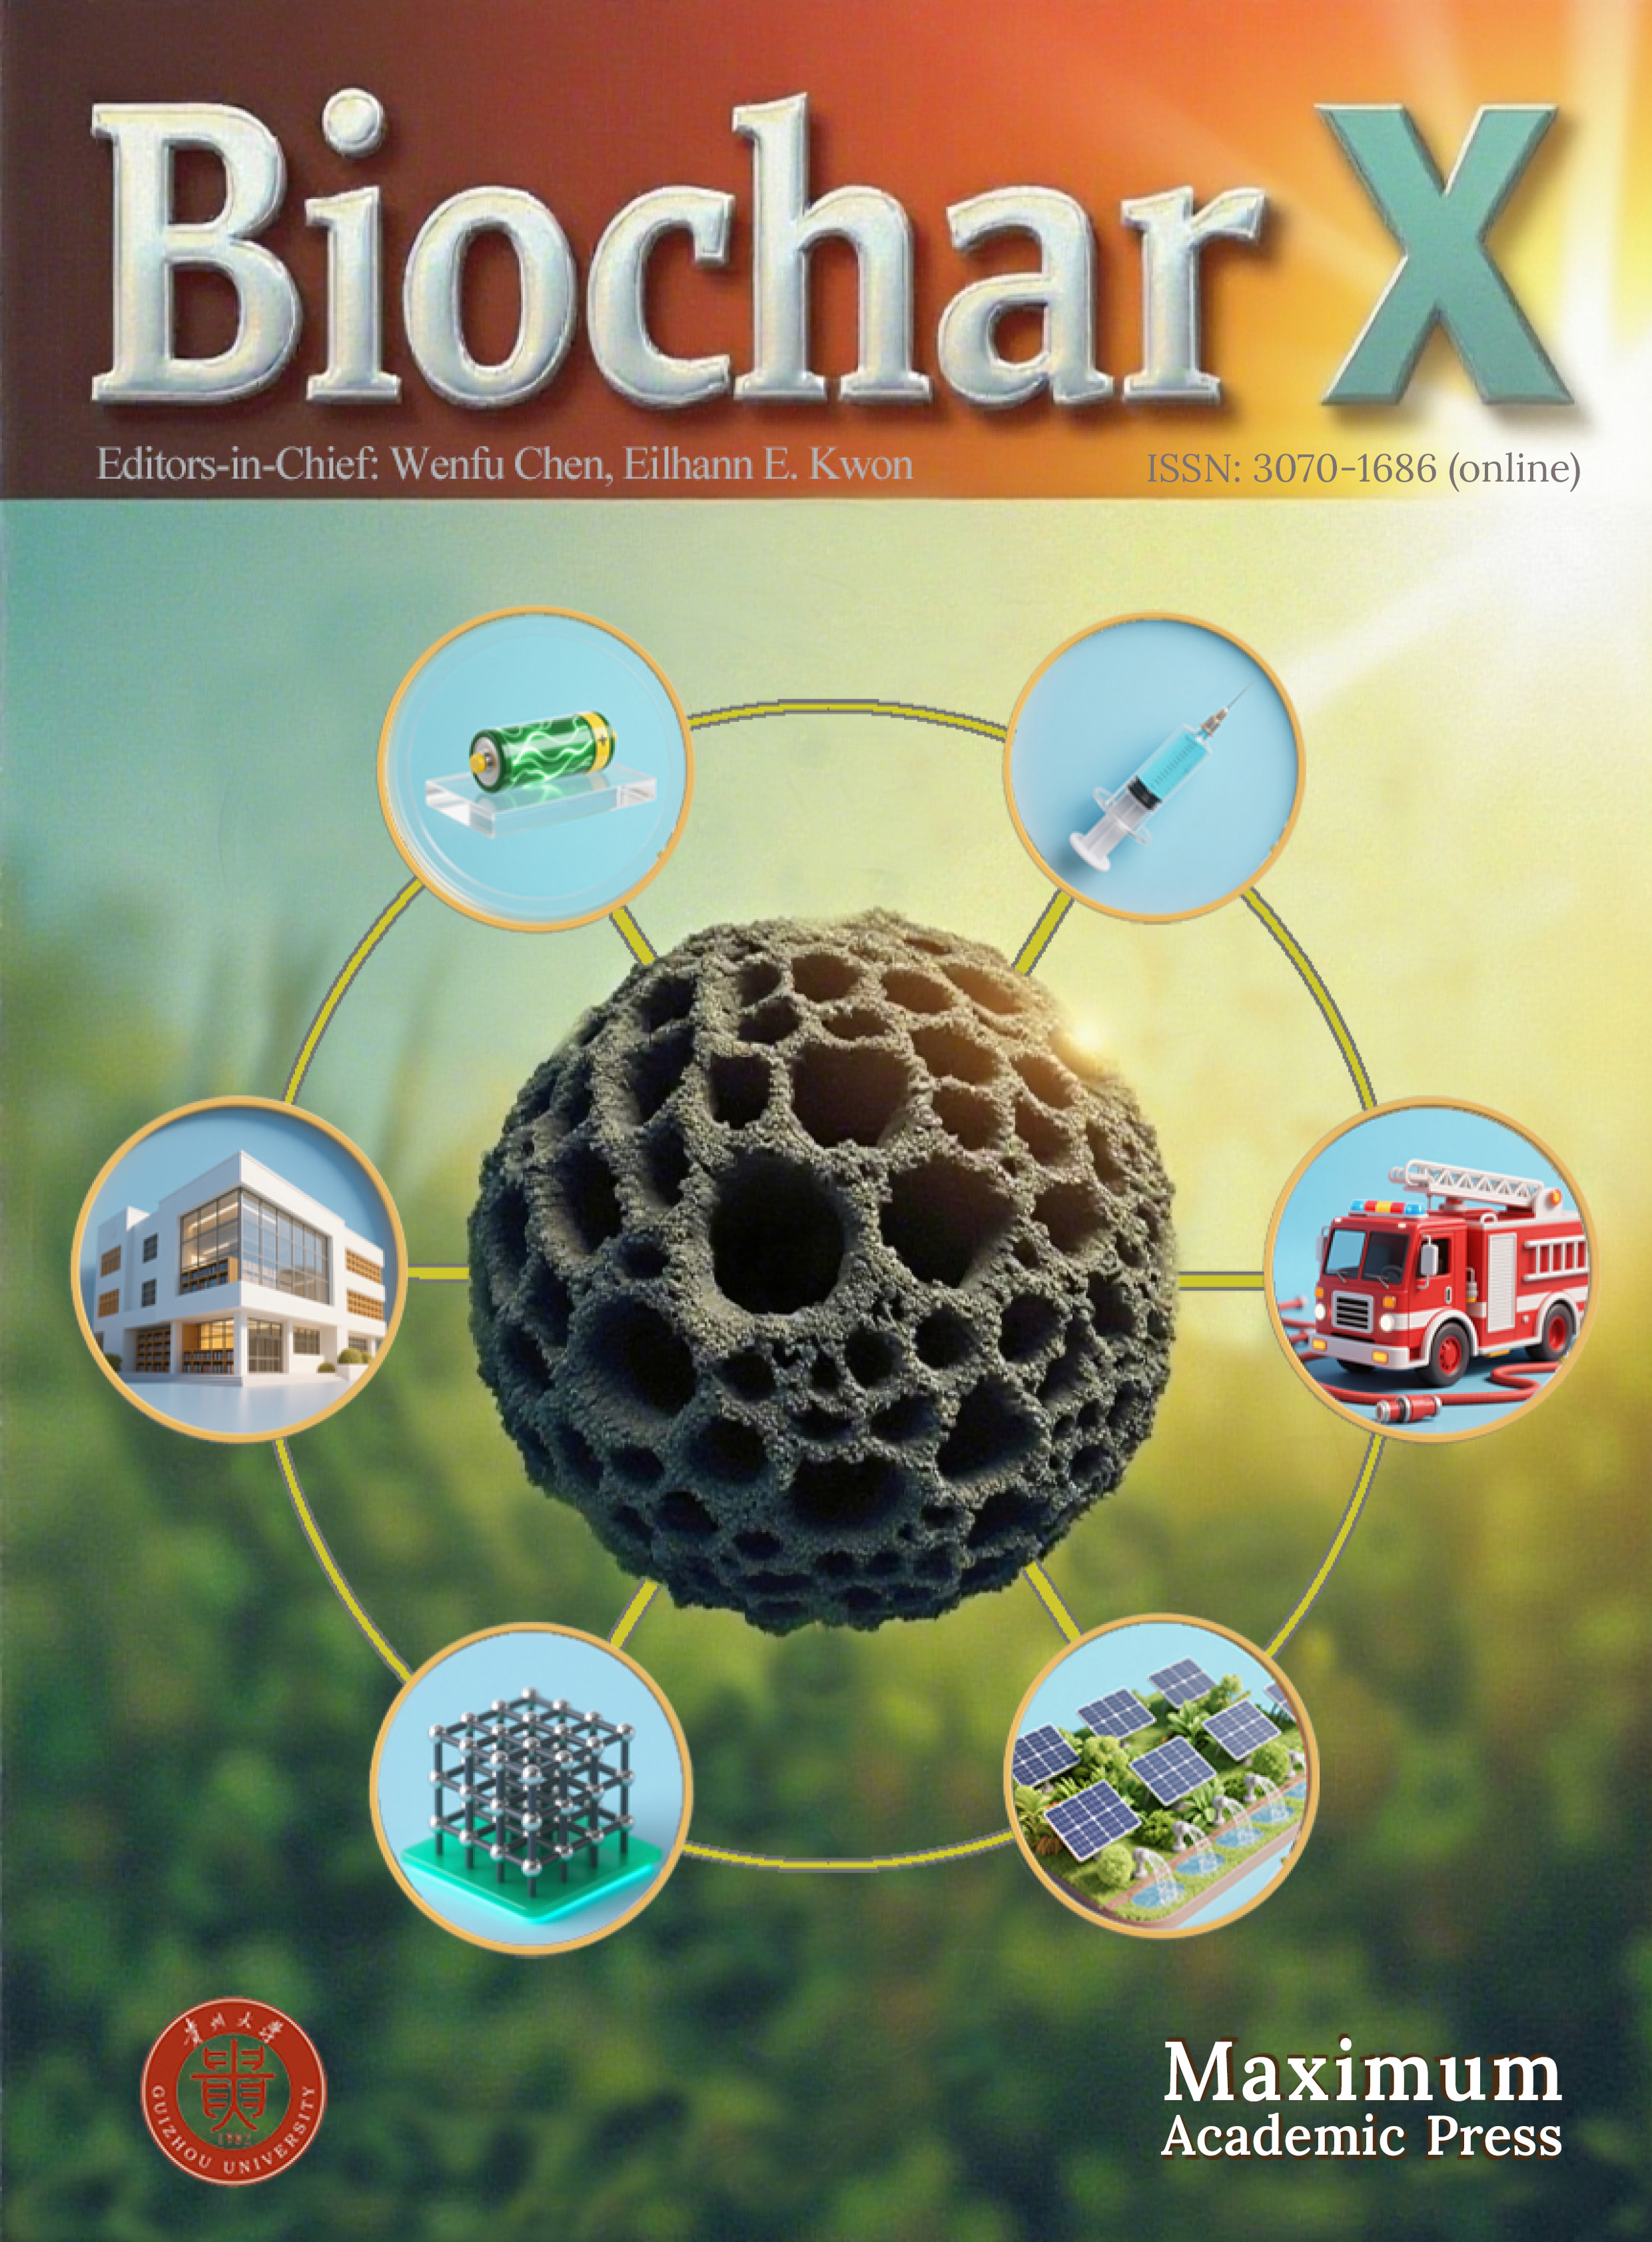
Biochar, a C-rich residue derived from anoxic thermochemical conversion of biomass, has attracted extensive research related to environmental and agricultural purposes (Fig. 1), particularly over the past decade[3−5]. A recent estimate suggests that biochar utilization could contribute to emission reductions of 3.4–6.3 Pg CO2 at the global scale[6]. Due to its highly refractory and environmentally resistant nature, biochar-C can be extremely stable and recalcitrant and, therefore, contribute to C storage for thousands of years. However, biochar characteristics and composition vary significantly depending on various factors, such as feedstock type and pyrolysis conditions (e.g., temperature, heating rate); consequently, the effectiveness of biochar as an environmental remediation agent or a soil amendment can also be inconsistent[3]. Several general characteristics of biochar can be summarized from existing literature: (1) it is a heterogeneous mixture with appreciable amounts of C (60%–90%), consisting of both amorphous incompletely-carbonized fractions and condensed graphitic structures[7]; (2) it has a three-dimensional porous conformation with high specific surface area and promising adsorption capacity[6,8]. The carbon–neutral effects of biochar are relevant not only to its properties but also to its role in carbon dynamics within the amended system.
Figure 1.
Schematic illustration of biochar used for soil carbon neutralization.
To date, an extensive body of research has explored the long-term C persistence and other concomitant effects of biochar application on soil. For instance, meta-analyses or review studies have demonstrated that biochar can increase plant growth by 9%–16% (and thereby input more crop residue C in soil)[8], lower GHGs emissions by 40%–64% (including both CO2 and non-CO2 gases, equivalent to 3.4–6.3 PgCO2e yr−1) from soil and/or reduce soil organic C mineralization[4]; furthermore, about 97% of recalcitrant biochar C contributes directly to long-term soil C sequestration, with an average residence time of 556 years[9]. The use of biochar can have a significant effect on the carbon cycle of soil in many direct and indirect ways. Although its major constituent, pyrogenic carbon, is very recalcitrant, biochar also facilitates stabilization of the native soil organic matter, making it less susceptible to loss[5,10].
Despite the vast scientific literature that has systematically investigated the physicochemical properties of biochar and environmental and agronomic benefits[3,4] associated with its production and utilization, particularly including pyrolysis techniques, soil health, crop production, contaminant removal or stabilization, C sequestration[1,2,7,8,10], etc., limited information is currently available regarding the underlying reaction mechanisms in relation to soil carbon neutrality and the influencing factors of carbon sequestration in soil subjected to biochar application. Also, a systematic analysis integrating the mechanisms, especially the priming effect (PE) and electron shuttling, multi-factorial drivers, and a critical comparison of assessment methodologies is still needed. These past syntheses have generally focused either on mechanistic routes or on practical, real-world uses, leaving a knowledge gap on how particular biochar properties directly translate to a verifiable carbon-neutral outcome. Moreover, current reviews of assessment methods tend to discuss IPCC, LCA, and IOA approaches without comparison and an integrated approach to the choice of a suitable tool according to research or policy objectives. The originality of this review lies in the fact that it is the first work to combine three critical and interrelated areas in a synthesis: (1) the basic processes of biochar-mediated carbon stabilization, with a definite emphasis on the priming effect as a control point; (2) a multi-factorial analysis of biochar production parameters (feedstock, pyrolysis temperature, dosage) in direct relation to soil carbon processes; and (3) a critical comparative assessment of carbon accounting procedures, offering a clear decision-making matrix for their application. It provides a comprehensive mechanism-to-methodology framework that bridges the gap between mechanistic knowledge in the rhizosphere, scalable optimization of production, and rigorous carbon accounting, and is thus critical in increasing biochar beyond a hypothetical idea into a measurable and policy-focused instrument to make soils carbon neutral. Thus, the objectives of this review are to: (1) elucidate the principles of using biochar for soil C sequestration; (2) explore the factors influencing soil C sequestration with biochar; and (3) evaluate methods for assessing the soil carbon footprint. Finally, several prospects for the future use of biochar in soil carbon neutrality are put forward.
-
The contribution of biochar to soil C neutralization is mainly manifested in the sequestration of soil C and the reduction of GHG emissions.
Enhancing soil C sequestration
-
Biomass, necromass, and soil have a significant impact on the global C or N cycle, primarily through their ability for C storage and release: biomass can absorb C or N from the atmosphere through photosynthesis and then release it via respiration[11−13]. Generally, C sequestration and CO2 release from biomass each account for 50% of the total, establishing a balance between inputs and outputs. Compared to pristine biomass, biochar produced through pyrolysis is less decomposable and has the capacity to effectively bind organic carbon (OC) present in the original biomass, thus preventing its rapid return to the atmosphere and achieving a 'carbon negativity'. Benefiting from a high C content and a strongly carboxylated aromatic C-based skeletal structure, biochar has strong stability and relatively low soil turnover (0.0046% d−1), with a mean residence time of hundreds to thousands of years[14,15]. When added to soil, biochar can remediate soil pollution, protect soil microbial communities, promote crop growth, increase the organic carbon content in soil, and improve carbon use efficiency[16−19]. The efficiency of biochar in increasing soil C was found to be associated with soil aggregates[20]. The application of biochar has been proven to promote the formation of soil aggregates, which then set up a series of physical or chemical protections that shield soil SOC[21−23]. These protections inhibit soil SOC degradation, thereby enhancing soil C sequestration. Consequently, biochar acts as a persistent carbon sink, achieving 'carbon negativity' both through its recalcitrant aromatic structure and by fostering aggregate formation that physically shields native soil organic carbon from decomposition.
On the other hand, the priming effect (PE) is also an important factor in assessing soil C neutrality, as it affects both soil C sequestration and soil GHG emissions. Biochar addition can result in a positive, negative, or neutral PE, as shown in previous studies[21,24−27]. It is generally accepted that soil C can be efficiently fixed only when biochar induces a negative PE on SOC[14,28,29]. This negative PE can be attributed to several mechanisms. Firstly, the porous biochar can encapsulate SOC, shielding it from soil microorganisms and inhibiting its mineralization and decomposition. Additionally, biochar can adsorb SOC, providing further protection from degradation. Such pore encapsulation and surface adsorption of biochar hinder microbial access to SOC, thus slowing down respiration and inducing a negative PE. Secondly, when incorporated into mineral-rich soil, biochar can form stable complexes with organic carbon and inorganic minerals, promoting the fixation of organic carbon. SOC bonded to soil minerals is transformed by plants or microbes and can be protected by the chemical bonds of minerals, thereby increasing its persistence. Additionally, biochar produced from certain biomass sources may contain toxic constituents such as polycyclic aromatic hydrocarbons (PAHs), phenolics, and persistent free radicals (PFRs) formed during pyrolysis, which may inhibit soil microbial activity and reduce soil carbon emissions[30−33]. The mechanisms underlying positive and negative PE are summarized in Fig. 2. Understanding the mechanisms of PE will facilitate the achievement of soil carbon neutrality. The efficiency of biochar in the sequestration of carbon has been proven to vary depending on the feedstock source and the texture of the receiving soil. Comparative research identifies the following interactions: in paddy soils rich in clay, rice straw biochar has been observed to increase SOC by 12%–18% over three to five years, primarily by stimulating the development of aggregates and mineral association. In contrast, in coarse-textured wheat fields, the increase is only 5%–8%[34]. Similarly, biochar derived from wood chips (high in lignin) has a better long-term stability with a mean residence time of over 500 years in temperate forest soils, in comparison with manure-derived biochar, which, although mainly containing higher amounts of nutrients, has a faster turnover rate of 30–50 years because of some labile C fractions and the fact that it is more active than manure-derived biochar[9]. Such feedstock-soil texture interactions are critically important. For example, poultry litter biochar applied to sandy loam soil can substantially increase particulate organic carbon (POC) but yields less mineral-associated organic carbon (MAOC), whereas poultry litter biochar applied to clay loam can yield greater accrual of MAOC, resulting in more persistent sequestration[35]. This indicates that to maximize the negative carbon potential of biochar, its properties must be matched to the soil context. For instance, the high aromaticity of wood-derived biochar suits stable carbon sinks in sandy soils, while the reactive surface of crop residue- derived biochar can be leveraged to enhance aggregate formation in clay soils.
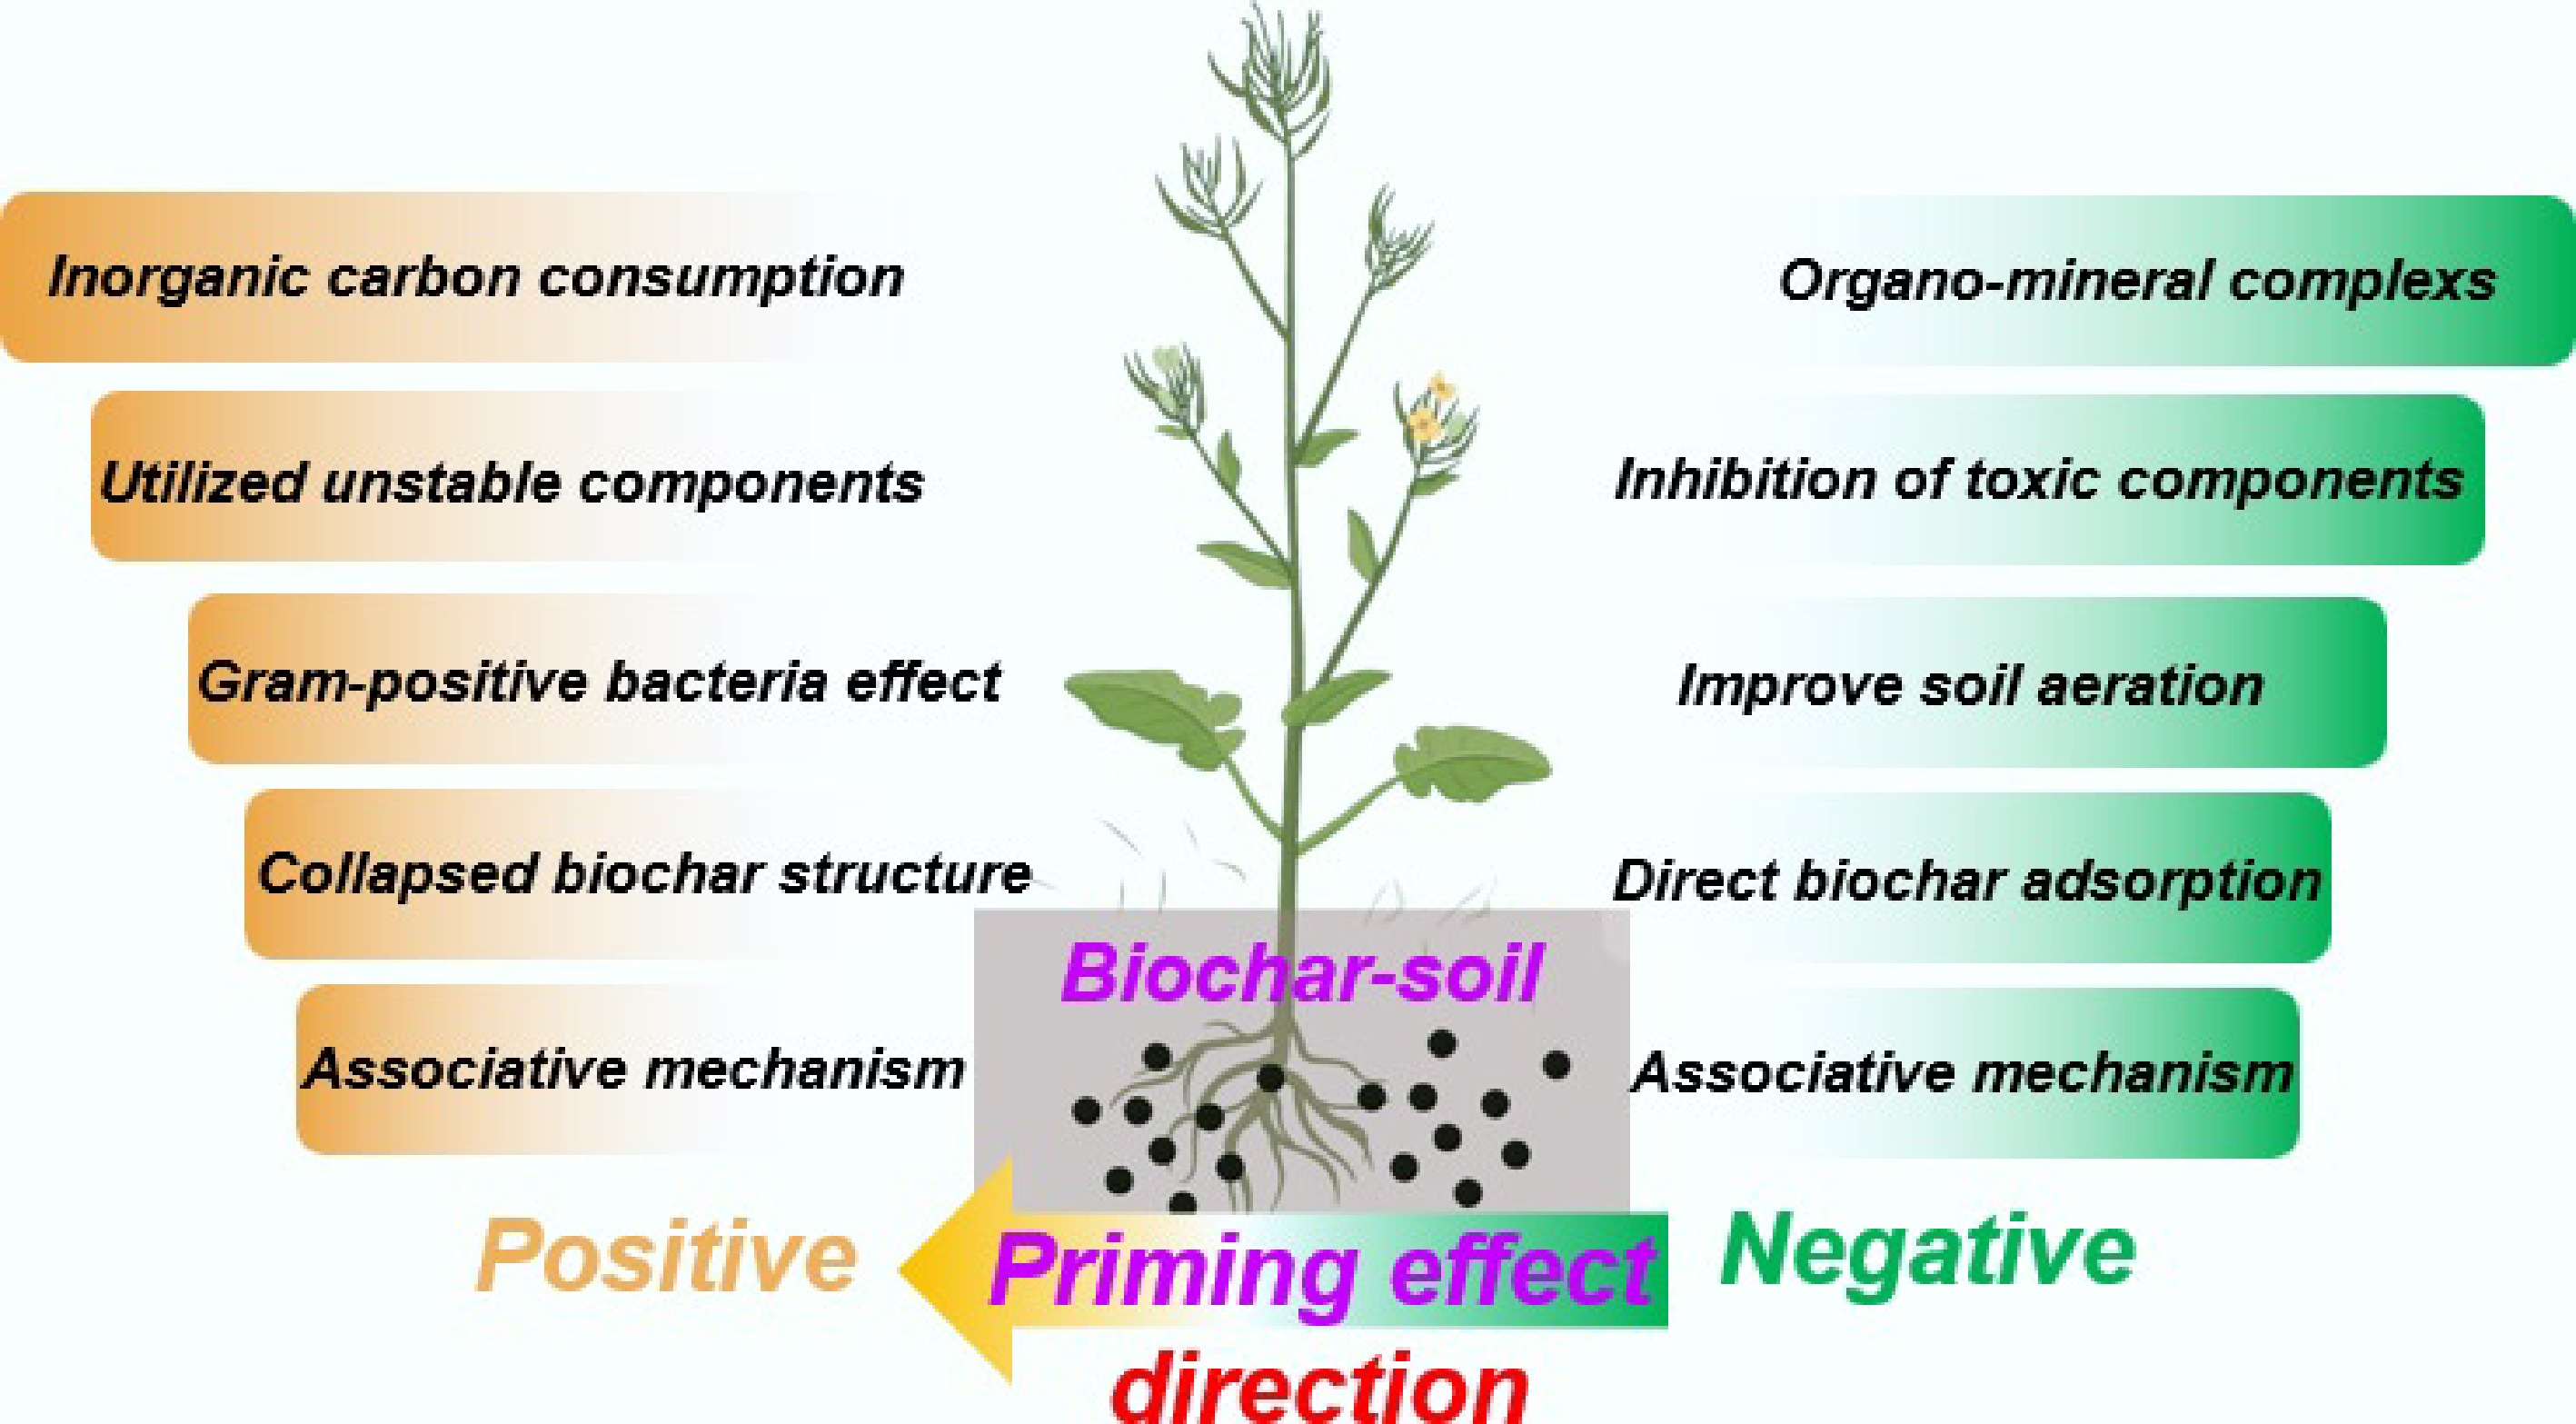
Figure 2.
Schematic diagram of priming effect in biochar-soil system.
Reducing GHG emissions
-
The reduction in GHG emissions via biochar incorporation is mainly accomplished by altering the soil environment and activity or abundance of microbial communities. Biochar application can achieve soil GHG fixation to some extent through improving soil factors such as pH, C/N ratio, aeration, soil nutrients, and redox potential[36−38]. In terms of N2O and CH4 emissions, biochar primarily reduces them by altering microbial activity via production and consumption of labile C pools[39]. Biochar with high C content is assimilated and used as a C source by soil microorganisms, which helps in the expression of related functional genes (such as nirK, nirS, and nosZ) during denitrification, leading to a reduction in N2O emissions[40]. The effect of biochar on the production of denitrification genes is intimately connected with its quantitative role as an electron shuttle in reducing N2O emissions. The electron-donating capacity (EDC) of biochar, which is based on redox-active quinone functional groups, directly enhances the reduction of N2O to N2, granting electrons to the microbial nosZ gene product (N2O reductase). It has been experimentally proven that biochar containing an EDC of 0.5–1.2 μmol e− g−1 can stimulate an increase in the expression of the nosZ gene (2.5–5.8 fold) while simultaneously inhibiting the expression of nirS and nirK genes (encoding NO2 reductase), thereby restraining the denitrification pathway towards N2O formation[41]. Such an effect depends on the production and usage parameters. For example, biochar produced at high temperatures (> 600 °C) has a high nosZ/(nirS + nirK) gene expression ratio (usually > 2.0), whereas biochar produced at low temperatures (< 500 °C) has a low ratio (usually < 1.5) because of its high graphitic domain content and electron conductivity[42]. Likewise, this effect depends on the application dosage; nosZ transcripts were elevated by an average of 380% with a 2% (w/w) dosage but by only 120% with a 0.5% dosage[43]. The electron shuttling in this biochar scenario is effectively used to optimize the electron flow inside the microbial cells, making the N2O/(N2O + N2) ratio decrease to less than 0.1 in amended soils compared to a ratio greater than 0.3 in control soils, which validates the importance of electron shuttling as a critical, measurable process in GHG mitigation[44].
Similarly, biochar can regulate CH4 fixation by suppressing the abundance and activity of methanogenic bacteria while not significantly affecting the abundance and activity of methanogenic oxidizing bacteria[18,45]. Moreover, biochar-derived N source can be utilized as an alternative to N fertilizer, reducing additional soil N input[46]. Notably, biochar has a high BET-specific surface area and rich pore structure, making it an excellent adsorbent for GHGs[47−49]. It can act as both a new carbon sink to raise SOC content and regulate the PE direction of SOC to further accelerate C sequestration[43,50]. In summary, biochar mitigates greenhouse gases by directly altering microbial community structure and activity—suppressing methanogens while enhancing denitrifiers—and by inducing a negative priming effect through the physical protection of soil organic carbon, thereby promoting long-term carbon sequestration.
-
The feedstock, synthetic process, dosage, and physicochemical properties of biochar significantly influence SOC fixation (Fig. 3). The feedstocks and pyrolysis temperature of biochar significantly affect its physicochemical properties and environmental behavior. Table 1 shows the effects of pyrolysis temperatures on biochar properties and their applications, along with attributes that later on impact carbon sequestration and PE. For example, Zimmerman et al.[26] reported that biochar produced at low temperature (250 and 400 °C) usually induced a positive PE, while biochar pyrolyzed at high temperature (525 and 650 °C) induced a negative PE, suggesting that the direction and strength of the PE are closely related to biochar type. Biochar produced at low temperatures contains a relatively higher content of readily decomposable C.
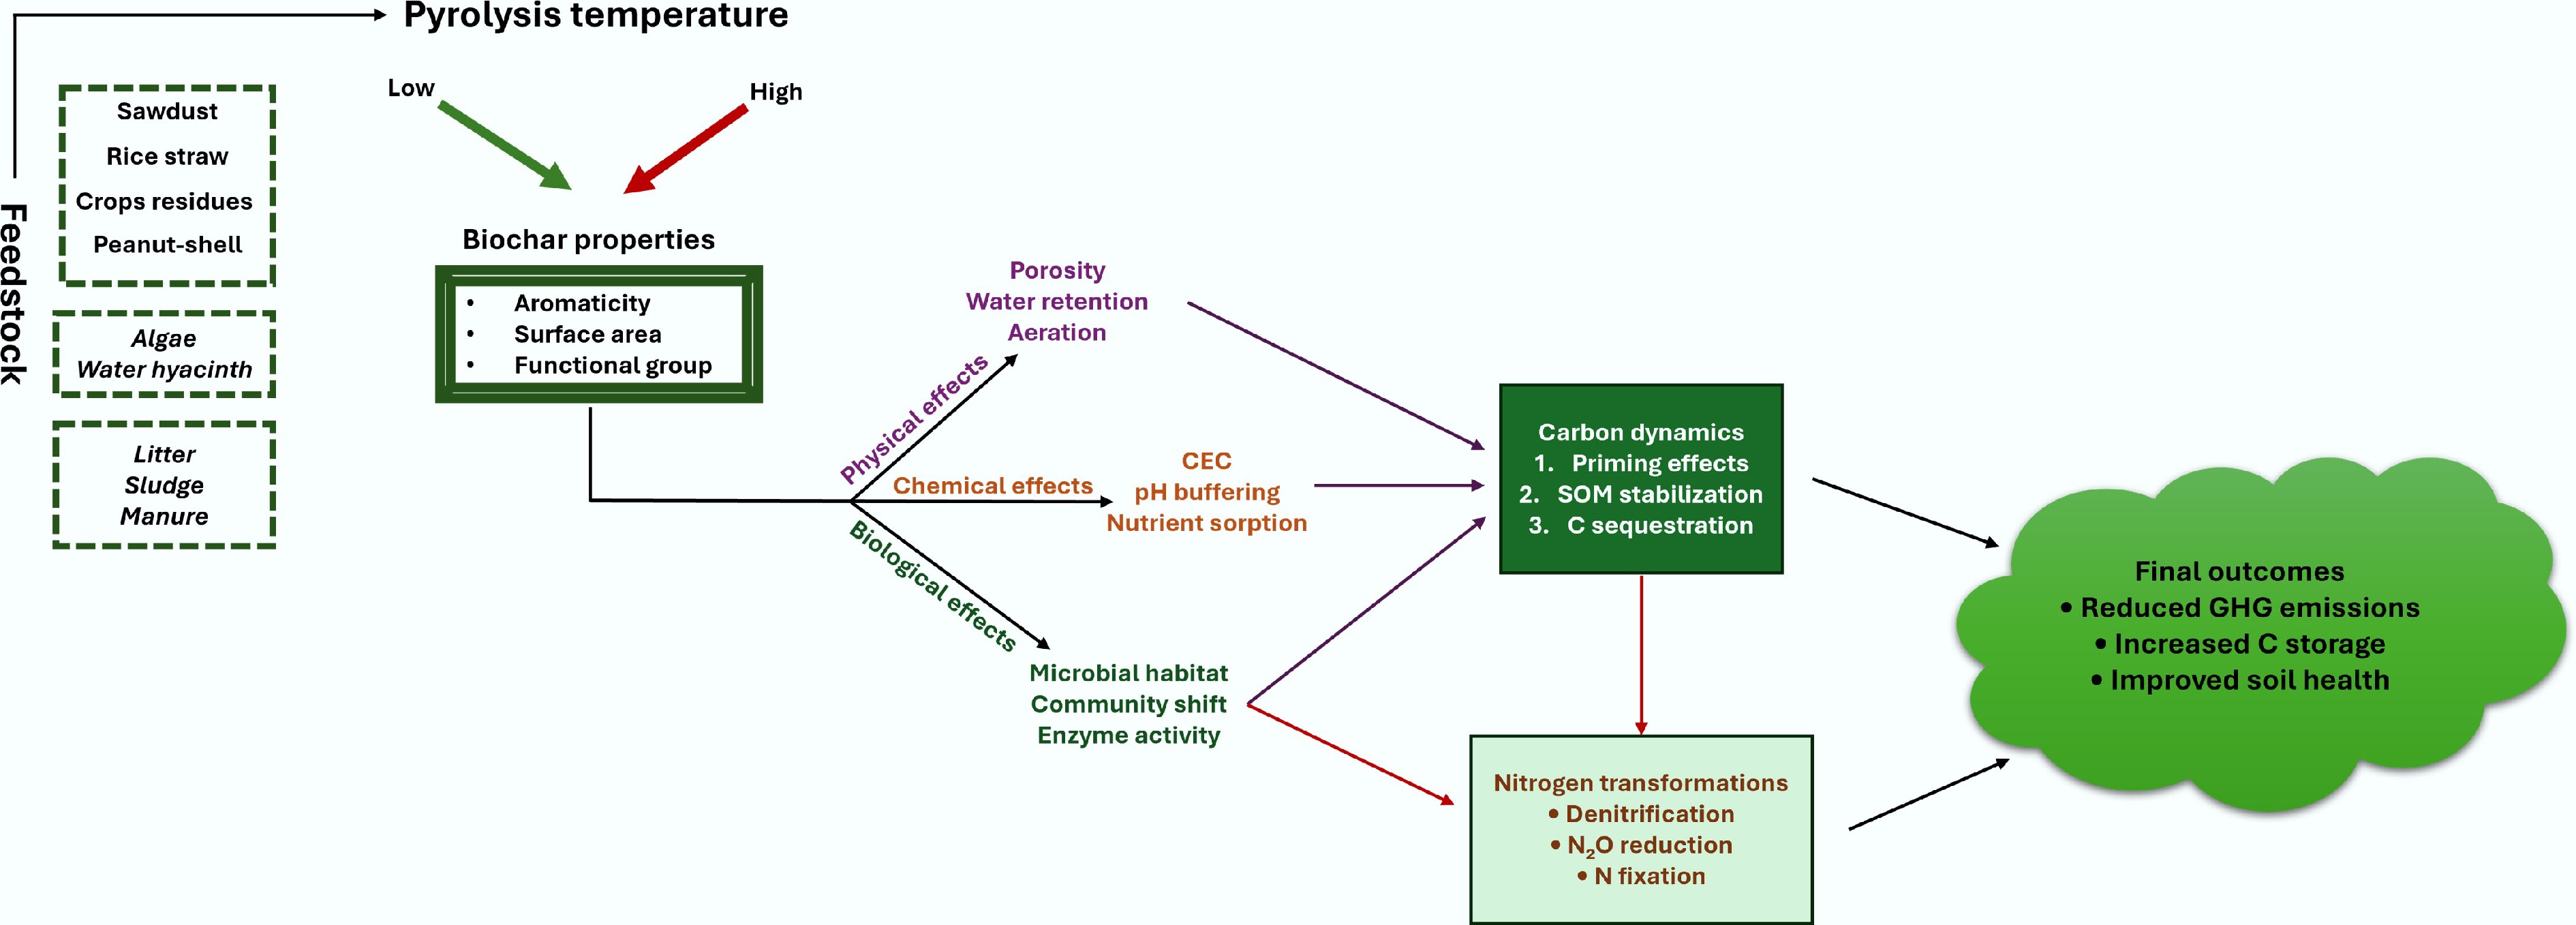
Figure 3.
The effects of feedstock and pyrolysis temperature on biochar properties and its applications impacting soil properties regulating the soil health and GHG emissions.
Table 1. Key physicochemical properties of biochar as a function of pyrolysis temperature
Pyrolysis temperature Specific surface
area (m2 g−1)Porosity
(cm3 g−1)H/C atomic
ratioO/C atomic
ratioDominant carbon structure Primary functional groups 250–350 °C (Low) 10–50 0.01–0.05 1.0–1.4 0.4–0.7 Amorphous, aliphatic-C –OH, –COOH, –CH3 400–500 °C (Medium) 100–400 0.05–0.15 0.5–0.8 0.2–0.4 Mixed aliphatic/aromatic Quinones, phenols 600–700 °C (High) 400–800 0.15–0.30 0.3–0.5 0.05–0.15 Condensed aromatic-C Graphitic domains, π-π* > 800 °C (Very high) 800–1,200 0.30–0.50 < 0.3 < 0.05 Highly graphitic, turbostratic Conjugated π-electrons * H/C and O/C ratios are indicative of aromaticity and stability: lower values correspond to higher carbon stability. Data were synthesized from multiple feedstocks including wood, straw, and manure sources[51]. These components in biochar provide many additional active carbon sources for microbial metabolism, which can promote the microbial decomposition of SOC. Therefore, low-temperature biochar, which often induces a strong positive PE, can accelerate soil C release. Amin[51] synthesized a series of calotropis-derived biochars at different pyrolysis temperatures (250, 400, 600 °C) and studied their effects on carbon emissions from an alkaline sandy soil. The results showed that cumulative carbon emission decreased with the increase in pyrolysis temperature. This is primarily because low-temperature biochar (< 500 °C) releases more dissolved organic matter and unstable organic carbon, while high-temperature biochar (> 600 °C) has a large amount of aromatic carbon and heterocyclic carbon, and its H/C and O/C ratios are relatively low.
Biochar application dosage also has a profound effect on soil GHG emissions. For example, applying different doses of hardwood biochar to a sandy soil (1%, 2%, 5%, 10%, w/w) resulted in a 19%−98% reduction in cumulative N2O emissions within 60 h in biochar-treated soils compared to the biochar-free control. The PE induced by low and high application rates of biochar can be opposite, and the higher application rates of biochar are more likely to induce a negative PE, which would be conducive to SOC fixation[52]. Liu et al.[53] studied the effects of three different biochar types at various dosages on the stimulating effect of SOC mineralization and evaluated their C sequestration potential. The results showed that the application of three kinds of biochar had a negative PE on SOC, effectively inhibiting SOC mineralization. The priming rates for 5% (w/w) bamboo charcoal and 5% (w/w) rice husk charcoal were as high as 88.8% and 85.4%, respectively, directly contributing to soil carbon sequestration. In conclusion, biochar's capacity for C sequestration is governed by its feedstock and pyrolysis temperature, which dictate its stability and priming effects, and by the application dosage, which controls the magnitude of microbial and physical interactions. Future research must prioritize optimizing these production and application parameters for specific soil types to maximize GHG mitigation and ensure long-term carbon stability.
Soil characteristics
-
Soil characteristics are closely connected to soil GHG emissions. Studies have demonstrated that the physiochemical characteristics of soils (such as texture, water content, aeration, pH, soil organic matter, etc.) affect the sequestration of carbon and nitrogen[54−59]. For instance, biochar application can improve the cation exchange capacity (CEC), which will be helpful for NH4+/NO3− adsorption and soil carbon fixation[60,61]. Application of biochar can often result in substantial improvements in soil physiochemical and biological properties[62−64]. These changes are essentially related to the unique properties of biochar, such as high specific surface area, abundance of pores, and low bulk density. It is evident from recent literature that the efficacy of biochar is highly sensitive to soil pH[5], and there are clear patterns of biochar efficacy between pH gradients. Biochar use often increases SOC content in acidic soils (pH < 5.5) by 15%–25% and reduces N2O emissions by 45%–65%, largely due to its liming effect that boosts the activity of microbial N2O reductase. Neutral soils (pH 5.5–7.5) exhibit more changeable reaction with SOC increments of 8%–15% and N2O drops of 30%–50% because the pH-buffering ability is weaker[36]. Conversely, soils with high pH show the least relative gains, with only 5%–10% increase in SOC and 20%–40% reduction in N2O emissions, which could be attributed to mineral saturation and reduced biochar-soil interactions. Biochar efficiency is also modulated by soil moisture and aeration. Maximum potential carbon sequestration is achieved at moderate moisture content (60%–80% water-filled pore space, WFPS), and biochar has a pore structure that allows microbial activity and physical shelter of SOC. At lower moisture levels of less than 40% WFPS, microbial activity is limited, whereas at higher moisture levels of more than 85% WFPS, no oxygen can restrict anaerobic growth, which can counteract carbon gains. Similarly, threshold effects are observed in soil aeration: soil oxygen concentrations above 15% are required to maximize N2O reduction (> 50%) by promoting complete denitrification to N2. At lower oxygen concentrations below 10%, N2O emissions can rise as a consequence of partial denitrification, whereby fine-textured soils are found[65]. These quantitative thresholds emphasize the need to site-specifically characterize soil to predict biochar's carbon neutrality potential. Numerous publications, including laboratory, greenhouse, and field studies, conclude that biochar effectively improves soil aeration, thereby limiting N2O emissions in the denitrification process[66]. The reason for reduced N2O emissions from biochar-amended soils is probably related to the 'liming effect' arising from the alkaline nature of biochar material. The raised pH in acidic or neutral soil can enhance the activity of N2O reductase, inhibiting the conversion of N2O to N2 in the denitrification process and, consequently, reducing N2O emissions[67−69].
Pei et al.[28] observed increased microbial C use efficiency and decreased microbial biomass turnover time to a certain extent, likely due to the synergistic effect from biochar aging and the raised pH following its application. Moreover, the application of biochar may bring about changes in the soil microbial community structure and abundance[21,70−72]. For instance, it is suggested that biochar application in farm soils changes the C/N ratio of the soil, causing stimulation of microbial life activities, which in turn affects the emission of N2O[73,74]. SOC is the major C pool in terrestrial ecosystems[75,76]. The decomposition of soil organic matter is a key process in C, N, and nutrient cycling[21,75,77]. Wardle et al.[78] collected humus from three distinct boreal forests in Sweden and blended it with laboratory-made charcoal to model the effects of charcoal on the decomposition of organic matter in native soil. The results indicated that charcoal could boost the decline of forest humus and form subterranean carbon[78]. The application of biochar can also directly or indirectly alter the physiochemical properties of forest soils. Soil conditions are the main factor determining the constitution of the soil microbial community in forests augmented by biochar. Qu et al.[79] studied the effects of biochar application on wood bacterial communities in northern latitude pine forests over a two-year time span. The results showed that biochar treatments could alter the bacterial community structure during decomposition; in addition, soil pH, water content, and total nitrogen all had certain extent of influences on the bacterial community and function[79]. The diversity and lifestyle of microorganisms in forest soil play a vital role in regulating the soil PE[80,81]. Additionally, biochar can improve forest management by augmenting soil carbon storage and modulating soil moisture levels[82].
Microbial-mediated processes
-
Biochar is an important substrate as a source of exogenous C that is used by soil microorganisms[24]. Meanwhile, the nutrient elements in biochar can affect the growth of soil microorganisms (Fig. 4). Notably, SOC mineralization is affected by the balance between copiotrophic and oligotrophic bacteria in soil[83]. Ultimately, the life activities of soil microorganisms will cause the PE of SOC. Zhu et al.[84] summarized the possible mechanism through which biochar-microbial interaction affect soil carbon sequestration. Biochar applied to soil can provide habitats and nutrients for microorganisms, while also presenting potential toxicity to microbial cells. In addition, biochar can change the habitat environment of microorganisms and soil enzyme activity, affect intra- and inter-specific communication of organisms, and reduce the toxicity of pollutants to soil microorganisms. When biochars produced from different feedstocks or different preparation conditions are applied, the response of soil microorganisms varies, thus affecting the direction of the PE. In a study where three different biochars (rice straw RB, wood chips WB, manure MB) were applied into a paddy soil, the electron syntropy between methanogens and Geobacteraceae was confirmed by quantitative polymerase chain reaction[41]. Moreover, RB and MB biochar accelerated the electron transfer between methanogens and Geobaciliaceae, and significantly promoted the formation of methane. As a result, the methane yield with RB- and MB-derived biochar was 10.7 and 12.3 times higher, respectively, than in treatment without biochar. Thus, the application of biochar may exacerbate carbon emissions from soil methane sources. Interestingly, Chen et al.[72] showed in field experiments that soil carbon source and pH were the main environmental driving factors for endophytic azotobacter abundance and biological nitrogen fixation (BNF) activity, while soil N source significantly affected the abundance of bacteria and azotobacter in soil. The application of biochar increased soil C content and pH value and then increased the abundance of azotobacter communities (such as rhizobium) in the topsoil, which had a significant positive effect on enhancing BNF. Similarly, Zhang et al.[85] studied the overall response of denitrifying soil bacteria (Paracoccus denitrificans) to biochar addition, revealing the influence of biochar on denitrifying metabolism at the cellular level. The results showed that denitrification of two kinds of biochar (corn straw CS and wheat straw WS) showed a positive correlation in the range of pyrolysis temperature 300–500 °C and application amount 0.1%–1% (w/w). The addition of biochar simultaneously promoted the protein expressions of NO2− reductase, NO reductase, and N2O reductase, and enhanced the activities of these enzymes, which promoted the growth of Paracoccus denitrificans. As a result, biochar reduced cumulative N2O emissions by 98% by optimizing electron distribution among denitrification enzymes. Therefore, it is necessary to optimize the feedstocks and synthesis conditions of biochar to enhance the abundance and activity of soil dominant carbon fixation or nitrogen fixation microbial communities, so as to achieve efficient negative PE and inhibit soil carbon emissions.
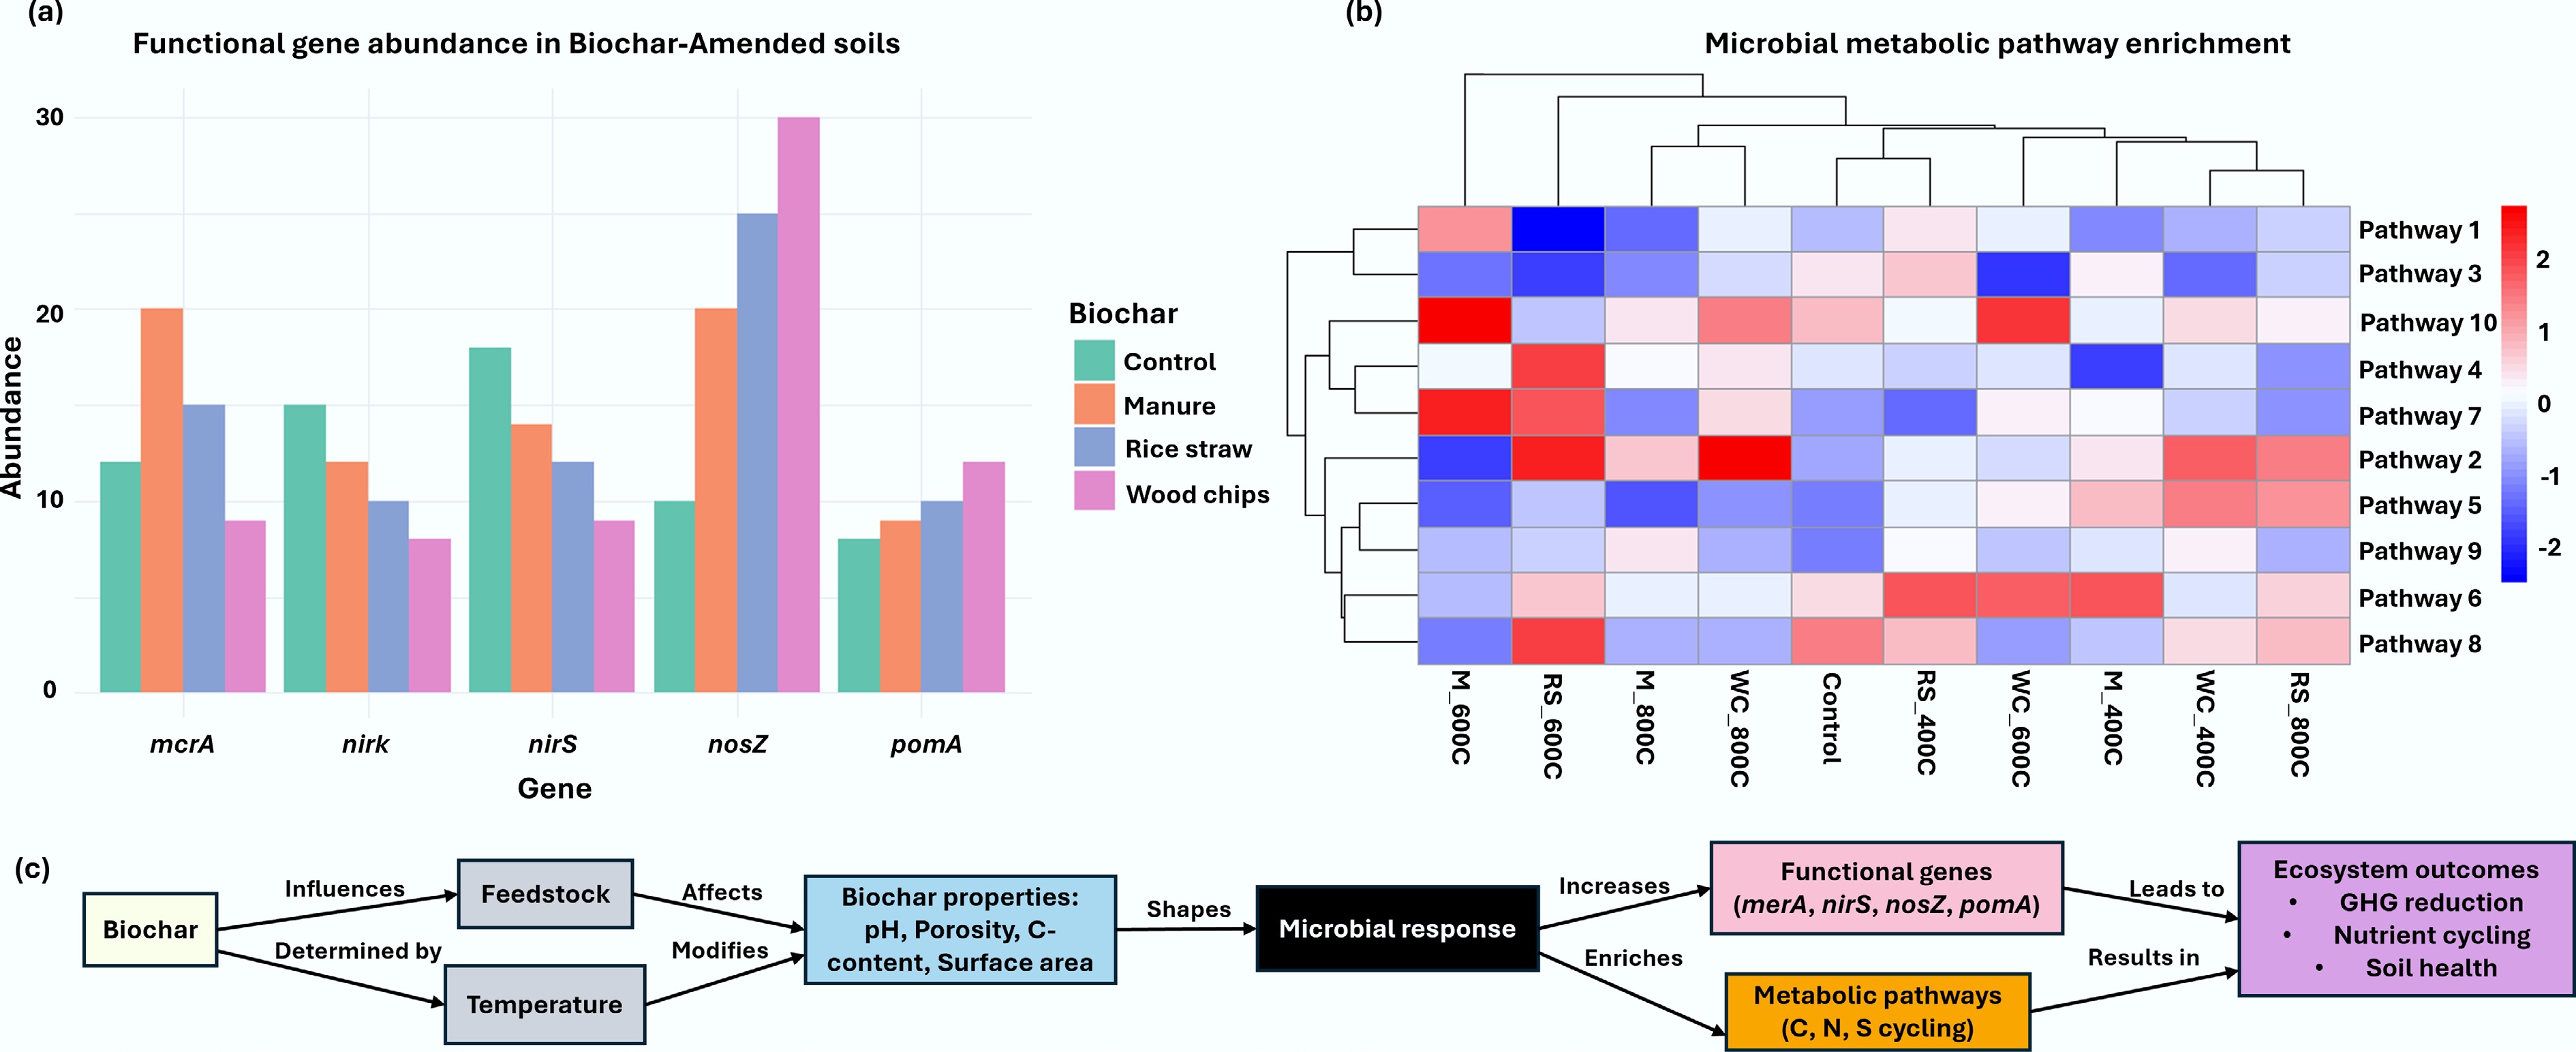
Figure 4.
Microbial functional gene abundance and metabolic pathway enrichment in biochar-amended soils relative to other organic amendments. (a) Synthesis of published studies shows that biochar amendment significantly increases the mean abundance of key functional genes for mercury reduction (merA), denitrification (nirK, nirS, nosZ), and methane oxidation (pmoA) compared to manure, rice straw, wood chips, and unamended control soils. (b) Enrichment of microbial metabolic pathways—including those for carbon fixation, nitrogen metabolism, and aromatic compound degradation—varies with biochar type, defined by feedstock (e.g., maize straw, wheat straw, wood chips, peanut shells) and pyrolysis temperature (400 vs 800 °C). Higher temperature biochar (800 °C) generally induce distinct metabolic profiles compared to those produced at 400 °C, reflecting how feedstock properties and pyrolysis conditions shape microbial functional potential in amended soils. (c) Mechanistic pathways of biochar in assisting microbial growth.
More importantly, biochar can act as an 'electron shuttle' and influence the biogeochemical cycle in soil to some extent, due to its graphite-like aromatic structure containing redox-active groups (such as quinone and hydroquinone) and conjugated π-electrons[44,86−88]. As an important part of the biogeochemical cycle, the soil nitrogen cycle has attracted considerable attention[89]. The electrochemical properties of biochar (i.e., electron shuttle and potential) can improve soil denitrification and mediate electron transport behavior of microorganisms[87,90−92]. Electron shuttling occurs when a soluble molecule accepts electrons from a microorganism and transfers them to another electron acceptor due to a concentration gradient[93]. The electron shuttling properties of biochar facilitate denitrification, thereby accelerating the reduction of N2O to N2[90,93]. Cayuela et al.[90] employed the 15N gas-flux method to study the N2O emission of 14 types of agricultural soils and found that the application of biochar could promote the denitrification process. They creatively proposed that biochar could be utilized as an 'electron shuttle' to accelerate electron transfer mechanism to soil denitrification microorganisms[90]. Similar experimental results were reported by Harter et al.[94]. Kappler et al.[88] founded that the application of a certain amount of biochar could stimulate the reduction of ferrihydrite by Shewanella oneidensis MR-1, and verified the process of electron transfer directly mediated by biochar as an 'electron shuttle' through the experimental method for the first time. Yuan et al.[42] innovatively employed a hydrogen peroxide pretreatment strategy to study the relationship between the electron shuttle properties of biochar and N2O emissions. This study not only verified that biochar as an electron shuttle can effectively inhibit N2O emissions, but also suggested that aged biochar may have a negative effect on nitrogen emission[42]. Biochar application influences not only soil denitrification, but also the reduction of soil dissimilatory nitrate reduction to ammonium (DNRA). Yuan et al.[95] also used hydrogen peroxide to pretreat biochar and studied the influence of biochar applied to paddy soil as an electron shuttle on the DNRA process[95]. The results demonstrated that biochar as an 'electron shuttle' could enhance the relative abundance and expression level of functional microorganisms (nrfA) associated with DNRA process, thus augmenting the DNRA process and realizing efficient nitrogen storage[95].
Biochar application can improve soil physiochemical and biological characteristics, including soil pH, aeration, texture, microbial community, etc. Notably, its effects on microorganisms (fungi or bacteria) in soil require a combination of the properties of the biochar and the soil properties. Reasonable regulation of biochar dosage and effective field management will help enhance the carbon sequestration capacity of biochar in soil.
-
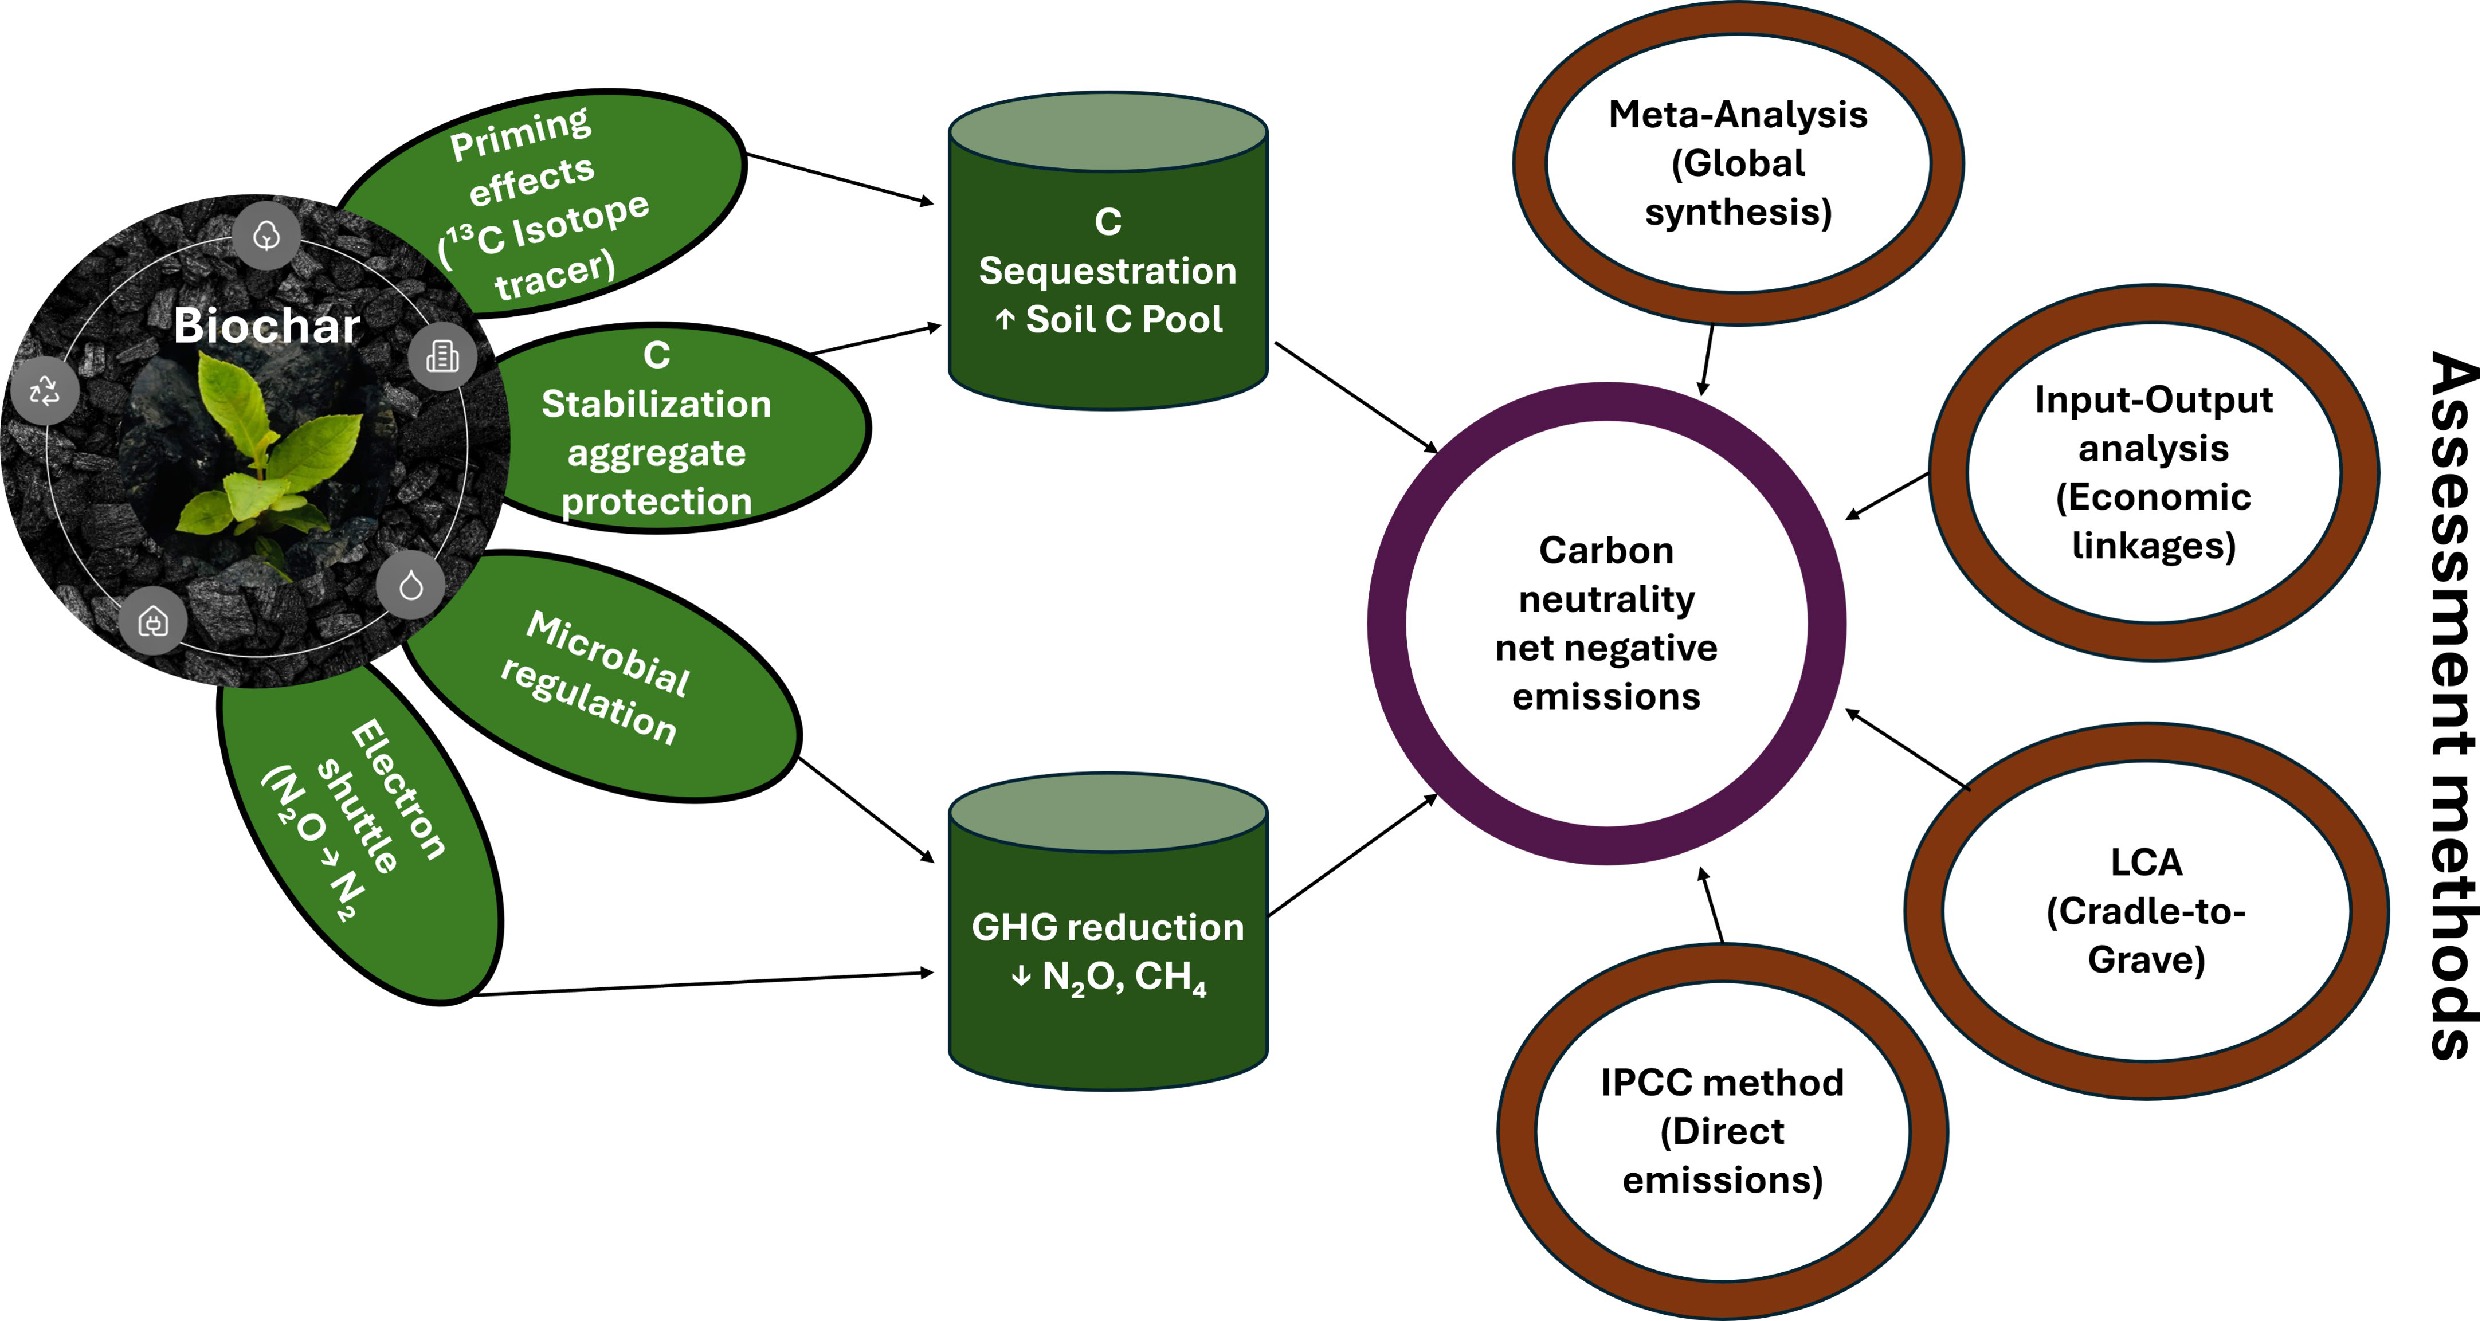
Accurately evaluating the potential of biochar to achieve soil carbon neutrality requires a multifaceted methodological framework that moves beyond simple carbon input calculations (Fig. 5). This assessment must rigorously account for the dynamic interplay between biochar and the native carbon soil pool, primarily through the quantification of the PE, to determine the net carbon balance. Furthermore, a comprehensive life-cycle accounting of carbon emissions—from feedstock acquisition to final application—is essential to validate the true 'carbon negativity' of biochar strategies. This section critically reviews the primary evaluation methods, including PE assessment, emission coefficient methods, life cycle assessment (LCA), and input-output analysis (IOA), and synthesizes large-scale trends through meta-analysis to provide a holistic perspective on the efficacy of biochar for carbon sequestration.
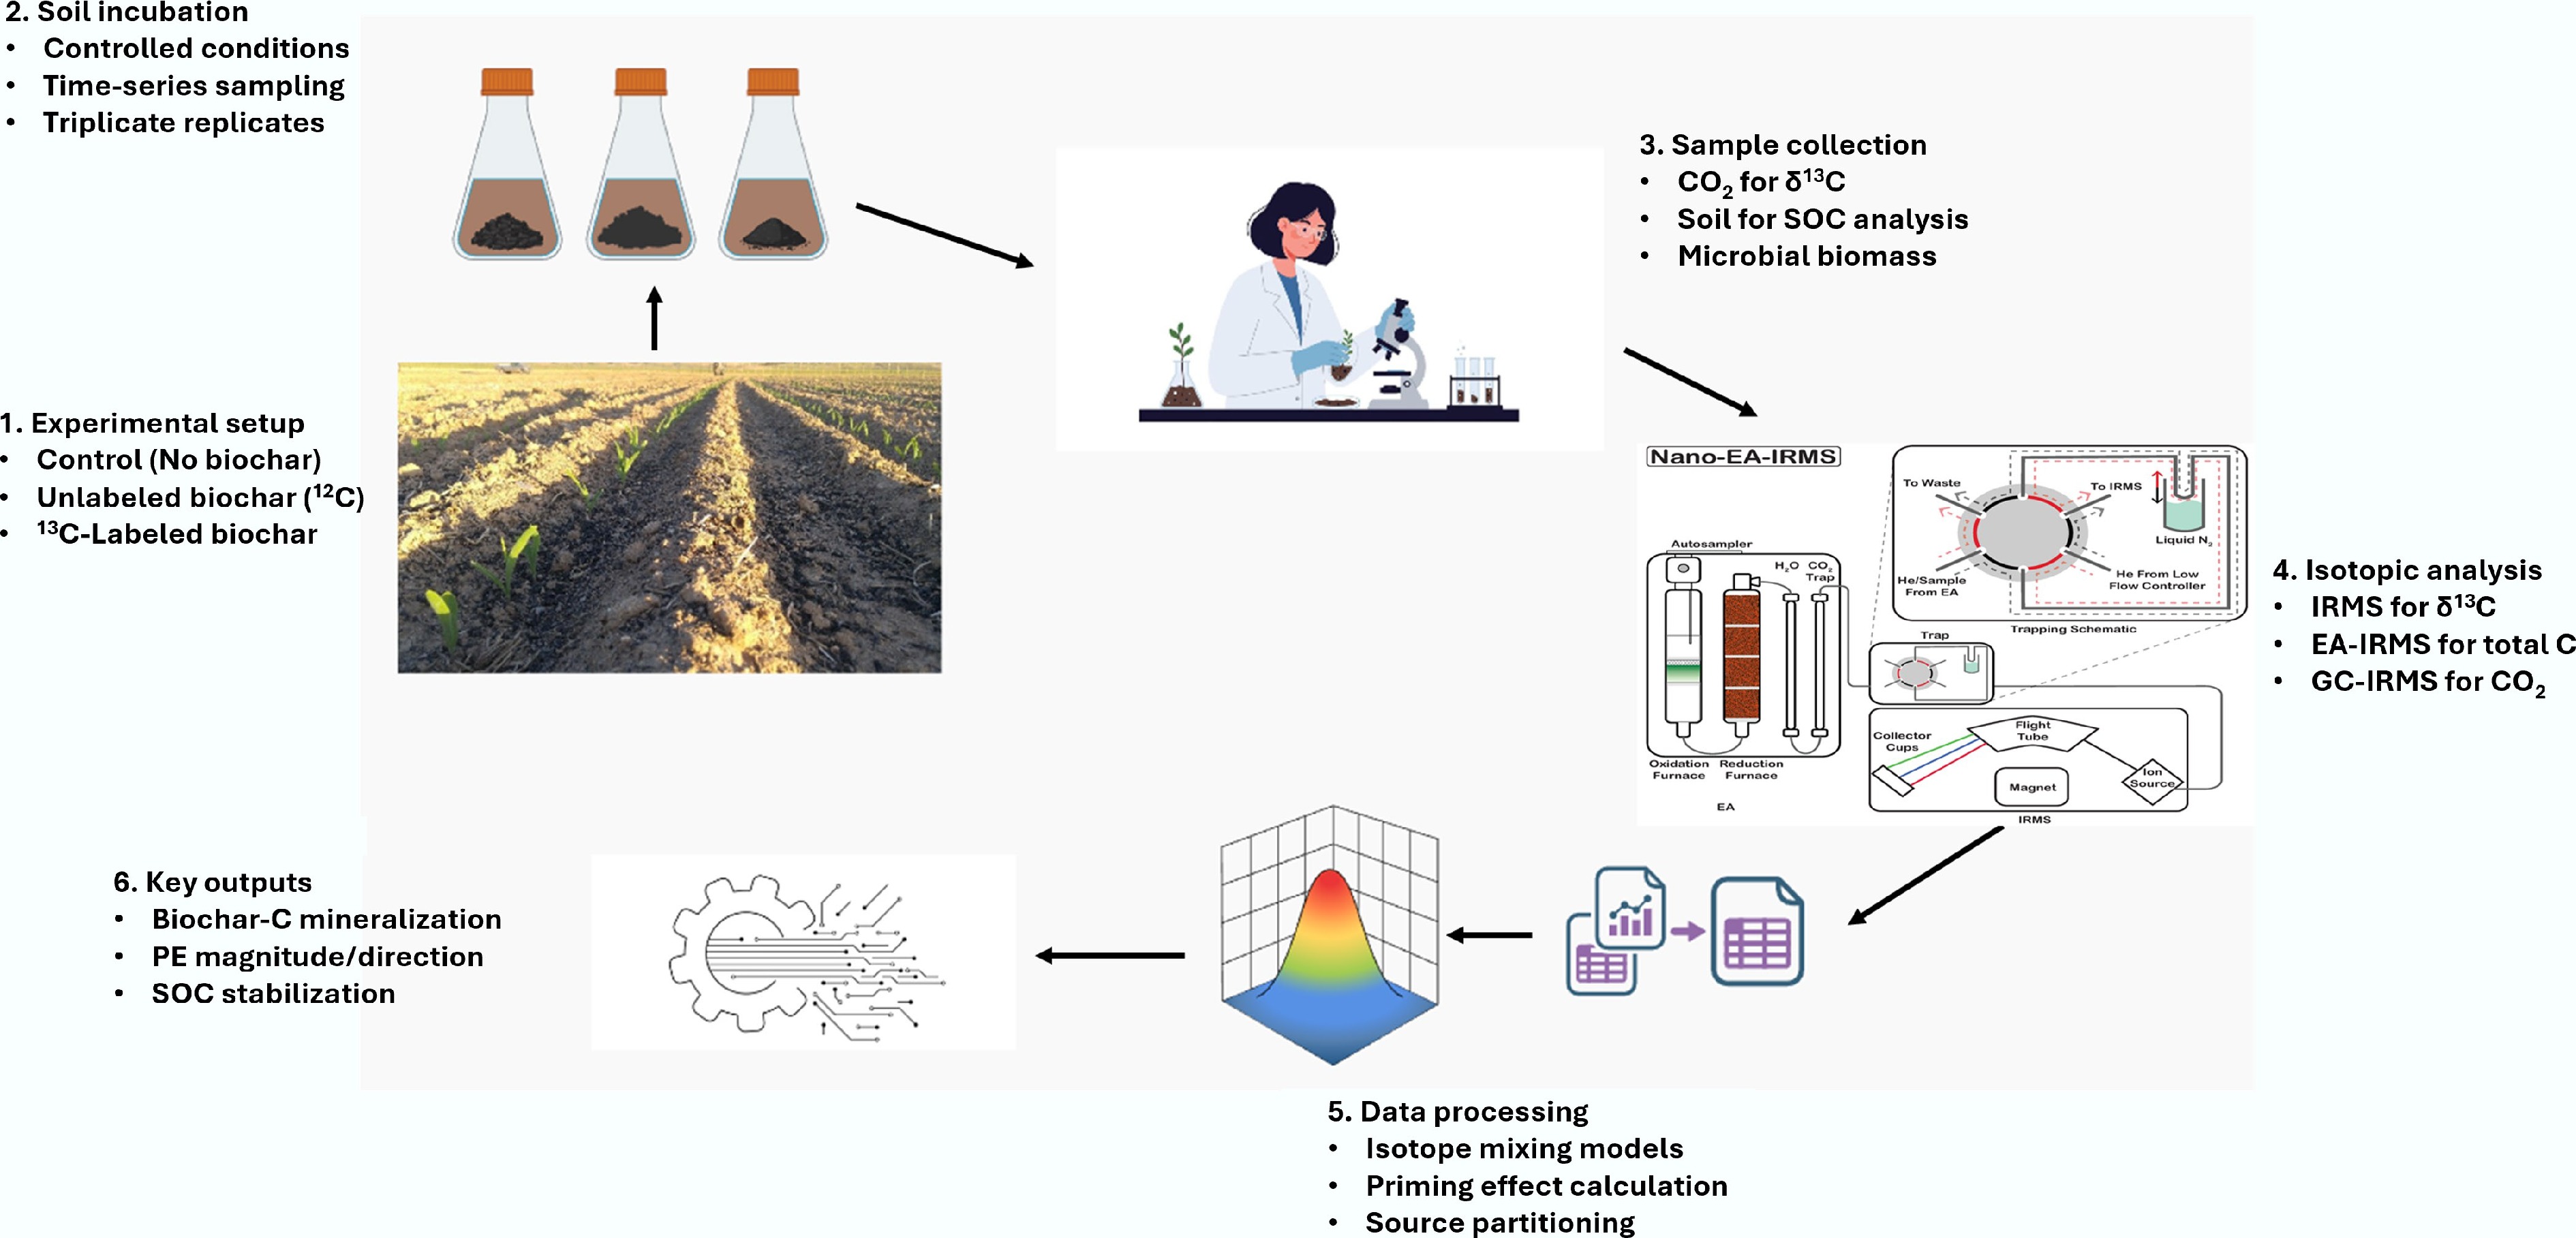
Figure 5.
An illustration depicting the data flow diagram elucidating the experimental procedure and data processing pathway for the 13C-labeled biochar.
Evaluation of priming effect
-
The use of 13C-glucose isotope labeling is often employed to calculate and assess soil PE[96−99]. This method is applicable to the evaluation of soil PE at a global level. The glucose applied is added in accordance with soil weight due to the diversity of factors affecting soil PE. This approach implies that the soil food web is driven by glucose and that microbial populations evolve following the supplementation of glucose[96]. CO2 emissions in soil usually occur a few days or weeks after the addition of substrate and demonstrate considerable PE. The soil PE is commonly calculated using Eq. (1)[8,96,99].
$ {\mathrm{PE}}=({\mathrm{C}}{\text{-}}{\mathrm{total}}\;{\mathrm{amended}}-{\mathrm{C}}{\text{-}}{\mathrm{substrate}})-{\mathrm{C}}{\text{-}}{\mathrm{total}}{\text{-}}{\mathrm{control}} $ (1) where, C-total amended is the total CO2 efflux from the soil amended with the substrate, C-substrate is the portion of CO2 derived from the decomposition of the added substrate (determined via 13C analysis), and C-total-control is the total CO2 efflux from the unamended control soil. Additionally, nutrient input had a considerable effect on soil PE[100]. Nonetheless, there is still no standard method to compute the impact of nutrient input on PE. In contrast to direct measurements of soil respiration, PE is generally estimated indirectly by excluding the effects of the treatment without carbon and soil organic matter[101]. The layout of a full-factorial experiment combined with a single nutrient input treatment will more accurately estimate the effect of nutrient input on soil PE[101]. Due to disparities in research dimensions and units of soil PE in different studies, priming factors are used to evaluate the direction of soil PE Eqs (2)–(4)[97,101,102].
$ PE_{control}=\dfrac{C_C}{C_{control}} $ (2) $ PE_{nutrient1}=\dfrac{C_{NUT}}{C_{control}} $ (3) $ PE_{nutrient2}=\dfrac{C_{CNUT}}{C_{NUT}} $ (4) where, Ccontrol, CNUT, CC, and CCNUT represent the CO2 produced by SOC treated with amended control, nutrient input, C substrate input, and C substrate plus nutrient, respectively. A PE value greater than or less than 1 indicates positive and negative effect, respectively.
The size of soil aggregates has been demonstrated to be associated with the activation of SOC induced by biochar[25]. The alteration of stable isotope composition (δ13C) was determined to differentiate between CO2–C associated with mineralized biochar and soil aggregate SOC (Eq. [5]), then the proportion of CO2 derived from biochar could be calculated (Eq. [6]) and the PE induced by biochar could be quantified (Eq. [7])[25,103,104]. Consequently, the PE of soil macroaggregate SOC induced by biochar was obtained (Eq. [8])[25]. The study revealed that the large aggregates (> 0.25 mm) exhibited a prominent PE, while smaller aggregates (< 0.25 mm) showed a week PE[25].
$ \delta {}^{13}C\left({\text{‰}} \right)=\left[\left(R_{sample}/R_{reference}\right)-1\right]\times 1,000 $ (5) $ F_{biochar}\left(\mathrm{\% }\right)=\left(C_T-C_C\right)/\left(C_S-C_C\right)\times 100 $ (6) $ Primed\;CO_2-C\left(\mu g\;{g}^{-1}soil/aggregate\right)=CO_2-C_T-CO_2-C_C $ (7) $ Priming\;{\textit{effect}}\left(\mathrm{\% }\right)=\left(CO_2-C_T-CO_2-C_C\right)/CO_2-C_C\times 100 $ (8) Quantifying the priming effect is not merely an academic exercise; it is a critical determinant for assessing whether a biochar intervention leads to a net gain in soil carbon, thereby advancing carbon neutrality. The fundamental goal is to induce a negative priming effect, where the addition of biochar suppresses the mineralization of native SOC. When successful, this mechanism creates a dual carbon sink: the persistent carbon locked within the stable biochar itself and the preserved carbon in the existing SOC pool that would have otherwise been decomposed and emitted as CO2. Therefore, a negative PE directly enhances the soil's net carbon sequestration capacity. By utilizing the evaluation methods outlined above, such as 13C isotope tracing, practitioners can identify the specific biochar properties (e.g., high pyrolysis temperature, high aromaticity) and application scenarios that reliably generate this negative PE. This allows for the strategic selection and application of biochar not just as an inert carbon input, but as an active SOC-stabilizing agent, thereby maximizing its contribution toward achieving and verifying soil carbon neutrality.
Quantitative framework for priming effect assessment
-
The most reliable method for quantifying PE involves isotopic tracing, typically using the natural abundance of δ13C or artificial labeling with 14C. This approach allows for the partitioning of total soil respiration into its constituent sources.
Total soil CO2 efflux (Rtotal) is the sum of CO2 derived from three primary sources:
$ {R}_{\text{total}}={R}_{\text{SOM}}+{R}_{\text{biochar}}+{R}_{\text{soil respiration}} $ (9) where, RSOM is the CO2 derived from native soil organic matter, Rbiochar is the CO2 derived from the added biochar, and Rsoil respiration represents the basal respiration from root exudates and microbial turnover.
The proportion of total CO2 originating from biochar (fbiochar) is calculated using a two-source isotopic mixing model based on δ13C signatures[105]:
$ {f}_{\text{biochar}}=\dfrac{{\delta }^{13}{C}_{\text{amended}}-{\delta }^{13}{C}_{\text{control}}}{{\delta }^{13}{C}_{\text{biochar}}-{\delta }^{13}{C}_{\text{SOM}}} $ (10) where, δ13Camended and δ13Ccontrol are the δ13C values of CO2 evolved from biochar-amended and control soils, respectively, and δ13Cbiochar and δ13CSOM are the distinct end-member signatures of the biochar and the native SOM, respectively. A minimum difference of 3%–4% between these end-members is recommended for robust quantification[106].
The absolute amount of biochar-derived CO2 is then obtained:
$ {R}_{\text{biochar}}={R}_{\text{total}}\times {f}_{\text{biochar}} $ (11) Subsequently, the CO2 derived from native SOM in the amended treatment (RSOM(amended)) is calculated by difference, after accounting for the basal respiration component (often measured in a separate control or estimated)[107]:
$ {R}_{\text{SOM(amended)}}={R}_{\text{total}}-{R}_{\text{biochar}}-{R}_{\text{soil respiration}} $ (12) The absolute priming effect (PE) is defined as the difference in SOM-derived CO2 between the amended and control treatments:
$ \text{PE}={R}_{\text{SOM(amended)}}-{R}_{\text{SOM(control)}} $ (13) where, RSOM(control) is the SOM-derived CO2 in the unamended control soil. The relative priming intensity (PE%), which expresses PE as a percentage of the baseline SOM decomposition, is calculated by following[108]:
$ \text{PE}\mathrm{\% }=\left(\dfrac{\text{PE}}{{R}_{\text{SOM(control)}}}\right)\times 100\mathrm{\% } $ (14) For studies employing 14C-labeled biochar, the mean residence time (MRT) of biochar-C, a key indicator of its stability, can be estimated. The decomposition of biochar-C is often described by a first-order exponential decay model:
$ {C}_{t}={C}_{0}\cdot {e}^{-kt} $ (15) where, Ct and C0 are the amounts of remaining and initial biochar-C, respectively, k is the decomposition rate constant (time−1), and t is the incubation time[107]. The MRT is then derived as the inverse of the rate constant:
$ \text{MRT}=\dfrac{1}{k} $ (16) Accounting for carbon emission
-
Currently, common methods for calculating carbon emissions include emission coefficient method based on the data provided by IPCC[109,110], life cycle assessment (LCA)[111], input-output method (IOA)[112], etc (Table 2). The net carbon footprint of biochar systems is not a simple task to quantify because it must contribute to the long-term sequestration of biogenic carbon against the emissions of the production supply chain and the possible indirect impacts on soil and the economic systems. To address this complexity, two major methodological frameworks are used: process-based life cycle assessment (LCA) and economy-wide input-output analysis (IOA). Whereas LCA is more technology-specific, IOA captures more market-mediated and sectoral displacement impacts that traditional LCA fails to capture. This part compares the two approaches using real-life examples, analyzing their respective strengths, weaknesses, and effective application situations of the two approaches to help in proper accounting of carbon in biochar research, policy-making, and project development (Table 2). LCA is essential for researchers trying to optimize the conditions of pyrolysis, for project developers seeking to obtain carbon credits according to such standards as Verra or Puro.earth, and for comparing the carbon efficiency of various feedstocks or types of reactors. The major shortcoming of it, the shortness error due to the absence of remote supply-chain nodes, can be somewhat overcome by hybrid LCA-IOA approaches. On the other hand, IOA is valuable for policymakers formulating regional incentive policies or national decarbonization strategies because it may indicate unintentional effects, including the leakage of emissions to other economic activities. Both of these are discussed in detail below:
Table 2. Comparison of life cycle assessment (LCA) and input-output analysis (IOA) methods for carbon accounting in biochar projects
Aspect Life cycle assessment (LCA) Input-output analysis (IOA) Hybrid approach (LCA + IOA) System boundary Cradle-to-gate or cradle-to-grave. Includes: (1) Feedstock collection, (2) Transportation, (3) Pyrolysis, (4) Application. Excludes indirect economic effects. Economy-wide. Captures all sectoral interconnections. Includes direct and indirect emissions from all related industries (mining, manufacturing, services). Combines: (1) Process-specific LCA for pyrolysis, (2) IOA for upstream supply chains (steel for reactors, electricity grid). Data requirements Primary process data (e.g., pyrolysis energy use, transportation distances). Secondary data from Ecoinvent/GaBi databases. High resolution but limited scope. National/regional input-output tables (e.g., USEEIO, EXIOBASE). Sectoral monetary flows and emission factors. Broad but aggregated. Integrated dataset: Process inventories + IO tables. Requires data alignment between physical and monetary units. Carbon accounting results (example) Net sequestration: −0.8 to −1.2 t CO2e per t biochar (including: −2.8 t from carbon stability, +0.5 t from production, +0.3 t from transport). Net economy-wide impact: −0.3 to +0.2 t CO2e per t biochar (includes market-mediated effects: fuel substitution, land-use changes, sectoral shifts). Net impact: −0.6 to −0.9 t CO2e per t biochar. Captures both engineering precision and economy-wide ripple effects. Key differences in results Consistently shows negative emissions (−0.5 to −1.5 t CO2e per t). Ignores market effects (e.g., increased fertilizer demand). Sensitive to carbon stability factor (0.7–0.9). Can show positive emissions in some scenarios due to economic rebound effects. Captures sectoral displacement (e.g., reduced coal use). Highly sensitive to regional economic structure. Intermediate results between LCA and IOA extremes. Accounts for key supply chain nodes with precision. Can identify policy leakage (emissions shifting to other sectors). Error ranges and uncertainty ±25%–40%
• Process data variability (e.g., pyrolysis efficiency: ±15%).
• Carbon stability uncertainty (±20%).
• Allocation methods (mass vs energy: ±10%).±50%–100%
• Sector aggregation error (e.g., 'chemical industry' includes diverse processes).
• Price vs physical unit misalignment.
• Temporal lag in IO tables (two to five years).±30%–50%
• Hybridization errors (mismatch between process and IO data).
• Boundary selection bias (which processes get detailed LCA).
• Double-counting risk between LCA and IOA components.Optimal application scenarios Technology comparison (slow vs fast pyrolysis). Project financing (carbon credit verification). Process optimization (identifying emission hotspots). Regional policy planning (subsidy impact assessment). National carbon budgeting (economy-wide decarbonization pathways). Trade analysis (import/export embodied carbon). Strategic decision-making for large-scale deployment. Carbon pricing scheme design. International reporting (UNFCCC, IPCC Tier 3 methods). Limitations Truncation error (omits distant supply chain effects). Static analysis (no market feedback). Data intensive for site-specific studies. Low technological resolution (cannot distinguish pyrolysis types). Homogeneity assumption (all products in a sector are identical). Complex implementation (requires specialized expertise). Computationally intensive. Limited standardized frameworks. Validation methods Sensitivity analysis (Monte Carlo). Peer-reviewed databases (Ecoinvent). Third-party verification (ISO 14044). Cross-regional comparison (comparing different IO tables). Historical data back-testing. Sectoral disaggregation (using make/use tables). Convergence testing (LCA vs IOA results). Scenario analysis (high/low biochar adoption). Expert elicitation (Delphi method). Emission coefficient method (based on IPCC)
-
The evaluation of carbon emissions based on IPCC emission coefficient method is mainly divided into the following three steps. First, relevant emission sources are identified, such as biochar pyrolysis. Second, appropriate carbon emission factors are determined, typically by referencing data provided by the IPCC. Finally, the carbon emission is calculated by multiplying the amount of the emission source by the carbon emission factor. In short, parameters related to GHG emissions can be obtained according to the guidelines provided by IPCC to determine the extent of GHG emissions[109]. The IPCC checklist factor method can comprehensively study the GHG emissions caused by the combustion of different feedstocks, and the calculation is relatively simple. However, this method cannot calculate indirect carbon emissions, and sometimes the emission factor values of specific emission sources are quite different, leading to inaccurate carbon footprint calculation[113]. Despite its limitations, the IPCC emission coefficient method provides a critical, standardized foundation for the initial quantification of the direct carbon footprint of biochar systems, which is a necessary step in any carbon neutrality evaluation. By offering a streamlined and internationally recognized framework, it enables a first-order approximation of net carbon sequestration, calculated as the stable carbon added to the soil via biochar minus the direct emissions from its production. This allows for rapid screening and comparison of different biochar production scenarios on a common basis. However, achieving true and accurate carbon neutrality assessment requires moving beyond this foundational tool. Its inability to account for critical indirect emissions—such as those from feedstock transportation, manufacturing of equipment, or changes in agricultural inputs—along with potential inaccuracies from non-representative default emission factors, means it can present an incomplete or skewed picture. Consequently, while the IPCC method is an essential and accessible starting point for policy-level estimates, verifying genuine carbon neutrality necessitates a more comprehensive approach, such as LCA, to capture full cradle-to-grave emissions and provide a robust, defensible claim of net carbon drawdown[114].
Life cycle assessment (LCA)
-
LCA is currently the most common method for evaluating carbon emissions that focus on the potential environmental impacts of all inputs and outputs throughout the life cycle of a product, service, process, or activity, from 'cradle to grave'[115−117]. LCA has been used to evaluate the environmental effects of VOCs or GHGs in previous studies[118,119]. For all auxiliary materials and/or carbon emissions generated by activities during the life cycle, the overall carbon emissions are comprehensively calculated according to emission factors (Fig. 6). Roberts et al.[120] used LCA to evaluate the carbon sequestration capacity of the pyrolysis biochar system for three different feedstocks: corn straw, yard waste, and switchgrass, as well as the economy of the system. The results showed that net GHG emissions of corn straw- and yard waste-derived biochar were −864 and −885 kg CO2e per t, respectively, of which 62%−66% were achieved by biochar sequestration. The net GHG emission of switchgrass-derived biochar pyrolysis system was +36 kg CO2e per t, which is mainly related to the calculation method of indirect effects of land use change. According to the LCA method, Li et al.[121] compared the potential impact of eight biochar or hydrochar preparation processes on the environment, and evaluated their environmental sustainability. The LCA results showed that RBC500, RS250-4, and SM250-4 showed the best performance, and the environmental load of SM250-4 preparation process was lower. The LCA reveals that the use of biochar or hydrochar has little impact on the environment. Matuštík et al.[122] found that despite the fact that LCA methodology is standardized and widely applicable, there are still huge differences among the LCA studies. The results show that the carbon sequestration potential of biochar application depends on the context of project and the approach adopted, especially the decisions relating to biochar. LCA results reveal that the treatment of biological carbon is a key factor affecting climate change. It is worth noting that LCA has a certain subjectivity when defining system boundaries, which may lead to some important links within the life cycle of the system not being included, resulting in incomplete carbon footprint assessment[123].
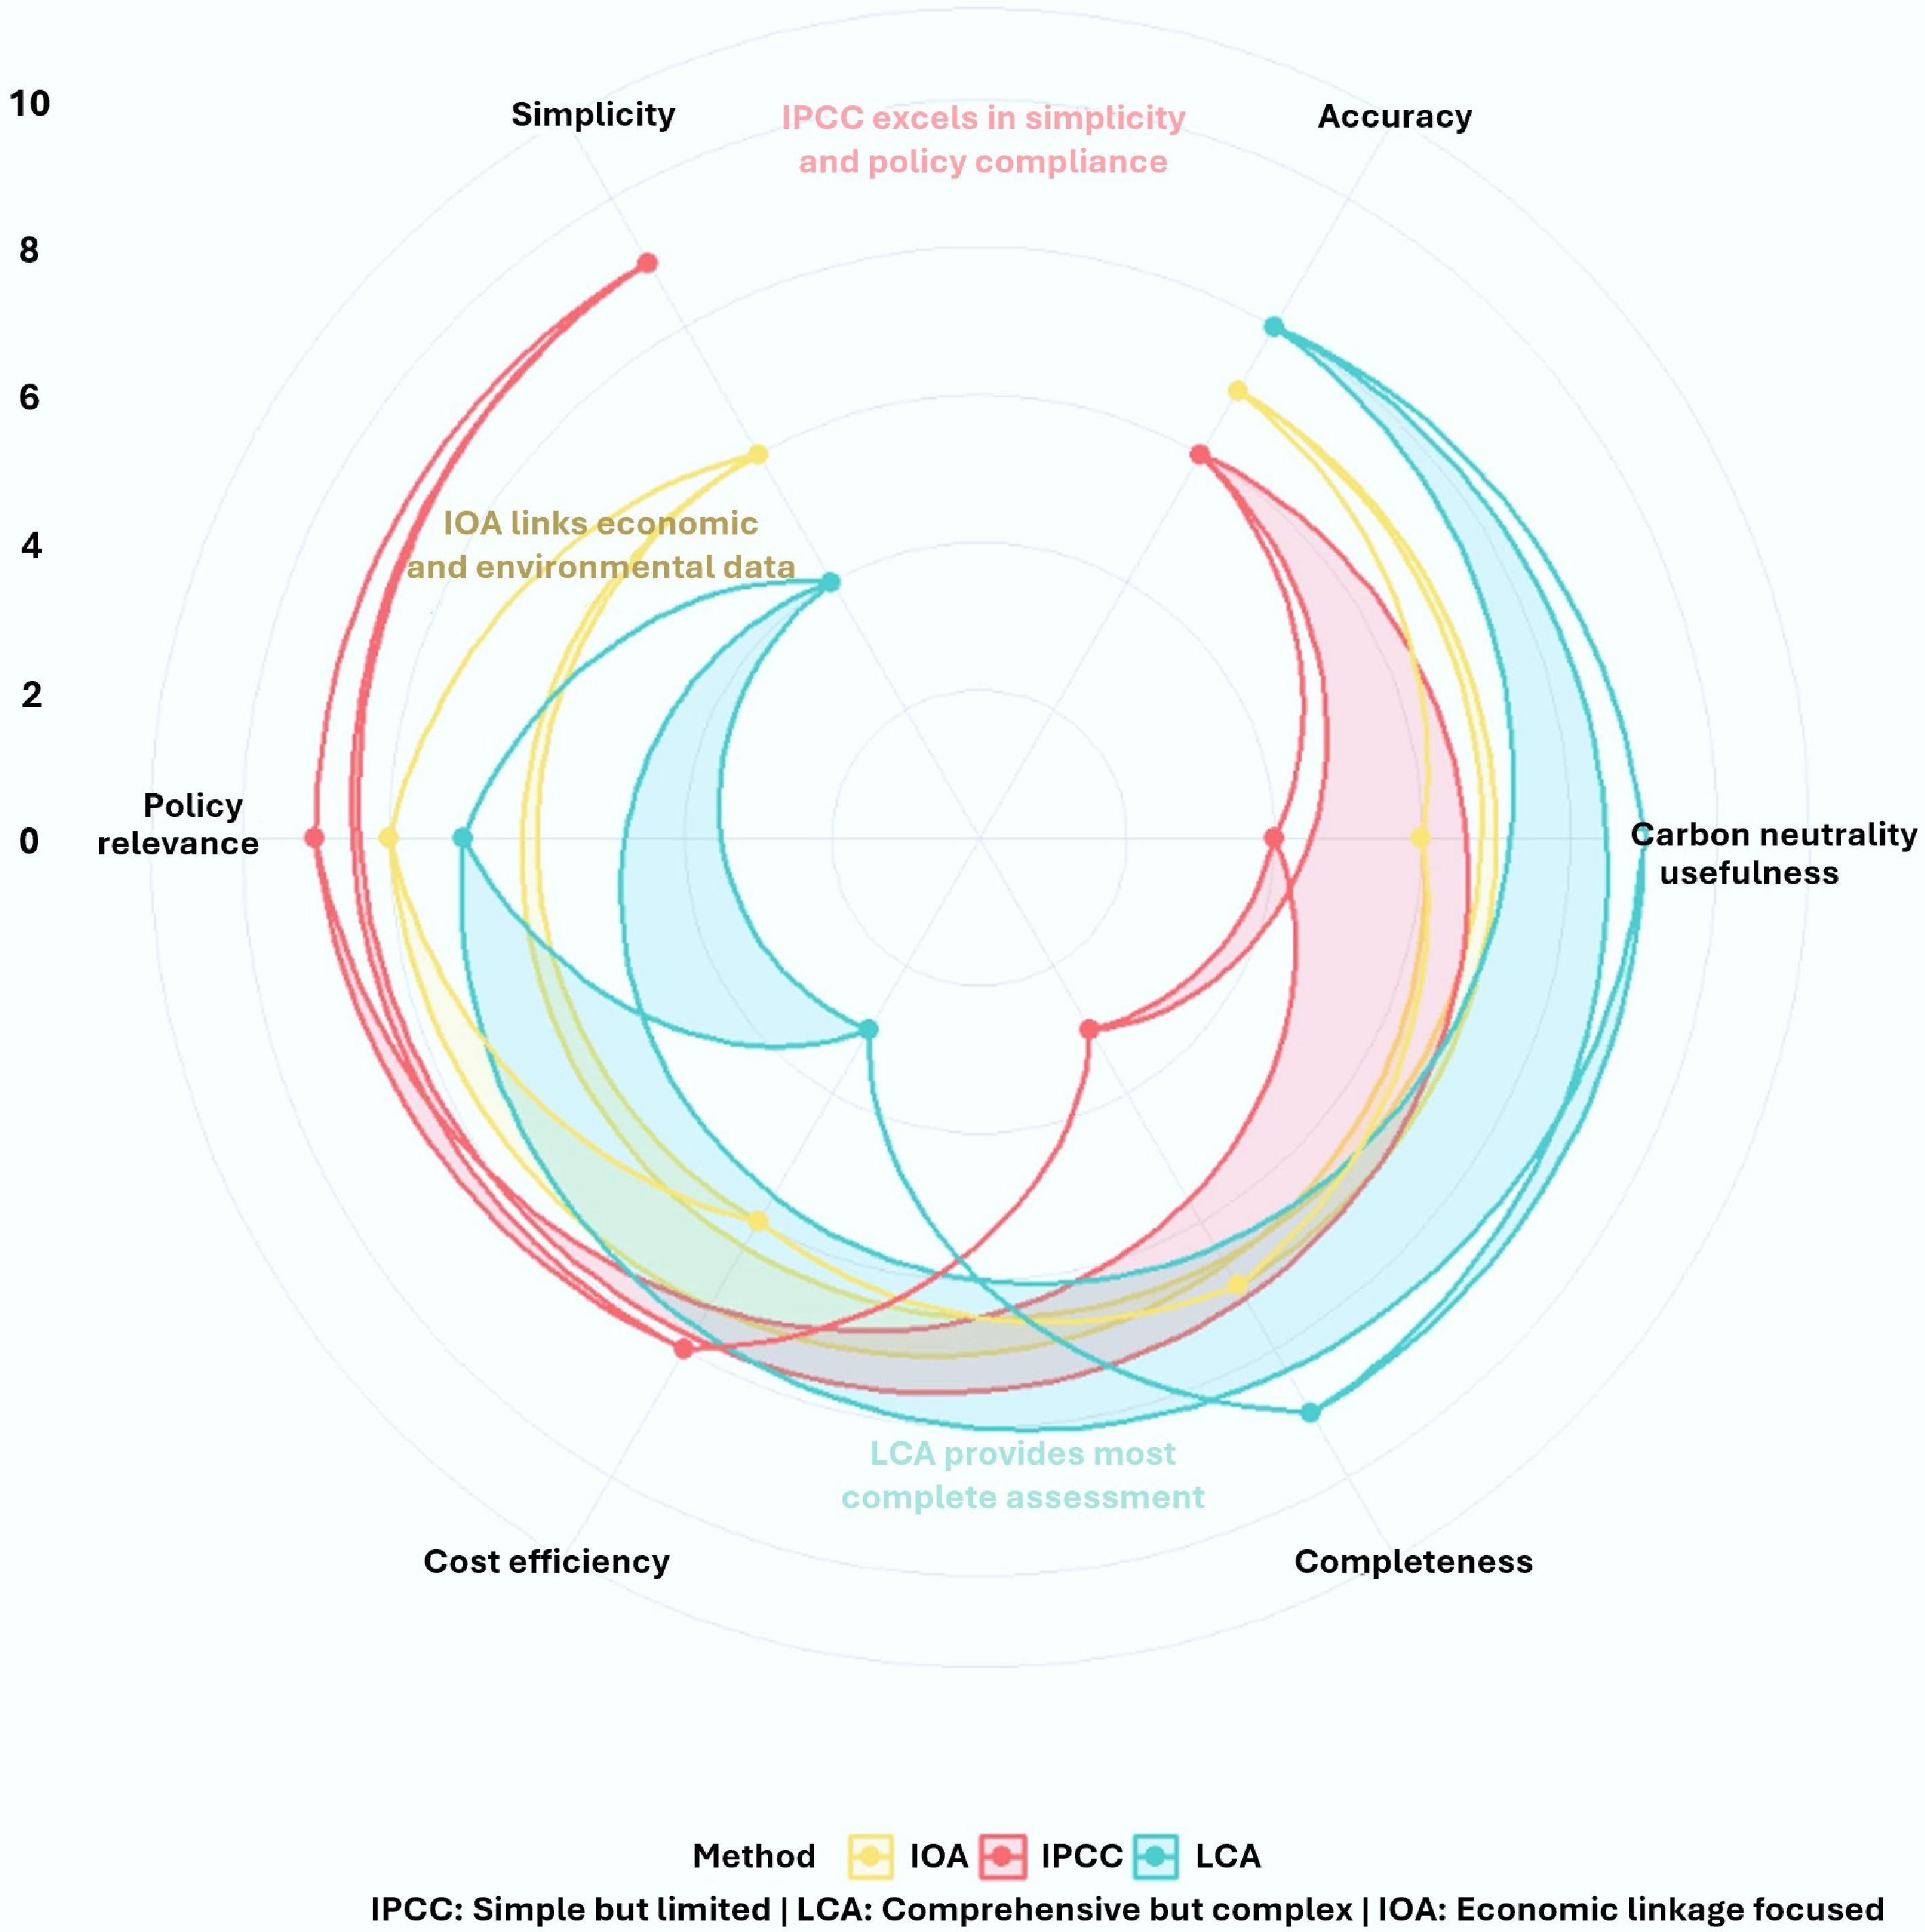
Figure 6.
Comparative evaluation of carbon accounting methodologies for biochar. Radar plot showing relative performance scores (0 = low, 10 = high) across six evaluation criteria. Each method displays characteristic strengths: IPCC for standardized direct emission estimates, LCA for comprehensive lifecycle analysis, and IOA for economic-environmental linkage assessment. The visualization highlights the methodological trade-offs necessary for selecting appropriate carbon assessment approaches in biochar research and policy development.
In summary, a robust evaluation of biochar's role in carbon neutrality requires a multi-faceted approach: the IPCC method offers a standardized, albeit simplified, estimate of direct emissions; 13C isotope techniques are critical for quantifying the pivotal in-situ mechanism of the priming effect, determining whether biochar acts as a net carbon sink or source; and LCA provides the most comprehensive 'cradle-to-grave' assessment, capturing system-wide emissions and revealing trade-offs. The ultimate carbon balance is governed by the interplay of biochar's inherent chemical recalcitrance, its ability to foster physical protection within soil aggregates, and its regulation of microbial processes governing N2O and CH4 fluxes. For future research, priorities should include the integration of these methods into a unified framework, the development of dynamic models that incorporate time-dependent priming effects and biochar aging, and the establishment of standardized LCA boundaries and region-specific emission factors to enable accurate, comparable, and scalable assessments of biochar's true potential for achieving agricultural carbon neutrality.
Input-output analysis (IOA)
-
IOA is widely used in inter-industry carbon emission research[124,125]. IOA is usually adopted to calculate carbon footprints considering both economic and environmental factors. For biochar industry, IOA is based on the improvement of the third part of the input-output table of industrial environmental economy. An input-output table associated with environmental inputs is shown in Table 3. The IOA employs an input-output model that reflects emissions from the biochar industry at a regional level. IOA mainly includes the construction of table and carbon footprint models, carbon footprint accounting and data analysis in which rows, columns, and totals in the input-output table need to be balanced. Compared with LCA, IOA can overcome the uncertainty of the system boundary of LCA. Although IOA shows the advantages of a simple process and reliable results, the calculation of carbon footprint based on IOA needs to ensure the accuracy of data sources. In addition, the IOA can only predict absolute indirect carbon emissions, rather than accurately assess them in the time dimension[126]. Moreover, IOA is usually used for carbon footprint accounting at the macro level, and their application at the micro level requires further study.
Table 3. Biochar's position in environmental input-output analysis
Sector Role in biochar system Key IO relationships Environmental link Agriculture Feedstock supplier → Provides biomass residues Sells biomass to biochar sector; Purchases biochar for soil amendment Provides carbon-negative feedstock; Reduces field burning emissions Biochar
productionCore processing → Converts biomass to stable carbon Purchases from multiple sectors; Sells to agriculture/energy/waste Direct pyrolysis emissions; Creates net carbon sink via stable C Energy Energy provider → Powers pyrolysis;
Can use syngas byproductSells electricity to biochar sector; May purchase syngas fuel Energy source emissions offset by renewable syngas utilization Transport Logistics network → Moves feedstock and final product Serves all sectors in supply chain; Major cost component Transport emissions partially offset by reduced fertilizer transport needs Waste
managementFeedstock source → Agricultural/forestry wastes Provides low-cost inputs; Reduces waste disposal needs Avoids landfill CH4 emissions; Converts waste to value Manufacturing Equipment supplier → Pyrolysis reactors, handling systems Capital investments; Technology development Embodied carbon in equipment offset by long-term sequestration In summary, a single evaluation method is insufficient to accurately and comprehensively calculate the carbon footprint. Determining whether the application of biochar to soil can achieve carbon sequestration and emission reduction requires comprehensive consideration of the entire life cycle, including feedstock acquisition, biochar preparation, transportation, carbon absorption, carbon emission, etc. A combination of multiple evaluation methods, such as LCA-IOA, will more fully capture the carbon sequestration behavior of biochar in soil.
Meta-analysis
-
In order to systematically compare the impacts of biological char application on soil GHG emissions and explore the differences among studies, a meta-analysis is usually adopted to precisely evaluate the potential of biochar for mitigating soil carbon based on a large number of relevant research. Zhou et al. collected 876 reported observations and conducted a global meta-analysis[127]. Results showed that the application of biochar and compost of different properties could reduce the emissions of N2O (−68.4%) and CH4 (−61.7%)[127]. Jiang et al.[128] used a multi-level meta-analysis method to quantify the carbon sequestration benefits of biochar in artificial wetlands and identified the main explanatory factors for biochar mitigation. The study showed that biochar could effectively reduce the emission of CO2, while its effect on CH4 and N2O was not significant[128].
Similarly, Telfeyan et al.[129] employed meta-analysis to investigate the response of GHGs to biochar application. Results showed that the application of biochar had a reverse effect on the fluxes of soil CO2 (increased by 22.14%) and N2O (decreased by 30.92%), with no effect on CH4 flux. It is worth noting that when biochar was applied to fertilized soil (such as nitrogen fertilizer), it would not affect the increase of soil CO2 flux[129]. The analysis also showed that biochar feedstock, pyrolysis temperature, and soil texture were key factors affecting soil GHG emissions, while soil pH and biochar application amount had less influence[129]. Additionally, the aging of biochar showed a strong correlation with its impact on soil GHG emissions[130]. Feng et al.[131] concluded through meta-analysis that aged biochar could effectively reduce CH4 emissions while having a negative effect on soil CO2 and N2O. Meanwhile, the artificial aging of biochar had little effects on reducing soil GHG emissions[131]. A complete comparison of these approaches is provided in Table 4.
Table 4. Comparative analysis of carbon assessment methods for biochar systems
Method Applicable scenarios Key advantages Main limitations Ref. IPCC emission coefficient method Initial screening of biochar systems
Policy-level carbon accounting
Standardized reporting for compliance
Rapid assessment of direct emissions
Comparison across standardized protocolsInternationally recognized standard
Simple calculation procedure
Low data requirements
Consistent and comparable results
Fast implementation time
Well-established for direct emissionsOnly accounts for direct emissions
Cannot capture indirect emissions (transport, manufacturing)
Uses generic emission factors that may not be region-specific
No economic linkages considered
Static assessment without temporal dynamics
May underestimate total carbon footprint[8,132,133] Life cycle assessment (LCA) Comprehensive product carbon footprint
Technology comparison (e.g., different pyrolysis methods)
Sustainability certification
Eco-design optimization
'Cradle-to-grave' system analysisComplete system boundary coverage
Captures direct and indirect emissions
Identifies environmental hotspots
Multi-impact assessment (not just climate)
Supports decision-making for process optimization
Dynamic modeling possibleData-intensive and time-consuming
Subjective system boundary definition
Complex modeling requirements
Allocation issues for co-products
Results sensitive to methodological choices
Regional specificity challenges[122] Input-output analysis (IOA) Regional carbon budgeting
Supply chain analysis
Economic-environmental policy planning
Sectoral emission analysis
Macro-scale carbon footprint assessmentCaptures economic interdependencies
Avoids system boundary truncation
Consistent sectoral data framework
Suitable for policy analysis
Time-series analysis capability
Good for regional/national scalesAggregated sector-level data (lacks product specificity)
Static coefficients (assumes fixed relationships)
Limited micro-scale applicability
Data lag issues
Cannot accurately assess temporal dynamics
Regional data availability constraints[134,135] -
Biochar is a complex matrix, and it is necessary to comprehensively consider the source of feedstocks, optimize the synthesis conditions, understand the composition of biochar, control the production cost, and consciously design biochar with a specific structure to achieve carbon neutrality. In this review, the principles and evaluation methods of soil carbon neutrality by biochar are elucidated, along with their mechanisms and potential, and a hybrid model is offered by combining the existing models of IOA, LCA, and IPCC. However, currently, the research on the stability of biochar applied to soil is still at a nascent stage, and the following work needs to be conducted in the future, including optimizing the preparation conditions of biochar and reducing production cost via large-scale field experiments, rather than laboratory experiments with promising and cost-effective biomass. Further, large-scale soil application of biochar needs optimization based on cost.
Many geo-environmental factors can impact the efficiency of biochar when applied to the soil. Once applied, a series of physical and chemical reactions occur on its surface, or it interacts with microorganisms, leading to the decomposition of biochar or structural damage. This reduces the stability of biochar and even aggravates soil carbon emission. Therefore, in future work, it is necessary to critically explore the factors that affect the durability of biochar in soil, such as soil pH, redox potential, microorganisms and so on. For acidic agricultural soils (pH < 6.0), an optimized biochar application model is proposed: use locally available crop residue feedstocks (e.g., rice straw, corn stover) pyrolyzed at 550–650 °C and applied at 5% by weight (≈ 10–15 t ha−1). This approach balances economic feasibility with remediation efficacy: low-cost residues reduce feedstock expenses by 40%–60%, while the specified pyrolysis range maximizes carbon stability (fixed carbon: 85%–90%, stability factor: 0.7–0.8) and ensures a high pH (9–11) suitable for acidity correction. Application at 5% optimizes agronomic benefits—including pH adjustment, enhanced cation exchange capacity, and crop yield increases of 10%–15%—while avoiding negative impacts on soil hydraulic properties associated with higher doses. Economic analysis shows this model can recover costs within two to three years via reduced lime (15%–25% savings) and fertilizer requirements (10%–20% savings), complemented by carbon credits of US
$ {\text{\$}} $ $ {\text{\$}} $ In addition, it should be noted that there are a variety of pollutants in the soil, such as heavy metals and organic pollutants, which may also undergo adsorption or catalytic degradation under the application of biochar. Investigating the decomposition behavior of pollutants and its relationship with soil carbon emissions is also a hot topic for future research. Furthermore, the carbon sequestration and emission reduction effects of biochar after aging also deserve further study. The design of multi-functional biochar with high activity and stability, such as those modified with nano zero-valent iron, metal-organic frameworks and photocatalysts, could improve soil carbon sequestration and conversion while remediating other soil pollution, thus maximizing the value of biochar. Application of biochar to soil might lead it to migrate horizontally or vertically, and also affect the distribution of SOC. Therefore, it is necessary to study the environmental behavior of biochar in soil profiles, especially for deep layers. The mechanism by which biochar application influences SOC at different soil depths needs to be unveiled. In addition, the application of biochar may affect the formation and particle size of soil aggregates. The interaction mechanism between soil aggregates and SOC should be investigated, and the influence of soil aggregates on the stability and PE of SOC should be systematically studied.
Soil PE is mainly induced by the import of root exudates or the decomposition of litter, with the rhizosphere as the hotspot to explore the soil PE effect. Understanding the mechanism and USinfluencing factors of biochar's rhizosphere PE is very important for understanding the realization of soil carbon neutrality by biochar. In soil, biochar undergoes progressive physicochemical changes, collectively known as aging, which fundamentally alters its surface functionality, porosity, and redox properties. These aging processes determine whether biochar exerts a positive or negative PE on native soil organic matter. Further study should systematically evaluate the relative impact of aging time, environmental factors (e.g., moisture, temperature, redox cycles), and initial biochar characteristics on the ultimate direction and extent of priming. Particular emphasis should be placed on distinguishing between abiotic (e.g., oxidation, hydrolysis) and biotic (e.g., microbial colonization, enzymatic modification) aging processes, since these two forms of aging have a different impact on the ability of biochar to be a net carbon sink or source over decadal timescales. There is also a need to combine field monitoring statistics over the long-term with dynamic LCA models, as the existing assessment of carbon neutrality frequently involves the use of models of the LCA that are also static with little empirical validation in the field. One major gap in research is the need to match long-term (> 10 years) field monitoring data, such as the tracking of in-situ GHG fluxes, carbon stocks in soil, and biochar persistence, with active LCA frameworks. This combination will facilitate time-dependent modeling carbon sequestration which incorporates nonlinearity in its processes in order to capture the saturation of biochar stabilizing capacity, priming effects, and the interaction with climate variability. It is necessary to develop such validated process-based models to produce credible carbon credit protocols, provide policy guidance on biochar permanence, and have an accurate estimate of the potential of large-scale biochar implementation to mitigate climate change over the century.
We appreciate Drs. Yongbin Qin, Chen Hu, Zichen Zheng, and Yu Wang for technical and language editing of this manuscript.
-
Not applicable.
-
The authors confirm their contributions to the paper as follows: Muhammad Mahroz Hussain: visualization, writing − original draft preparation; Ganghua Zhou: Writing − original draft preparation; Wan Yang: proofreading, writing-reviews and editing; Longfei Liu: proofreading, writing-reviews and editing; Chenhao Zhao: proofreading, writing − reviews and editing; Yao Huang: proofreading, writing − reviews and editing; Shengsen Wang: conceptualization, supervision, proofreading, writing reviews and editing. All authors reviewed the results and approved the final version of the manuscript.
-
Data sharing not applicable to this article as no datasets were generated or analyzed during the current study.
-
This work was financially supported by the National Natural Science Foundation of China (Grant No. 42277040), and the Qing-Lan Project of Jiangsu Province (2025).
-
The authors declare no conflict of interest in this research.
-
# Authors contributed equally: Muhammad Mahroz Hussain, Ganghua Zhou
Full list of author information is available at the end of the article. - Copyright: © 2026 by the author(s). Published by Maximum Academic Press, Fayetteville, GA. This article is an open access article distributed under Creative Commons Attribution License (CC BY 4.0), visit https://creativecommons.org/licenses/by/4.0/.
-
About this article
Cite this article
Hussain MM, Zhou G, Yang W, Liu L, Zhao C, et al. 2026. Biochar towards soil carbon neutrality: a critical review. Biochar X 2: e006 doi: 10.48130/bchax-0026-0004 

Biochar towards soil carbon neutrality: a critical review
- Received: 10 December 2025
- Revised: 05 January 2026
- Accepted: 12 January 2026
- Published online: 10 February 2026
Abstract: Biochar, a carbon-rich material produced from biomass pyrolysis, is a promising tool for achieving soil carbon neutrality and mitigating climate change. This review synthesizes the mechanisms through which biochar enhances carbon sequestration and reduces greenhouse gas (GHG) emissions. This review elucidates that biochar contributes to a net carbon sink through its inherent chemical recalcitrance by inducing a negative priming effect (PE), whereby it protects native soil organic carbon from microbial mineralization via physical encapsulation within aggregates and organo-mineral complexation. Furthermore, biochar application reduces N2O and CH4 emissions by altering soil conditions and microbial communities, promoting complete denitrification, and suppressing methanogenesis. Critically, the efficacy of biochar is governed by pyrolysis conditions and feedstock, which dictate its properties, and by application dosage. This study also evaluated methodologies for assessing its carbon balance, including PE measurement via 13C isotope tracing, IPCC emission coefficients, and life cycle assessment (LCA), highlighting the necessity of a comprehensive accounting framework. It is concluded that optimizing biochar production and application strategies is essential to maximize its role in sustainable soil management and achieving global carbon neutrality goals.
-
Key words:
- Biochar /
- Carbon sequestration /
- GHGs reduction /
- Evaluation method /
- Geochemical attributes