












-
Coffee is one of the most widely consumed beverage crops globally, characterized by a flavor profile that balances a combination of acidity, sweetness, and bitterness. These delightful sensory characteristics can be influenced by various factors, including the coffee genotypes, cultivation, post-harvest processing, roasting, and brewing[1]. One of the critical contributors to coffee beverage quality is the series of post-harvest handling performed to obtain green coffee beans suitable for roasting[2]. The composition of raw coffee beans is complex, containing over 1,000 different compounds with unique chemical properties[3]. These include many important flavor precursor compounds. Research has shown that the composition of proteins and carbohydrates correlates with flavor formation in roasted coffee beans through Maillard reactions, while the content of phenolic acids may contribute to the bitterness in roasted coffee beans[4,5]. In addition, coffee contains numerous bioactive compounds (such as caffeine, chlorogenic acid, etc.), which have an important psychostimulant effects on human perception. Moreover, the intake of coffee and its constituent compounds has been associated with improvement in various diseases[6].
Once coffee cherries are picked from the tree, they can be dried and used as beans for roasting in multiple primary processing methods. Wet processing and dry processing are the most traditional treatments. Of these, wet processing involves soaking peeled coffee cherries in water to remove mucilage, followed by natural drying. In contrast, dry processing entails fermenting and drying the coffee cherries directly in their natural environment. Typically, coffee roasted beans from wet processing have a clean flavor and bright fruit acidity, while coffee beans from dry processing have a more complex flavor with distinct tropical fruit flavors. Of course, with advancements in coffee processing technology, numerous innovative primary processing methods have emerged, such as semi-dry processing, anaerobic fermentation, wine yeast fermentation, and carbonic maceration, each imparting unique flavor profiles to the beans[7]. These emerging processes affected the coffee bean to various degrees. Chan et al.[8] reported that the processing method significantly affects the sensory quality, crude protein, fat, caffeine, and the content of other substances. For instance, anaerobically fermented coffee beans exhibit richer sensory attributes such as fruity, winey, woody, and caramelized flavors[9]. Such differences in quality affect the selling price. In particular, the farmers and industrialists look for coffee processing methods that can retain the maximum content of bioactive substances. Current research has shown that the caffeine content of anaerobically fermented coffee is higher than that of coffee fermented after washing[10]. Fermentation under anaerobic conditions increases the activity of lactic acid bacteria, which increases the concentration of lactic acid. Studies have shown higher levels of sucrose, lactic acid, and trigonelline in anaerobically fermented coffee compared to normal processes[9]. However, research has focused more on flavor quality and bioactivity of roasted beans for these primary processing methods, while analysis of green coffee beans has not been common.
In China, over 98% of coffee is produced in Yunnan province, where the 'Catimor' variety dominates Arabica coffee cultivation, accounting for more than 90% of the planted area[11]. With the continuous improvement of people's living standards, the coffee industry in China is experiencing significant growth. Coffee enterprises and farmers are constantly experimenting with emerging processing methods to meet increasing consumer demand, with anaerobic fermentation being the most common. Therefore, to better clarify the differences in green coffee beans between anaerobic fermentation and traditional processing methods, we systematically analyzed the non-volatile compounds and flavor precursors of the four processing methods using metabolomics techniques based on UPLC-ESI-MS/MS (Ultra Performance Liquid Chromatography-Electrospray Ionization-Quadrupole-Linear Ion Trap-Tandem Mass Spectrometry) in this study. The objective is to explore the characteristic components among different processing methods, elucidate the flavor properties and biological activities of the main differential compounds, and provide a theoretical reference for coffee farmers to choose the suitable initial processing method.
-
Fresh coffee cherries of the cultivated variety 'Catimor' were collected in March 2023 in Xinzhai Village, Lujiang Town, Baoshan City, Yunnan Province of China (25°1'35" N, 98°49'51" E; altitude: 1,200 m). The harvested coffee cherries were carefully sorted to remove unripe, overripe, and defective cherries, obtaining samples with consistent color and uniform size as test samples. The test samples were then divided into four portions, each weighing 10 kg, for different processing methods. The four processing methods used were wet processing (WP), dry processing (DP), anaerobic fermentation wet processing (AFWP), and anaerobic fermentation dry processing (AFDP). Among them, the wet processing (WP) involves mechanically depulping and subsequently submerging in water for 12 h to allow the mucilage to be thoroughly washed off and then left to dry naturally, whereas dry processing (DP) requires the coffee cherries to be dried naturally by placing them directly on the drying racks[12]. The processing method of anaerobic fermentation (AF) is similar to that of WP and DP, except that the fermentation is done in closed plastic bags. Vacuum extraction is used to remove air from the plastic bags, thereby ensuring an anaerobic environment[7,13]. Among them, the anaerobic fermentation wet processing (AFWP) refers to the addition of an anaerobic fermentation process to wet processing, whereby peeled coffee cherries are placed in a closed plastic bag in a completely anaerobic environment for 7 d before being placed in water for 12 h to clean the mucilage and dry naturally. The anaerobic fermentation dry processing (AFDP) entails sealing intact coffee cherries (with peels) in a closed plastic bag for 7 d under a complete anaerobic environment, prior to the drying process (dry naturally with the cherries fully intact). Coffee beans from four processing methods are uniformly dried to a moisture content of 11.0 ± 1.0 g/DW before samples are collected, thus ensuring uniform flavor and preventing deterioration. Lastly, a coffee hulling machine removes the hulls, and the coffee is collected for later use. All samples were analyzed with three biological replicates. The four experimental groups (WP, DP, AFWP, and AFDP) were subjected to UPLC-ESI-MS/MS analysis.
UPLC-ESI-MS/MS analysis of non-volatile compounds
-
Samples were vacuum freeze-dried by using a lyophilizer (Scientz-100F, Xinzhi Freeze Drying Equipment Co., Ltd., Ningbo, China) followed by grinding (30 Hz, 1.5 min) in a grinder (MM 400, Retsch, Düsseldorf, Germany). To each 50 mg of sample powder, 1,200 μL of 70% methanolic aqueous internal standard extract (−20 °C, 2-chlorophenylalanine, 1 PPM) was added. The mixture was vortexed six times, once every 30 min for 30 s, followed by centrifugation at 12,000 rpm for 3 min. The supernatant was aspirated, filtered (0.22 μm pore size), and stored in the injection vial for UPLC-ESI-MS/MS analysis.
The extracts were analyzed using a UPLC-ESI-MS/MS system (UPLC, ExionLC™ AD; MS, Applied Biosystems 4500 Q TRAP; Shanghai Sciex Analytical Instrument Tradition Co., Changning, Shanghai, China) at Metware Biotechnology Co., Ltd. (Wuhan, China). The analytical equipment and solutions were as follows: UPLC: the column was Agilent SB-C18 (1.8 µm, 2.1 mm × 100 mm); the mobile phase consisted of ultra-pure water (0.1% formic acid) for solvent A, and acetonitrile (0.1% formic acid) for solvent B. The elution gradient started at 0.00 min with a B phase proportion of 5%. Over the course of 9.00 min, the proportion of the B phase increased linearly to reach 95% and remained constant for an additional minute. From 10.00 to 11.10 min, the proportion of the B phase decreased back to 5% and maintained this level until reaching 14 min. The flow rate, column temperature, and injection volume were set to 0.35 mL/min, 40 °C, and 4 μL, respectively. The effluent was alternatively connected to an electrospray ionization (ESI)-triple quadrupole-linear ion trap (QTRAP)-MS. The ESI source operation parameters were as follows: source temperature 550 °C; ion spray voltage (IS) 5,500 V (positive ion mode)/−4,500 V (negative ion mode); ion source gas I, gas II, curtain gas were set at 50, 60, and 25 psi, respectively; the collision-activated dissociation was high. MRM scans were acquired using nitrogen as a collision gas (medium setting). Individual MRM transitions were optimized for declustering potential (DP) and collision energy (CE). A specific set of MRM transitions was monitored for each period according to the metabolites eluted within that period[14]. The metabolites were identified by searching the internal database and public databases (MassBank, KNApSAcK, HMDB, MoTo DB, and METLIN). For the internal database, it was constructed based on the standard materials and purified compounds. Additionally, some public databases also contain some information about metabolites that can be referenced directly. The metabolites were identified by comparing the accurate precursor ion (Q1) and production (Q3) values, retention time, and fragmentation pattern with the database. Supplementary Fig. S1 shows the substances detectable in the sample, with each chromatographic peak in a different color representing a detected metabolite.
Cup test of brewed coffee for sensory evaluation
-
The sensory evaluation of coffee (cup test) is conducted by a panel of five professional coffee tasters certified as Q-Graders, who assess each coffee sample across three cups. The coffee cupping process was conducted in strict adherence to the Specialty Coffee Association (SCA) standards. The cup test consists of three steps: first, after roasting green beans with the four different processing methods (using the same roast curve), 12 g of the roasted beans are ground into a powder, and the dry aroma is then sniffed; second, 250 mL of boiling water is poured over the coffee grounds, let to sit, and its wet aroma inhaled; and third, it is let to sit for 4 min, two spoons are used to skim the foam from the surface of the coffee liquid, and the formal cupping evaluation can begin, comprehensively assessing attributes such as flavor, aftertaste, acidity, body, balance, cleanliness, and sweetness.
Data analysis
-
Metabolite taxonomic statistics were performed using Microsoft Office Excel 2019 (Microsoft Corporation, Redmond, WA, USA). The barplots were then constructed by GraphPad Prism 8 (GraphPad Software Inc., San Diego, CA, USA). Unsupervised principal component analysis (PCA), hierarchical cluster analysis (HCA), and Pearson's correlation coefficient (PCC) analysis were performed in R (
www.r-project.org ) using the prcomp package, and cor function. For comparative analysis between different processing methods, differentially metabolites (DMs) were screened by variable importance projection (VIP) > 1 and absolute log2|Fold Change| > 1.0. The VIP values were extracted from orthogonal partial least squares discriminant analysis (OPLS-DA) results. It also included score plots and permutation plots, which were generated in the R package by using MetaboAnalystR. The metabolites were annotated in the KEGG compound database (www.kegg.jp/kegg/compound ), followed by mapping of DMs to the KEGG pathway database (www.kegg.jp/kegg/pathway.html )[15−17]. The pathways with significantly regulated metabolites were then fed into metabolite set enrichment analysis, and their significance was determined by the hypergeometric test's p-values. Graphic layouts were generated using Adobe Illustrator 2019 (Adobe Systems Incorporated, San Jose, CA, USA). -
The metabolome profiling of the coffee processed by the four methods resulted in the identification of 1,706 compounds belonging to 12 major classes. The largest number of compounds belonged to amino acids and derivatives (383, 22.45%), followed by phenolic acids (256, 15.01%), others (212, 12.43%), lipids (184, 10.79%), alkaloids (161, 9.44%), flavonoids (119, 9.44%), etc. (Fig. 1a). Generally, the four methods differed in their metabolomic profiles. To observe the general trends, we summed up the metabolic abundance of compounds in each class (Fig. 1b). Among them, AFDP had the highest abundance of amino acids and derivatives, nucleotides and derivatives, organic acids, flavonoids, and tannins. The metabolic abundance of lipids and alkaloids was significantly higher in anaerobically fermented coffee beans (AFWP and AFDP) than in those not anaerobically fermented (WP and DP). In the case of WP, it had the lowest levels of phenolic acids and others (including lactones, saccharides, and vitamins). Based on the relative metabolite intensity, the PC1 and PC2 explained 51.29% and 14.41% variability. The biological replicates of the same processing method were grouped, indicating that sampling was reliable (Fig. 1c). Similarly, the correlation between the replicates of the same processing method had a higher PCC (Pearson's correlation coefficient). AFDP vs WP (0.45–0.49), and AFDP vs DP (0.51–0.56) had the lowest PCCs, indicating that these processing methods are less similar in terms of their metabolome based on relative metabolite intensities (Fig. 1d).
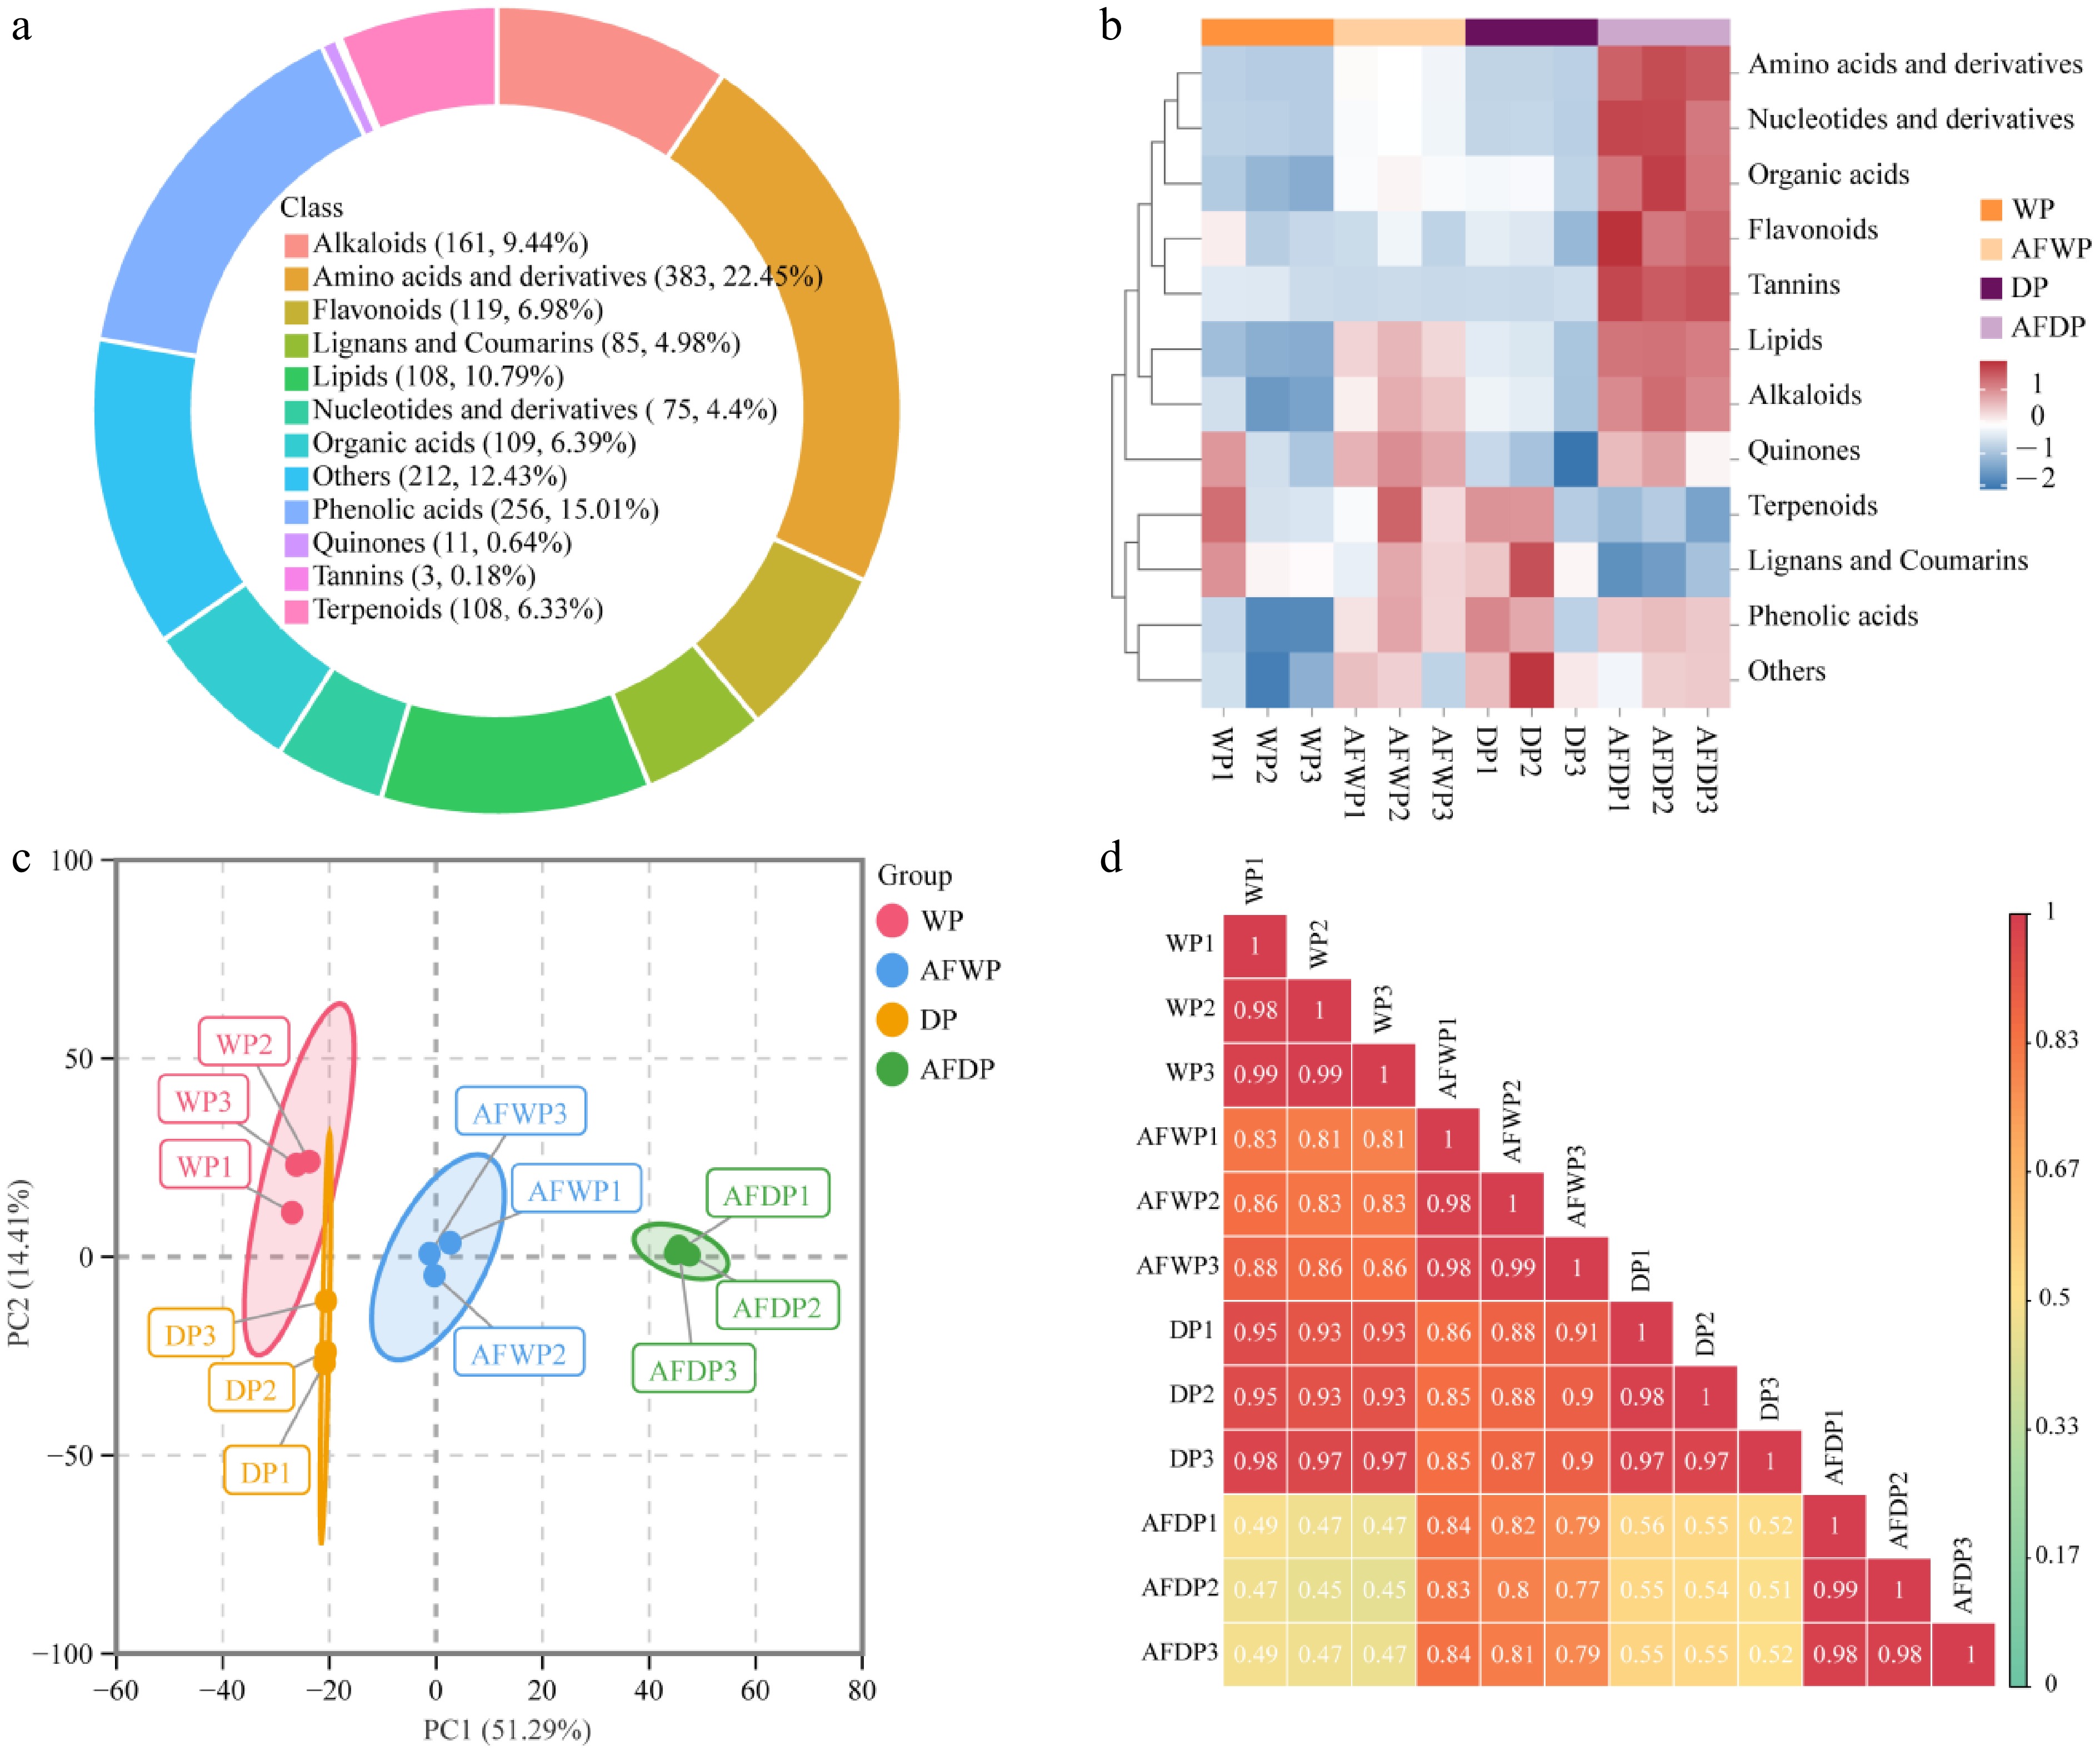
Figure 1.
Metabolome profile of coffee processed with four different methods. (a) Circle diagram of metabolite classification. (b) Heatmap of sum of relative metabolite intensities of compounds in each class. (c) Principal component analysis. (d) Pearson's correlation coefficient analysis.
Orthogonal Partial Least Squares-Discriminant Analysis (OPLS-DA) is a supervised multivariate statistical method designed to separate and amplify categorical differences between two sets of metabolic data while maximally removing information unrelated to categorical separation. To ensure the predictive performance of the model, it is essential to determine the optimal orthogonal group scores (R2X, R2Y, Q2) through cross-validation. In this context, R2X and R2Y indicate the explanatory power of the X and Y matrices, respectively, while Q2 reflects the model's predictive capability. The closer R2Y and Q2 are to 1, the more stable and reliable the model becomes. The results indicate that in the four comparison groups of different primary processing methods, namely WP vs DP, AFWP vs AFDP, WP vs AFWP, and DP vs AFDP (Supplementary Fig. S2), the R2Y values were 0.999, 1.000, 0.999, and 1.000, respectively, while the Q2 values were 0.943, 0.984, 0.976, and 0.989, respectively. Overall, R2Y exceeded 0.99 in all cases, while Q2 ranged from 0.943 to 0.989, indicating excellent data separation and model reliability. Furthermore, the VIP values derived from the OPLS-DA models can be utilized for screening differential metabolites.
Differential metabolome profiles of coffee processed with four methods
-
To clarify significant differences in metabolites in green coffee beans from different processing methods, differential metabolites were identified based on screening conditions of VIP > 1, FDR < 0.05 and log2|FC| > 1. In the WP vs DP group, a total of 80 DMs (including 63 upregulated metabolites and 17 downregulated metabolites) were identified (Fig. 2a). This clearly shows that the sun drying offers improved metabolite levels. This processing affected mainly amino acids and derivatives, organic acids, and saccharides (Supplementary Table S1). Based on the absolute values of the log2(fold change), Supplementary Table S2 lists the top 10 compounds that showed the most significant increase in metabolic abundance within this comparison group. In the DP group, the relative abundance of 4-pyrimazolinone, N6-(cis-hydroxyisopentenyl) adenosine, Met-Asn, N-acetyl-L-tyrosine, Leu-Glu-Ile, N',N''-diferuloylspermidine, and pyrocatechol monoglucoside increased significantly compared to the WP group, which includes 3 amino acids and derivatives, 2 alkaloids, 1 nucleotide and derivatives, and one additional compound. Conversely, the metabolites that showed significantly higher relative abundance in the WP group compared to DP were blumenol C glucoside, byzantionoside B, cyclo(L-Leu-trans-4-hydroxy-L-Pro), and N1, N10-bis(p-coumaroyl)spermidine.
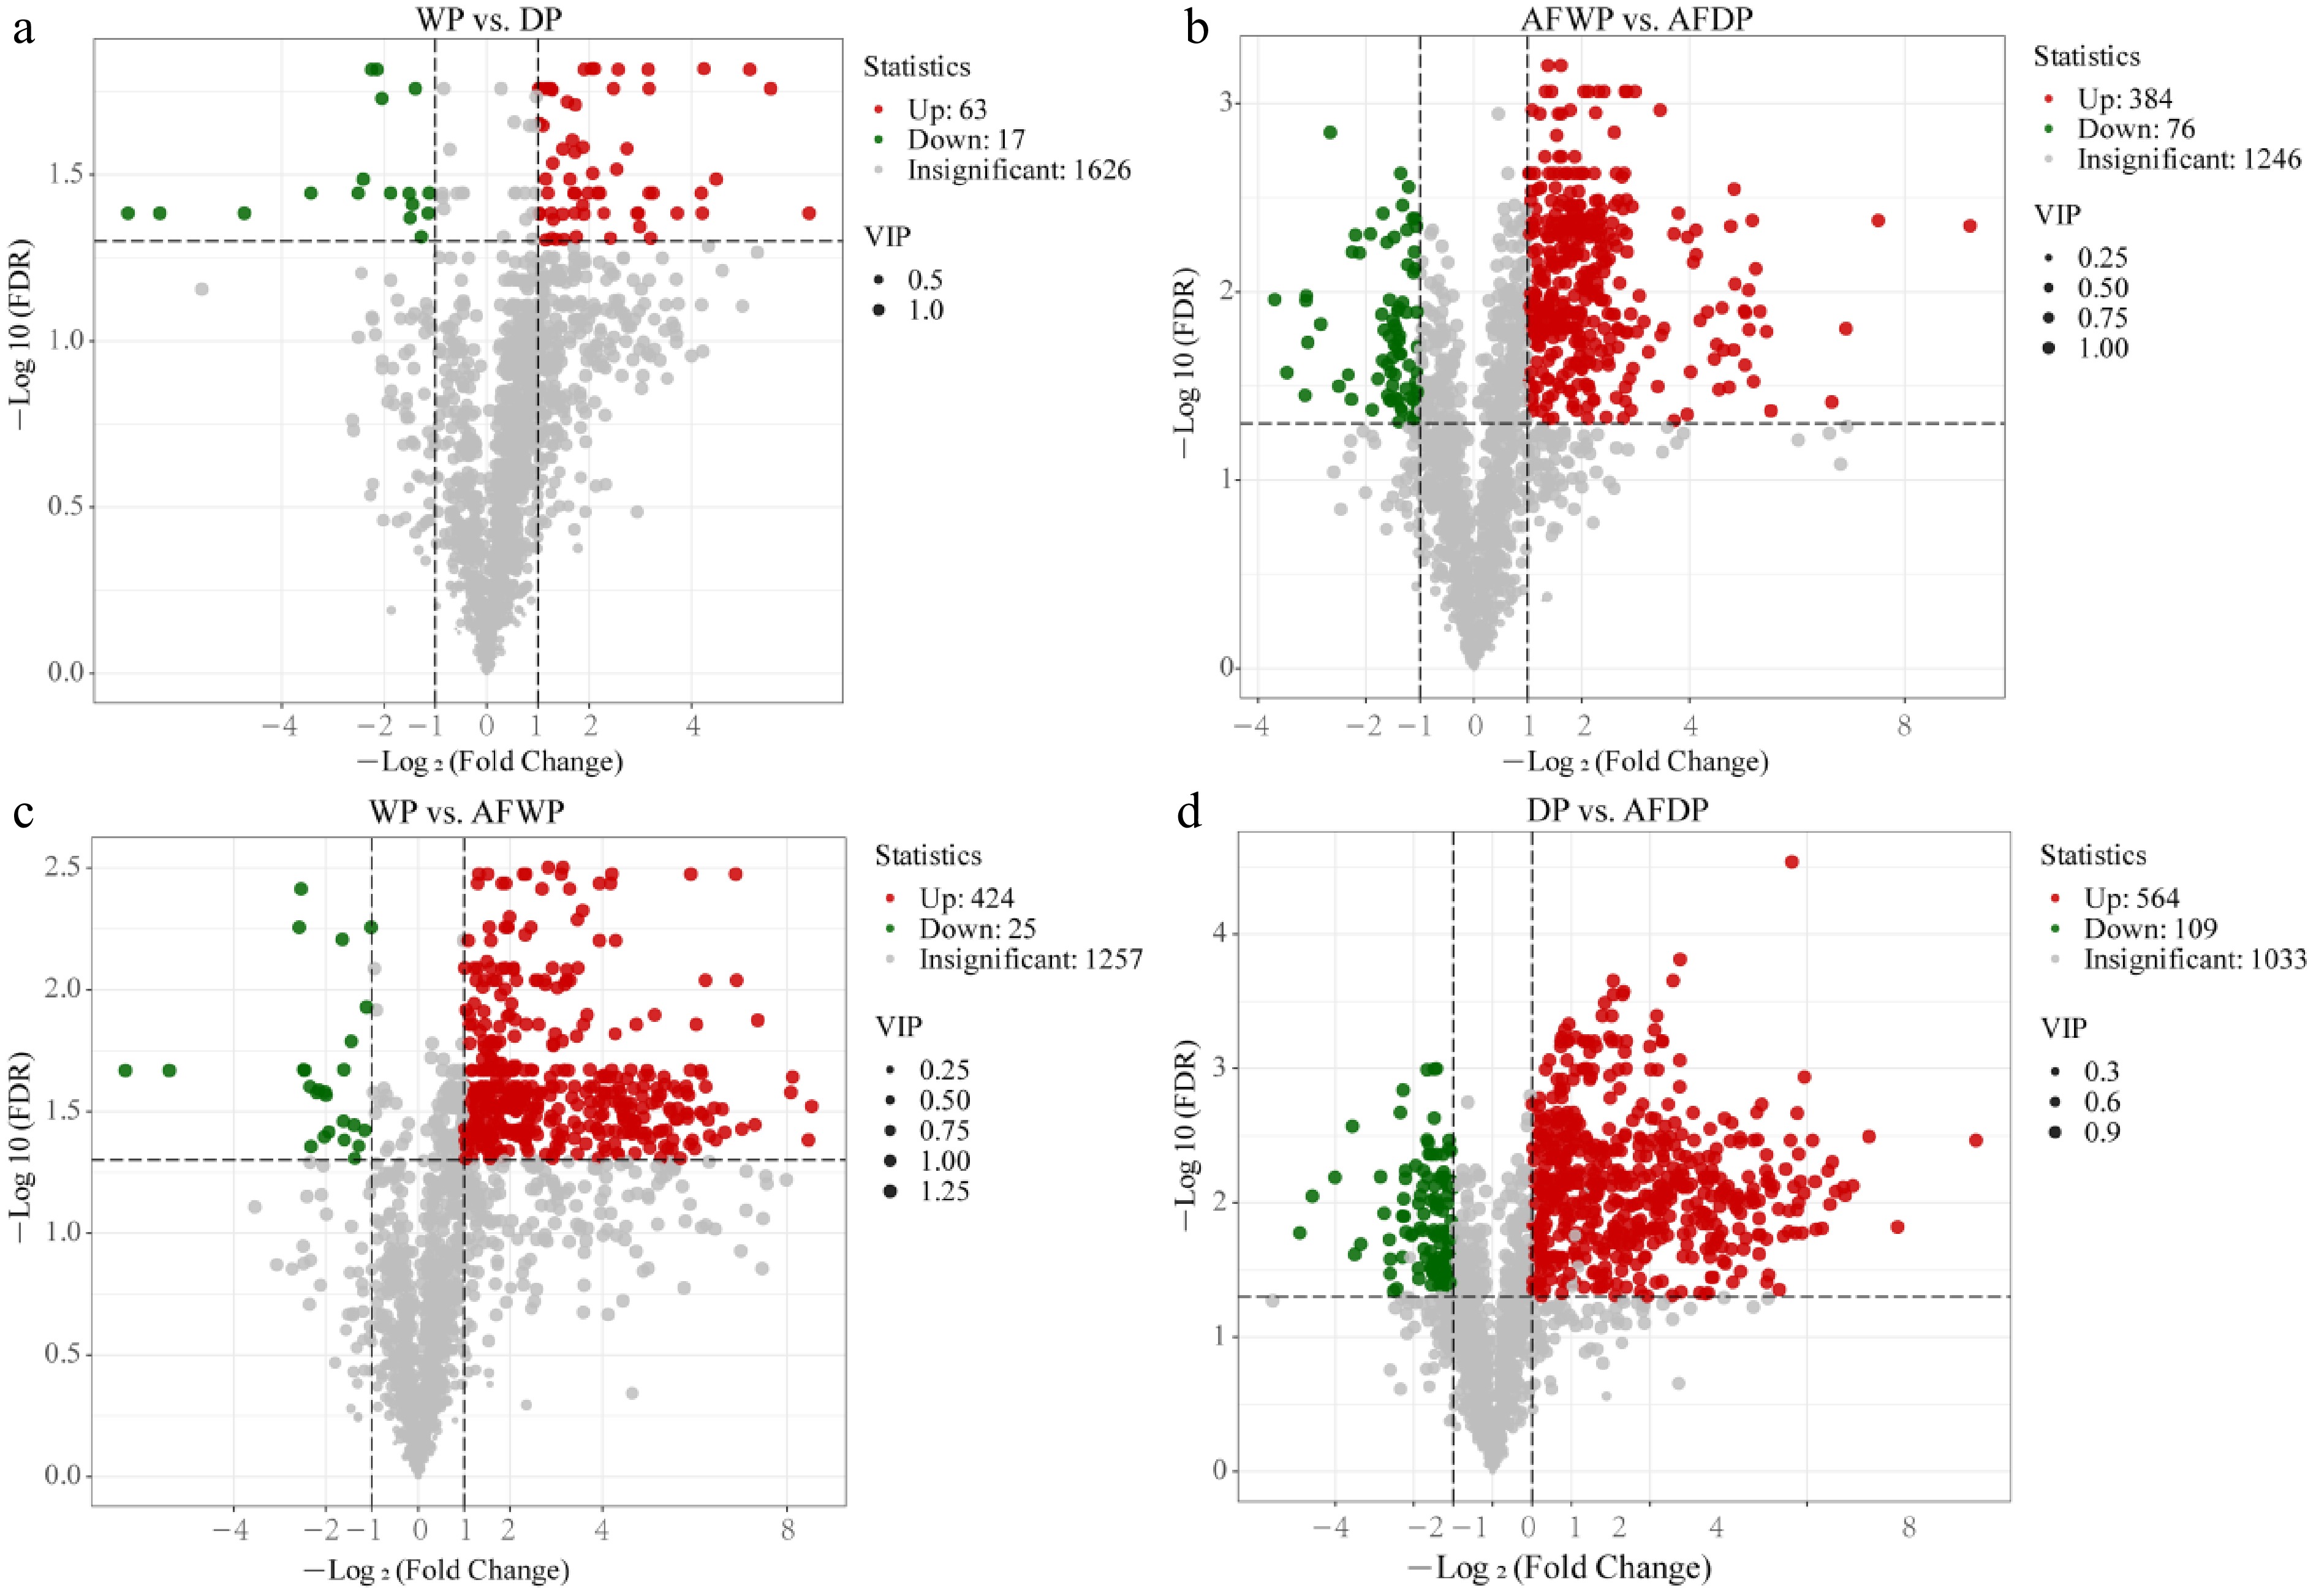
Figure 2.
Volcano plot of differential metabolites for different processing methods. (a) WP vs DP; (b) AFWP vs AFDP; (c) WP vs AFWP; (d) DP vs AFDP.
As shown in Fig. 2b, a total of 460 DMs (384 upregulated metabolites and 76 downregulated metabolites), including 210 amino acids and derivatives, 48 flavonoids, 45 phenolic acids, 35 lipids, and 29 alkaloids were identified in AFWP vs AFDP (Supplementary Table S1). The results indicate that anaerobic fermentation, followed by both wet and dry processing, yields a greater number of DMs compared to the conventional treatment group. Notably, the top 10 compounds with the highest fold changes were all found to be more abundant in AFDP. This list includes 5 flavonoids, 2 alkaloids, 2 tannins, and 1 organic acid (Supplementary Table S2). Among these, the flavonoids—such as quercetin-3-O-glucoside, quercetin-8-C-glucoside-4'-O-glucoside, quercetin-7-O-rutinoside, delphinidin-3-O-(6''-O-p-coumaroyl) glucoside, and kaempferol-3-O-neohesperidoside—as well as the tannins like procyanidin B2 and procyanidin B3, all demonstrated significant biological activity (Supplementary Table S2). These findings further suggest that dry processing under anaerobic conditions enhances the levels of bioactivity.
A total of 449 DMs were identified between WP vs AFWP, of which 424 showed higher relative metabolite intensities in AFWP (Fig. 2c). Similarly, between DP vs AFDP, 673 metabolites exhibited differential accumulation, with 564 demonstrating increased relative metabolite intensities in AFDP (Fig. 2d). These results indicate that anaerobic processing increases metabolite levels compared to conventional methods. Considering the number of DMs in each category, amino acids and derivatives, phenolic acids, and lipids are the most abundant (Supplementary Table S1). A large number of amino acids and derivatives exhibited significant differences after anaerobic fermentation, with log2(FC) values exceeding 9 for compounds such as Ile-Pro-Glu, L-leucyl-L-aspartyl-L-glutamine, His-Asn-Leu, and Leu-Pro-Ile, typically resulting from microbial fermentation-induced protein degradation (Supplementary Table S2).
In total, 843 DMs were identified across the four comparison groups subjected to different processing methods. These DMs included 279 amino acids and derivatives, 116 phenolic acids, 101 lipids, 60 flavonoids, 58 alkaloids, 51 organic acids, 44 nucleotides and derivatives, 42 other compounds, 36 saccharides, 29 terpenoids, and 20 lignans and coumarins (Supplementary Table S1). The Venn diagram illustrates the overlap and separation of various DMs across different comparison groups (Fig. 3a). Among these, 14 metabolites were identified as exhibiting significant differences across different processing methods, including N-Phenylacetylglycine, N-Acetyl-L-tyrosine, cyclo(L-Leu-trans-4-hydroxy-L-Pro), h-gamma-Glu-leu-oh, N-(1-deoxy-1-fructosyl)phenylalanine, Glu-Val-Ile, Gly-Leu-Phe, Pro-Leu-His, Leu-Glu-Ile, isoleucyl-glutamyl-leucine, 11-HEDE, 2-hydroxy-4-methylpentanoic acid, 2,5-dihydroxybenzaldehyde, and 4-hydroxyphenyllactic acid (Supplementary Table S3). These encompassed 10 amino acids and derivatives, one phenolic acid, one lipid, one organic acid, and one aldehyde (classified under other compounds). These may serve as potential biomarkers for distinguishing different processing methods.
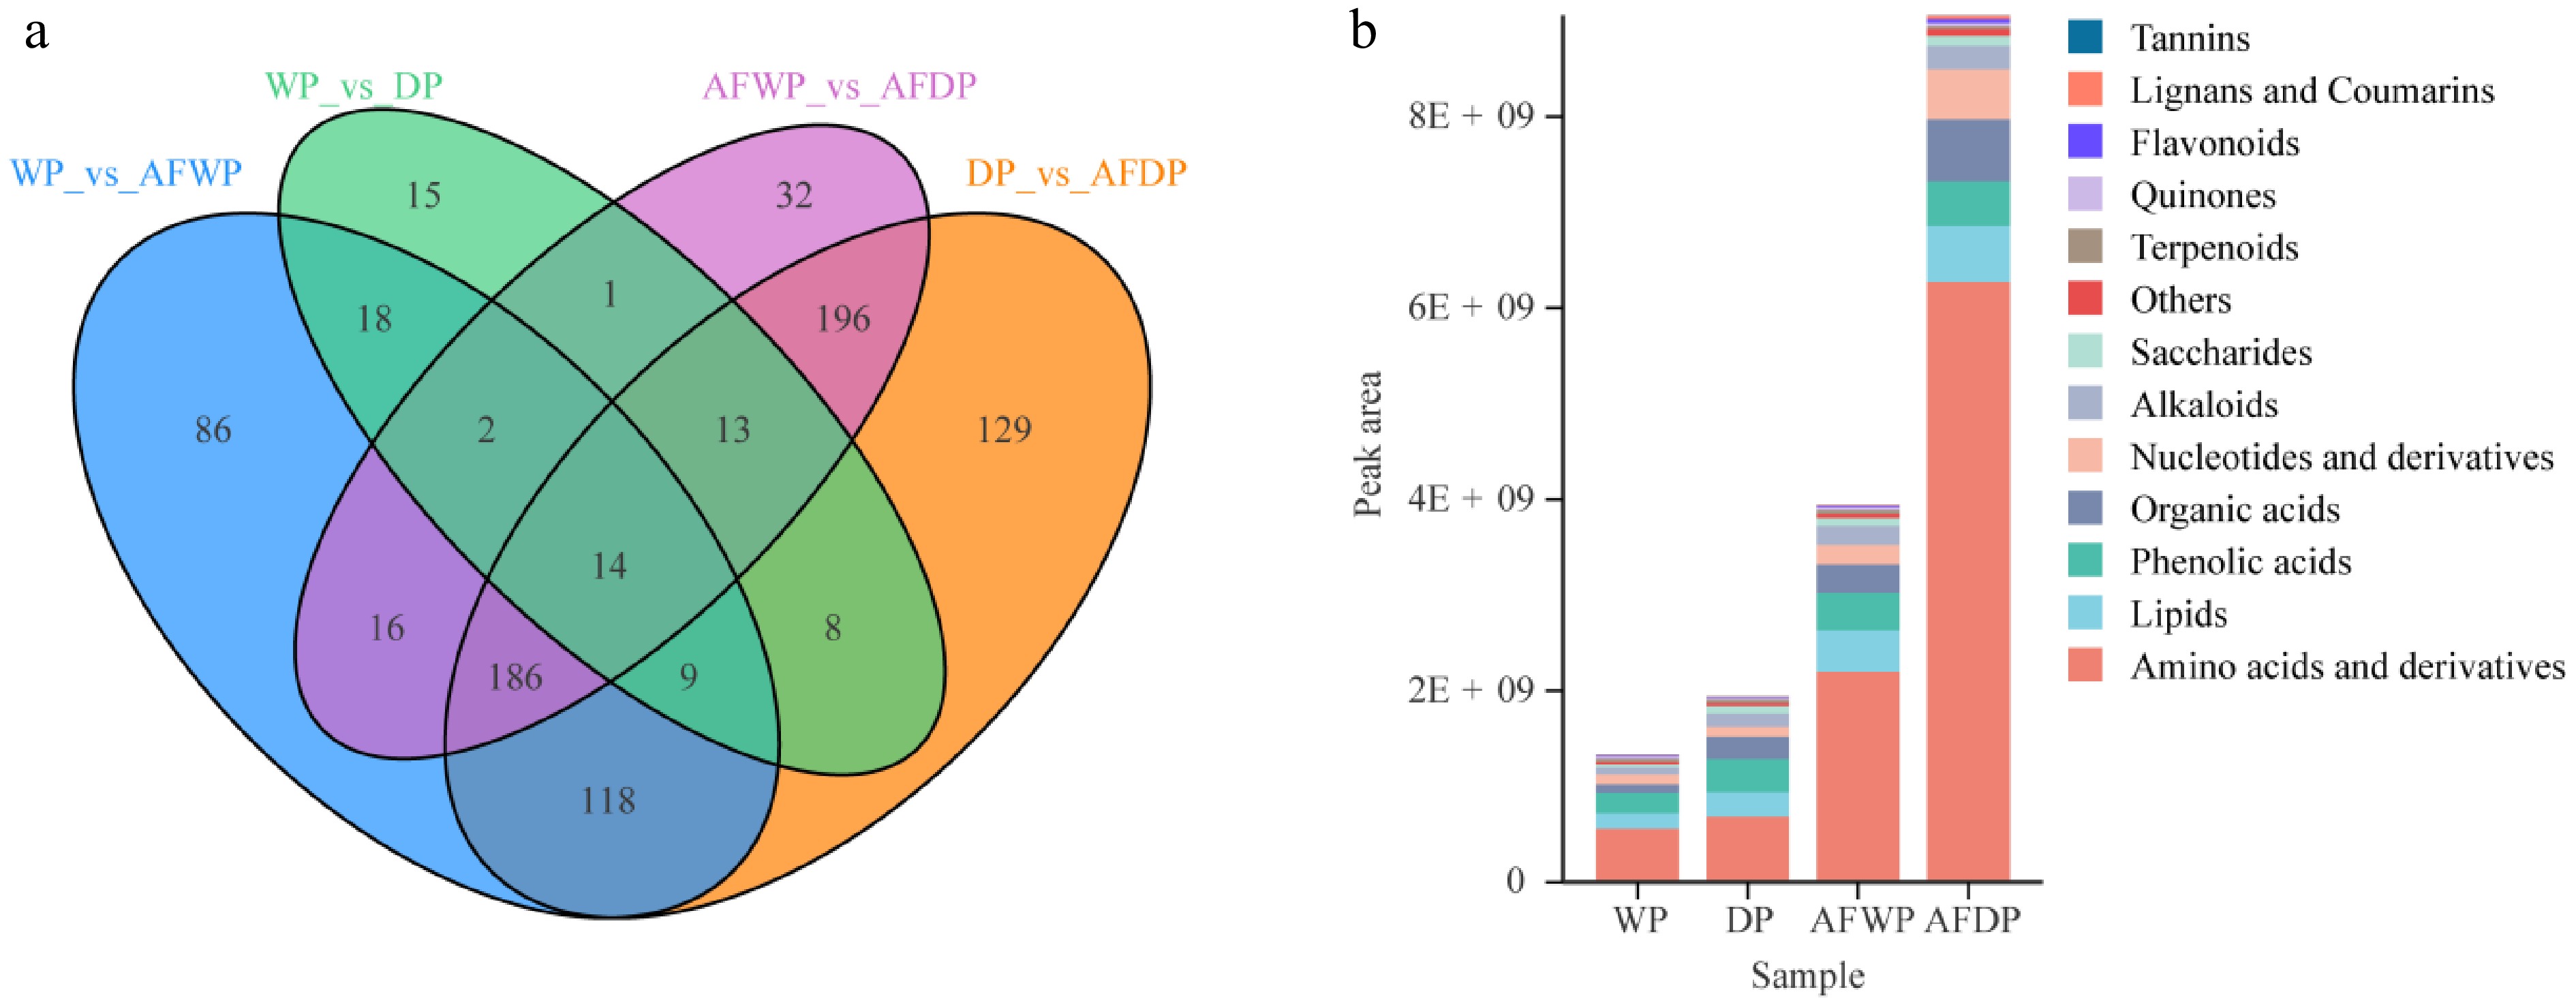
Figure 3.
(a) Venn diagram of differential metabolites for each comparison group; (b) histogram of relative content of differential metabolites.
With regard to the peak area of all differential metabolites (Fig. 3b), the abundance of metabolites from dry processing was higher than that from wet processing, regardless of whether anaerobic treatment was applied. Furthermore, the relative content of metabolites in green coffee beans increases significantly after anaerobic fermentation. Among these, amino acids and derivatives constitute the primary differential metabolites, followed by primary metabolites, which are dominated by lipids and organic acids, and secondary metabolites, primarily composed of phenolic acids. The significant differences in metabolic profiles may cause coffee beans processed with different methods to produce distinct flavors.
Effect of different processing methods on metabolic changes in key pathways
-
To further clarify the biological pathways involved in the significant enrichment of DMs between the different processing methods, we performed a KEGG enrichment analysis. According to the KEGG annotation, 6, 9, 17, and 13 pathways significantly enriched pathways (p < 0.05) were identified in the comparisons of WP vs DP, AFWP vs AFDP, WP vs AFWP, and DP vs AFDP, respectively. As shown in Fig. 4a, for the WP vs DP group, the representational enriched terms were phosphotransferase system (ko02060), pentose phosphate pathway (ko00030), arginine and proline metabolism (ko00330), fructose and mannose metabolism (ko00051), and galactose metabolism (ko00052). For the AFWP vs AFDP group (Fig. 4b), the representational enriched pathways were flavonoid biosynthesis (ko00941), anthocyanin biosynthesis (ko00942), folate biosynthesis (ko00790), nucleotide metabolism (ko01232), flavone and flavonol biosynthesis (ko00944). For the WP vs AFWP group (Fig. 4c), the representational enriched pathways were GABAergic synapse (ko04727), biosynthesis of plant hormones (ko01070), degradation of aromatic compounds (ko01220), cAMP signaling pathway (ko04024), and glyoxylate and dicarboxylate metabolism (ko00630). For the DP vs AFDP group (Fig. 4d), the representational enriched pathways were purine metabolism (ko00230), nucleotide metabolism (ko01232), propanoate metabolism (ko00640), biosynthesis of phenylpropanoids (ko01061), and aminobenzoate degradation (ko00627).
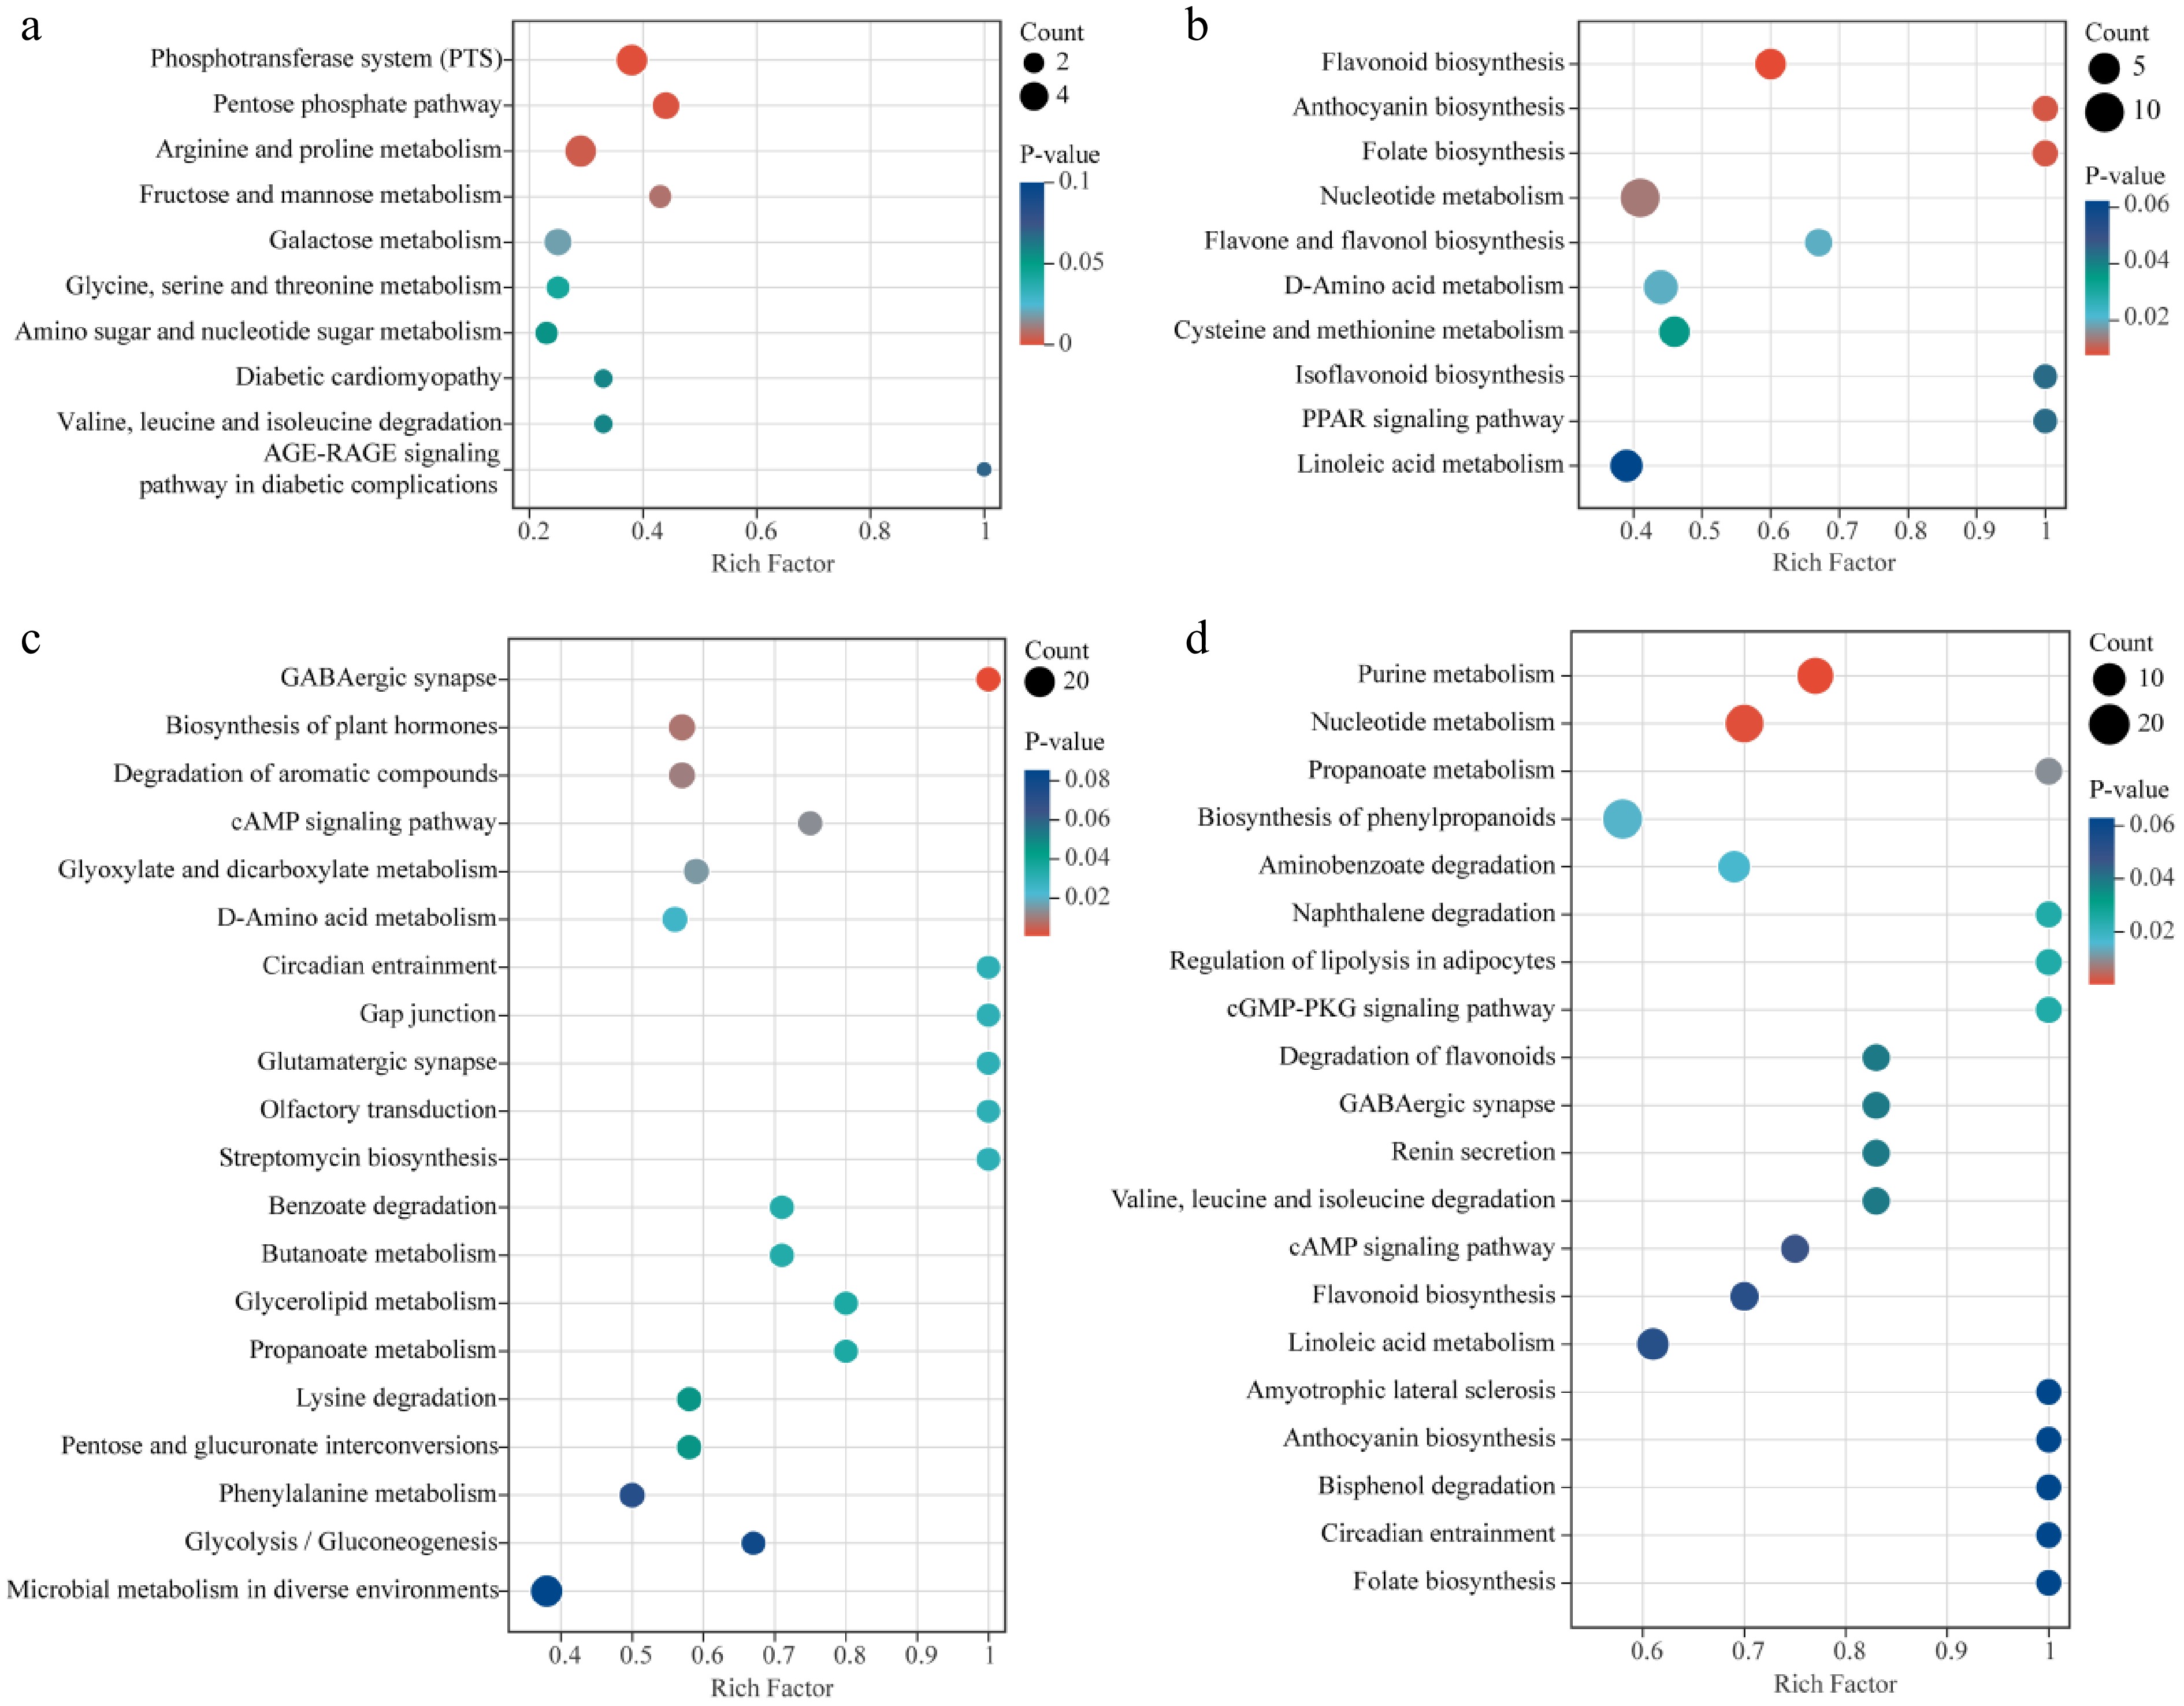
Figure 4.
KEGG enrichment analysis of differential metabolites. (a) WP vs DP; (b) AFWP vs AFDP; (c) WP vs AFWP; (d) DP vs AFDP.
Correlation analysis of characteristic metabolites between different processing methods
-
As previously mentioned, KEGG pathway analysis across the four comparison groups identified a total of 45 significantly differentially expressed metabolic pathways, encompassing changes in the metabolic abundance of 125 DMs. These metabolites from the four processing methods were grouped into four clusters using a hierarchical cluster analysis (Fig. 5a). Cluster 1 comprises 17 DMs, primarily characterized by differences before and after anaerobic fermentation (the metabolic abundance of AFWP and AFDP was significantly higher than that of WP and DP), including five organic acids, four phenolic acids, four saccharides, three alkaloids, and one nucleotide and derivatives. Cluster 2 contains 11 DMs, which include five organic acids, three phenolic acids, two saccharides, and one amino acid and derivatives. In this cluster, nearly all metabolites exhibit higher expression abundance in DP, including some important organic acids such as cinnamic acid, ferulic acid, sinapic acid, as well as phenolic acids like 2-hydroxybutyric acid, β-hydroxyisovaleric acid, and diethyl phosphate. Cluster 3 consisted of the largest number of DMs, primarily including 17 nucleotides and derivatives, 14 flavonoids, 13 amino acids and derivatives, 13 phenolic acids, 10 organic acids, 10 saccharides, and others. In this cluster, all of the 88 DMs exhibited significantly higher abundance in AFDP, involving multiple pathways related to flavor formation and biological activity, such as nucleotide metabolism, phenylpropanoid biosynthesis, and flavonoid degradation. These results indicate that anaerobic conditions generally had a positive effect on metabolite levels, particularly demonstrating greater efficacy in dry processing. Cluster 4 exhibits notably high abundance primarily in the WP group, mainly comprising nucleotides and derivatives associated with the phosphotransferase system, such as adenosine 5'-diphosphate, 2'-deoxyinosine-5'-monophosphate, inosine 5'-monophosphate, and adenosine 5'-monophosphate.
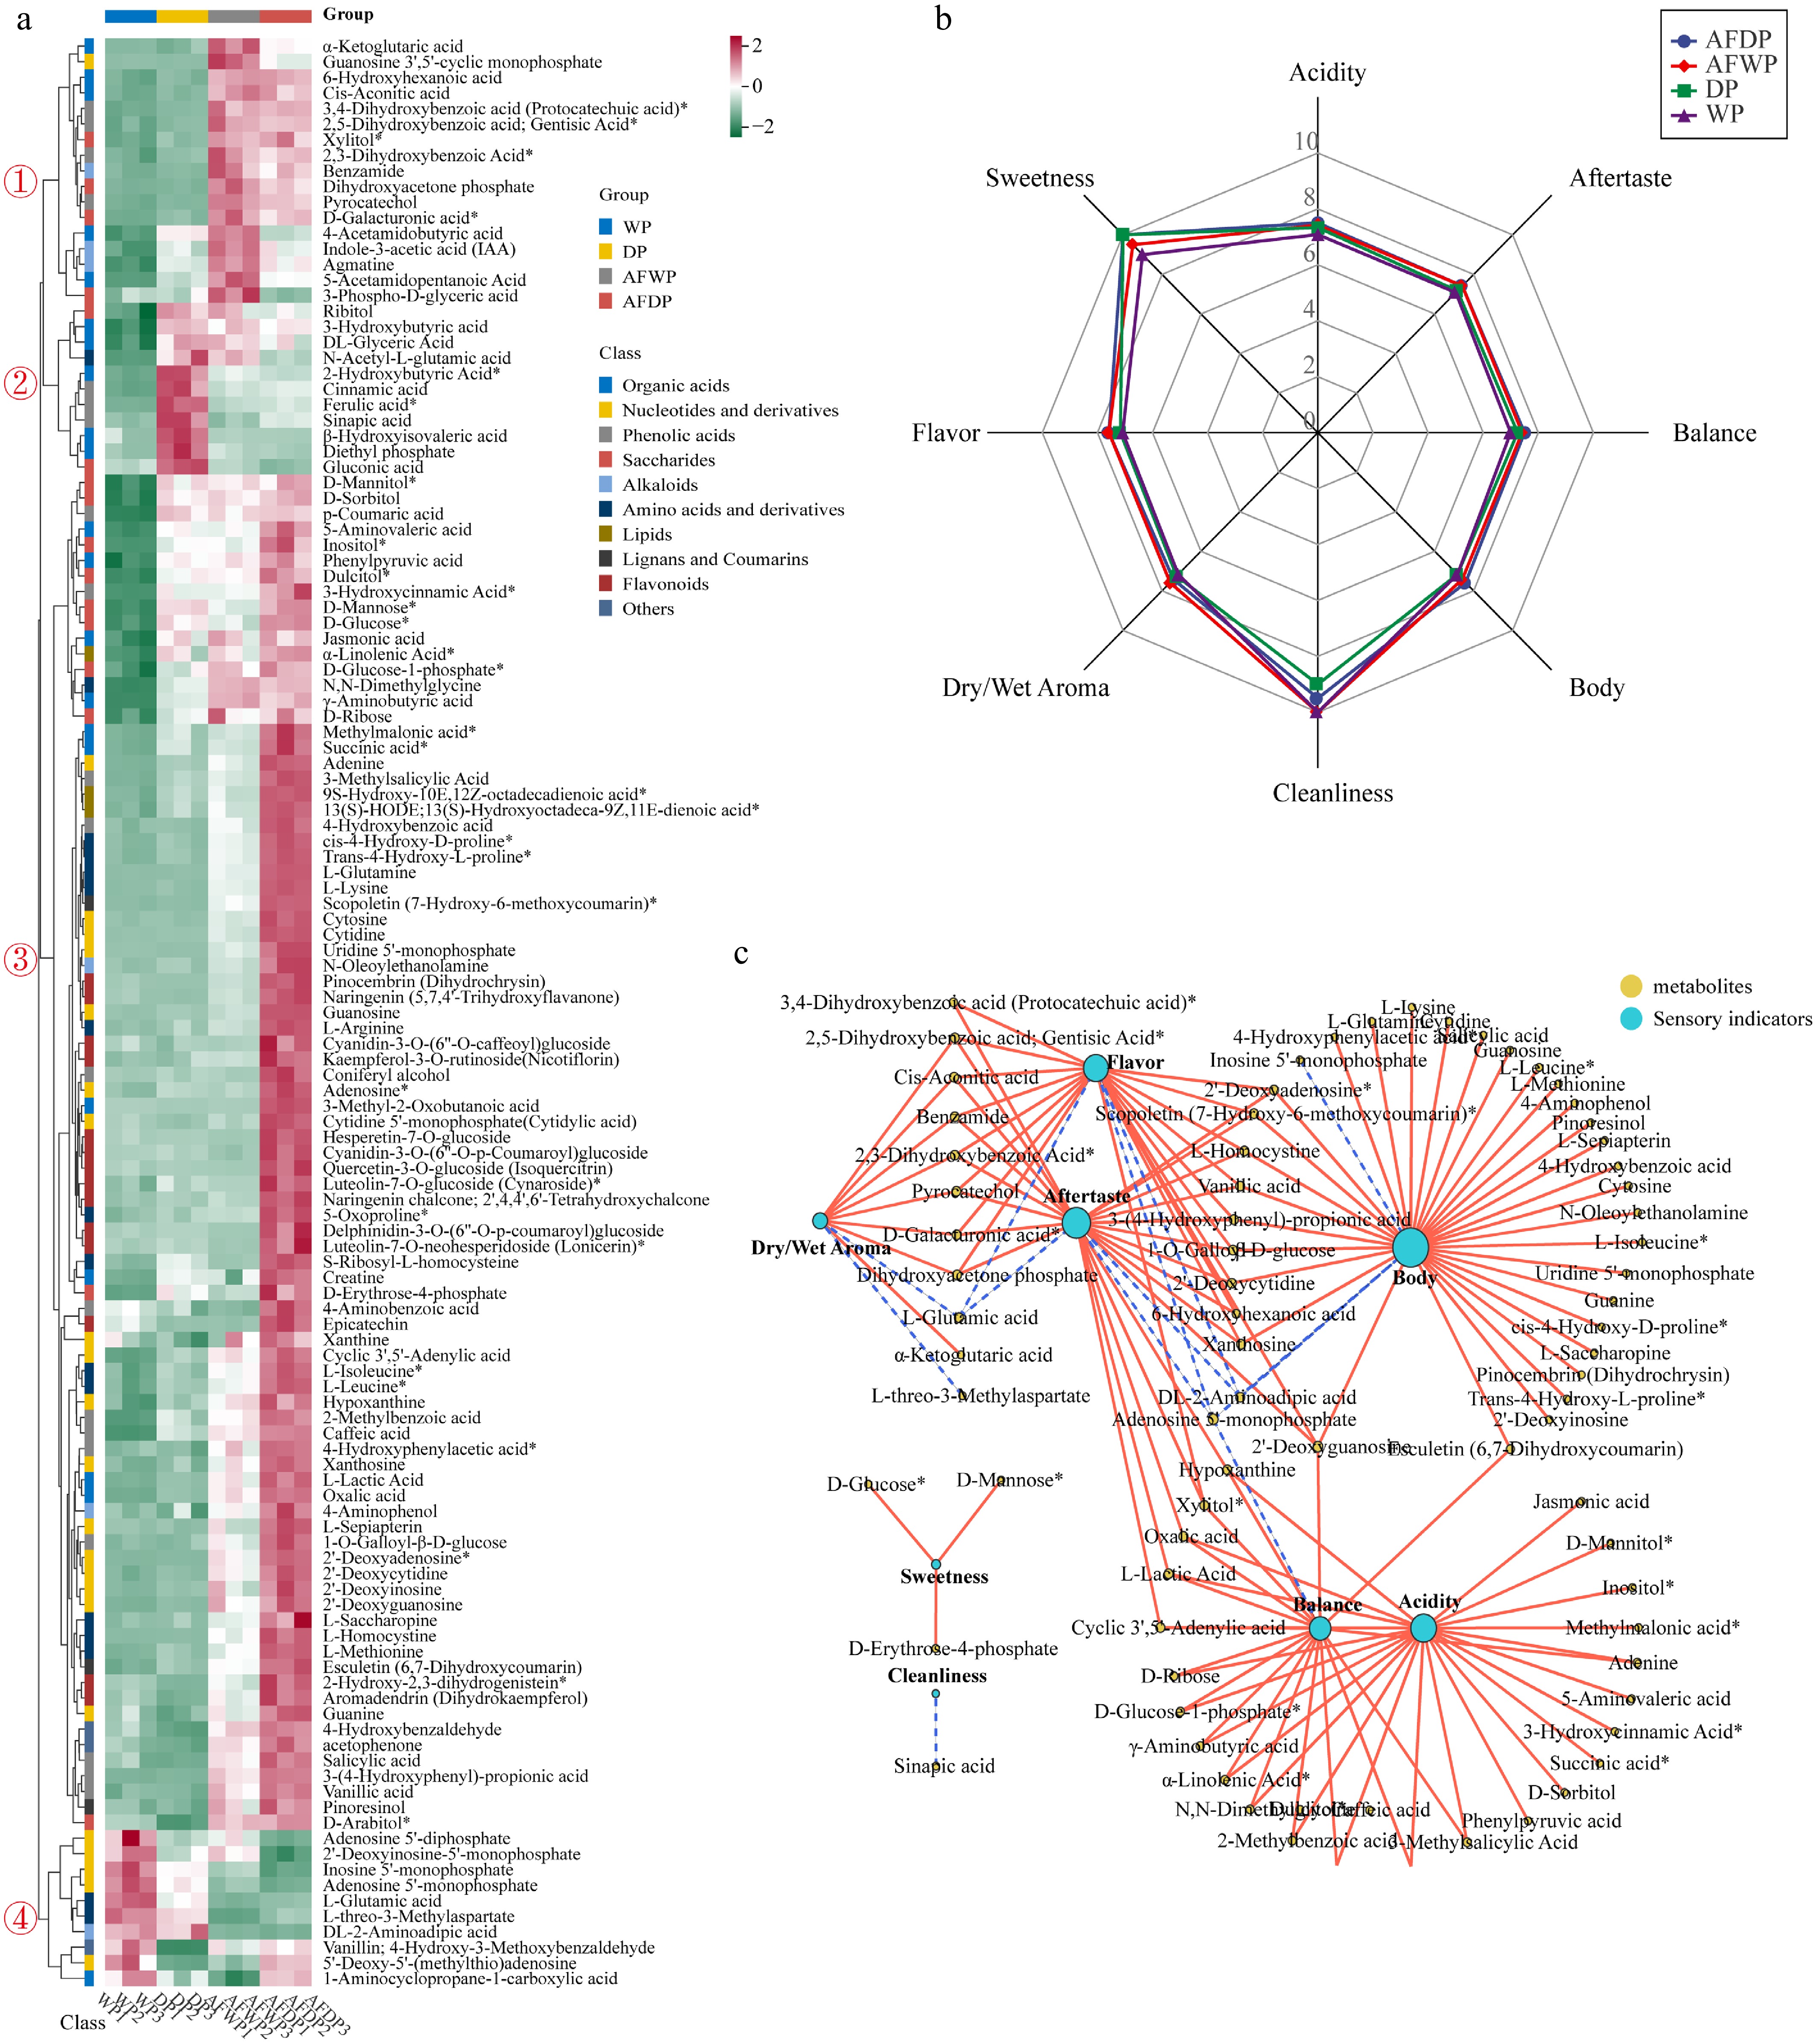
Figure 5.
(a) Hierarchical clustering analysis of characteristic metabolites and different processing methods, four clusters were generated, the relative content of metabolites were shown from green (low) to red (high) and data were Z-score standardized; (b) scores of cup test by Q-graded coffee panelists; (c) sensory indicators-characteristic metabolites interaction network analysis, the correlation coefficients were calculated using Pearson's test (r2 > 0.9, p < 0.05), the solid red line represented a positive correlation, the dashed blue line represented a negative correlation.
Sensory analysis of brewed coffee
-
Figure 5b presents the cupping score of Arabica coffee prepared from different processing methods. Sensory analysis of brewed coffee by the Q-graded coffee certified panel showed that anaerobically fermented coffee (ADWP and AFDP) outperforms conventionally processed coffee (WP and DP) in dry/wet aroma, flavor, aftertaste, acidity, body, and balance. According to observed bioactive and non-volatile compounds, samples anaerobically fermented had higher concentrations of all compound groups. The higher composition of these samples may be responsible for the high scores of the attributes mentioned above. However, regardless of whether anaerobic fermentation is employed, wet-processed coffee exhibits higher cleanliness and lower sweetness compared to dry-processed coffee.
Pearson's correlation analysis between sensory indicators and abundance of characteristic metabolites
-
To eliminate the effects of quantity on pattern recognition, we applied a log2 transformation of peak areas for 125 DMs, followed by a Pearson's correlation analysis between them and the sensory indicators (r2 > 0.9, p < 0.05). The analysis revealed that almost all DMs were positively correlated with sensory indicators. Within the network, 38 characteristic metabolites were associated exclusively with a single sensory indicator. Among these, the highest number of characteristic metabolites (23) showed significant correlation with body, primarily including eight amino acid derivatives, L-glutamine, L-saccharopine, L-methionine, trans-4-hydroxy-L-proline, L-leucine, cis-4-hydroxy-D-proline, L-isoleucine, L-lysine, and 8 nucleotide derivatives, inosine 5'-monophosphate, 2'-deoxyinosine, L-sepiapterin, guanosine, cytosine, uridine 5'-monophosphate, cytidine, and guanine. Moreover, the compounds significantly associated with acidity include five organic acids: succinic acid, methylmalonic acid, 5-aminovaleric acid, jasmonic acid, and phenylpyruvic acid, as well as three saccharides: inositol, D-mannitol, and D-sorbitol. Interestingly, sweetness was significantly positively correlated with only three saccharides, namely D-mannose, D-glucose, and D-erythrose-4-phosphate, whereas cleanliness was significantly negatively correlated with only one phenolic acid, sinapic acid.
Some characteristic metabolites are associated with multiple sensory indicators. For example, the nucleotide derivatives adenosine 5'-monophosphate and 2'-deoxyguanosine both exhibit significant positive correlations with flavor, aftertaste, body, and balance. Additionally, a total of 35 characteristic metabolites were significantly associated with either two or three sensory indicators simultaneously. Among these, we identified several characteristic flavor or bioactive compounds. L-lactic acid showed significant positive correlations with aftertaste, acidity, and balance. γ-Aminobutyric acid and caffeic acid exhibited substantial positive correlations with acidity and balance. Esculetin demonstrated significant positive correlations with body and balance.
-
Coffee processing methods can significantly impact the sensory quality and, hence, the user preference. In small-scale production, traditional coffee processing methods employ several methods, including wet processing and dry processing. In these methods, the fermentation step could be considered an independent step—after coffee fruit treatment and before drying. In wet processing, fermentation typically occurs while soaking the dehusked mucilaginous beans in water, a process designed to accelerate mucilage removal[18]. Dry processing involves exposing seeds directly to sunlight or air dryers for natural fermentation[19]. Most recently, modifications in these methods are being continually tested and developed to meet the demand of unique sensory profiles[7]. For instance, by refining the fermentation process within these traditional coffee processing methods, new techniques such as carbonic maceration[20], digestion[21], and anaerobic processing[22] have been employed to optimize sensory characteristics and meet consumer demands. These emerging methods can alter the composition of metabolites, which play a key role in the diversification of sensory characteristics[23]. Research on emerging processing methods predominantly employs roasted beans or brewed coffee to compare their metabolic profiles and flavor qualities[24]. For example, dry processing, wet processing, and honey processing can result in significant differences in metabolic profiles and flavor characteristics[25]. In Yunnan province of China, 'Catimor' (Coffea arabica) is the leading variety owing to its resistance to pests and diseases and suitability to local environmental conditions[26]. However, limited information is available about the impact of these processing methods on metabolite composition. Here, we explore the comparative analysis of metabolic profiles and flavor differences between the two primary processing methods—wet processing and dry processing—under conventional and anaerobic conditions. The aim is to clarify the impact of flavor precursor compounds in green coffee beans on sensory indicators under different processing methods.
Earlier studies on the comparative biochemical profiles have shown large-scale differences in physical and organoleptic quality parameters[10], amino acid profiles[27], fructose and glucose levels[28], and bioactive amino levels[29] between wet and dry processing methods. In general, wet processing offers lower levels of several metabolites, such as amino acids, sugars (glucose and fructose)[28], asparagine[29], and other organoleptic quality parameters[10]. The comparative metabolomic profiles of DP and WP, in our study, further revealed that metabolites belonging to a wide range of compound classes, like alkaloids, amino acids and derivatives, organic acids, saccharides, and nucleotides and derivatives, are present in higher levels in DP (Fig. 2; Supplementary Table S1). Compared to wet processing, dry processing allows further metabolism, thus providing higher sugar levels. It is important to understand that earlier studies ruled out the possibility of sugars being leached out in WP, and indicated metabolic changes as the main process[30]. However, a study reported the presence of several bioactive compounds such as caffeine and total phenols[31]. Thus, this possibility of dissolution of some metabolic groups in water during WP cannot be completely ruled out when compared to no use of water (DP). Similarly, the levels of other metabolites, such as amino acids, fatty acids, and organic acids, depend on how the beans are processed[32]. Generally, DP has been proven to be more beneficial, yielding higher levels of bioactive substances than WP and carbonic maceration. However, this cannot be generalized to all metabolic compound classes because different substances are influenced differently by water or sun drying differently[33]. Nevertheless, dry processing of 'Catimor' coffee should be preferred over WP under the conditions described in our study.
Among the new processing methods, anaerobic fermentation allows coffee to be processed under oxygen-deficient conditions. Recent research has shown its advantages, such as improved sensory profiles, creation of aromas such as wine, wood, and herbaceous[14,34]. These changes have been attributed to three mechanisms: changes in organism diversity[35], microbial metabolism and digestive performance[36], and coffee bean metabolism[37]. Our results are relevant to these mechanisms. Particularly, since our objective included understanding the effect of coffee processing under anaerobic conditions. Our results clearly show that these processing methods offer greater metabolite diversity. Both AFWP and AFDP exhibited a significantly higher number of DMs and their respective levels compared to DP and WP, respectively, clearly showing that these processing methods offer a greater metabolite diversity. Anaerobic fermentation produces relatively better bioactive metabolite profiles than WP due to the Millard reaction and its sensory quality[7,38]. This was also true for both DP and WP in our experiment, where both AFWP and AFDP induced significant metabolomic changes in both composition and metabolite levels (Fig. 3b). The major metabolites in coffee beans, when processed by different methods, have been shown to be amino acids and derivatives, phenolic acids, lipids and organic acids, terpenoids, alkaloids, lignans and coumarins, nucleotides and derivatives, flavonoids, and quinones[39]. Our results are consistent with these findings, specifically on the composition of the metabolome and key changes. For example, those processed by traditional drying offered the lowest loss in metabolite abundance. Similarly, this study also reported results similar to our findings that anaerobic fermentation combined with sun drying resulted in more amino acids and derivatives than other treatments. This has been suggested to be due to anaerobic fermentation. From a metabolome composition perspective, anaerobic fermentation methods (AFWP and AFDP) proved to offer relatively better profiles than WP and DP, respectively. Thus, our results imply that, under the studied conditions, the AFDP method should be preferred for processing the 'Catimor' variety of Coffea arabica in Yunnan, China. However, future studies should also consider the volatile part of the metabolome, aroma, and flavor to make a more informed decision among the tested processing methods.
At the pathway level, large-scale changes in amino acids and derivatives have been observed[39]. Both the amino acids and carbohydrates are known sources of energy and growth for anaerobes[40]. In particular, the reduction of L-glutamic acid in both AFWP and AFDP, compared to WP and DP, respectively, is consistent with the fact that glutamate is fermented by anaerobes. In addition to amino acid biosynthesis, major differential changes were noted in glycolysis/gluconeogenesis, pentose phosphate pathways, proponoate pathways, and citrate cycles (Fig. 4; Supplementary Table S4). Particularly, the increased lactic acid content in AFDP compared to DP indicates that its production is intensified under anaerobic conditions, which contributes to the reduced growth of pathogenic microbes, and at the same time, increased growth of the yeast[41]. Furthermore, higher levels of lactic acid have been associated with assisting in the acidification of coffee pulp without affecting the quality[42]. Our results show that D-gluconate content decreased and lactic acid increased under anaerobic conditions (DP vs AFDP), suggesting the possibility of the presence of lactic acid bacteria, which needs to be tested in future studies. Anaerobic fermentation also affects the content and composition of metabolites other than amino acids, such as flavonoids and terpenoids[43]. Otherwise, flavonoids (cinnamic acid, caffeic acid, ferulic acid, syringin, dihydrochrysin, naringenin, epicatechin, hesperetin-7-O-glucoside), and terpenoids (4-hydroxybenzoic acid, cinnamic acid, and p-coumaric) increases under anaerobic conditions are consistent with the known trends in other plants and in coffee.
For beverages such as coffee, the cup test is perhaps the ultimate test for determining its sensory quality, even though sensory analysis does have its own limitations and subjectivity[44]. In our study, anaerobically fermented coffee demonstrated overall superiority over conventionally processed coffee in terms of dry/wet aroma, flavor, aftertaste, acidity, body, and balance, consistent with the metabolic profiles of the samples. To investigate key flavor precursors in green coffee beans associated with sensory attributes, we identified numerous important metabolites through correlation analysis. For example, we identified 8 amino acids and derivatives, as well as 8 nucleotides and derivatives, significantly associated with body. Research indicates that most of these amino acids are volatile and are strong olfactory compounds after roasting. Among them, L-methionine produces maltiness and fruitiness, while L-leucine and L-isoleucine significantly reduce the bitter compounds in coffee, which strongly influence the flavor of coffee beverages[45,46]. Research on nucleotides and derivatives in coffee has been relatively scarce. In other species, nucleotides typically function as flavor compounds that contribute to umami taste[47]. Our findings propose that nucleotides such as cytosine, and guanine in green coffee beans may influence the final flavor profile through the roasting process. Furthermore, the study identified γ-aminobutyric acid and caffeic acid as significantly positively correlated with acidity and balance. Not only that, γ-aminobutyric acid is a bioactive compound naturally occurring in plants with multiple physiological functions, offering various health benefits to the human body, particularly as the primary inhibitory neurotransmitter in the central nervous system[48]. Meanwhile, caffeic acid is a crucial phenolic compound found in coffee.
In summary, based on the results obtained under the four processing conditions in our experiment, we recommend the AFDP method. However, further experiments should investigate the types of anaerobes and how they participate differently in the fermentation of coffee beans. Additionally, the duration of fermentation affects the levels of different metabolites. Therefore, anaerobic fermentation of 'Catimor' coffee under different fermentation periods would further provide a basis for selecting optimal conditions for optimal nutrition and flavor.
-
We compared the processing strategies of wet and dry processing under conventional and anaerobic conditions for the 'Catimor' variety of Arabica coffee. The results revealed significant differences in the composition and abundance of metabolites among the different processing methods. The dominant compound classes were amino acids and derivatives, followed by lipids, phenolic acids, and organic acids. Overall, anaerobic fermentation significantly increased the metabolic abundance of green coffee beans (particularly in AFDP), primarily focusing on pathways related to amino acid metabolism and nucleotide metabolism. Similarly, sensory analysis of brewed coffee conducted by the Q-grade certification panel indicates that anaerobic fermentation outperforms conventionally processed coffee in dry/wet aroma, flavor, aftertaste, acidity, body, and balance. Wet-processed coffee exhibits higher cleanliness and lower sweetness compared to dry-processed coffee. In addition, a total of 125 characteristic DMs identified through significant pathway screening were classified into four clusters, each exhibiting distinct metabolic profiles. Following correlation analysis, 75 metabolites were identified as significantly correlated with sensory indicators, serving as important flavor precursors in green coffee beans. In conclusion, drying combined with anaerobic fermentation conditions is the most suitable processing method for the 'Catimor' variety. Future research should focus on identifying the types of anaerobes and their roles in coffee bean fermentation. Furthermore, identifying the most suitable anaerobes and determining the optimal fermentation duration would provide a basis for selecting the best conditions for optimal nutrition and flavor.
-
The authors confirm their contributions to the paper as follows: study conception and design: Fu X, Hu F; data collection: Fu X, Hu F; resources: Bi X, Li G, Qu B; analysis and interpretation of results: Dong W, Li Z, Li Y; draft manuscript preparation: Fu X, Yu H. All authors reviewed the results and approved the final version of the manuscript.
-
The datasets generated during and analyzed during the current study are not publicly available due to management requests but are available from the corresponding author on reasonable request.
-
This work was supported by the Yunnan Key Laboratory of Coffee (202449CE340029), the Research and Development and Demonstration projects in Key Technologies of High-Efficiency Cultivation of Specialty Coffee (202304BP090027), and the China Central Public-Interest Scientific Institution Basal Research Fund (1630012025119).
-
The authors declare that they have no conflict of interest.
-
accompanies this paper online at: https://doi.org/10.48130/XXXXXX.
- Supplementary Table S1 Classification of differential metabolites with different processing methods.
- Supplementary Table S2 List of the top 10 compounds with the highest fold change in each comparison group.
- Supplementary Table S3 List of metabolites with basic information showing significant differences across all four processing methods.
- Supplementary Table S4 KEGG pathways to which the differentially accumulated compounds are significantly enriched.
- Supplementary Fig. S1 MRM metabolite detection multi-peak diagram.
- Supplementary Fig. S2 OPLS-DA permutation test of different processing methods of green coffee beans.
- Copyright: © 2026 by the author(s). Published by Maximum Academic Press, Fayetteville, GA. This article is an open access article distributed under Creative Commons Attribution License (CC BY 4.0), visit https://creativecommons.org/licenses/by/4.0/.
-
About this article
Cite this article
Fu X, Yu H, Dong W, Bi X, Li Z, et al. 2026. Metabolome analysis of processing methods regulating flavor precursors in Arabica coffee beans and correlation with sensory attributes. Beverage Plant Research 6: e029 doi: 10.48130/bpr-0026-0010 

Metabolome analysis of processing methods regulating flavor precursors in Arabica coffee beans and correlation with sensory attributes
- Received: 27 October 2025
- Revised: 12 January 2026
- Accepted: 19 March 2026
- Published online: 07 July 2026
Abstract: To investigate the effects of different processing methods (WP, wet processing; DP, dry processing; AFWP, anaerobic fermentation wet processing; AFDP, anaerobic fermentation dry processing) on flavor precursors in green coffee beans and clarify the correlation with sensory flavor, this study employed a systematic analysis combining UPLC-ESI-MS/MS-based widely targeted metabolomics with sensory evaluation of brewed coffee. Multivariate statistical analysis indicates significant differences in the metabolic profiles of non-volatile compounds among different processing methods. Results showed that 843 differential metabolites, including amino acid derivatives, lipids, phenolic acids, and organic acids, were screened among 1,682 non-volatile compounds. Anaerobic fermentation has been shown to significantly increase the relative abundance of metabolites, particularly in AFDP, where they are primarily concentrated in pathways related to amino acid and nucleotide metabolism. KEGG analysis was employed to identify 125 characteristic metabolites across 45 differentially expressed pathways, which were then grouped into four clusters. Sensory analysis of brewed coffee revealed that anaerobically fermented coffee outperformed conventionally processed coffee in dry/wet aroma, flavor, aftertaste, acidity, body, and balance. Wet-processed coffee exhibited higher cleanliness and lower sweetness compared to dry-processed coffee. Through correlation analysis, 75 metabolites, including D-mannose, D-glucose, D-erythrose-4-phosphate, sinapic acid, L-lactic acid, γ-aminobutyric acid, caffeic acid, and esculetin, were identified as significantly correlated with sensory indicators and can be regarded as important flavor precursors in green coffee beans. The present results provide a valuable theoretical basis for understanding the flavor precursors and flavor characteristics of Arabica coffee processed using different processing methods.