


-
Microplastic pollution (MP) is a global concern for nutrient cycling in agroecosystems[1−4]. Thus, nutrient cycling has garnered significant research attention as it provides insights into ecological stability and ecosystem functioning[2,5]. In this context, studying the effects of MPs on carbon (C) and nitrogen (N) cycling is particularly crucial, given their negative impacts on crop production and environmental health. By definition, MPs are plastic particles < 5 mm that may originate as primary micro-sized particles or result from the degradation of large plastic materials[6]. Among different environments, soils are the largest sink of MPs. Some agricultural soils have become permanent hotspots of MPs, receiving annually 50 × 104 t MPs[7]. According to an estimate, plastic production will rise and subsequently may accumulate 50 million metric tons of plastic waste in our environment. After degradation, this plastic waste will contribute to MPs pollution. Given the considerable pressure of MP pollution in agroecosystems, it is important to mechanistically understand C and N cycling[2].
MPs affect C and N cycling through a range of biochemical pathways. These pathways include alteration in microbial enzymes as well as changes in microbial diversity, abundance, and activities[8−11]. The presence of MPs can also indirectly alter C and N cycling by inducing soil physical and chemical changes, including bulk density, aggregation, pH, and organic matter[12−14]. However, these effects of MPs are highly variable and depend on a wide range of factors[2,15,16]. To date, a myriad of studies have been limited to single factors and greenhouse studies. As a result, our mechanistic understanding of the underlying factors driving carbon (C) and nitrogen (N) cycling remains limited[15]. The involvement of a wide range of interacting factors makes the development of such a mechanistic understanding a significant challenge.
Given the diverse properties of MPs and their long residence time, research results, particularly regarding C and N cycling, are often inconsistent. In this context, machine learning (ML) models may offer a promising approach to addressing the complexity of MP contamination and accurately predicting carbon (C) and nitrogen (N) cycling[1]. Most importantly, ML models can effectively predict complex relationships between independent and dependent variables[17]. Recently, Withana et al.[1] used ML models to demonstrate that soil physicochemical properties are distinctly affected by MPs properties. However, there is still a paucity of MPs studies employing ML models[1]. Thus, we aimed to extract data from previous research and predict C and N cycling using a gradient boost regression (GBR) model. We hypothesized that the GBR model is an effective tool for predicting C and N cycling under varying properties of MPs. Our specific objectives were:
(1) To estimate the impact of key properties of MPs on different forms of soil C and N contents,
(2) To evaluate CO2 and N2O emissions from MPs-polluted soils, and
(3) To investigate how MPs pollution influences crop biomass.
The results of this study make an important contribution to the understanding of the interactions between the properties of MPs and C and N cycling in agroecosystems. This knowledge will help inform decisions aimed at mitigating the impacts of MP pollution in these systems.
-
A literature search on the impact of MPs on soil C and N cycling was conducted using Google Scholar, PubMed, and Web of Science. The literature search identified a total of 450 peer-reviewed papers, published between 2017 and 2025. From the identified papers, 55 studies were selected that specifically assessed the effects of MPs on soil C and N content, CO2 and N2O emissions, and plant biomass. Numerical data from the tables and figures in the selected papers were extracted. To extract data from the figures in the selected papers, we employed Web Plot Digitizer Software version 2.26. Additionally, information on experimental conditions such as soil type, experiment duration, MPs size, MPs shape, MPs type, and MPs dose was also extracted. The data were further screened to avoid duplication.
Study design
-
We designed a predictive study using data extracted from previous publications to investigate the effects of MPs pollution on C and N cycling. The availability of substantial data on various properties of MPs and related factors facilitated the development of a machine learning model. Detailed information on the input variables is provided in Table 1. Soil chemical properties and greenhouse gas emissions such as dissolved organic carbon (DOC), soil organic carbon (SOC), soil organic matter (SOM), ammonium (NH4+), nitrate (NO3−), carbon dioxide (CO2) and nitrous oxide (N2O), as well as crop biomass were rigorously analyzed, and used as key candidates for training and testing the GBR model. All parameters were compiled separately and used to develop individual prediction models for the same type of input variables[1]. As all parameters exhibited unbalanced distributions, we performed a log transformation to reduce the data gap[1,18]. This step improved the normality of the data, as well as model convergence and performance.
Table 1. Details of variables used for model development.
MPs properties MPs type PE, HDPE, PS, PLA, LDPE, PU, PVC, PA, PBS, PHB, PTFE, PP, PET, PAN, PBAT, PHE MPs size (µm) 1, 3, 5, 6, 13, 18, 25, 30, 35, 55, 57, 60, 66, 67, 100, 103, 125, 150, 180, 188, 190, 250, 500, 625, 630, 900, 1,000, 2,000, 4,280 MPs shape Particle, fragment, pellet, round, bead, fiber, powder, granule, vessel MPs dose (%) 0.001, 0.002, 0.01, 0.02, 0.05, 0.1, 0.2, 0.3, 0.25, 0.4, 0.5, 1, 1.5, 2, 2.5, 3, 5, 7, 10, 10.5, 13, 28 Soil related Soil type Clay loam, clay, sandy loam, loamy, sandy, sandy clay loam, silt loam, silty, loam, clay loam, silty clay loam Experiment duration Incubation (days) 7, 10, 12, 14, 15, 19, 21, 20, 22, 25, 28, 30, 31, 35, 40, 42, 45, 46, 50, 54, 55, 60, 70, 80, 90, 100, 105, 110, 120, 144, 164, 365 PE-polyethylene. HDPE-High-density polyethylene. PS-polystyrene. PLA-polylactic acid. LDPE-low-density polyethylene. PU-polyurethane. PVC-polyvinyl chloride. PA-polyamide. PBS-polybutylene succinate. PES-Polyester. PET-polyethylene terephthalate. PP- polypropylene. PHB-Polyhydroxybutyrate. PTFE-Polytetrafluoroethylene. PAN- Polyacrylonitrile. PBAT- Polybutylene adipate terephthalate. Model training and testing
-
We used the Gradient Boosting Regression (GBR) tree-based algorithm to develop the model using a boosting strategy. The GBR model was trained and tested using the retrieved data on C and N cycling[1]. The dataset was randomly partitioned into training and testing sets in an 80:20 ratio[1,19]. The training set (80%) was used for hyperparameter tuning and model training, while the testing set (20%) was used to evaluate the prediction performance of the trained model.
For hyperparameter tuning, the maximum tree depth, number of trees, learning rate, and subsampling rate were adjusted to optimize the model for the compiled dataset. A five-fold cross-validation method was employed to prevent overfitting due to inappropriate hyperparameters. The optimal hyperparameters were determined based on the average performance across the validation folds. The coefficient of determination (R2) and root mean square error (RMSE) were used to evaluate the prediction accuracy of the trained model[20].
Statistics and data visualization
-
The correlation between observed and predicted data was assessed. All data visualizations were performed using RStudio (v4.2.2) and R (v4.5.1). The 'ggplot2' package was used to generate scatter plots with a 1:1 reference line to determine the deviation of observed and predicted values[21]. The 'annotate' function was employed to display R2 and MSE values on each plot. Additionally, the 'radarchart' package was used to visualize the contribution of MP characteristics to changes in soil nutrient dynamics and plant biomass (R Development Core Team, 2008).
-
The GBR model demonstrated high accuracy in predicting various forms of soil carbon following MP pollution (Fig. 1). There was good agreement between the observed and predicted values of DOC (Fig. 1a). A small gap between training and testing performance for DOC suggests robust and reliable predictions. These results are consistent with the findings of Withana et al.[1], who observed a small difference in R2 between the trained and tested datasets for DOC. In contrast, a larger gap in R2 values between training and testing for SOC and SOM indicates potential overfitting (Fig. 1b, c). These results indicate that the model was unable to fully capture dataset-specific patterns in SOC and SOM. This limitation likely reflects heterogeneity introduced by the use of diverse soil carbon measurement methods within the dataset. As a result, the model's ability to generalize to unseen SOC and SOM data collected through heterogeneous measurement approaches could be limited. Future studies could mitigate these limitations by increasing sample size and explicitly accounting for variability associated with soil carbon measurement techniques. While a relatively large difference in R2 values was observed, the low mean squared error (MSE) values and the close alignment of predicted and observed values along the 1:1 line suggest that overall prediction accuracy remained reasonable.
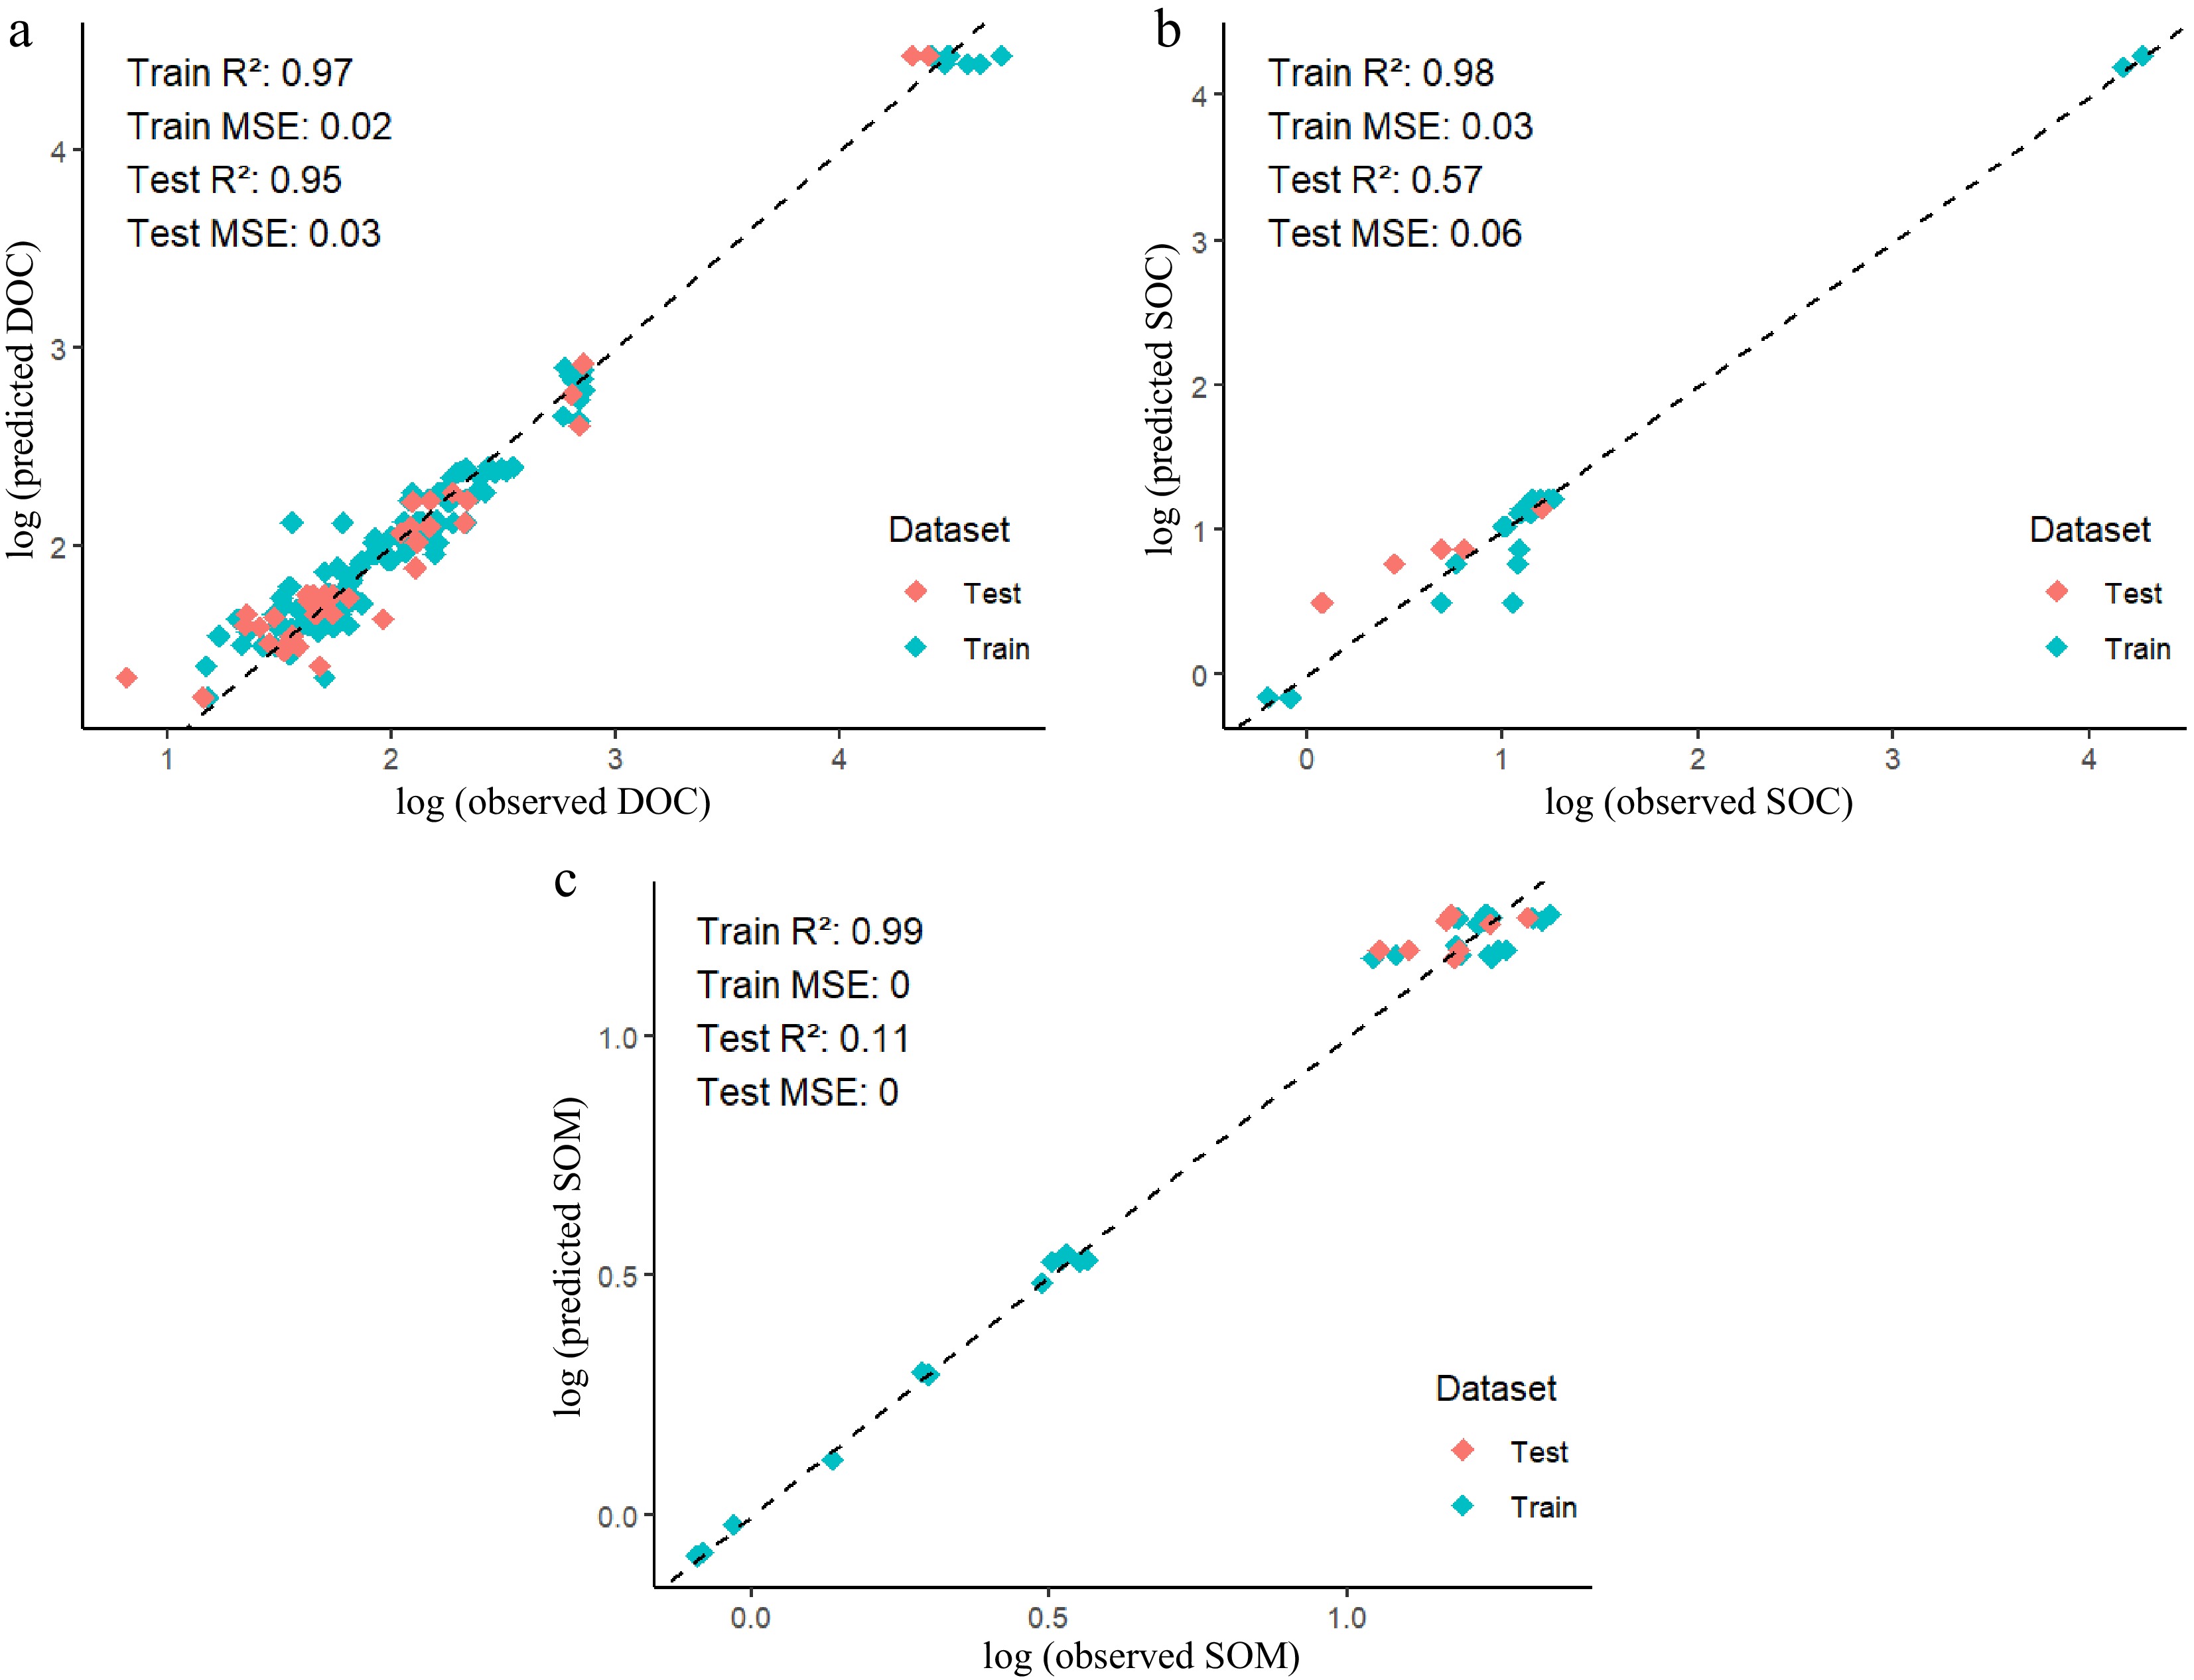
Figure 1.
Observed vs predicted content of (a) dissolved organic carbon (DOC), (b) soil organic carbon (SOC), and (c) soil organic matter (SOM) in microplastic polluted soils.
The prediction of NH4+ and NO3− content in MP-polluted soils was highly accurate (Fig. 2a, b). The difference between training and testing R2 values was only 3% for NH4+ and 2% for NO3−. Moreover, the low MSE values and the close alignment of predicted and actual values along the 1:1 line for both training and testing datasets indicate strong model performance. Similarly, a previous study found that the GBR model can accurately predict plant available nutrients[22].
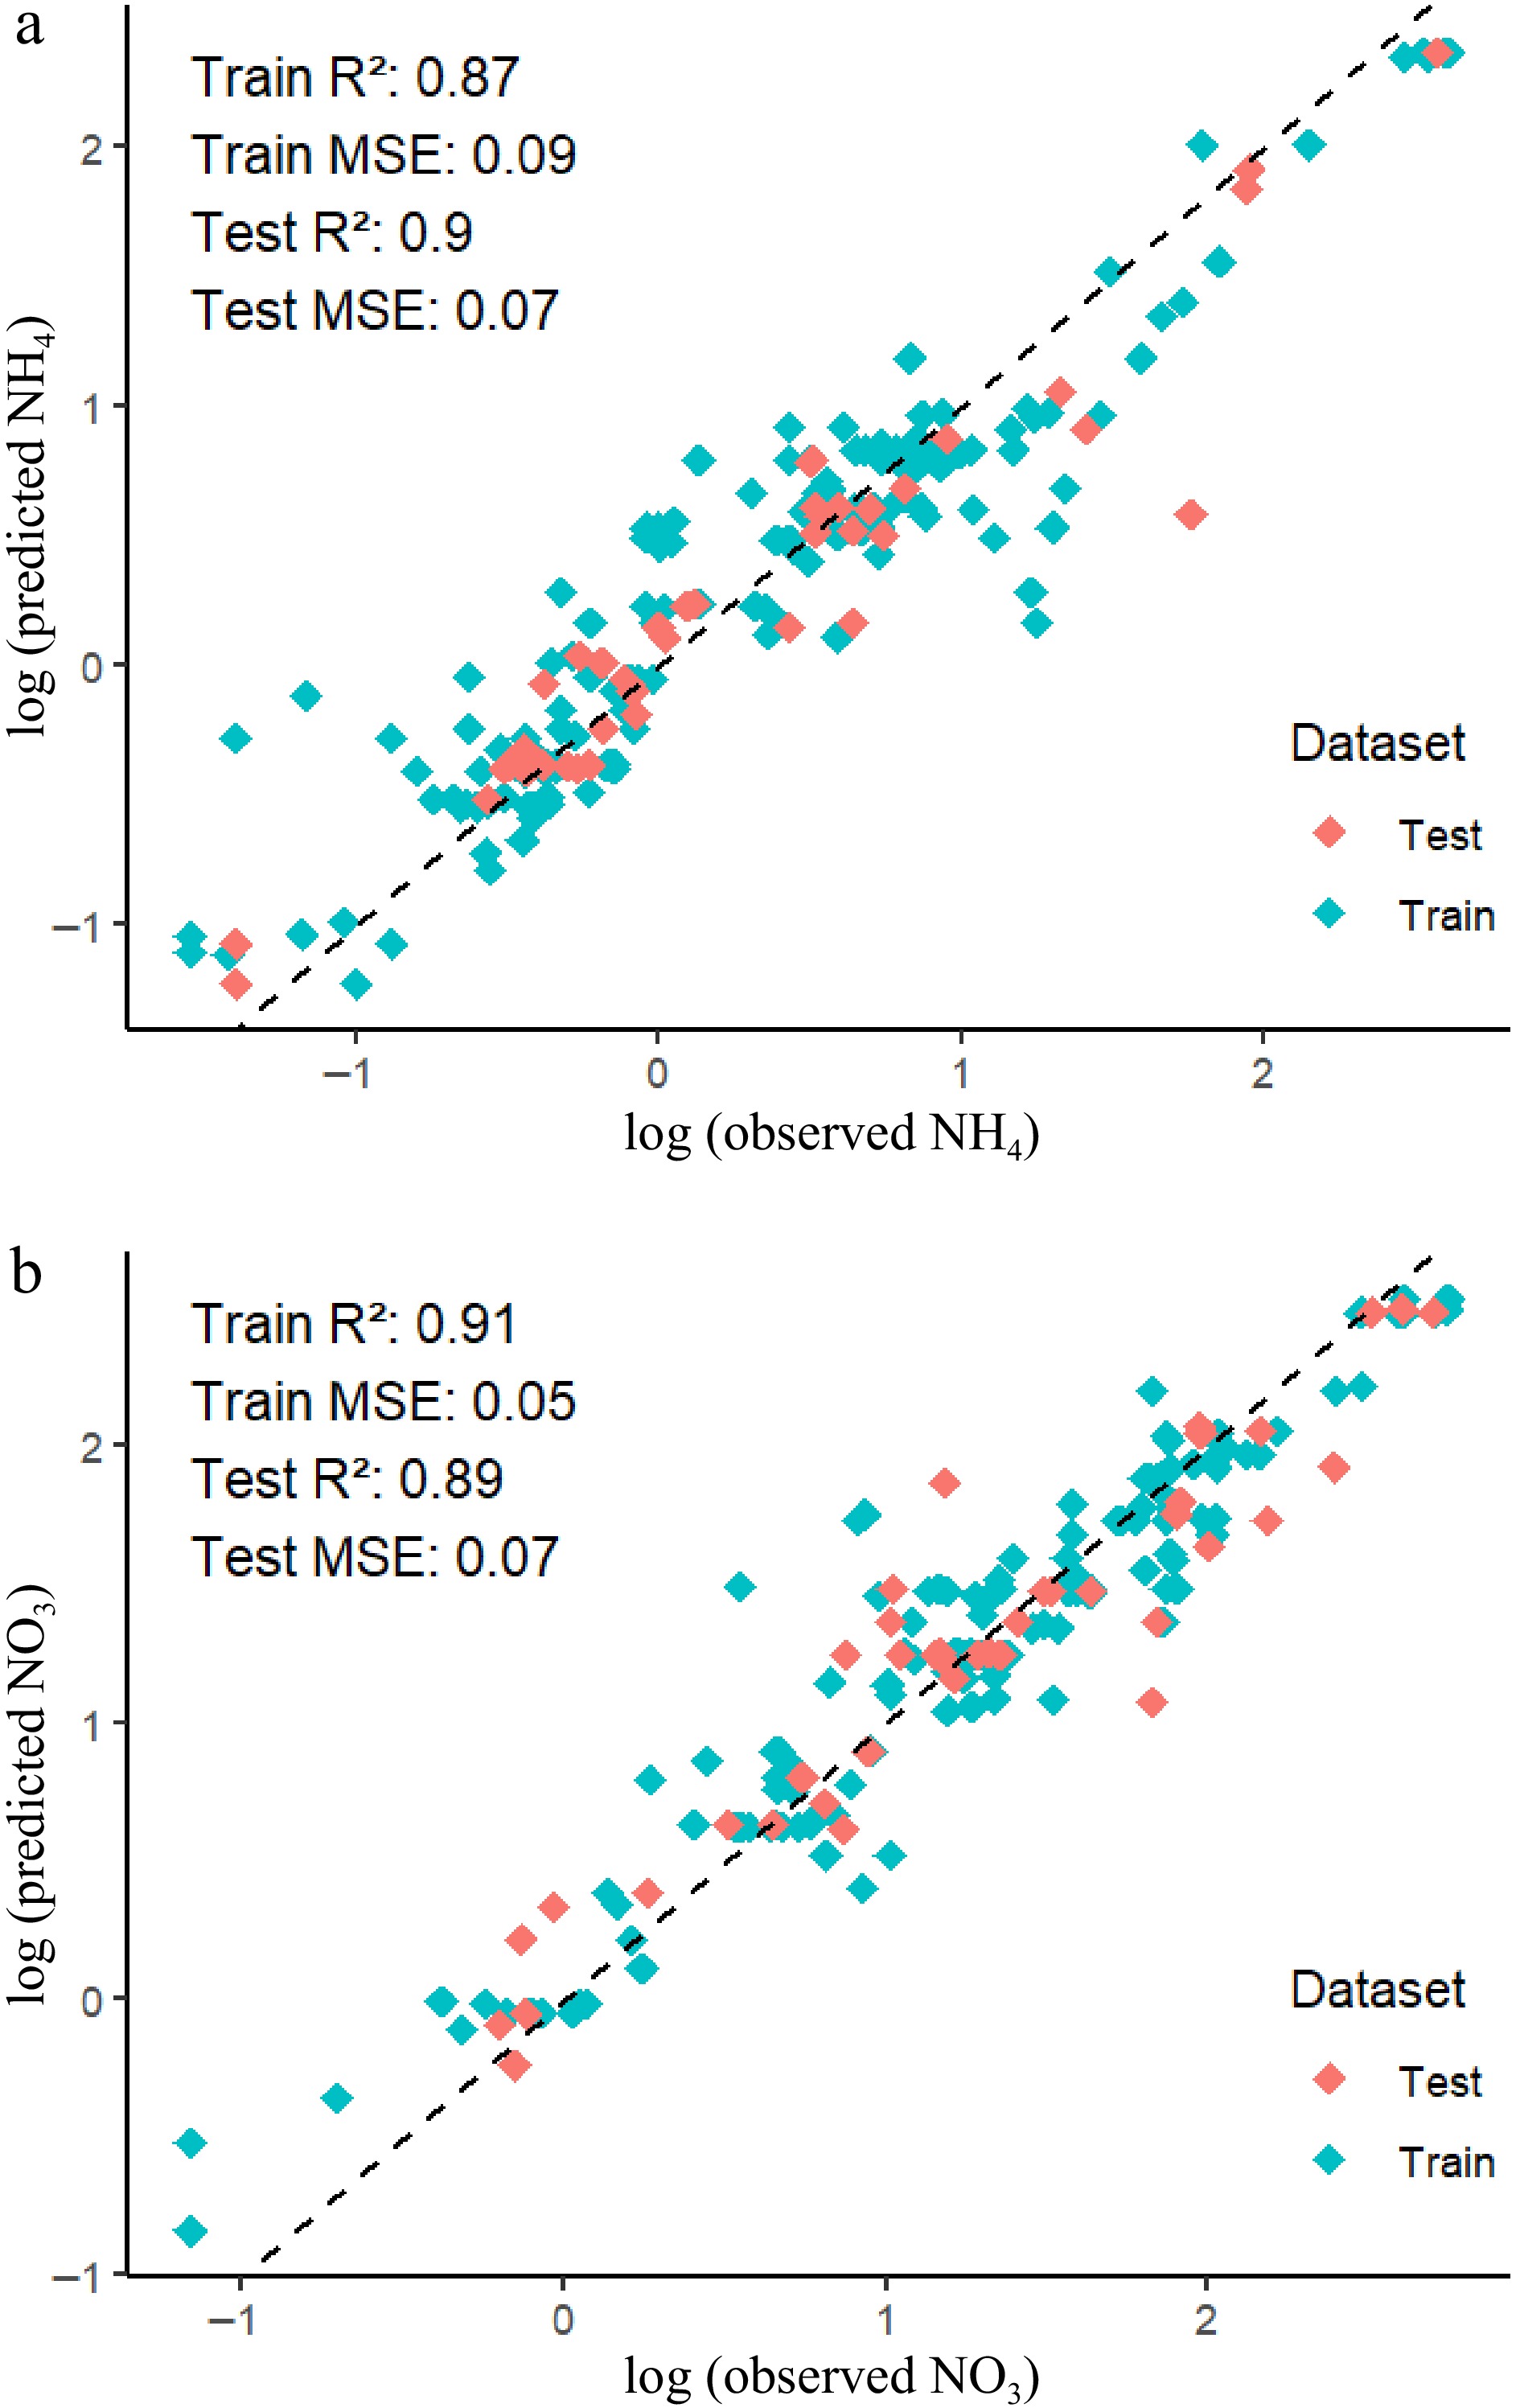
Figure 2.
Observed vs predicted content of (a) ammonium (NH4), and (b) nitrate (NO3) in microplastic polluted soils.
For CO2 and N2O emissions, the GBR model also demonstrated high accuracy (Fig. 3a, b). Both the training and testing datasets closely followed the 1:1 line, with only a 4% difference in R2 values. The low MSE values further indicate the strong performance of the GBR model in predicting CO2 and N2O emissions under MPs pollution.
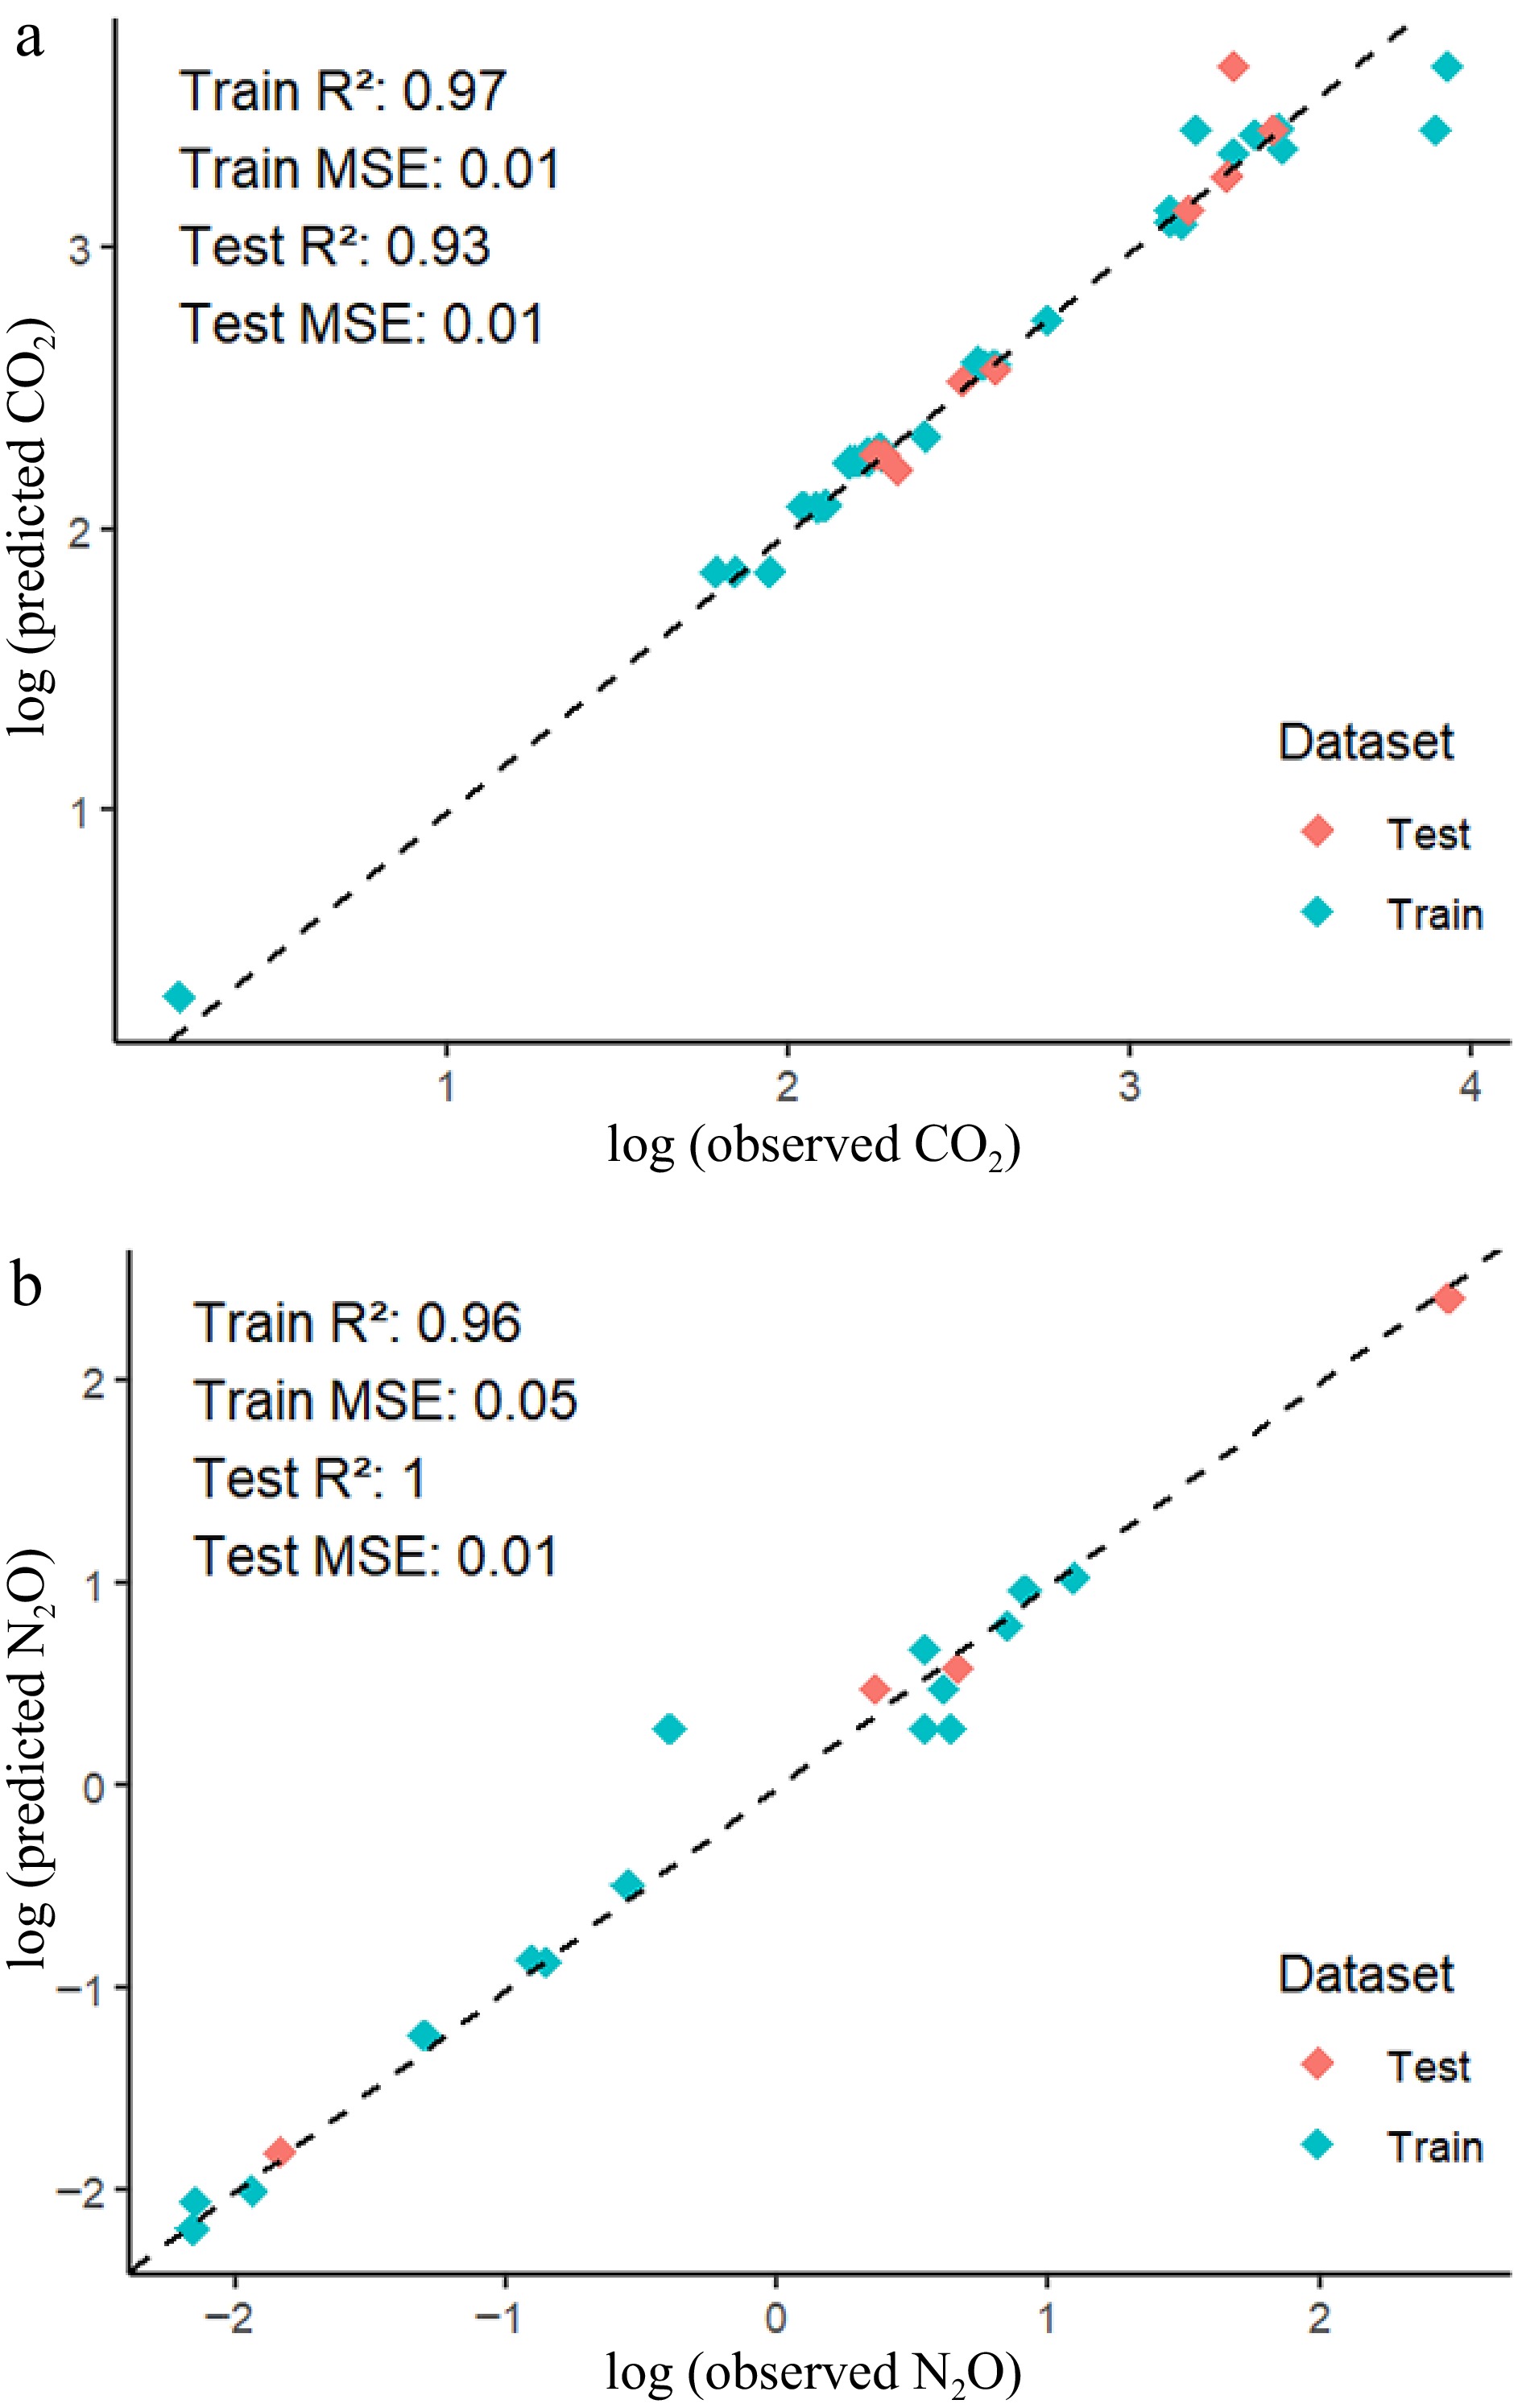
Figure 3.
Observed vs predicted content of (a) carbon dioxide (CO2), and (b) nitrous oxide (N2O ) in microplastic polluted soils.
The model achieved high R2 values for both the training and testing datasets on plant biomass (Fig. 4). There was a close alignment between the predicted and observed data along the 1:1 line, with low MSE values, indicating the high performance of the GBR model in predicting plant biomass. These results confirm that the GBR model is an effective tool for predicting, even with small datasets[23].
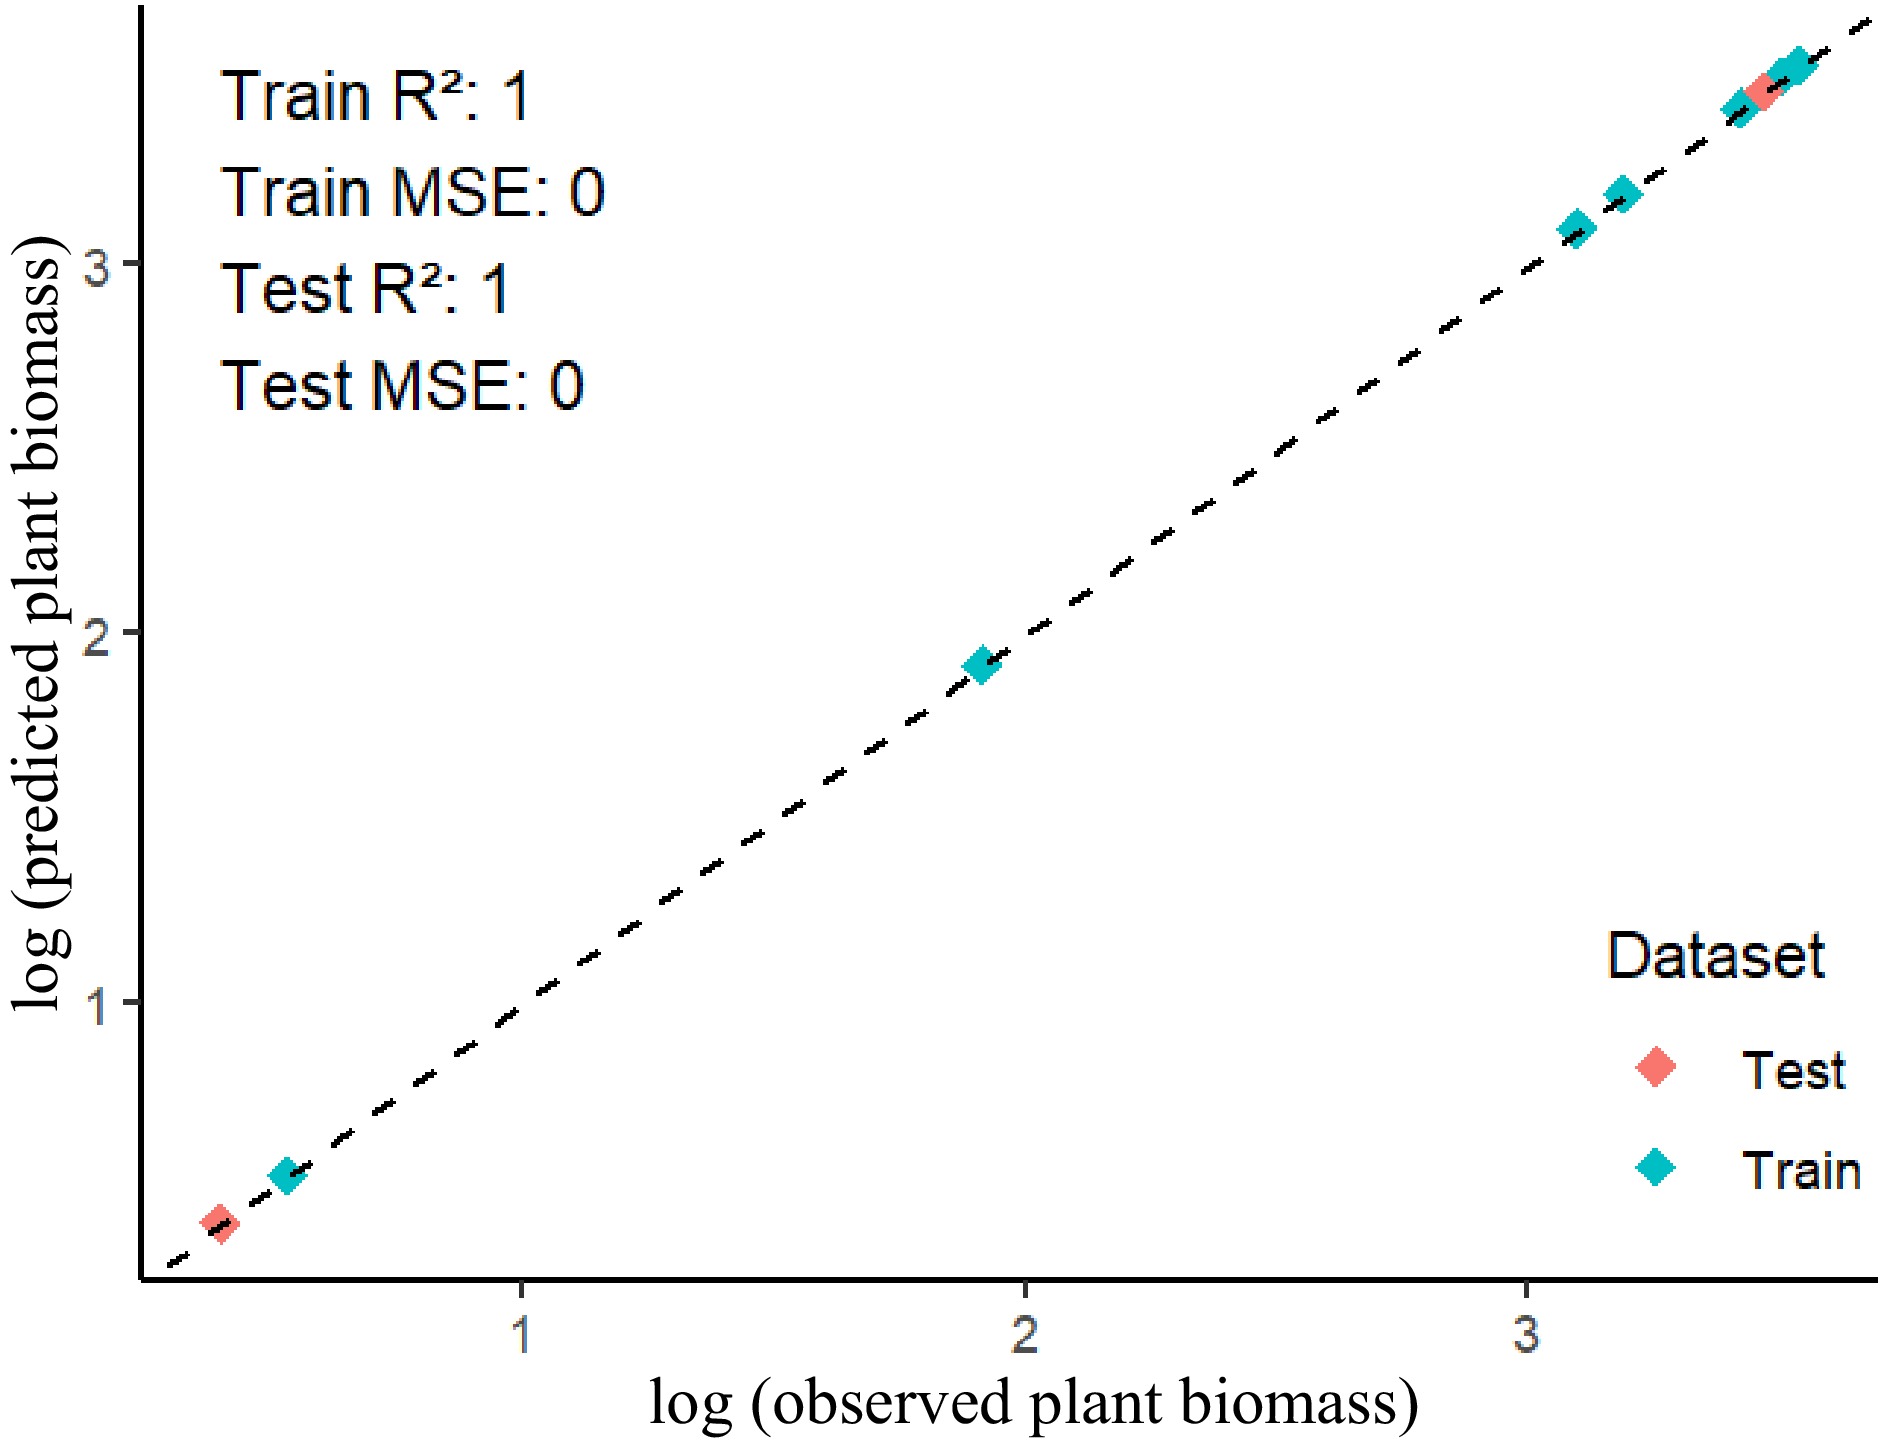
Figure 4.
Observed vs predicted effects of soil microplastic pollution on plant biomass.
Contribution of MPs properties, incubation time, and soil type
-
The spider chart illustrates that soil carbon content varies across experimental conditions (Fig. 5a). MP size accounted for the largest change in soil DOC content (38%), while soil type, incubation time, and MP dose contributed uniformly low changes. Given that the small size of MPs provides a large surface-to-volume ratio, their impact on DOC may result from the physical and chemical changes they induce in the soil[9]. Our results are consistent with the findings of Guo et al.[24] who found that MP increases DOC contents depending on its size.
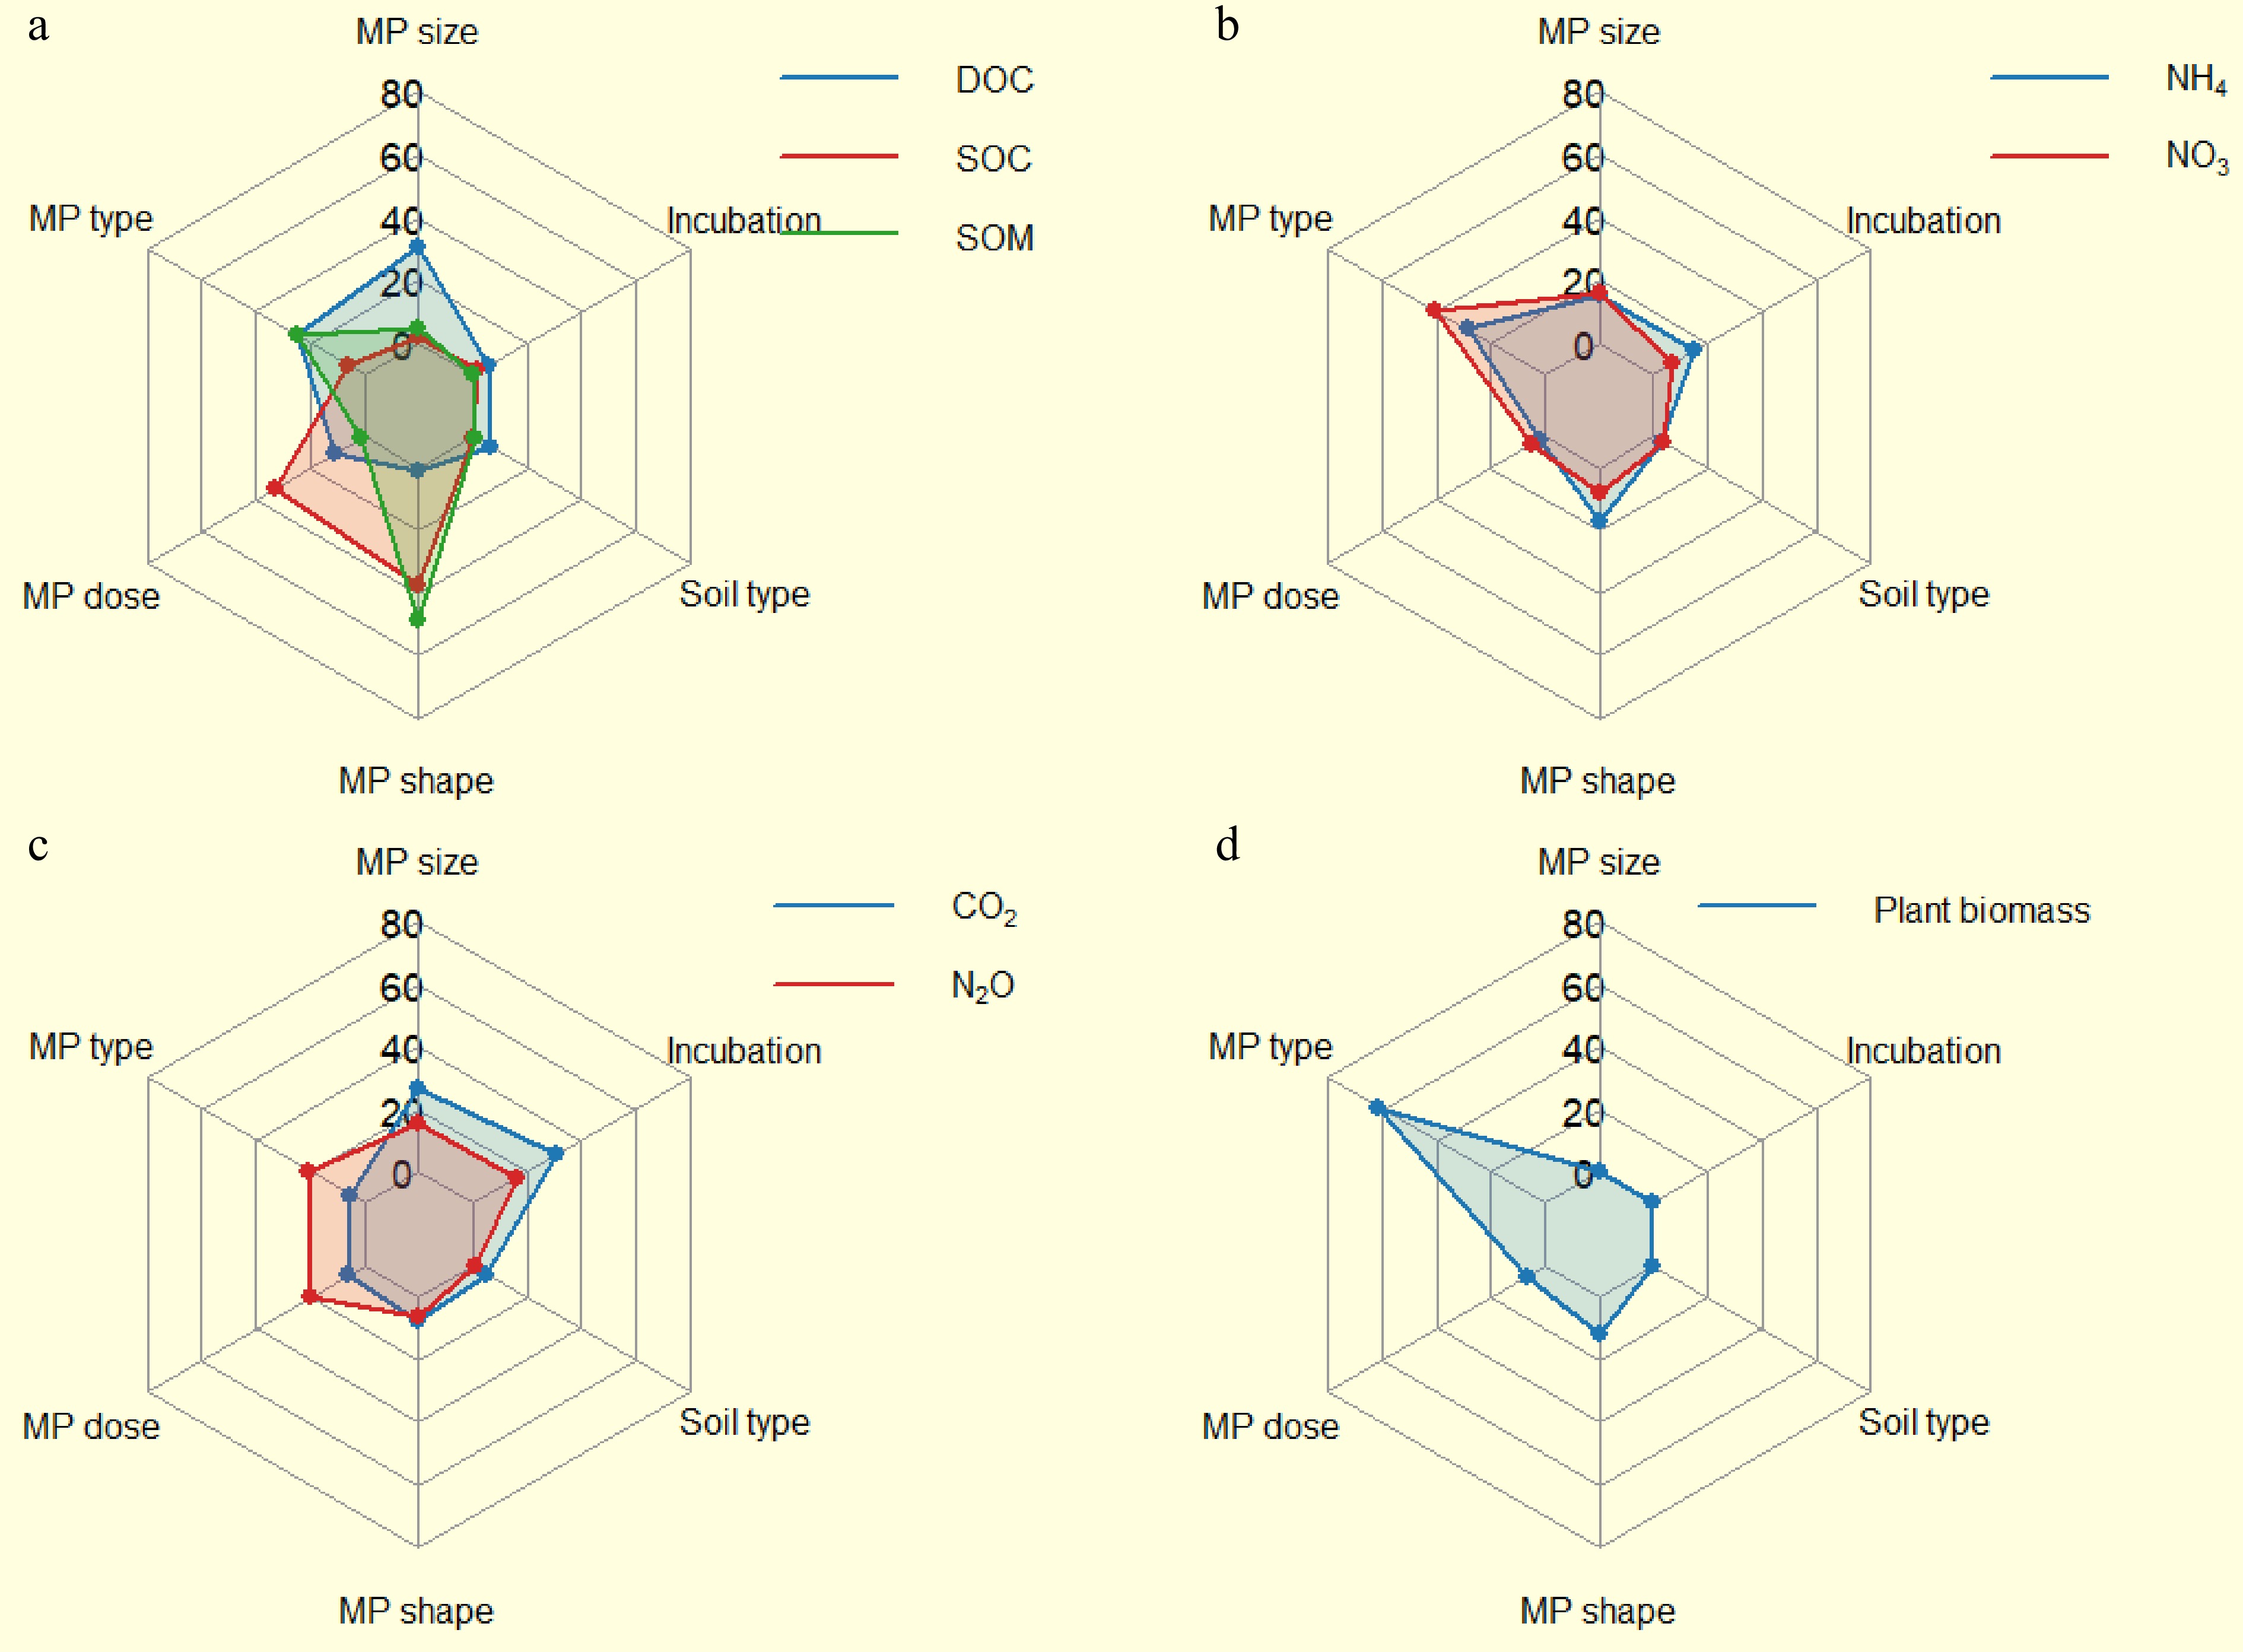
Figure 5.
Contribution of (a) microplastic (MP) properties (type, shape, and size), MP dose, and incubation period, and soil type to soil carbon (SOC, DOC and SOM), (b) nitrogen (NH4 and NO3), (c) greenhouse gas (CO2 and N2O) emissions, and (d) plant biomass. DOC-dissolved organic carbon. SOC-soil organic carbon. SOM-soil organic matter. NH4-ammonium. NO3- nitrate. CO2-carbon dioxide. N2O-nitrous oxide.
Furthermore, we found that MP shape had the greatest impact on SOC content (39%), followed by MP dose (Fig. 5a). In contrast, MP type, MP size, and incubation time contributed minimally to changes in SOC. These findings could be explained by the disintegration of soil aggregates, impacting the stored SOC in soil aggregates[25,26]. Typically, the presence of MPs can also affect SOM content, with the magnitude of these effects largely determined by the properties of the MPs[27,28]. Thus, our analysis indicates that the properties of MPs contributed distinctly to changes in SOM content (Fig. 5a). However, the most substantial change in SOM content (60%) was attributed to MP shape, suggesting that the diverse shapes of MPs can significantly influence SOM content. The strong influence of microplastic (MP) shape on both SOC and SOM suggests that these variables remain closely related, which is expected given that SOM is commonly estimated from SOC using an empirical conversion factor.
Across experimental conditions, soil NH4+ and NO3− contents were substantially altered by MP contamination (Fig. 5b). The greatest changes in soil NH4+ (36%) and NO3− (51%) were caused by MP type, while MP dose and soil type resulted in the smallest changes in soil NH4+. This corroborates the findings of Greenfield et al.[29] and Li et al.[30] who found that MP type could substantially affect soil NH4+ and NO3− content. Considering the diverse types of MPs in soil, we could assume that the reduction of soil N fertility and crop yields is becoming inevitable.
The accumulation of MPs in soil could contribute to climate change by increasing the emissions of greenhouse gases[31]. Thus, we observed that greenhouse gas emissions were significantly influenced by MPs' properties and incubation period (Fig. 5c). However, MP size and incubation period led to the highest CO2 emissions (34%–39%), while other factors contributed relatively little to CO2 release. These results are consistent with the findings of Iqbal et al.[2,31] who found that MP size could substantially affect greenhouse gas emissions. In the case of N2O emissions, size, type, dose, and incubation period of MPs had substantial effects, whereas soil type had the least impact, contributing only 1%. We can infer from these results that the impacts of MP on N2O emissions are complex and determined by multiple factors related to pollution. Given the increasing accumulation of MPs in global soils, their impact on climate change is likely to be inevitable.
Plant biomass was significantly affected by MP type, size, shape, and dose (Fig. 5d), while incubation time, and soil type had no significant effect. This likely relates to our observed impacts of MPs on C and N cycling, ultimately reducing nutrient availability and altering crop biomass. The greatest change in plant biomass (77%) was attributed to the type of MPs. Our results are consistent with the findings of Wang et al.[32] who found that MPs type with Cd or without Cd remarkably influence plant biomass.
-
This study demonstrates that the GBR model offers a robust framework for estimating soil C and N cycling under the influence of complex MP properties. However, the robustness of the model for predicting SOC and SOM contents could not be confirmed due to potential model overfitting. Therefore, future studies with larger sample sizes are required to further validate these findings.
The GBR simulations reveal that specific MP characteristics exert distinct effects on soil C and N dynamics. The size of MPs can strongly influence DOC and CO2 emissions, whereas NH4+ and NO3− contents are more strongly affected by microplastic type. Given the increasing prevalence of MPs pollution with diverse properties, their impacts on soil C and N cycling are likely to intensify. Under such scenarios, machine learning models offer valuable tools for evaluating ecosystem-level risks and supporting informed decision-making. Importantly, mitigation strategies should move beyond assessments based solely on total MP abundance and instead incorporate specific MP characteristics to better capture their ecological impacts.
-
The authors confirm contribution to the paper as follows: study conception and design: Iqbal S, Worthy FR; methodology: Worthy FR; formal analysis: Gui H; data curation: Iqbal S, Gui H; visualization: Gui H; draft manuscript preparation: Iqbal S; writing – review & editing: Iqbal S, Worthy FR, Li Y; supervision: Li Y; funding acquisition: Iqbal S, Li Y. All authors reviewed the results and approved the final version of the manuscript.
-
The datasets generated during and/or analyzed in the current study are available from the corresponding author on reasonable request.
-
Authors acknowledge support provided by Zhihui Yunnan Grant (No 202503AM140006) and Yunnan Province Xingdian Talent Support Program.
-
The authors declare that they have no conflict of interest.
- Copyright: © 2026 by the author(s). Published by Maximum Academic Press, Fayetteville, GA. This article is an open access article distributed under Creative Commons Attribution License (CC BY 4.0), visit https://creativecommons.org/licenses/by/4.0/.
-
About this article
Cite this article
Iqbal S, Worthy FR, Gui H, Li Y. 2026. Simulating carbon and nitrogen cycling in microplastic contaminated agroecosystems using gradient boost regression model. Circular Agricultural Systems 6: e005 doi: 10.48130/cas-0026-0007 

Simulating carbon and nitrogen cycling in microplastic contaminated agroecosystems using gradient boost regression model
- Received: 19 August 2025
- Revised: 15 February 2026
- Accepted: 15 February 2026
- Published online: 23 March 2026
Abstract: Microplastics (MPs) pollution poses significant threats to carbon (C) and nitrogen (N) cycling, affecting plant biomass. These threats are often difficult to measure due to the multifaceted effects of MPs. Hence, machine learning models offer a promising approach to effectively estimate nutrient dynamics. Here, we employed a Gradient Boosting Regression (GBR) model to estimate soil C and N contents, greenhouse-gas emissions, and plant biomass in MPs-contaminated soils. We also evaluated the mediation of soil type and incubation duration. To train and test the GBR model, we used data compiled from 55 peer-reviewed publications. The model results showed strong agreement between observed and predicted values for dissolved organic carbon (DOC). Training and testing R2 values differed by 3% for NH4+ and 2% for NO3−. For CO2 and N2O emissions, low mean squared error values indicated strong model performance in predicting emissions under MPs pollution. The model demonstrated strong predictive performance for biomass, achieving high R2 values for both the training and testing datasets. Across properties, MPs size caused the greatest changes in DOC and CO2 emissions. However, the MP shape had the greatest impact on the SOM content (60%). The greatest changes in soil NH4+ (36%) and NO3− (51%) content and plant biomass (77%) were caused by MP type. For N2O emissions, the size, type, dose, and incubation period of MPs had substantial effects. Our results conclude that the GBR model is a powerful tool to estimate the effects of MPs pollution on nutrient cycling and plant biomass.
-
Key words:
- Agriculture /
- Machine learning /
- Model /
- Microplastics /
- Nutrients /
- Soil