


-
The gradual intensification of urbanisation has generated a series of environmental and infrastructure challenges, such as worsening traffic congestion and pollution, which pose a threat to the sustainable development of cities[1]. Cities around the world face various urban transportation challenges; this has led many countries to rethink their transportation systems and find ways to encourage the development and use of public transportation[2].
Bus rapid transit (BRT) systems can supplement the rail transit network of super-large cities, and serve as the backbone of public transportation networks in large and medium-sized cities. It can also help to shorten public transit travel times, improve road safety, and facilitate urban development, and has therefore been seen as a way to improve public transport[3]. At the same time, the way people travel is changing due to the rapid development of autonomous driving technology in recent years. Autonomous driving technology is seen as a major driving force for smart transportation in smart and sustainable cities[4], and it has the potential to significantly reduce traffic accidents caused by human error.
Many countries have been conducting field tests and trials of autonomous and automated driving buses[5]. The United States has launched several pilot projects across the country since 2016[6]. In China, autonomous driving buses have been successfully tested on the open roads of many cities since 2017. Amid the rapid development of urban public transportation and autonomous driving technology, automated driving BRT (AD-BRT) represents the future development direction of public transport. Due to exclusive right of way, BRT presents simpler scenarios and less traffic interference than ordinary car traffic and is the most possible transport mode to implement automated driving.
However, AD-BRT systems are still in the testing and trial operation stage, and many obstacles to the commercial operation of autonomous driving BRT remain due to the complexity and uncertainty of the transportation systems involved. People still have concerns, especially about the introduction of autonomous driving as a new technology[7]. Guiding its transition to the formal operational stage requires a scientific analysis of the risk factors about which the public is concerned and that may arise regarding its operation, thereby improving the reliability and safety of autonomous driving technology. This will allow corresponding laws, regulations, and policies to be formulated[8]. Moreover, public acceptance of autonomous driving technology is a key factor affecting its successful operation[9].
Although existing studies have begun to focus on the public's acceptance of autonomous driving technology, there are still many issues regarding the autonomous driving rapid transit system that are worth exploring. The insufficiency of the existing study about the public's acceptance of AD-BRT can be summarized in two aspects.
● Most of the existing studies focus on ordinary small household vehicles, while the knowledge about special applications like public transit and BRT automation needs deeper insight, considering BRT presents specific operation scenarios compared with the common autonomous vehicle;
● Existing works develop many kinds of technology acceptance models, but the influence paths of people's feeling of safety and knowledge about new technology are not adequately revealed in terms of AD-BRT.
Accordingly, this study established a model to explore the public's acceptance of AD-BRT and investigated the influencing factors. Drawing on the existing methodology, we extended the technology acceptance model (TAM) framework by introducing the perceived safety and individual knowledge about new technology as two major variables. Taking the BRT with autonomous driving capability in the Lingang New City of Shanghai (China) as an example, this study collected 424 respondents' opinions to reveal residents' attitudes towards AD-BRT. The model measured the impact of each factor and the interaction between them and confirmed the impacts of safety and awareness of AD factors. This methodology can provide insights useful for future studies on marketing and promoting AD-BRT for urban public transportation systems.
-
Acceptance analysis is to understand people's attitudes toward emerging techniques and their intention to use them before the new techniques can be widely implemented. Existing studies had focused on general autonomous cars and public acceptance and behaviour towards them, but fewer of them have considered the public transit systems, especially in terms of BRT. Hence, this section provides an outline of the literature regarding the theories of new technology acceptance behaviour and their application on public transport with automated vehicles, then depicts the extended technology acceptance model and its structural analysis method adopted in this research.
Review of behavioural theories
-
One-third of the research on the factors that may influence acceptance of autonomous driving has cited behavioural theory[10]. Table 1 summarises the relevant literature on the acceptance of autonomous driving based on behavioural theory. The most common behavioural theoretical models used to study the acceptance of autonomous driving technology include TAM[11], the theory of planned behaviour model (TPB)[12], and the unified theory of acceptance and use of technology model (UTAUT)[13]. The existing studies also compared TAM, TPB, and UTAUT[14,15]. In these models, the key factors of TAM are perceived usefulness, perceived ease of use, and attitude towards use; the key factors of TPB are attitude, subjective norm, and perceived behaviour control; and the key factors of UTAUT are performance expectancy, effort expectancy, social influence, and behavioural intention. The structures of the three models are defined in Fig. 1. Among them, TAM and UTAUT are used to research technology acceptance, while TPB is used to research general behaviours. TAM presents a simpler structure while UTAUT includes eight factors (four components and four moderators).
Table 1. Studies on the acceptance of autonomous driving based on behavioural theory.
The behavioural theory model adopted Important influencing factors Sample size Measurement method Sources Extended TAM Trust, perceived ease of use, perceived safety, perceived usefulness, Intention to use, and attitudes towards use 300 PLS-SEM Xu et al.[17] Extended TAM Perceived usefulness, perceived ease of use, perceived risk, perceived comfort, trust, attitudes, intention to use 401 SEM Wu et al.[18] TAM and TPB Attitudes, trust, subjective norms, perceived usefulness, compatibility 173 SEM Rahman et al.[19] Extended UTAUT Performance expectations, effort expectations, social influence, facilitating conditions, anxiety, perceived price, and individual innovativeness − − Lee & Jung[20] Extended UTAUT Performance expectations, hedonic motivation, social influence, facilitating conditions 315 Factor analysis Madigand et al.[5] Extended TAM Trust, perceived usefulness, perceived ease of use, external control factors 552 SEM Choi & Ji[21] Extended TAM Individual differences, systemic influences, social characteristics, perceived usefulness, perceived ease of use, attitudes towards use, intention to use 268 SEM Herrenkind et al.[22] Extended TAM Perceived security risk, perceived privacy and security, perceived usefulness, perceived ease of use, attitudes towards use, intention to use 216 SEM Zhang et al.[23] Extended TAM Life choices, subjective well-being, travel quality factors, life domains, perceived usefulness, perceived ease of use, attitudes towards use, intention to use 268 PLS-SEM Herrenkind et al.[24] Extended TAM Personality innovation, driving pleasure, trust, perceived usefulness, perceived ease of use. 369 SEM Hegner et al.[25] Extended TPB Subjective norms, perceived behavioural control, perceived risk, attitudes, autonomous driving knowledge, Intention to use 906 SEM Jing et al.[26] Extended TAM Trust, social influence, personal characteristics, perceived ease of use, perceived usefulness, intention to use 647 PLS-SEM Zhang et al.[27] Extended TAM Environmental concerns, green perceived usefulness, perceived ease of use, intention to use 470 SEM Wu et al.[28] 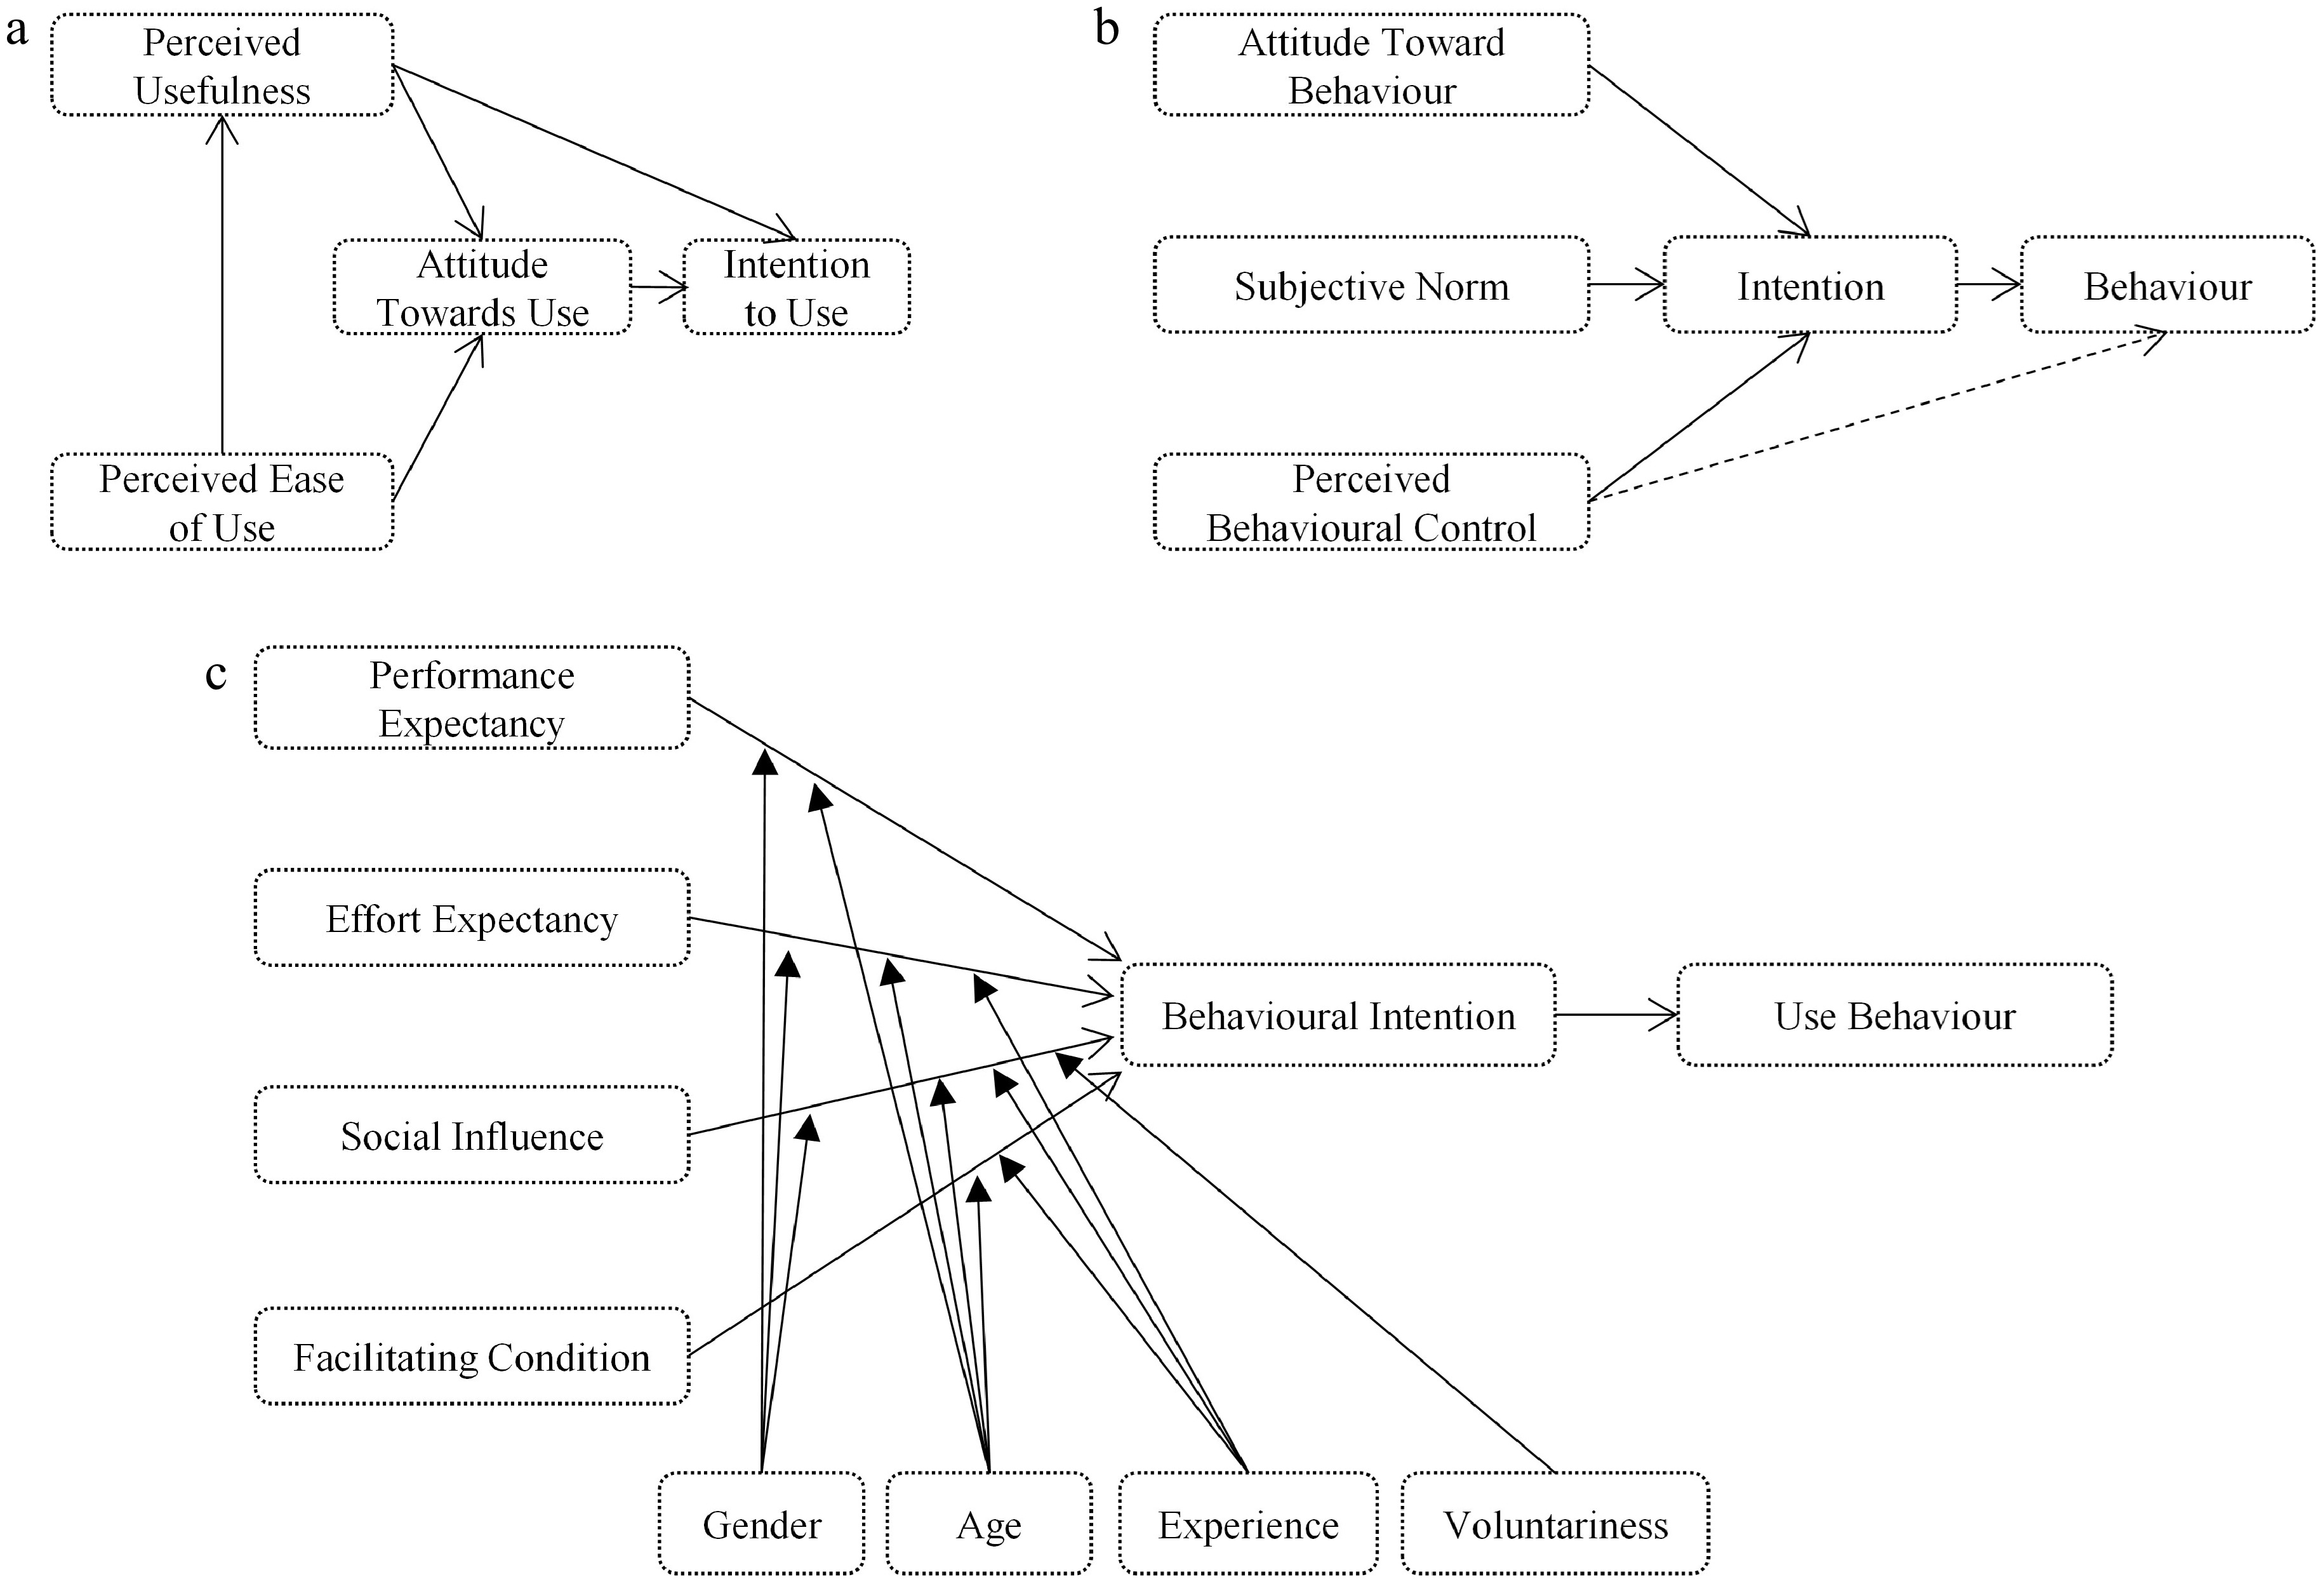
Figure 1.
The three main adopted categories of behavioural theories. (a) TAM, (b) TPB, and (c) UTAUT.
These models can be compared in terms of factors, structures, and feasibility. First, TPB involves users' nature but does not specify features of new technology, while TAM was originally designed to understand the impacts of new technology. Second, UTAUT can be regarded as a hybrid of TAM and TPB, for performance expectancy and effort expectancy represent perceived usefulness (PU) and perceived ease of use (PEOU) in TAM[16], and facilitating condition and social influence hold the meaning of perceived behavioural control and subjective norm in TPB, respectively. However, the structure of UTAUT in one layer may not capture latent interactions among factors like TAM. Existing studies reported contradictory results of UTAUT and TAM: in one case, TAM could explain well due to its simpler structure[14]; while UTAUT could perform better due to elaborated and general factors[15].
Factors influencing acceptance of autonomous buses
-
The acceptance of autonomous driving technology for public transit systems forms a direction derived from common autonomous driving due to the unique operating environment. TAM, the TPB, and the UTAUT are commonly used models. The representative works regarding automated public transportation systems are summarized in Table 2.
Table 2. Representative studies on acceptance of autonomous buses.
Anchoring theory Object Major factor Sources TAM Autonomous shuttle Extended using trust and perceived enjoyment. Chen[9] Autonomous electric buses Extended social impact, individual differences and system characteristics, Herrenkind et al.[22] Autonomous buses Perceived safety, bus service quality, and moderator variable Yan et al.[29] Autonomous buses Perceived risk, trust Wu et al.[18] UTAUT Automated road transport systems Performance expectancy, effort expectancy, social influence, socio-demographics Madigan et al.[30] UTAUT2 Autonomous public transport systems performance expectancy, effort expectancy, social influence, facilitating conditions, hedonic motivation, price value, habit, trust and safety, perceived usefulness, perceived risk, and behavioural intention Korkmaz et al.[31] TAM and TPB Autonomous shuttle Relative advantage, compatibility, complexity, trialability, observability, attitude, intention to use Moták et al.[32] UTAUT, TTF, and trust Autonomous buses Performance expectancy, effort expectancy, social influence, facilitating conditions, perceived risk, trust, task technology fit Cai et al.[16] UTAUT2 Autonomous modular transit Performance expectancy, social influence, hedonic motivations, trust, green perceived usefulness Rejali et al.[33] TIB Autonomous shuttle Social factors, feelings, safety perception, operation environment, behavioural intention Salonen & Haavisto[34] The comparison of existing models implied that the structure of traditional TAM is relatively simple. Some key factors, such as safety and people's awareness of new techniques, are not considered in it. Table 3 compares the factors considered by existing studies with this paper regarding public acceptance of automated driving public transits. For instance, Chen[9] did not involve safety, Herrenkind et al.[22] did not consider users' cognition of new autonomous driving technology, etc. Although studies like Chen[9] and Wu et al.[18] included PU and PEOU, extra factors that may impact PU and PEOU were not further revealed. Many articles considered trust as a major factor that may influence users' intentions, and they provided essential analysis of the impacts of trust. Note that their trust mainly regards the confidence in the safety of new technology[9,16], which is strongly correlated to the perceived safety and knowledge about new technology, which are considered in this paper. This paper is inclined to focus on safety and people's perception of knowledge, which latently contains the consideration of trust.
Table 3. Factors considered in different models.
Sources Trust Safety Cognition of technology Impact to PU and PEOU Multi-group analysis Chen[9] ○ √ √ √ ○ Herrenkind et al.[22] ○ √ √ ○ √ Yan et al.[29] √ ○ √ ○ ○ Wu et al.[18] ○ √ √ √ ○ Madigan et al.[30] √ √ ○ √ ○ Korkmaz et al.[31] ○ ○ ○ √ ○ Cai et al.[16] ○ √ √ √ ○ Salonen & Haavisto[34] √ √ ○ √ √ Current study ○ ○ ○ ○ ○ Based on the comprehensive review of the above literature, given the special scenario of AD-BRT, two factors of perceived safety and perceived knowledge of new technology are introduced to improve the TAM model. The two factors establish trust towards new technology. Because PEOU captures part of the meanings of effort expectancy and facilitating condition, and the perceived knowledge of new technology latently implies social influence, the TAM with the proposed two factors can also capture the features originally elaborated by UTAUT. Moreover, to explore the moderate effects, our work designed moderators for TAM just like UTAUT.
Structural equation model for extending TAM
-
The structure of the TAM, proposed in 1989 by Davis[11], is shown in Fig. 1a. The TAM is one of the most influential among the models used to investigate the acceptance of technological innovations[35]. This model posits that the intention to use can be inferred from behavioural choices. External information can affect an individual's perceptions of the usefulness and ease of use of a system, which thus influences their attitudes towards its use; this in turn affects their intention to use and actual use of the system. Among these factors, perceived usefulness is defined as an individual's perception of the helpfulness of a system when choosing whether to use it. Perceived ease of use is defined as an individual's attitude about the potential positive impacts of using the system[11]. External factors have a greater impact on perceived ease of use, which, together with external factors, influence an individual's perception of a system's usefulness. In general, the easier a system is to operate and the more useful it is to people, the more people will tend to use it.
The structural equation model (SEM) is the most appropriate statistical technique for testing correlations[28]. Linear relationships between variables are usually assumed and statistically tested to assess the hypothesized relationships[36]. Partial least squares structural equation modelling is a variance-based SEM approach that combines principal component analysis with multiple regression analysis to perform the iterative estimation. A complete PLS-SEM model consists of two parts: the outer model (measurement model) and the inner model (structural model). The measurement model evaluates the relationship between observed and latent variables, while the structural model assesses the relationship between exogenous and endogenous latent variables[37]. In addition, the PLS-SEM can handle measurement errors due to variable measurements and complex structural models with multiple variables; it also has no data distribution requirements and remains valid even with small samples[38]. For instance, Herrenkind et al.[24] adopted the PLS-SEM to measure the extended TAM model with only 268 samples used.
Based on the knowledge of the existing studies, in this paper, we adopted the approach of the PLS-SEM framework to implement the extended TAM, which can appropriately capture the technology acceptance behaviour based on a limited quantity of samples.
-
Based on the existing literature, to compensate for the weaknesses in the existing extended TAMs, we add the perceived technology level (PTL) and the perceived safety (PS) to the common TAM. The PTL is a latent variable to capture people's perceived knowledge about the autonomous driving technology applied to public transportation. The PS is responsible for people's perceived safety level that may impact their intention of using AD-BRT. The structure of the proposed extended TAM is shown in Fig. 2.
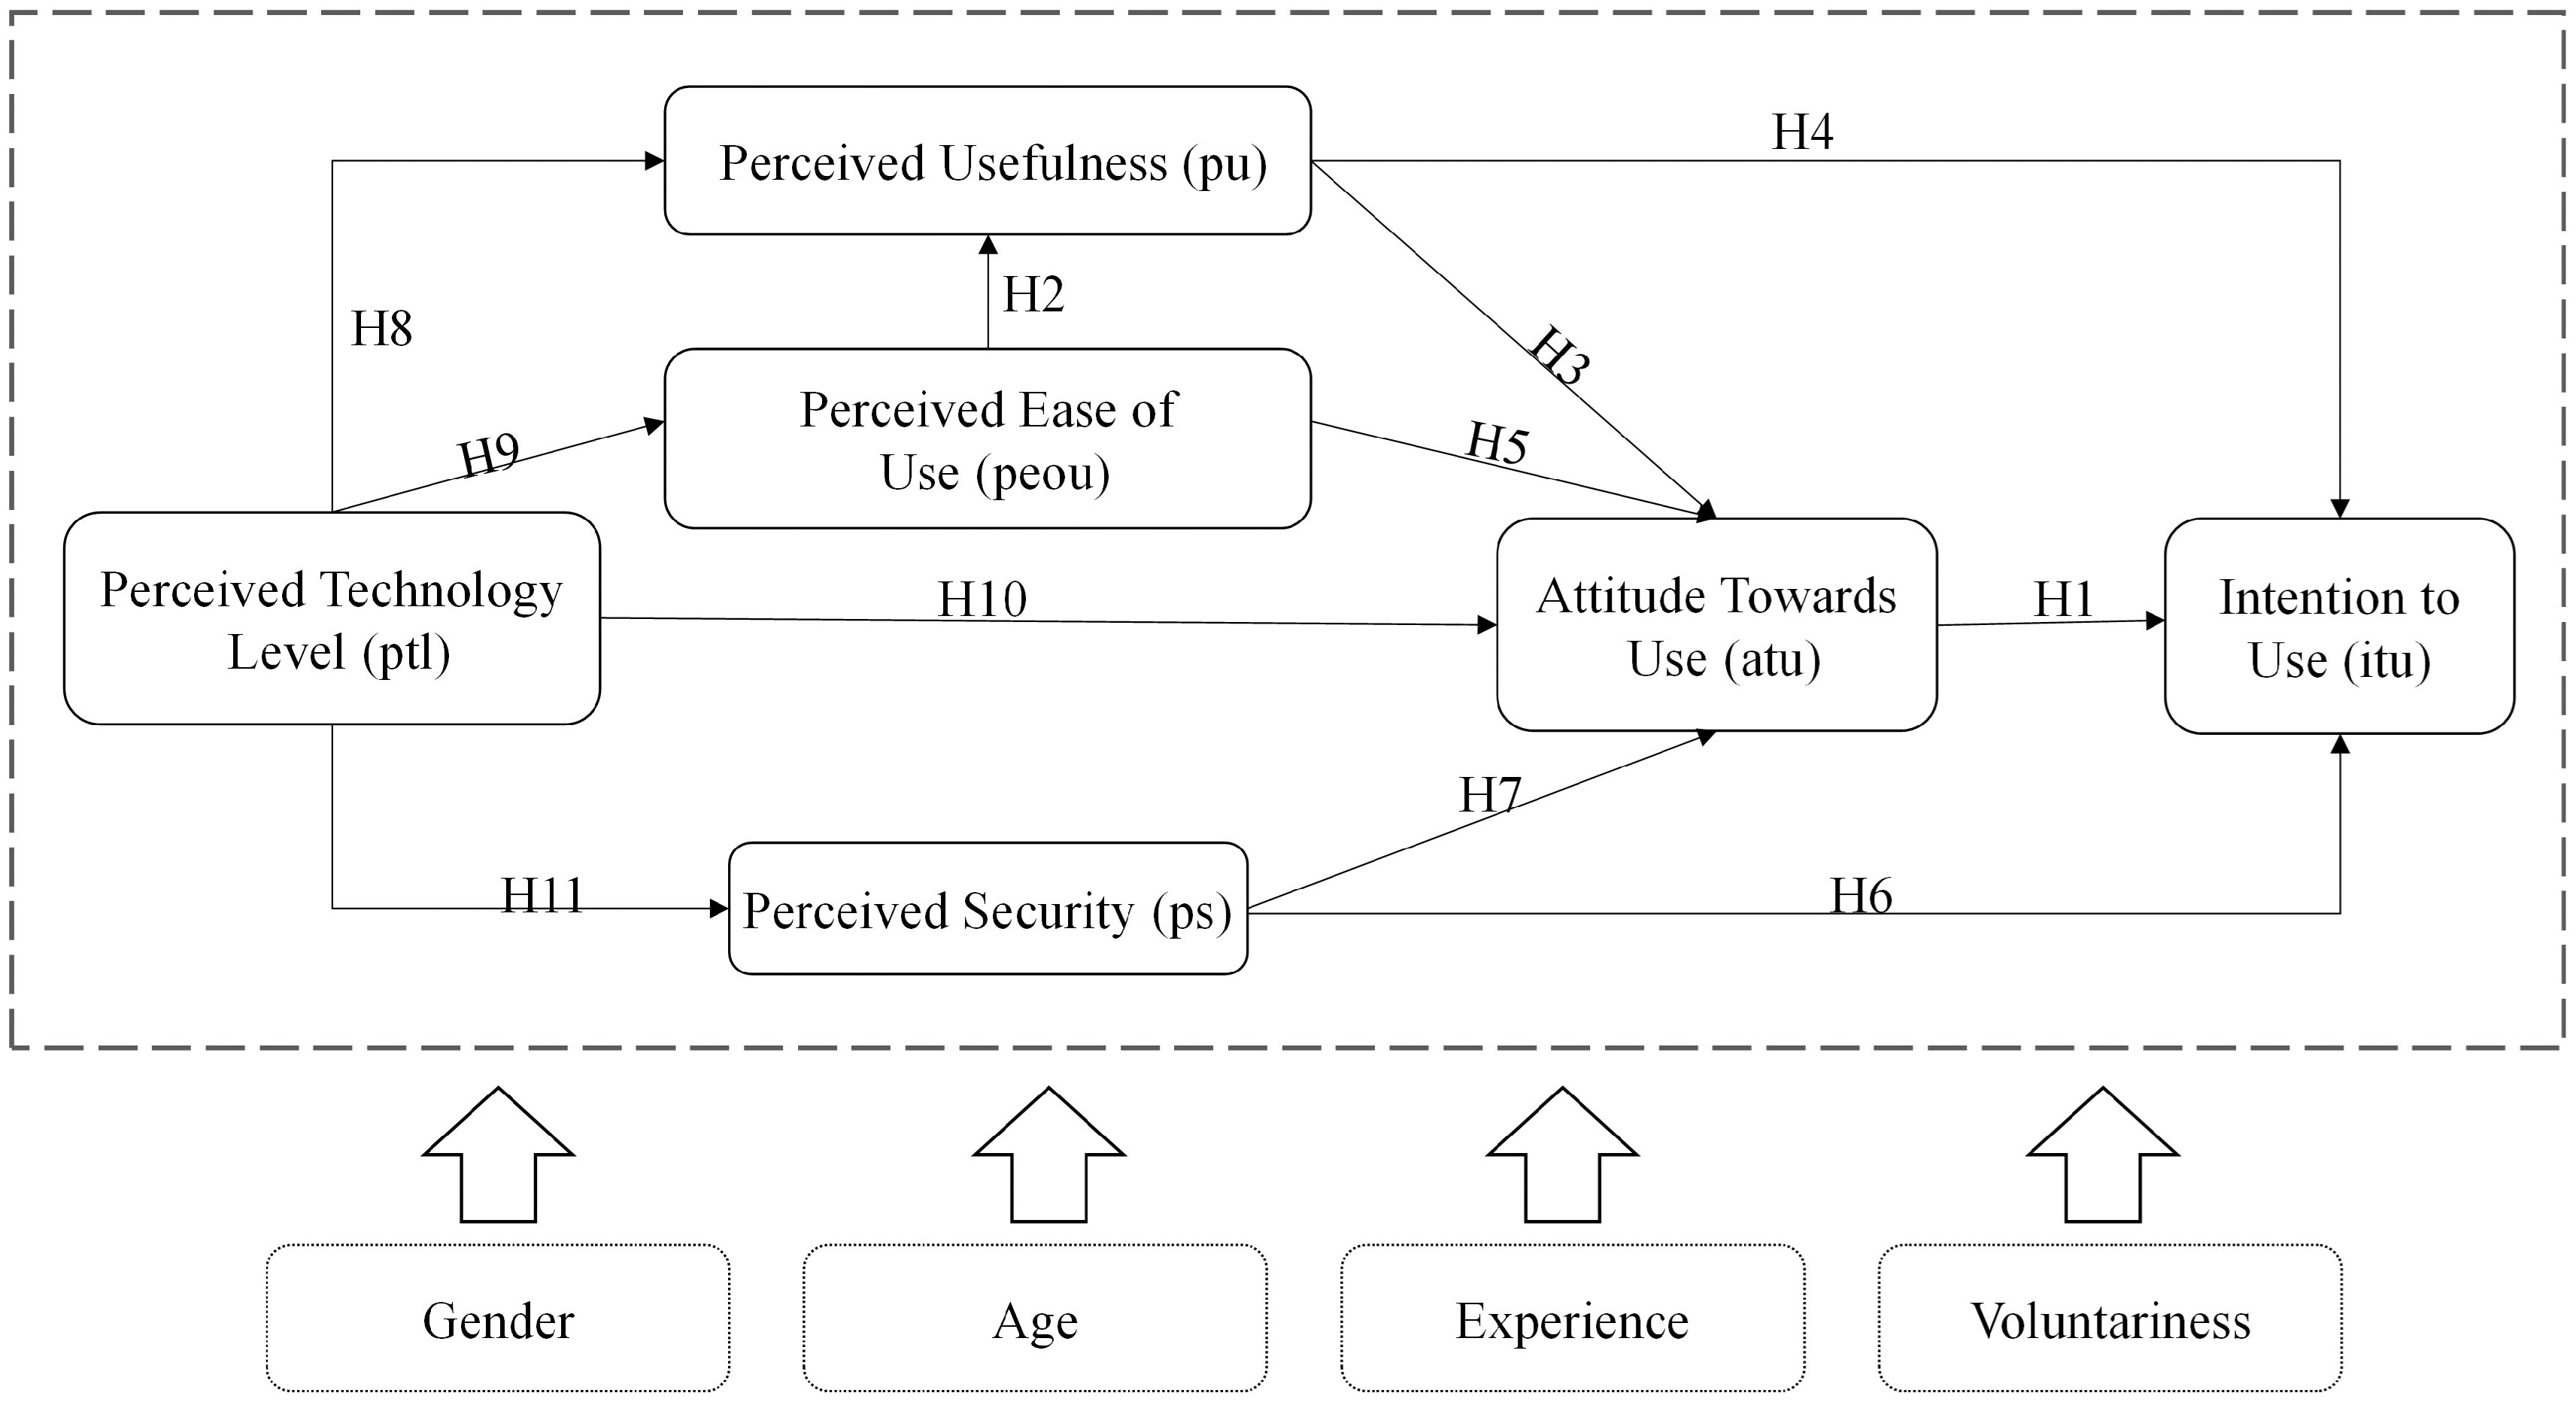
Figure 2.
The proposed extended technology acceptance model.
In the proposed model, we first put forward a series of hypotheses which indicate the possible influences between two factors. Note that the factors are latent variables that cannot be directly acquired and should be measured by measuring variables and constructed by the SEM. Moreover, the influences between two factors can also vary according to passenger features such as gender, age, monthly income (CNY) , and level of education, so we regarded them as grouping variables to test their impacts on the hypotheses. The hypotheses are listed as follows and are also marked by arrows in Fig. 2.
H1: The attitude towards use positively influences the intention to use.
H2: Perceived ease of use positively influences perceived usefulness.
H3: Perceived usefulness positively affects attitude towards use.
H4: Perceived usefulness positively affects intention to use.
H5: Perceived ease of use positively affects attitude towards use.
H6: Perceived safety positively influences intention to use.
H7: Perceived safety positively influences attitudes towards use.
H8: Perceived technology level positively affects perceived usefulness.
H9: Perceived technology level positively affects perceived ease of use.
H10: Perceived technology level positively affects the attitude towards use.
H11: Perceived technology level positively affects intention to use.
In this study, we also added socio-economic attributes such as gender, age, monthly income, and level of education into the model. This helps to understand the differences among people with varied characteristics.
Some further explanations of the latent variables are as follows:
(1) Attitude towards use (ATU) measures whether people have positive or negative attitudes towards using AD-BRT. Most studies have shown that a positive attitude towards a technology often leads to a higher intention to use (ITU)[39,40].
(2) Perceived usefulness (PU) is the degree to which an individual perceives AD-BRT use to help achieve a certain purpose. Perceived ease of use (PEOU) is the degree to which an individual believes that it is easy to use the AD-BRT. It is often assumed that PEOU has a direct impact on PU[28]. Studies have also consistently concluded that PU and PEOU have direct effects on ATU[21, 40].
(3) Perceived safety (PS) related to the trust to ride the AD-BRT system. In this study, it refers to the level of safety individuals perceive regarding AD-BRT. Studies have shown that people are more likely to accept autonomous vehicles when their safety levels are four to five times higher than those of manually driven vehicles[41]. People cannot be expected to accept and use autonomous cars if they do not feel sufficiently safe riding in them. The research[42,43] has also shown that many people are very concerned about the safety of autonomous driving, which may lead them to be reluctant to ride in autonomous vehicles. Similarly, studies have highlighted the key role of enhanced perceived safety in promoting public acceptance of autonomous driving[44]. Studies have shown that passengers with higher safety perceptions regarding autonomous driving may be more inclined to show positive attitudes and behaviours towards its use[17].
(4) Perceived technology level (PTL) refers to the level of knowledge about the automated driving technology that people intuitively perceive. As an innovative technology product, autonomous driving may have safety issues[10,18], such as system malfunctions, communication system breakdowns, or hacking attacks, which may raise safety concerns[26]. Some studies have shown that people's knowledge, cognition, or awareness of autonomous driving technology can affect their trust in it, which can in turn influence their ITU through PU[21]. However, it is unclear how the PTL towards AD-BRT in the context of autonomous driving relates to PEOU and ITU. This study attempts to establish the influence paths from PTL to PU, PEOU, ITU, and PS.
-
In this study, we adopted the aforementioned extended TAM model to analyse a pilot project of AD-BRT in Lingang New City, Shanghai, China. The AD-BRT system and networks are shown in Fig. 3. The system currently consists of two lines and the vehicles use automated driving technology and new energy sources, since launched in Dec 2021. To improve the transportation capacity of the newly constructed satellite cities, Shanghai has planned 22 BRT lines with autonomous driving capability, totalling 280 km in the future.
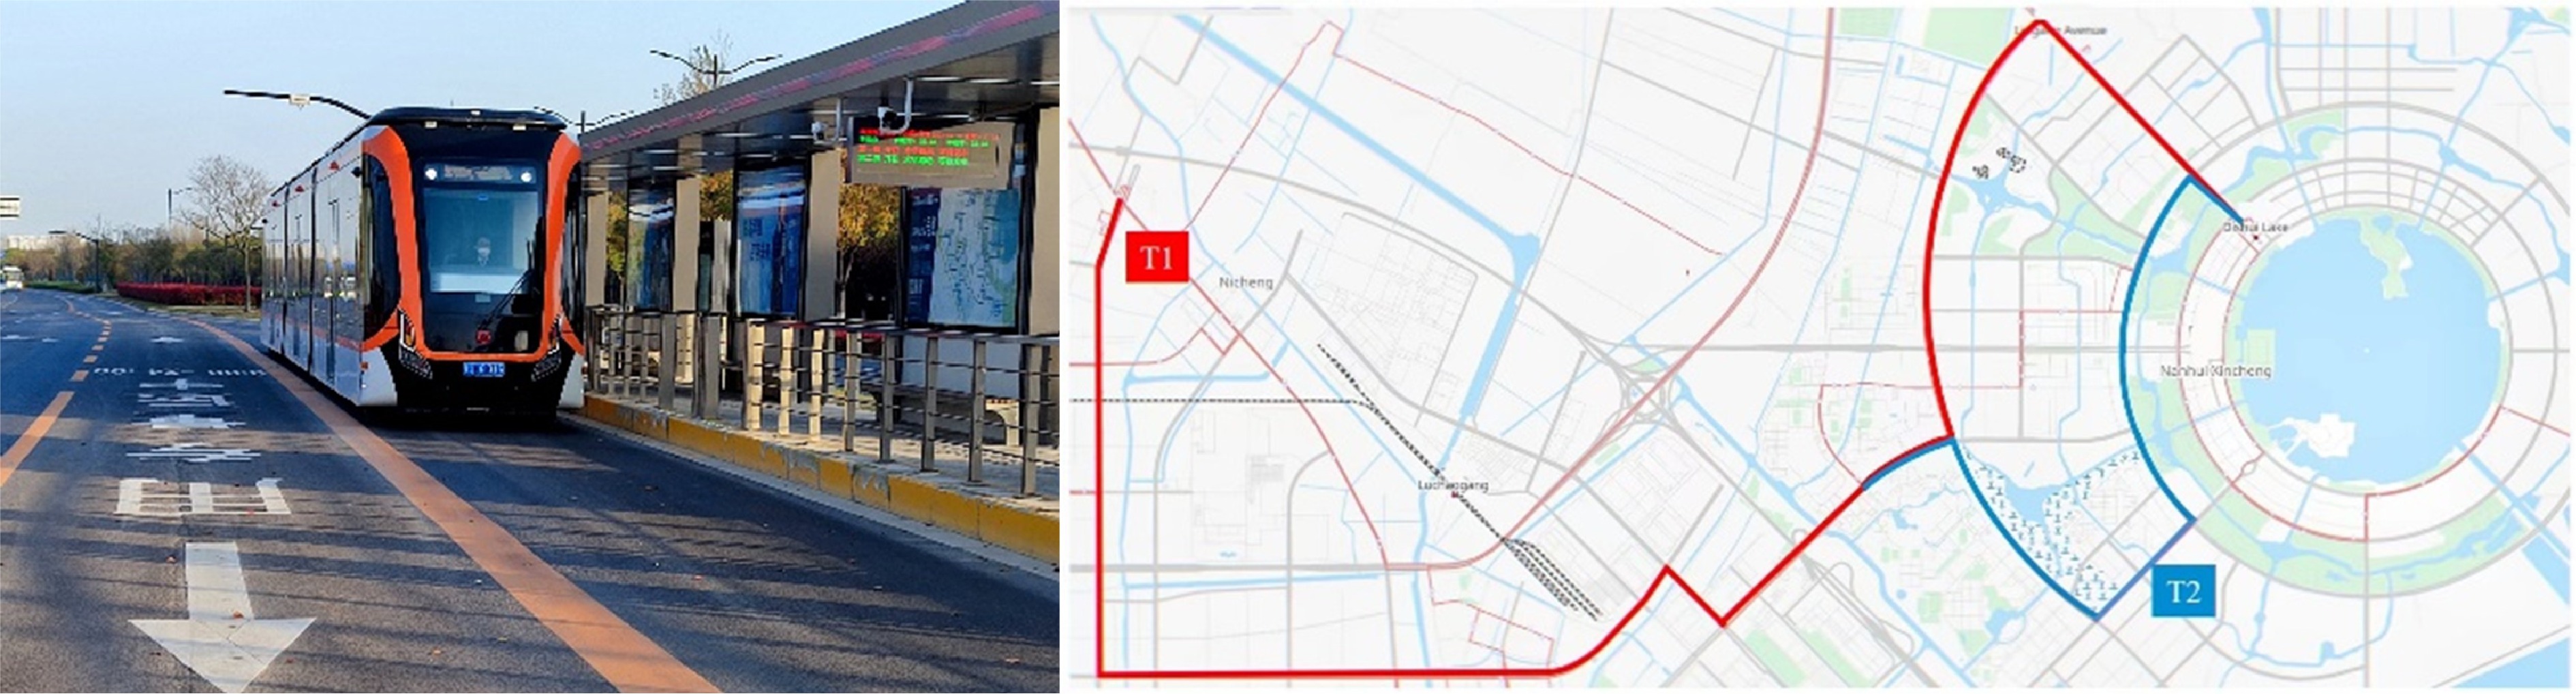
Figure 3.
Automated driving BRT in Lingang New City, Shanghai, China.
To collect responses regarding the above-described application case, we designed an online questionnaire on the Questionnaire Star platform, which provides sample services and questionnaire tracking. First, an online questionnaire with 26 questions was designed, including multiple categories of demographic socioeconomic attributes. Each question about the measuring variable contains five options based on a five-level Likert scale, including 1) strongly disagree, 2) disagree, 3) neutral, 4) agree, and 5) strongly agree, which require the respondents to choose one. The content of the questionnaire is shown in Table 4.
Table 4. Latent variables of the model and question items design.
Name of latent variable Measuring
variableQuestion item Perceived technology level ptl1 Automated and connected vehicle technologies have begun to proliferate ptl2 Automated BRT systems are very advanced. ptl3 Automated and connected vehicle technologies can be applied to regular public transit. Perceived safety ps1 Automated BRT has a high level of safety quality. ps2 If there is a malfunction or danger, I believe that automated driving technology can protect my safety well. ps3 Automated BRT equipped with safety officers would make me feel very reassured. ps4 Automated rapid transit equipped with safe ride guidance (safety videos, posters, etc.) would make me feel very reassured. Perceived usefulness pu1 Automated BRT is convenient for my daily travel. pu2 The autonomous driving BRT runs smoothly. pu3 The autonomous driving BRT operates at a faster speed. pu4 The waiting time for the autonomous driving BRT is shorter compared to other modes of transportation. Perceived ease of use peou1 The process of taking the autonomous driving BRT is simple; even if I have never taken it before, I can easily take a ride. peou2 The station locations are very prominent and easy to find, so I can easily walk to the station. peou3 I can easily find the automated BRT route that I need to take to reach my destination. peou4 I am willing to take the autonomous driving BRT even if it requires transferring between different lines to reach my destination. Attitude towards use atu1 I support autonomous driving BRT. atu2 I think riding the autonomous driving BRT is a demonstration of support for new technologies. atu3 Autonomous driving technology will make public transportation more attractive to me. Intention to use itu1 I am willing to ride on the autonomous driving BRT. itu2 I am willing to recommend the autonomous driving BRT to others. itu3 I would prefer to take the autonomous driving BRT. The survey was conducted on October 8, 2022 (pre-survey, n = 154 respondents), and from October 17 to November 4, 2022 (formal survey, n = 424 respondents). The purpose of the pre-survey is to test the readability of the questionnaire and the reasonableness of the question set. The questionnaire for the formal survey was revised based on the respondents' suggestions. The average response time of the pre-survey was 261.74 s, and the minimum response time was 121 s.
For the formal survey, the target respondents were users who had travelled on an automated driving public transit, and the respondents who were not riders were not included in the samples. The main reasons are as follows: 1) the result of the pre-survey suggested that if it does not consider whether the respondent has taken AD-BRT, the respondent's understanding of the AD-BRT scenario may be inadequate, and the results may be biased; 2) if only consider the people who take AD-BRT as their main mode of travel, they already have specific behavioural attributes, which are not representative of all potential passengers.
During the formal survey, the survey platform identified potential respondents from their sample database and invited them to participate in the online survey via email and web messages. Non-riders were skipped by a quick screening question. The target sample size was approximately 10 times the number of questions (n ≈ 280). The survey agency sent out 500 invitations after quick screening, which were followed up by email. The platform received 439 responses, of which 15 were invalid. The average response time for the 424 valid samples was 209.03 s.
As Table 5 shows, women accounted for 54.95% and men accounted for 45.05% of the respondents. The group of 25–34 year olds accounted for the largest proportion of the survey group, indicating that the group had more young and middle-aged respondents than those from other age groups. It also shows that this group of people has a greater demand for travel due to work and life needs. Most of the respondents had a monthly income of between CNY 10,001 and 20,000, and most had a bachelor's degree. Most of the respondents worked in companies, and such personnel have a relatively high travel demand. Regarding family composition, most respondents were part of a couple living with their children (accounting for 63.44%); these were followed by a single person, a couple, and a couple living with their parents. Most of the respondents in this group owned a private car and had a driving licence.
Table 5. Description of sample feature distribution.
Variable Title item Frequency Percentage (%) Gender Male 191 45.05 Female 233 54.95 Age (year) 18–24 46 10.85 25–34 235 55.42 35–50 127 29.95 51–65 15 3.54 65+ 1 0.24 Monthly income (CNY) < 5,000 29 6.84 5,000–10,000 150 35.38 10,001–20,000 178 41.98 20,001–30,000 49 11.56 > 30,000 18 4.25 Academic qualifications High school and below 12 2.83 3-year college degree 38 8.96 bachelor's degree 328 77.36 Masters' degree and above 46 10.85 Occupation Civil servant 5 1.18 Company employee 341 80.42 Public sector employee 34 8.02 Self-employed 9 2.12 Students 27 6.37 Retiree 6 1.42 Others 2 0.47 Family structure Single 71 16.75 Husband and wife 47 11.08 Couple living with children 269 63.44 Couple living with parents 37 8.73 Private car Yes 355 83.73 No 69 16.27 Driving licence Yes 374 88.21 No 50 11.79 Model calibration
-
Testing the data from the measurement results is important for ensuring that the subsequent analysis is meaningful. Reliability is used to analyse the reliability of the questionnaire; Cronbach's alpha is most commonly used. Composite reliability (CR) is often used to measure the correlation reliability between the questionnaire as a whole and the various questions in the questionnaire settings. A reliability coefficient below 0.6 is generally considered unreliable and requires a redesign of the questionnaire or an attempt to collect and analyse the data again. A reliability coefficient between 0.6 and 0.7 is considered reliable, that between 0.7 and 0.8 is considered relatively reliable, that between 0.8 and 0.9 is considered very reliable, and that between 0.9 and 1 is considered very reliable.
The average extracted variance (AVE) is a statistical measure used to test the internal consistency of structural variables. Composite reliability is used to measure whether the questions corresponding to the latent variable consistently explain the variable. Generally, AVE values > 0.5 and CR values > 0.7 indicate good aggregation validity and good validity of the latent variable[27].
As Table 6 shows, the Cronbach coefficients were all above 0.6, indicating acceptable reliability. The CR values were all above 0.8, indicating acceptable reliability of the measured variables, and the AVEs were all above 0.5, indicating acceptable convergent validity. However, the third item of perceived safety in the standard load did not exceed 0.6, indicating that ps3 did not well support PS. This result suggested that ps3 is to be deleted from the mode.
Table 6. Tests and analysis of model reliability.
Latent variable Measured variable Standard load Cronbach alpha CR AVE Attitude towards use atu1 0.814 0.697 0.831 0.622 atu2 0.725 atu3 0.823 Intention to use itu1 0.833 0.751 0.858 0.668 itu2 0.796 itu3 0.821 Perceived ease of use peou1 0.751 0.723 0.828 0.546 peou2 0.758 peou3 0.728 peou4 0.719 Perceived safety ps1 0.815 0.703 0.818 0.532 ps2 0.779 ps3 0.600 ps4 0.706 Perceived technology level ptl1 0.762 0.672 0.820 0.603 ptl2 0.753 ptl3 0.814 Perceived usefulness pu1 0.710 pu2 0.731 0.708 0.820 0.533 pu3 0.742 pu4 0.735 Underline means the measured variable does not well support the latent variable. After removing ps3, the reliability and validity results for the model and the standard loadings of the latent variable test items all reached the required standards. The next step was to perform the discriminant validity test on the model. This test is mainly used to measure the degree of difference between the latent variables in a questionnaire. When the correlation coefficient between each variable and the remaining variables are less than the arithmetic square root of the corresponding AVE, this indicates that the latent variables are distinguishable[45].
The analysis results shown in Table 7 indicate that the standardised coefficients between pairs of each dimension were less than the arithmetic square root of the corresponding AVE values in this discriminant validity test, indicating that the model has good discriminant validity. This indicated that the data could be further analysed through SEM.
Table 7. Discriminant validity test results.
Attitude towards use Perceived safety Perceived
technology levelPerceived
ease of usePerceived
usefulnessIntention to use Attitude towards use − − − − − − Perceived safety 0.635 − − − − − Perceived technology level 0.555 0.667 − − − − Perceived ease of use 0.671 0.675 0.613 − − − Perceived usefulness 0.671 0.733 0.600 0.726 − − Intention to use 0.706 0.704 0.623 0.722 0.712 − Arithmetic square root of AVE 0.789 0.795 0.777 0.739 0.730 0.817 -
In this section, we interpret the result and conduct further analysis using the calibrated model. First, we interpret the result of affecting paths from one factor to another. Then, we recognize the unaccepted hypothesis and explain why the affecting path did not stand. Third, we analyse the proportions of direct effects and mediating effects within the affecting paths. Finally, we tested the effects in different categories of gender, age, income, and education.
Path coefficient analysis
-
The extended TAM is implemented by a PLS-SEM using the smartpls3.0 software. The model consists of six latent and 20 measured variables as shown in Fig. 4. Using the software, the path coefficient estimation and variable impact utility analysis were conducted. The standardised path coefficient and hypothesis test results are shown in Table 8, where the p-value test results were required to be less than 0.05.
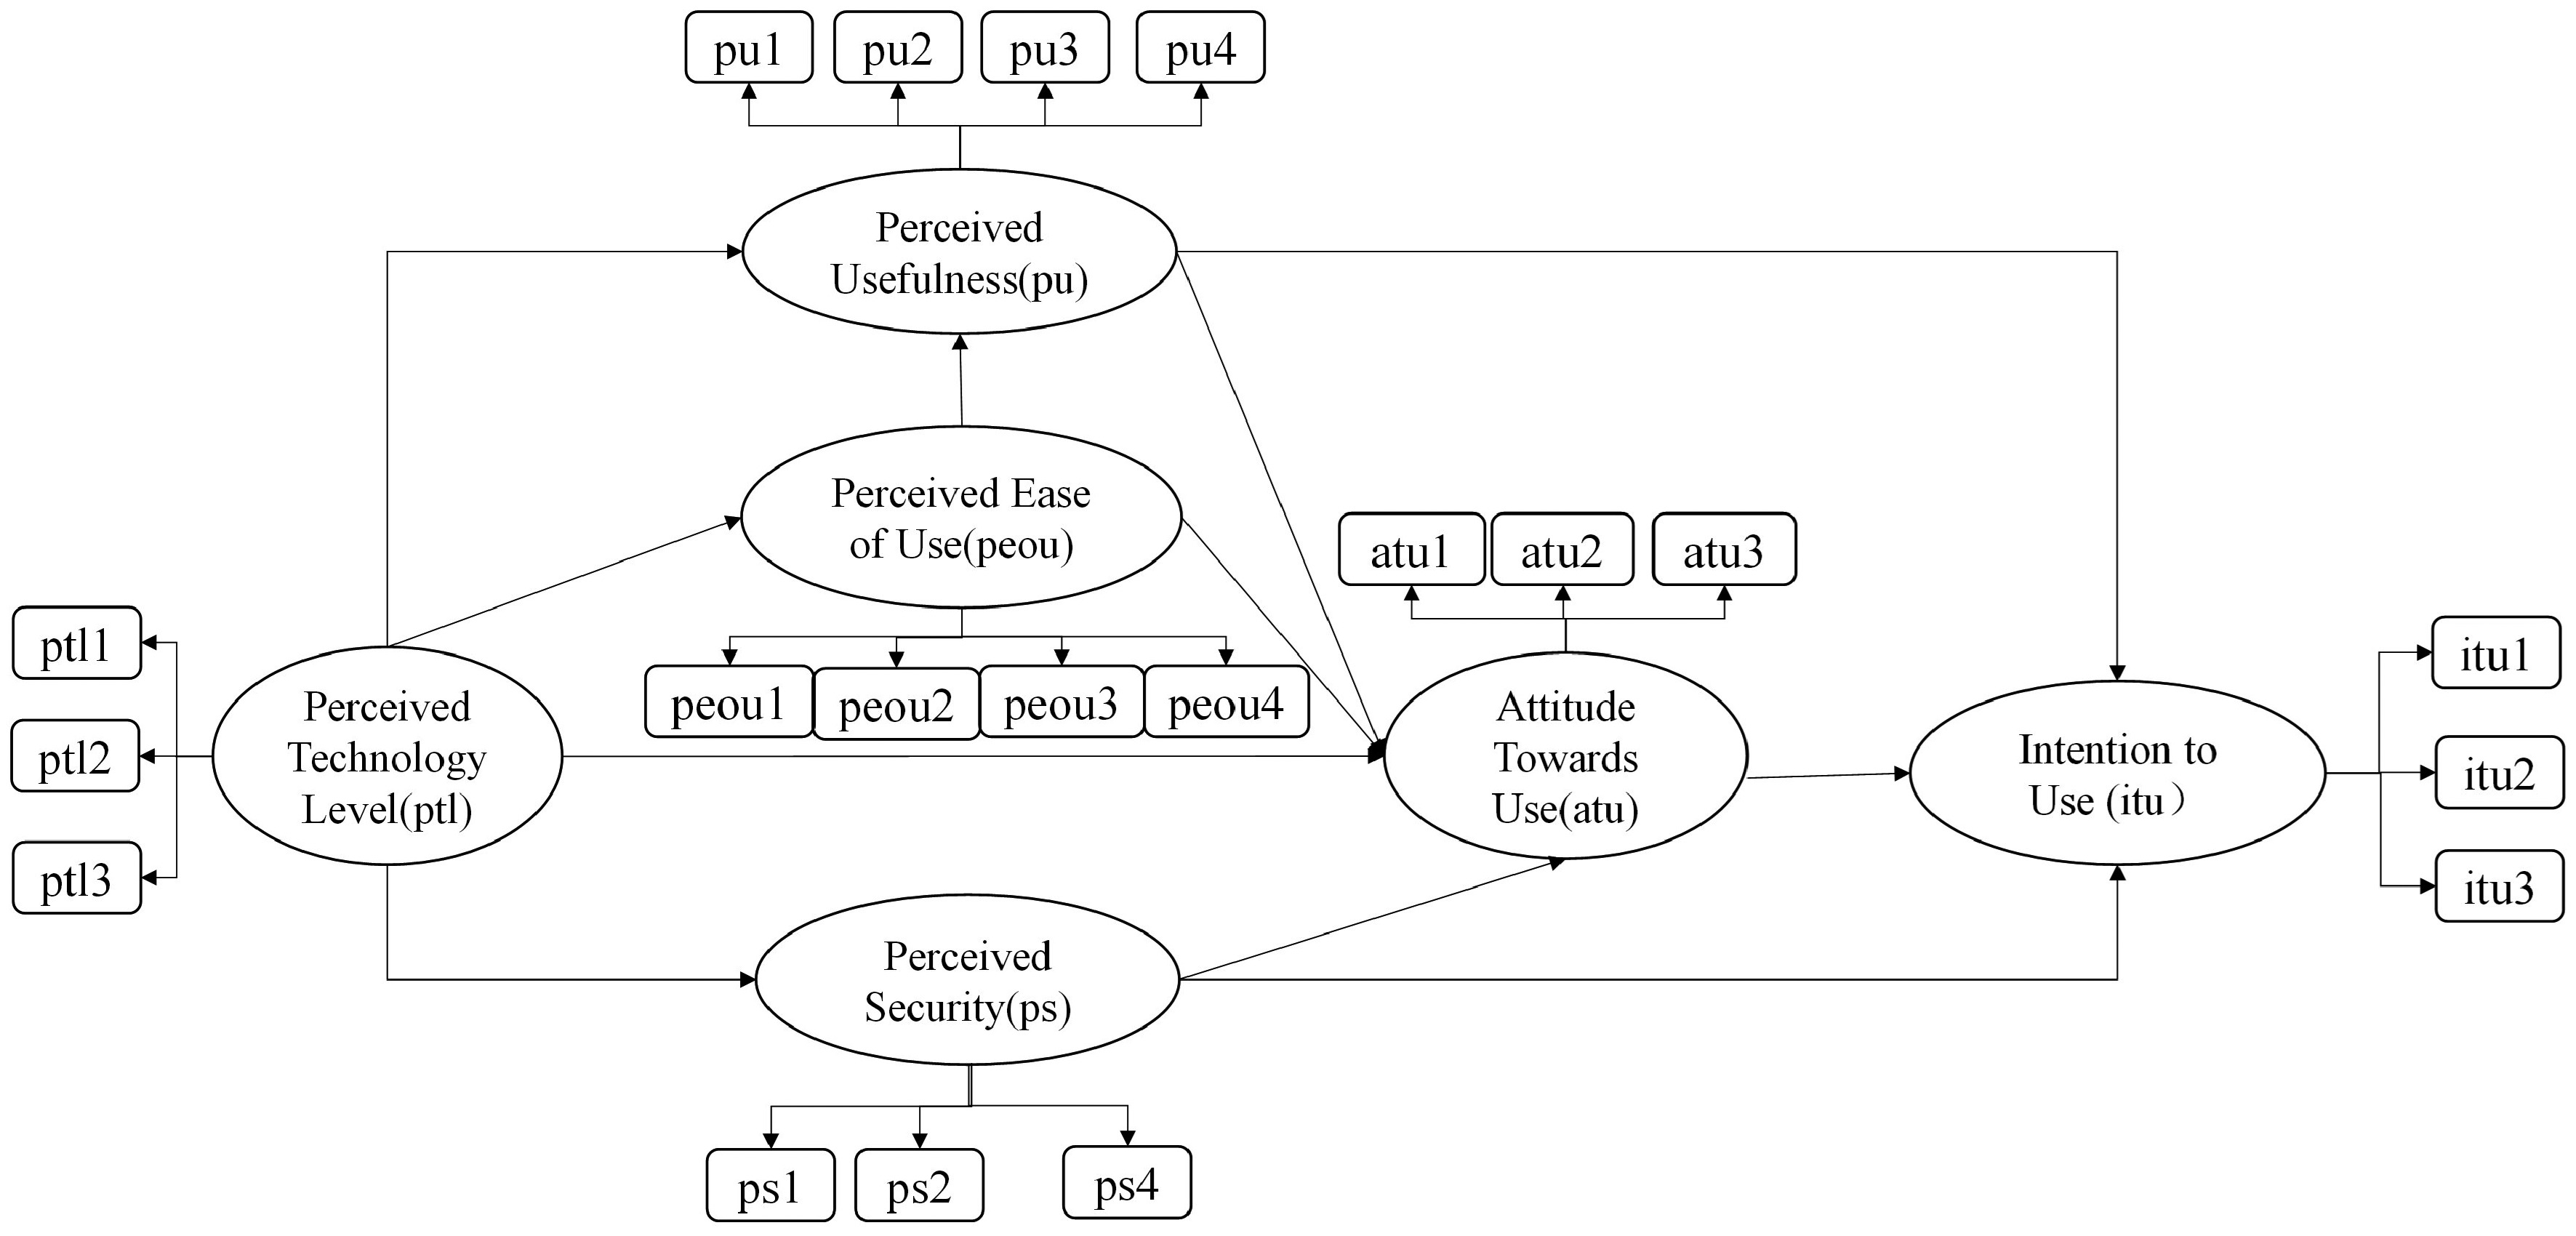
Figure 4.
Initial structural equation model of the extended TAM.
Table 8. Model path coefficients and hypothesis testing results.
Path relationships p-value Path factor Significance Attitude towards use →
Intention to use0.000 0.468 Significant Perceived safety →
Attitude towards use0.038 0.129 Significant Perceived safety → Intention to use 0.000 0.275 Significant Perceived technology level →
Attitude towards use0.057 0.090 Not significant Perceived technology level → Perceived safety 0.000 0.667 Significant Perceived technology level → Perceptual ease of use 0.000 0.613 Significant Perceived technology level → Perceived usefulness 0.000 0.249 Significant Perceived ease of use →
Attitude towards use0.000 0.262 Significant Perceived ease of use →
Perceived usefulness0.000 0.574 Significant Perceived usefulness →
Attitude towards use0.000 0.368 Significant Perceived usefulness →
Intention to use0.001 0.180 Significant Underline means the path factor is not significant in the model. The test results shown in Table 8 indicate the following:
(1) Perceived usefulness, attitude towards use, and perceived safety had a direct and significant positive effect on the intention to use, supporting H1, H4, and H6. This result suggests that the more useful the AD-BRT is for their own travel, or the more positive their attitude towards the autonomous BRT ride, or the safer they feel the AD-BRT ride, people present stronger behavioural intention to take the AD-BRT ride.
(2) Perceived usefulness, perceived ease of use, and perceived safety had a direct and significant positive effect on attitudes towards intention to use, supporting H3, H5, and H7. It suggests that the more useful it is for people to travel, or the easier it is to ride, or the safer people feel, the more positive people will intend to ride it.
(3) Perceived ease of use and perceived technology level had a direct and significant positive effect on perceived usefulness, supporting H2 and H8, suggesting that the easier to ride an AD-BRT people feel, or the higher the automated driving technology level that people perceive, the more useful people think their trip is.
(4) Perceived technology level had a direct and significant positive effect on perceived ease of use and perceived safety, supporting H9 and H11. It suggests that the more advanced the technology of AD-BRT felt by passengers, the easier and safer people feel to ride on AD-BRT.
(5) Perceived technology level had no direct or significant positive effect on attitude towards use, rejecting H10, i.e., the level of automated driving technology perceived by people for AD-BRT is not related to their attitude of intention to ride.
The test results rejected the hypothesis that PTL positively affects attitude towards use (H10), indicating that PTL does not directly affect people's attitude towards riding AD-BRT. The revised model results with path coefficients are shown in Fig. 5. It should be noted that the proposed extended TAM is different in adding PTL and PS to further reveal what impacts people's thinking on usefulness, feeling of ease of use, and their using attitudes. Beyond the basis of classic TAM, we discovered a hierarchical structure that it is the PTL that affects people's perceived usefulness and perceived ease of use; the PTL also affects people's perceived safety. PTL does not directly affect ATU, but indirectly affects ATU by directly affects PU, PEOU, and PS, while PU, PEOU, and PS mediately affect ATU and ITU.
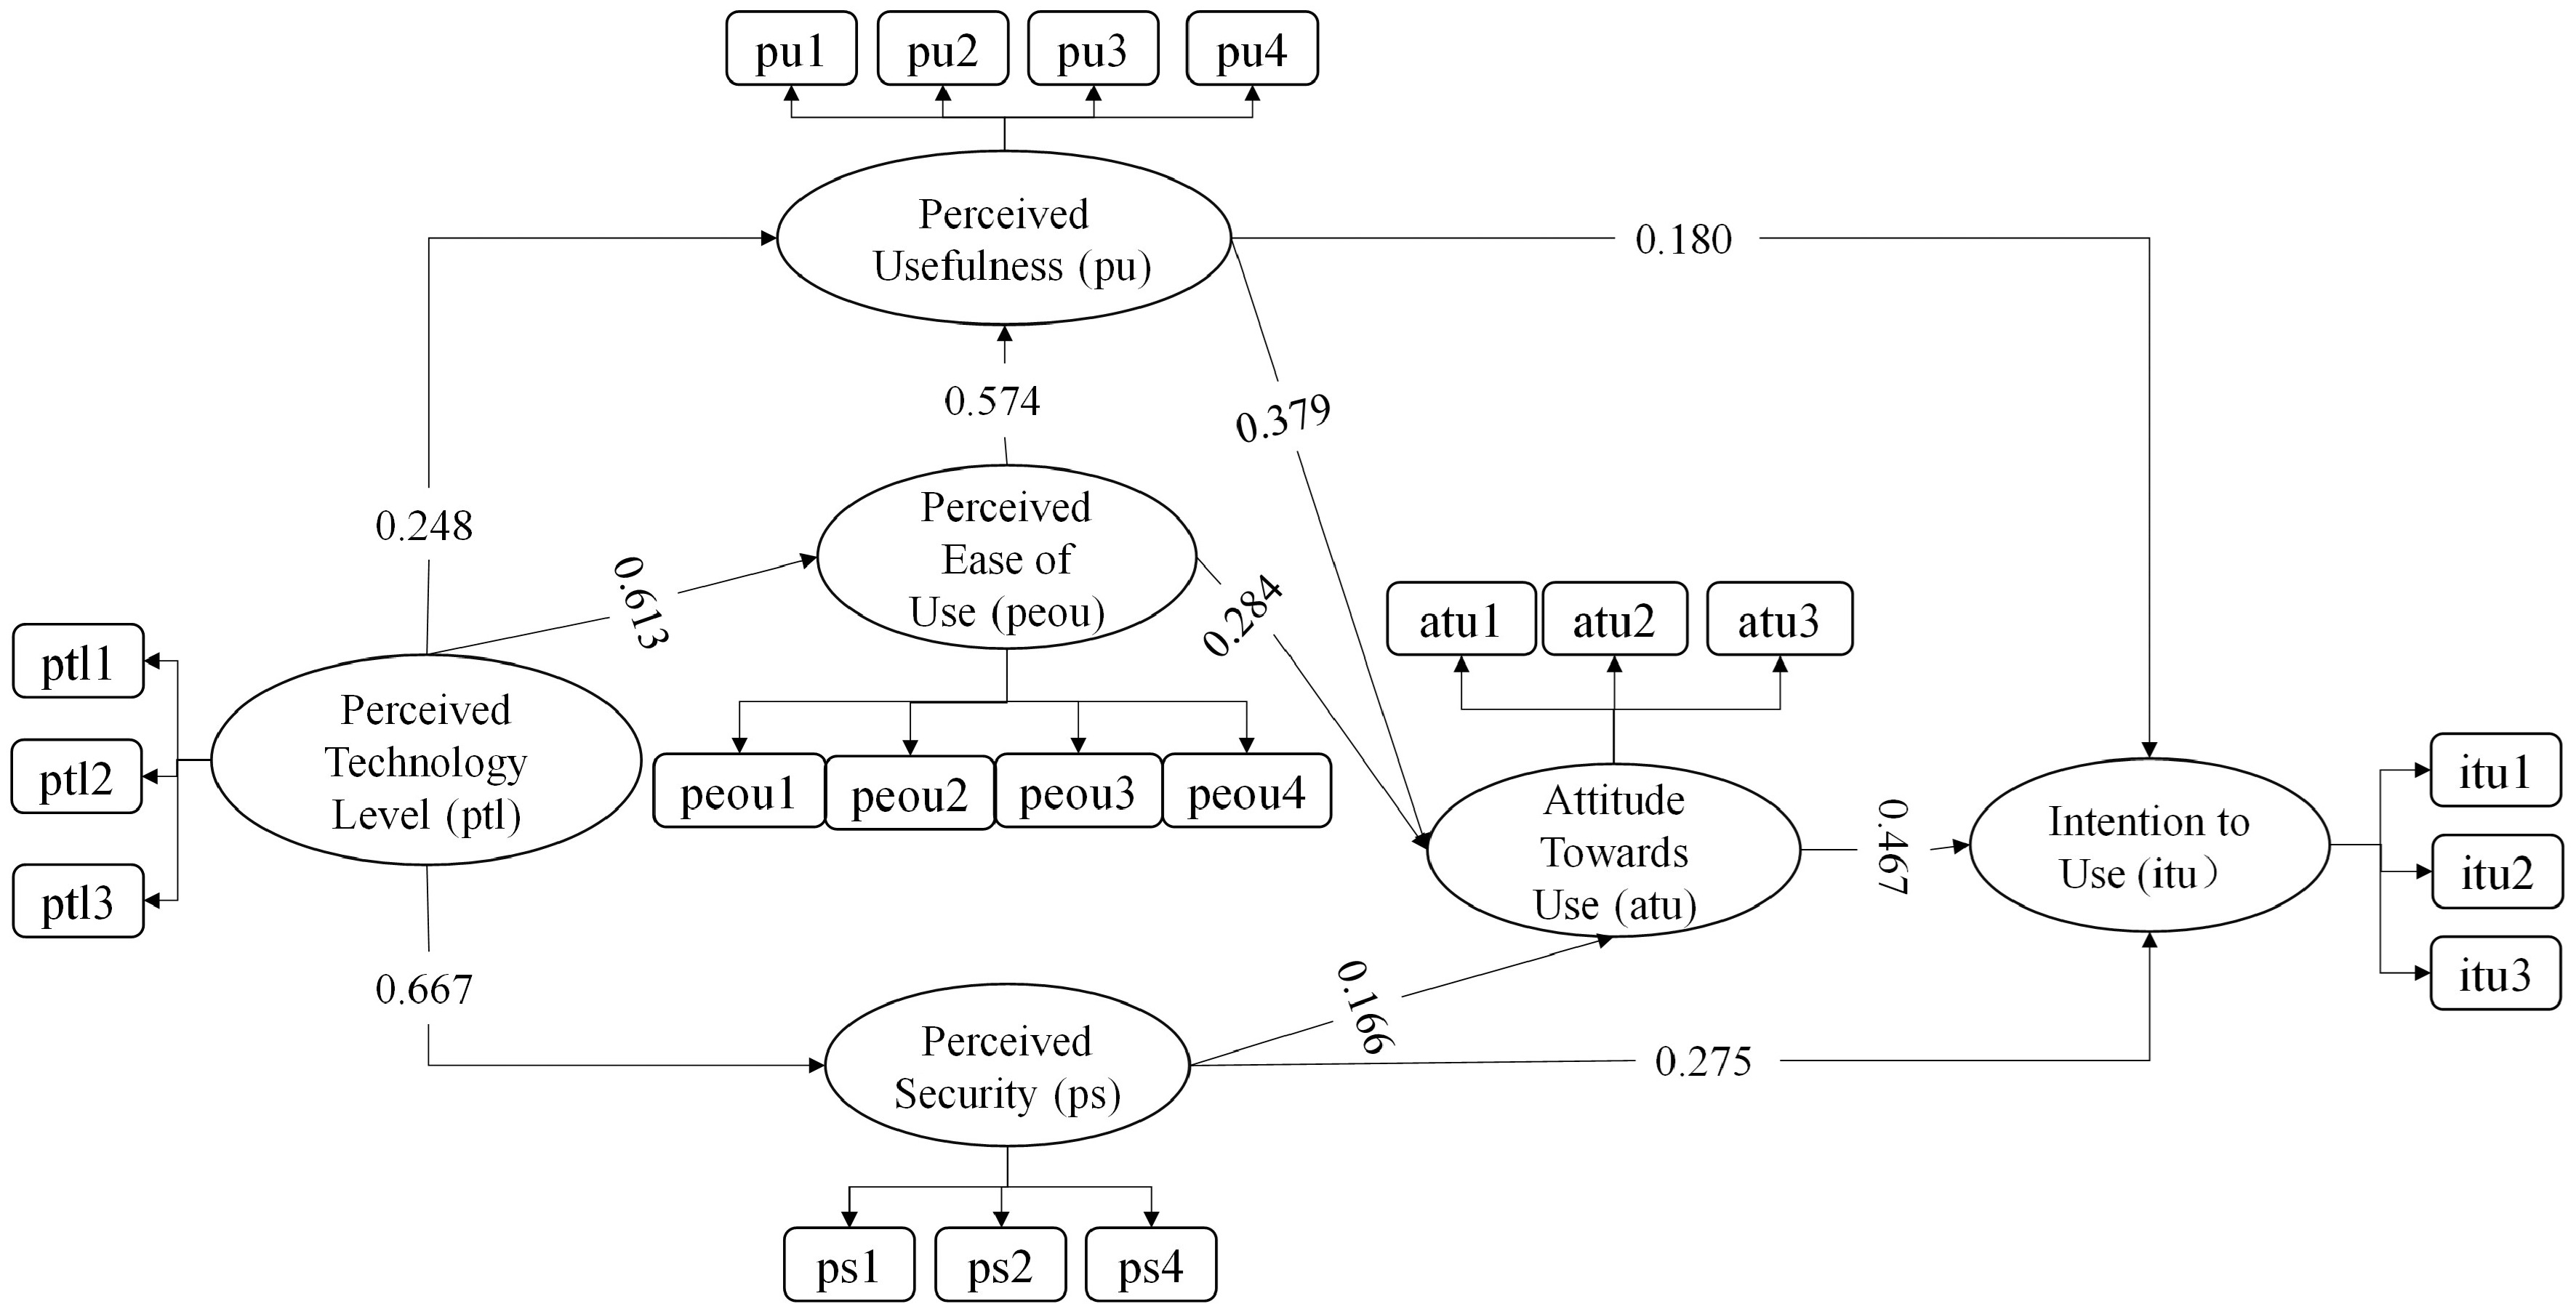
Figure 5.
The results of the path coefficients.
Mediating effects analysis
-
Note that factors like PU, PEOU, and PS are intermediate variables in the structure, which may contain mediating effects including direct effects and indirect effects. Table 9 shows the mediating coefficients of each path. Among them, the direct effects reflect the proportion of the independent variables directly affecting the dependent variables. The indirect effects reflect how the independent variables influence the dependent variables by affecting other intermediate variables. The total effect of the independent variables on the dependent variables is the sum of the direct effect coefficients and the indirect effect coefficients.
Table 9. Influence factor coefficients.
Path relationship Direct effect Indirect effect Total
affectSequence Attitude towards use → Intention to use 0.467 − 0.467 2 Perceived safety →
Intention to use0.275 0.077 0.352 4 Perceived technology level → Intention to use − 0.530 0.530 1 Perceived ease of use → Intention to use − 0.338 0.338 5 Perceived safety →
Attitude towards use0.166 − − − Perceived technology level → Perceived safety 0.667 − − − Perceived technology level → Perceived ease of use 0.613 − − − Perceived ease of use → Perceived usefulness 0.248 − − − Perceived ease of use → Attitude towards use 0.284 − − − Perceived ease of use → Perceived usefulness 0.574 − − − Perceived usefulness → Attitude towards use 0.379 − − − Perceived usefulness → Intention to use 0.180 0.177 0.357 3 As Table 9 shows, attitude towards use (total effect 0.467) had a direct effect on the intention to use, indicating that people with positive attitudes towards AD-BRT will choose to use it. Perceived usefulness (total effect 0.357) and perceived safety (total effect 0.352) both had direct effects on intention to use as well as indirect effects through attitude towards use, suggesting that people who perceive BRT as being safer or useful in their daily lives will have an attitude and intention to use it. Meanwhile, combined with path analysis, perceived technology level (total effect 0.530) and perceived ease of use (total effect 0.338) both had indirect impacts on the intention to use. These results suggest that the indirect effects do exist and about half of the effects of the original perceived technology level can be transmitted to the intention to use.
Effects of socio-economic attributes
-
Using statistical information on the attributes of the survey respondents (such as gender, age, monthly income, and education), we explored how socio-economic attributes as moderators impacted the identification of risk factors concerning the potential operation of AD-BRT.
Gender
-
The survey population was divided into two categories (male and female) according to gender, where males accounted for 45.05% and females accounted for 54.95%, and the two groups of data were relatively balanced. We enter the two groups of samples into two models separately for testing. The results of the path effects regarding the impact of gender for each group are shown in Table 10.
Table 10. Results of path effects regarding the impact of gender for each group.
Path relationships Gender p-value Standardised estimate Attitude towards use →
Intention to useMale 0.000 0.465 Female 0.000 0.445 Perceived safety →
Attitude towards useMale 0.979 −0.002 Female 0.001 0.287 Perceived safety →
Intention to useMale 0.007 0.189 Female 0.000 0.340 Perceived technology level → Perceived safety Male 0.000 0.622 Female 0.000 0.696 Perceived technology level → Perceived ease of use Male 0.000 0.562 Female 0.000 0.644 Perceived technology level → Perceived usefulness Male 0.000 0.249 Female 0.001 0.234 Perceived ease of use →
Attitude towards useMale 0.000 0.306 Female 0.002 0.227 Perceived ease of use →
Perceived usefulnessMale 0.000 0.582 Female 0.000 0.584 Perceived usefulness →
Attitude towards useMale 0.000 0.483 Female 0.000 0.333 Perceived usefulness →
Intention to useMale 0.001 0.270 Female 0.055 0.129 The results in Table 10 reveal relatively large differences in the standardised path coefficients between men and women on the path of perceived safety → attitude towards use. The p-value > 0.05 for male passengers on this path indicates that this hypothesis is rejected. Thus, the positive impacts of perceived safety on attitude towards use differ based on gender, wherein perceived safety does not positively affect attitude towards use among male passengers. This is because women have a lower risk tolerance than men. Previous studies have also shown that females have negative attitudes toward the safety of autonomous vehicles[46]. Men who choose to ride AD-BRT will not be significantly affected by concerns about its safety.
On the path of perceived usefulness → intention to use, perceived usefulness does not have a positive impact on intention to use for female passengers. This means that though female passengers recognise the usefulness of AD-BRT, they still do not use it. A study by Davis shows that the impact of perceived usefulness on intention to use is small at the beginning of new technology adoption but increases over time[11]. These results are therefore appropriate given that AD-BRT has not yet been widely introduced and that the respondents had limited experience with it.
Age
-
According to Table 5, the samples were divided into five groups according to age. However, the samples of 51−65 and 65+ age groups are too few to be used for independent calibration models. To be able to conduct the analysis of moderating variables and best balance the group size, we merged the 18−24 and 25−35 age groups, as well as the 35−50, 51−65, and 65+ age groups. In this way, differences in influence paths between the under-35 and over-35 groups can be interpreted. The path effects for each group are shown in Table 11.
Table 11. Results of path effects regarding the impact of age for each group.
Path relationship Age (year) p-value Standardised estimate Attitude towards use → Intention to use < 35 0.000 0.463 > 35 0.000 0.459 Perceived safety →
Attitude towards use< 35 0.014 0.203 > 35 0.330 0.096 Perceived safety →
Intention to use< 35 0.000 0.310 > 35 0.001 0.218 Perceived technology level → Perceived safety < 35 0.000 0.653 > 35 0.000 0.700 Perceived technology level → Perceived ease of use < 35 0.000 0.654 > 35 0.000 0.529 Perceived technology level → Perceived usefulness < 35 0.003 0.176 > 35 0.000 0.351 Perceived ease of use → Attitude towards use < 35 0.000 0.326 > 35 0.019 0.240 Perceived ease of use → Perceived usefulness < 35 0.000 0.629 > 35 0.000 0.513 Perceived usefulness → Attitude towards use < 35 0.000 0.295 > 35 0.000 0.502 Perceived usefulness → Intention to use < 35 0.000 0.296 > 35 0.069 0.127 As Table 11 shows, the path coefficients of the two groups on the path of perceived safety → attitude towards use were quite different. The 'over 35 years' group displayed a significant difference in the path of perceived safety → attitude towards use, with the test result of p-value > 0.05 indicating that this hypothesis was not accepted. Thus, perceived safety did not positively affect attitudes towards use for the 'over 35 years' group. The result suggested that passengers of the 'over 35 years' group had varied opinions considering their feeling of safety towards AD-BRT. Meanwhile, perceived usefulness did not positively influence intention to use along the pathway of perceived usefulness → intention to use for the 35+ group. Both of the perceived safety and usefulness did not significantly affect the attitude or intention to use, suggesting that controversy over AD-BRT existed in the 35+ group. They might not consider BRT as a necessary and useful transportation mode, while people under 35 years old were more sensitive.
Monthly income
-
The survey group was then merged into two groups according to the number of samples in each group in Table 5: a group with a monthly income of less than 10,000 and a group with a monthly income of more than 10,000. The group with a monthly income below 10,000 accounted for 42.22%, and the group with a monthly income above 10,000 accounted for 57.78%. The quantity of samples of the two groups of data was balanced. The impact of monthly income is shown for each group in Table 12.
Table 12. Results of path effects regarding the impact of income for each group.
Path relationship Monthly
income (CNY)p-value Standardised estimate Attitude towards use → Intention to use < 10,000 0.000 0.543 ≥ 10,000 0.000 0.395 Perceived safety →
Attitude towards use< 10,000 0.010 0.257 ≥ 10,000 0.156 0.100 Perceived safety →
Intention to use< 10,000 0.000 0.246 ≥ 10,000 0.000 0.283 Perceived technology level → Perceived safety < 10,000 0.000 0.689 ≥ 10,000 0.000 0.655 Perceived technology level → Perceived ease of use < 10,000 0.000 0.608 ≥ 10,000 0.000 0.626 Perceived technology level → Perceived usefulness < 10,000 0.001 0.239 ≥ 10,000 0.000 0.262 Perceived ease of use → Attitude towards use < 10,000 0.000 0.310 ≥ 10,000 0.002 0.254 Perceived ease of use → Perceived usefulness < 10,000 0.000 0.605 ≥ 10,000 0.000 0.545 Perceived usefulness → Attitude towards use < 10,000 0.009 0.281 ≥ 10,000 0.000 0.456 Perceived usefulness → Intention to use < 10,000 0.013 0.161 ≥ 10,000 0.004 0.220 The results in Table 12 show that the path coefficients of the two groups on the path of perceived safety → attitude towards use were quite different. The group with a monthly income of more than 10,000 displayed a significant difference in the path coefficient of perceived safety → attitude towards use. The result of this path test was p-value > 0.05, indicating that this hypothesis was not accepted. Thus, perceived safety did not positively affect the attitude towards use for the group with a monthly income of more than 10,000, suggesting that controversy over AD-BRT existed in this group. This result also implied that people in this group felt indifferent about safety to affect their attitudes. They might not necessarily take BRT considering their relatively high income.
Level of education
-
The survey group was then merged into two groups according to the number of samples in each group of level of education: a group of those with education lower than a bachelor's degree, and a group of those with a bachelor's degree or above. Considering that most respondents hold a bachelor's degree (77.36%), to balance the samples to the best, the groups were merged into lower than a bachelor's degree (11.79%, n = 50 and meets the requirement of big samples) and with a bachelor's degree or above (88.21%). The results on education effects for each group are shown in Table 13.
Table 13. Results on academic qualifications effects for each group.
Path relationship Academic qualifications p-value Standardised estimate Attitude towards use → Intention to use Lower than a bachelor's degree 0.000 0.411 Bachelor's degree and above 0.000 0.477 Perceived safety → Attitude towards use Lower than a bachelor's degree 0.710 0.084 Bachelor's degree and above 0.006 0.184 Perceived safety → Intention to use Lower than a bachelor's degree 0.164 0.204 Bachelor's degree and above 0.000 0.275 Perceived technology level → Perceived ease of use Lower than a bachelor's degree 0.000 0.723 Bachelor's degree and above 0.004 0.659 Perceived technology level → Perceived ease of use Lower than a bachelor's degree 0.000 0.716 Bachelor's degree and above 0.000 0.601 Perceived technology level → Perceptual usefulness Lower than a bachelor's degree 0.510 0.110 Bachelor's degree and above 0.000 0.261 Perceived ease of use → Attitude towards use Lower than a bachelor's degree 0.011 0.485 Bachelor's degree and above 0.000 0.255 Perceived ease of use → Perceived usefulness Lower than a bachelor's degree 0.000 0.688 Bachelor's degree and above 0.000 0.564 Perceived usefulness → Attitude towards use Lower than a bachelor's degree 0.379 0.207 Bachelor's degree and above 0.000 0.396 Perceived usefulness → Intention to use Lower than a bachelor's degree 0.042 0.316 Bachelor's degree and above 0.002 0.169 The results in Table 13 reveal huge differences in path coefficients between the two groups for the four paths of perceived safety → attitude to use, perceived safety → intention to use, perceived technology level → perceived usefulness, and perceived usefulness → attitude towards use. Moreover, the test result of p-value > 0.05 for these four paths for the group with qualifications lower than a bachelor's degree indicates that this hypothesis was not accepted. Thus, perceived safety did not positively affect attitudes towards use and intention to use, perceived technology level did not positively affect perceived usefulness, and perceived usefulness did not positively affect attitudes towards use for the group with qualifications lower than a bachelor's degree. The lower the education level, the lower the level of understanding of autonomous driving-related technologies, especially regarding the safety and technical levels of AD-BRT. Therefore, AD-BRT should be initially deployed in places with relatively high education and knowledge levels, such as colleges or high-tech parks.
-
In the proposed extended TAM (Fig. 2), the path hypotheses of H1, H2, H3, H4, and H5 are consistent with the traditional TAM (Fig. 1a). The path analysis indicates that the correlations can be explained by the traditional TAM. Furthermore, the hypotheses from H6 to H11 represent an enhanced version of TAM, which provides additional insights into factors influencing passenger attitudes. Herein, we further elaborate on the observed impacts derived from this extended model.
(1) According to the test results of path H6 and path H7 in the model, the correlation between perceived safety and attitude towards use, as well as the correlation between perceived safety and intention to use, are significant. This result is consistent with existing research on autonomous driving vehicles[17], and confirms that passengers' feeling of safety is an important factor in riding AD-BRT. Apart from these two factors, perceived usefulness is the key factor influencing attitude and intention to use, which is consistent with the viewpoint in the literature[33]. However, previous literature[31] points out that many studies consider the effect of perceived usefulness to be relatively weak. From the perspective of the model in this paper, it is very likely that the higher-level factor influencing perceived technology level has not been identified. This might also be due to the structural deficiency of the UTAUT model itself.
(2) The perceived safety is the opinions that the passengers hold towards AD-BRT but not the fact of the actual safety level of automated driving vehicles. So, increasing the level of perceived safety of passengers can result in higher intention to ride AD-BRT. Many studies tend to use trust as a key variable[16,18,31−33]. Trust is a complex and abstract concept, composed of many factors, and ultimately manifested in people's perception of safety. However, passengers' feelings of safety are not easy to control because they contain latent meaning of knowledge about and trust towards automated driving technology. Hence, we need to additionally explore other factors influencing passenger's feeling of safety.
(3) The hypothesis H11 indicates that perceived technology level influences perceived safety. If people had better knowledge of autonomous driving technology, they would have a better feeling of safety. Hence, enhancing the introduction of autonomous driving knowledge to the public will lead to a better understanding and feeling of safety. According to the test results of H8 and H9, the perceived technology level is also a significant factor that affects perceived usefulness and perceived ease of use. This is reasonable according to the literature[29] that travellers' lack of knowledge and potential perceived risks associated with bad attitudes towards using automated vehicles. If people have more knowledge about the AD-BRT, they can better perceive the usefulness of AD-BRT for their travel, and they can feel it is easy to ride an AD-BRT.
Based on the two major points summarized above, we find that people who have a higher perceived technology level of autonomous driving can better perceive its usefulness, ease of use, and safety. Thus, perceived usefulness, perceived ease of use, and perceived safety can be improved by enhancing people's knowledge level of autonomous driving technology. Improving the perceived technology level can be carried out from two aspects, one is to adopt advanced technology to AD-BRT, and the other is to educate and convince the public about the benefit of the advanced technology.
Different effects on different groups of people
-
Existing studies addressed that individual, as well as social factors should be considered, as they both affect acceptance[22]. The results of the extended TAM with deeper analysis of different socio-economic attributes of people reveal more findings that can be discussed as follows.
(1) Regarding the path of perceived safety → attitude towards use in Table 10, the path hypothesis for male passengers is not accepted. Previous studies did not report sufficient evidence that gender presents influence as a moderator. The reason may come from the safety risk affordability differences between males and females. Males' risk-bearing ability may be higher than that of females, so when male passengers choose to ride the AD-BRT, the perceived safety level will not significantly affect their attitude of use.
(2) On the path hypotheses of perceived safety → attitude towards use, the tests on the group over 35 years old and the group with a monthly income of more than 10,000 RMB are not accepted (according to Tables 11 and 12). This phenomenon implied that controversy over AD-BRT existed in both groups. For younger people, the factors impacting their attitude could be travel quality and life domain, which belong to perceived usefulness[24]. Older respondents stated a lower intention to use automated transit than their younger counterparts[33]. One possible reason can be that they had adequate knowledge about autonomous driving, lessening their safety concerns, but usefulness and ease of use show more importance. Existing studies also found that if older adults are familiar with self-driving vehicles, they are more likely to have a favourable perception of them[19]. What had not been suggested by existing works is that people of the two groups can have other significant alternative transportation modes rather than BRT, such as private car or ride-hailing, which makes safety concerns and usefulness concerns not significantly affect their attitudes towards AD-BRT. The result implied that people 35+ years old and income of 10,000+ could not be the target users of AD-BRT.
(3) The education level is the most direct attribute relating to people's knowledge about autonomous driving technology. Hence, the effects of different education groups present significant differences. Individuals with a bachelor's degree or lower educational attainment deem that perceived safety does not exert a positive influence on intention to use, perceived technology level does not contribute positively to perceived usefulness, and perceived usefulness does not have a significant impact on attitude towards use. This finding is consistent with the evidence of the previous study by Wu et al. [18]. Moreover, individuals with lower education levels demonstrate a limited understanding of autonomous driving technologies. People of lower education levels may not be the target users. Consequently, the initial deployment of AD-BRT systems should be considered in locations characterized by higher knowledge levels such as higher education institutions or high-tech parks.
Implications to promote AD-BRT
-
Based on the findings of this study, we propose the following measures for improving passenger acceptance of AD-BRT:
(1) The results of this study show that perceived safety is an important factor in determining passengers' attitudes and willingness to use. It is important for manufacturers and operators to continuously improve the level of autonomous driving technology for AD-BRT thereby improving its safety to ensure a safe feeling for passengers when riding an AD-BRT. On the other hand, autonomous driving BRT should be equipped with material that offers safety guidelines, such as safety videos and posters, to make passengers feel more at ease when riding it.
(2) The other helpful finding is that the perceived technology level of passengers is a strong factor in perceived ease of use and perceived safety. It confirmed that people's knowledge of automated driving is a key factor. The evidence that people who have higher education levels have a stronger willingness to use also hints at this argument. It was suggested that social influence and initial trust are key determinants of increasing automated driving acceptance[27]. Continuous technological improvement is the cornerstone of building initial trust for new users, although the application of autonomous driving technology needs to be gradually popularised by providing test rides to give people an understanding of autonomous driving BRT vehicles and, more importantly, to allow people to continuously experience and perceive the first-hand usefulness, ease of use, and safety of the autonomous driving technology applied to BRT systems[29].
-
This study investigated passenger acceptance of AD-BRT and identified its influencing factors. Based on the TAM, two factors – perceived technology level and perceived safety – were added to construct an acceptance model of autonomous driving BRT based on the perspective of passengers. A questionnaire was designed, and the collected data were used to conduct path and variable impact utility analyses and to examine the impact of socio-economic attributes on the model. The main results are summarised below:
(1) Perceived usefulness, attitude towards use, and perceived safety positively influence intention to use.
(2) Perceived usefulness, perceived ease of use, and perceived safety positively influence attitude towards use.
(3) Perceived technology level has a positive impact on perceived usefulness, perceived ease of use, and perceived safety.
(4) The impacts on intention to use are ranked as follows, in descending order: perceived technology level, attitude towards use, perceived usefulness, perceived safety, and perceived ease of use.
(5) Acceptance of AD-BRT varies by gender, age, education level, and monthly income. People of 35+ age, 10,000+ income, and lower education level may not be the target users of AD-BRT.
The findings based on the results above can be summarized as follows. Improving the acceptance of AD-BRT requires further development of autonomous driving technology to ensure operational safety. This can enhance positive attitudes and intention towards the use of AD-BRT. Increased publicity and awareness of AD-BRT is also essential for increasing people's willingness to use it. Providing opportunities for people to ride on autonomous driving buses before they are fully commercialised, giving them first-hand experience, may increase their acceptance of them.
However, there are still limitations in this study. First, although two rounds of survey had been conducted and 424 valid responses were retrieved, the sample size was not widely covered. The limitation of sample size also resulted in imbalanced proportions of the respondents' economic attributes, where some categories contained an insufficient number of samples. In addition, the study did not take into account the possible impact of the respondents' geographical distribution on their perceptions of autonomous driving technology, for which the places where the residents live can also influence their knowledge about AD-BRT.
In future studies, larger targeted survey samples can be designed to analyse the attitude and behaviour of residents on riding an AD-BRT. The sample set can cover variable respondents with a balanced number of samples for different demographical and geographical groups. This can help identify potential solid and precise user groups for AD-BRT and make accurate market policies for promoting AD-BRT. Based on market implications, possible strategies and measures could be developed such as free riding, price discounts, and education on autonomous driving. The effectiveness of such policies can also be tested by field investigation data during further commercial operations.
This research was funded by the National Natural Science Foundation of China (Grant No. 52002280), the Shanghai 'Science and Technology Innovation Action Plan' Soft Science Program of the Science and Technology Commission of Shanghai Municipality (Grant No. 22692194700), and sponsored by the 'Chenguang Program' supported by Shanghai Education Development Foundation and Shanghai Municipal Education Commission (Grant No. 21GCA58).
-
The authors confirm their contributions to the paper as follows: conceptualization, formal analysis: Wang L; methodology: Wang L, Fu Q, Wu Z; investigation: Shui H, Fu Q; Writing - original draft: Wang L, Shui H; visualization: Shui H; supervision, funding acquisition: Wu Z; project administration: Fu Q. All authors reviewed the results and approved the final version of the manuscript.
-
The datasets generated during and analyzed in the current study are available from the corresponding author on reasonable request.
-
The authors declare that they have no conflict of interest.
- Copyright: © 2025 by the author(s). Published by Maximum Academic Press, Fayetteville, GA. This article is an open access article distributed under Creative Commons Attribution License (CC BY 4.0), visit https://creativecommons.org/licenses/by/4.0/.
-
About this article
Cite this article
Wang L, Shui H, Wu Z, Fu Q. 2025. Investigating people's attitude toward automated driving bus rapid transit using extended technology acceptance model: a case from Shanghai, China. Digital Transportation and Safety 4(3): 148−160 doi: 10.48130/dts-0025-0011 

Investigating people's attitude toward automated driving bus rapid transit using extended technology acceptance model: a case from Shanghai, China
- Received: 30 July 2024
- Revised: 21 January 2025
- Accepted: 28 February 2025
- Published online: 28 September 2025
Abstract: Bus rapid transit (BRT) has great development potential for implementing automated driving (AD) due to its exclusive right of way. Studying public acceptance of automated driving BRT (AD-BRT) can help provide a basis for AD promotion policy. This study established an extended technology acceptance model (TAM) implemented by the partial least squares structural equation modelling (PLS-SEM) using 424 valid survey samples. The factors influencing people's intention to use AD-BRT were ranked as: perceived technology level, attitude towards use, perceived usefulness, perceived safety, and perceived ease of use. People's knowledge and understanding of automated driving is an essential basis. Respondents' socioeconomic attributes impacted acceptance of AD-BRT, significant differences were observed across genders, ages, monthly incomes (CNY) , and educational backgrounds. Different education groups also presented differences in path coefficients. The investigation implied that adopting advanced AD technology and enhancing the education of new technology are basic measures to increase the acceptance of AD-BRT.