













-
Technological innovations in the maritime industry are rapidly propelling the development of global shipping and enabling the commercial use of autonomous vessels, whether they are remotely controlled or fully autonomous[1]. In 2018, the International Maritime Organization (IMO) introduced the concept of Maritime Autonomous Surface Ships (MASS) during the 100th session of the Maritime Safety Committee (MSC). According to the IMO, MASS is defined as a ship that can operate independently of manned vessels to varying degrees and is categorized into four levels of autonomy[2]. Regarding the gradual commercialization of MASS, navigation safety issues such as path planning, risk identification, and collision avoidance have become hot topics of extensive research in recent years[3].
However, the integration of MASS with ports and how port operations will be performed on unmanned or reduced-crewed ships is another complex issue. While the use of automation or automated systems in terminal operations is common, related ship operations are still carried out with a labor-intensive approach in ports[4]. Additionally, although MASS technology has matured and been widely applied, there has been relatively little discussion on the key determinants of its commercial application in specific ports, and it has not been deeply analyzed in combination with the actual operational characteristics of the ports[5]. The Berth Allocation Problem (BAP) is a key issue in resource scheduling during port operations and a crucial link in port management. It is often integrated with other resource scheduling problems in the port, such as quay cranes, yard cranes, and shore-side electricity (SSE) facilities. An inefficient berth allocation plan can negatively impact the operational efficiency of the port, resulting in increased costs for both shipping companies and port authorities. Meanwhile, the commercialization of MASS presents new challenges for scheduling port resources, introducing additional constraints and decision-making agents. Considering the operational characteristics and requirements of MASS, it is essential to formulate berth allocation strategies and port resource scheduling plans to cope with mixed operational scenarios involving MASS and manned vessels. By addressing berth-related resource scheduling issues and examining the impact of MASS commercial operations on port activities, it is expected to become a breakthrough for studying the integration of MASS and port management as well as promoting its commercial application in ports.
Therefore, this study investigates an optimization problem related to the allocation of berths, quay cranes, SSE facilities, and terminal labor crews, considering the operational requirements of both MASS and manned vessels. To describe the mixed operational scenario, two berth allocation strategies, namely Mixed-Strategy and Separated-Strategy, are proposed. Two mixed-integer programming models are developed with the objective of minimizing the costs associated with vessel stays at the port. Additionally, we employed a novel GA + ALNS algorithm combined with Q-learning to address the large-scale cases, further verifying the accuracy of the constructed model and the effectiveness of the proposed algorithm, providing reliable theoretical models and practical guidance for port operations.
The rest of this paper is organized as follows. Firstly, we reviewed the relevant research and then discussed the details of the research problem. We described the development of two mixed-integer programming models based on two berth allocation strategies. Then we presented the GA + ALNS algorithm combined with Q-learning and the related numerical experiments. We summarized this paper and provides outlooks for future research finally.
-
As a classic problem in port resource scheduling, BAP has been extensively studied over the past two decades. Lim[6] proposed the first formulation of BAP and demonstrated that it is NP-hard. According to the berth characteristics, BAP is mainly classified into continuous, discrete, and hybrid problems[7]. The initial studies on discrete BAP were conducted by Imai et al.[8], where they presented a two-objective integer programming model. Subsequently, they presented MIP formulations for the continuous BAP and utilized meta-heuristic algorithms such as simulated annealing to solve the model[9]. Zhen[10] addressed a tactical BAP that considers the uncertainty of vessel operation times. Tang et al.[11] employed a discretization strategy to divide continuous berths into discrete segments and proposed a combined optimization model for berth allocation and quay crane assignment problems (BACAP). For terminal cooperation, Guo et al.[12] proposed an integrated berth allocation, quay crane assignment, and yard assignment problem in multiple cooperative terminals. However, in the analysis of vessel scheduling and BAP of MASS in the shipping network, only Zhang & Wang[13] and Shen et al.[14] have attempted to propose mathematical models. Zhang & Wang[13] developed a mixed-integer nonlinear programming model aimed at optimizing the arrival times of MASS and berth allocation by minimizing the total docking cost of fuel consumption and delay penalties. Meanwhile, Shen et al.[14] proposed a BAP in a mixed operational scenario involving both MASS and manned vessels. They developed two mixed-integer nonlinear programming models based on distinct berth allocation strategies.
As environmental benefits receive more attention, literature is devoted to exploring solutions to BAP considering energy-saving and low carbon emissions. Zhen et al.[15] investigated a low-carbon-oriented BACAP, considering the uncertain arrival times of vessels and their loading and unloading workloads. They proposed a two-stage stochastic programming model based on a set of scenarios. Yu et al.[16] considered the availability of green technologies and incentive policies. They proposed a bi-level framework to solve the BACAP and SSE supply, providing management suggestions for the green development and sustainable operation of the port. Wang et al.[17] attempted to address an integrated BACAP and SSE allocation based on a detailed analysis of the SSE service coverage and the carbon emissions of vessels. Yue et al.[18] developed a multi-objective optimization model to ensure port and ship benefits while improving efficiency and reducing emissions, considering key factors like SSE availability, SSE voltage, fuel prices, and call schedules.
Due to the increased hardness associated with the BAP variant, heuristic methods have been predominantly utilized in the literature. Chang et al.[19] proposed a dynamic allocation model using objective programming for berth allocation and quay crane assignments based on a rolling-horizon approach. They employed a hybrid parallel genetic algorithm combined with a parallel genetic algorithm and heuristic algorithm. Xiang et al.[20] examined the BAP with the consideration of uncertainty factors, including the arrival and operation times of the calling vessels. An adaptive grey wolf optimizer algorithm was developed to solve the proposed model. Yıldırım et al.[21] proposed a decision support system coupled with a simulation optimization module based on the swarm-based Artificial Bee Colony optimization algorithm to address BAP. Guo et al.[22] examined the influence of weather conditions and proposed a two-stage optimization method. In the first stage, they assessed vessel operation times based on weather conditions. Then they solved the BAP model in the second stage. Subsequently, an efficient particle swarm optimization algorithm embedded with a machine learning approach was devised for solving the BAP model. Martin-Iradi et al.[23] employed an adaptive large neighborhood search algorithm enhanced with a local search procedure to solve the proposed model for the multi-port continuous berth allocation problem.
The literature review presented above indicates that the BAP study, within the context of the mixed operation of manned vessels and MASS, is still in its early stages. Details are presented in Table 1.
Table 1. Literature review.
Paper BAP QCAP SSE Method Vessel type Zhang & Wang[13] √ Solver MASS Zhen et al.[15] √ √ CG Manned vessel Tang et al.[11] √ √ LNS Manned vessel Yu et al.[16] √ √ √ N-NSGA-II Manned vessel Guo et al.[12] √ √ ALNS Manned vessel Wang et al.[17] √ √ √ AICSA Manned vessel Martin-Iradi et al.[23] √ ALNS Manned vessel Yue et al.[18] √ √ NSGA-III Manned vessel Shen et al.[14] √ SA Manned vessel + MASS This study √ √ √ GA + ALNS Manned vessel + MASS -
In the context of the development of autonomous ships, this study investigates a combinatorial optimization problem related to the allocation of berths, quay cranes, SSE facilities, and terminal labor crews that considers the operational requirements of both MASS and manned vessels. The challenge lies in effectively managing limited terminal resources according to distinct operational modes and requirements of MASS and manned vessels, aiming to reduce associated economic costs from the perspectives of both port and shipping companies.
For the combinatorial optimization problem proposed in this study, it can be viewed as an extension of the BACAP as illustrated in Fig. 1.
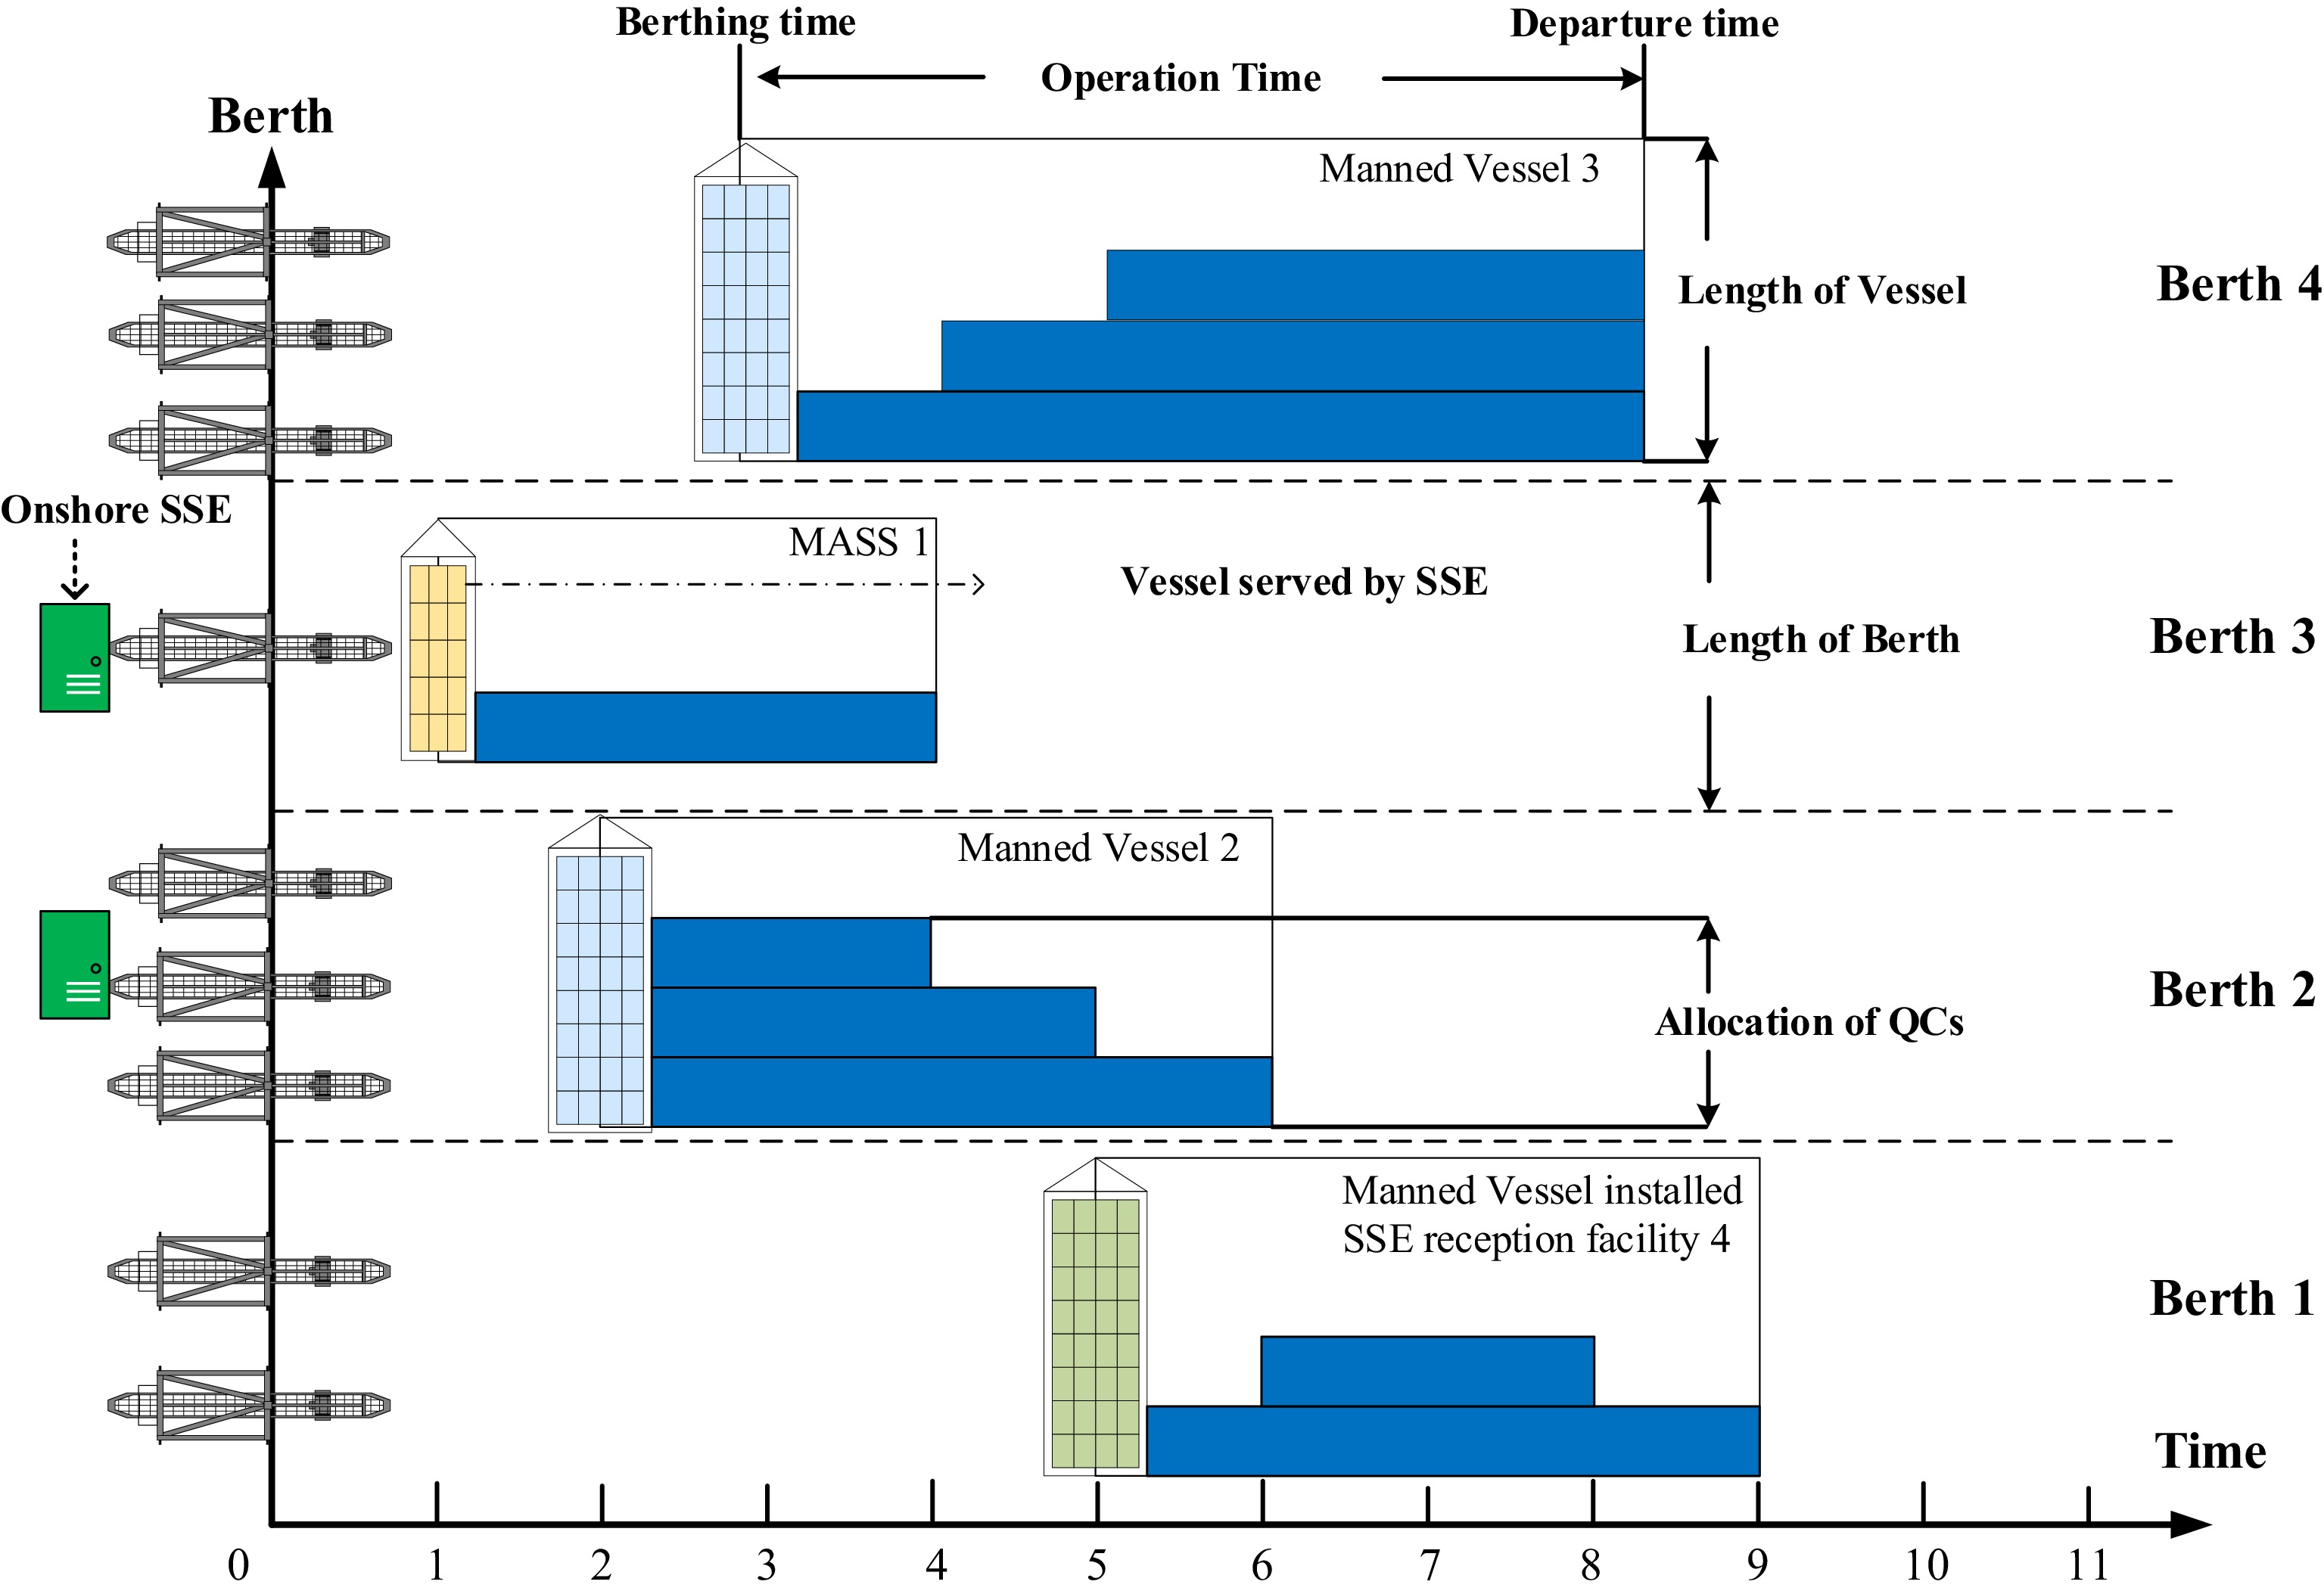
Figure 1.
Space-time diagram of BACAP with SSE allocation.
In Fig. 1, the X-axis represents the time dimension, illustrating the planning horizon of a container terminal in hours. The Y-axis represents the spatial dimension, with the terminal's shoreline divided according to actual berth numbers and lengths, measured in meters. White rectangles indicate vessel berthing positions and their corresponding berth occupation times. Blue rectangles represent quay crane assignments, with the number of cranes assigned to each vessel varying over time. The SSE facilities located at berths (indicated by green rectangles) are installed at Berths 2 and 3. Vessels at these berths equipped with SSE reception facilities can flexibly select their energy supply mode during loading and unloading, considering fuel economy, power consumption costs, and local port emission policies.
In this figure, Vessel 1 at Berth 3 can utilize SSE services during operations. However, Vessel 4, despite being equipped with an SSE reception facility, is unable to access shore power because its berth lacks the necessary infrastructure. Moreover, Vessel 2 is docked at Berth 2, which lacks an SSE reception facility, rendering the SSE facility at Berth 2 idle during the planning period. This inefficient allocation results in a waste of resources.
The operational scenario involving MASS and manned vessels
-
Figure 2 shows a discrete container terminal scene that includes vessel berthing, container handling, and the use of SSE facilities. The terminal resources here include berths, quay cranes, SSE facilities, and terminal labor crews. Vessels are classified into MASS and manned vessels based on their propulsion modes[24]. Manned vessels include diesel-powered vessels that lack SSE reception facilities, as well as those equipped with such devices. In contrast, MASSs are typically either fully electric or hybrid-powered. Their demand for SSE while docked is significantly higher than that of traditional vessels.
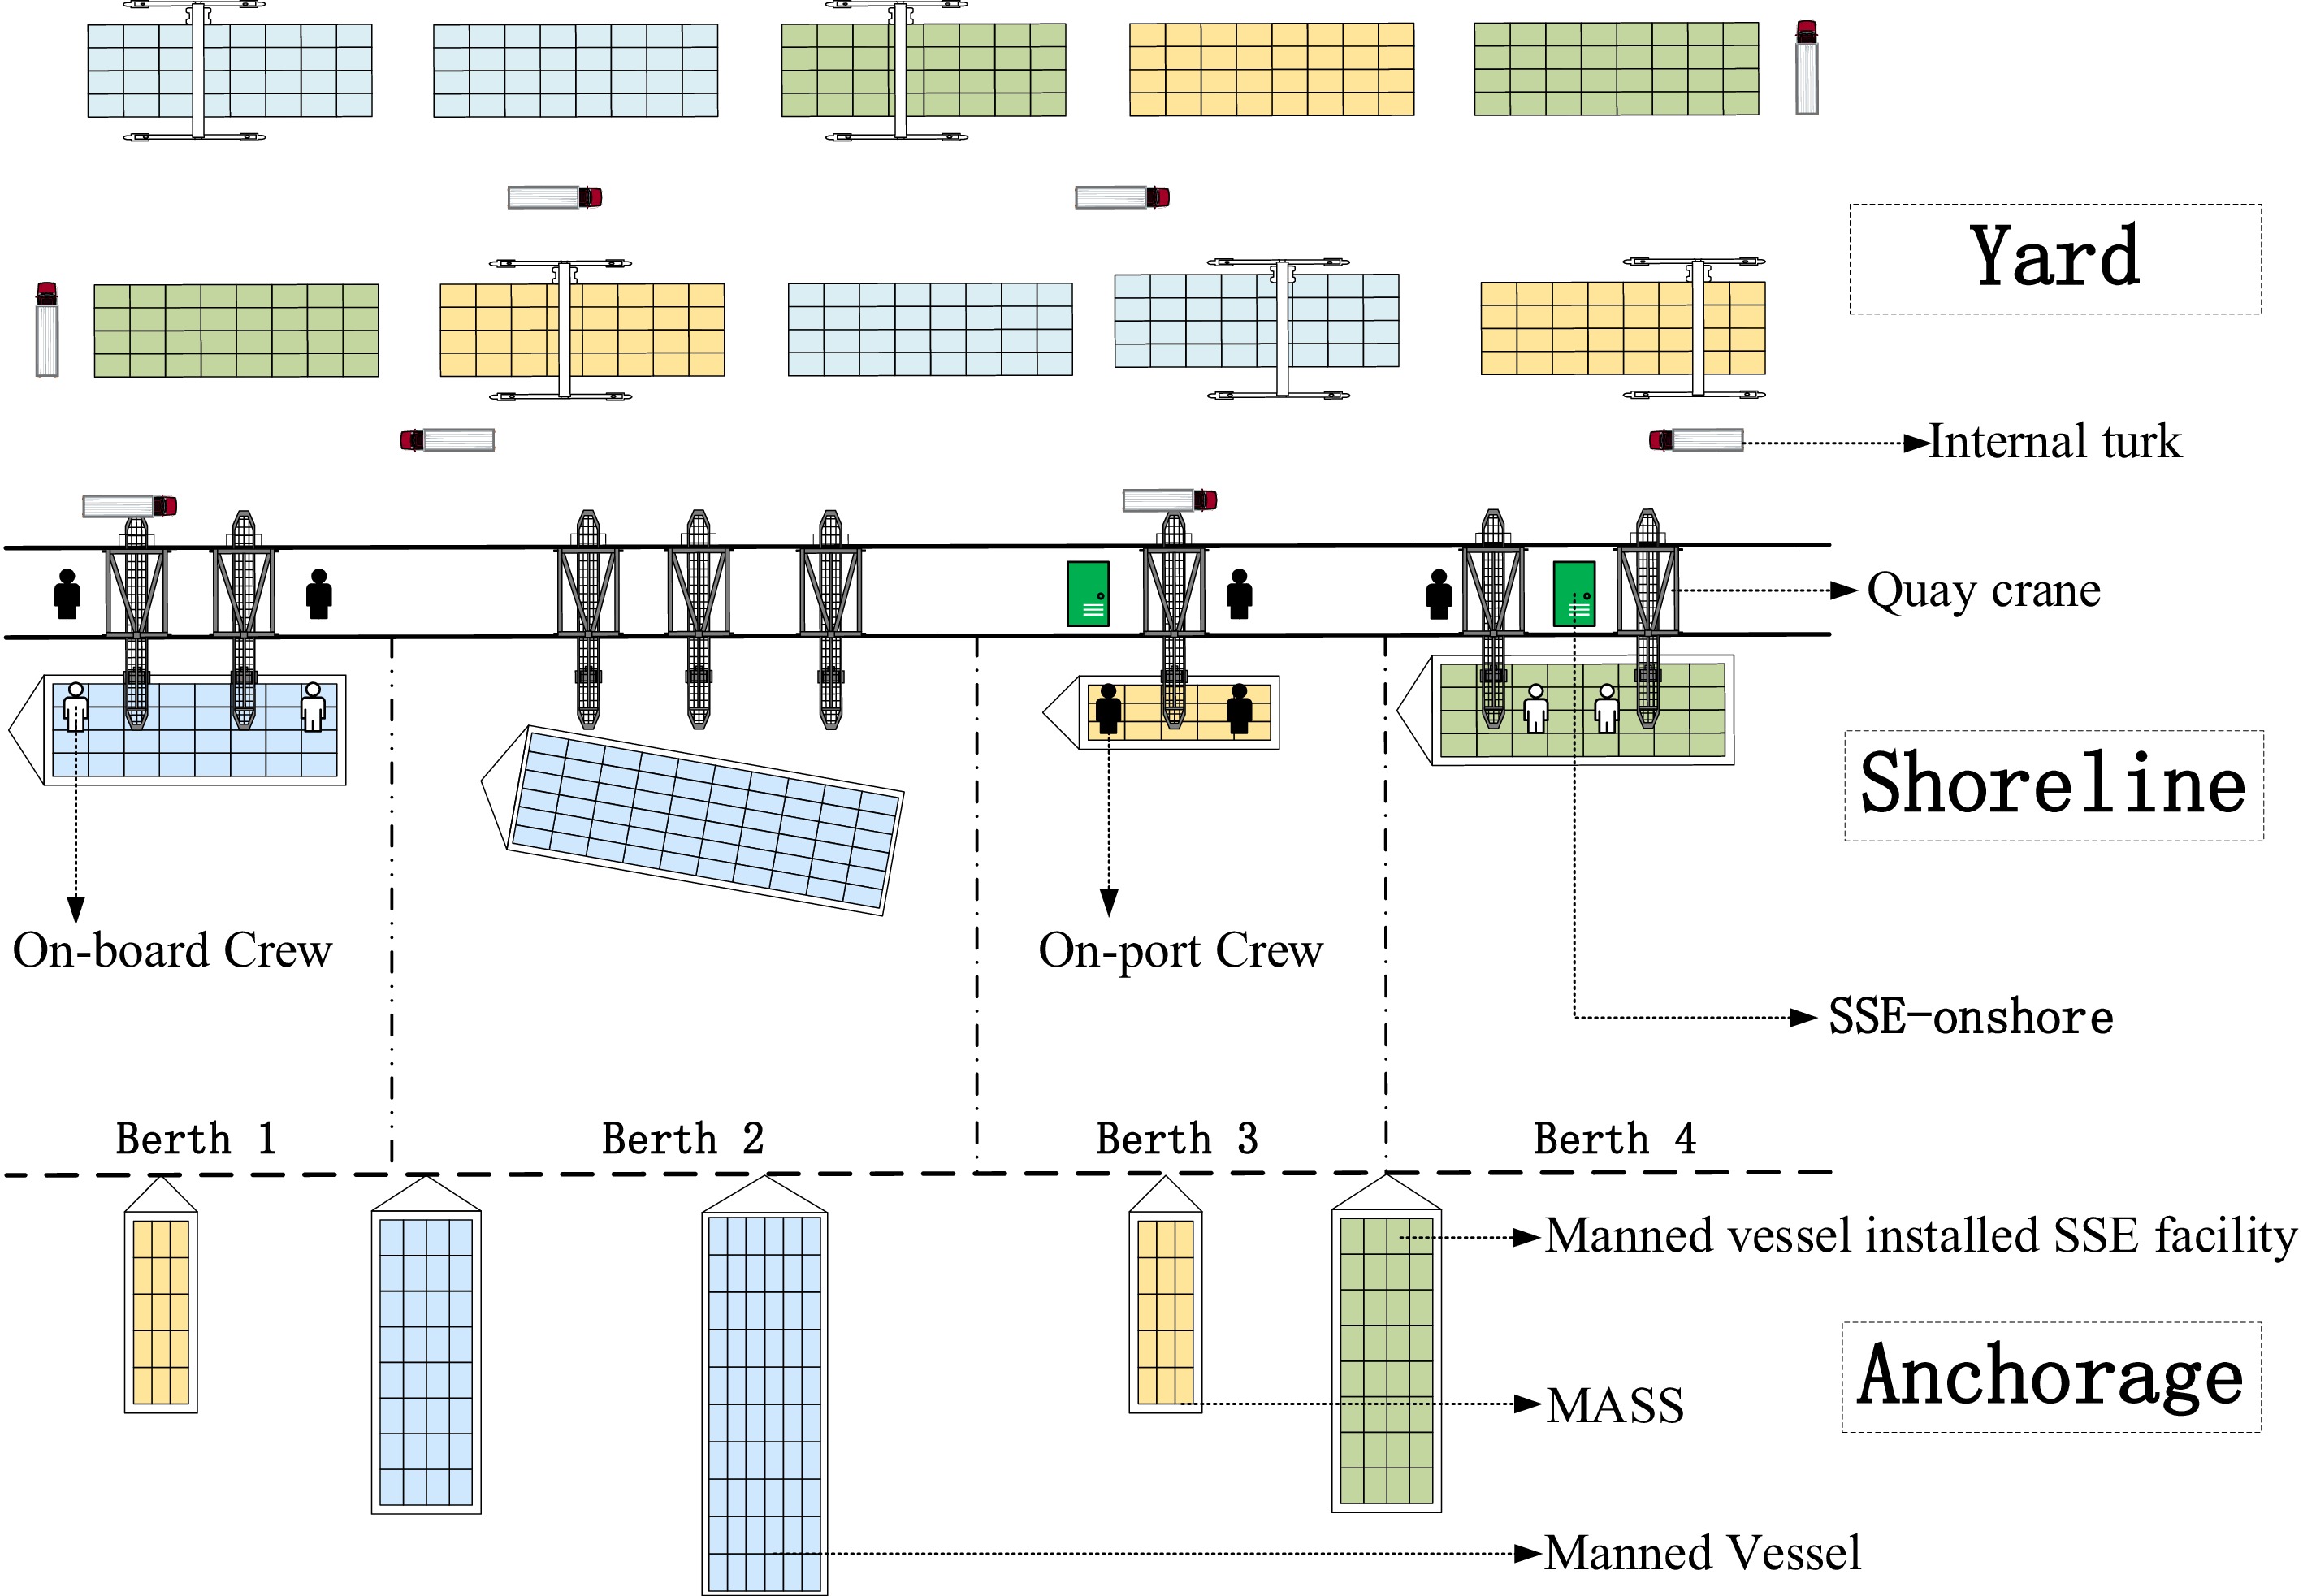
Figure 2.
Shore operations of MASS and manned vessels.
As shown in Table 2, various vessel types consume diverse energy types in different periods. When vessels equipped with SSE reception facilities dock at berths with shore power services, their auxiliary engines will remain off until departure[16].
Typically, multiple work crews are engaged in the simultaneous loading and unloading of container ships. Each crew is responsible for operating a single quay crane, which signifies the specific team's operations. In addition to a foreman who supervises the overall activities, each crew is composed of a consistent group of on-board personnel, including six to eight stevedores responsible for the loading, unloading, and stripping of containers, as well as two to three tally clerks who are assigned to manage cargo and facilitate the handover of containers[25].
Table 2. The type of energy consumed by different types of ships at different periods[26].
Vessel types Sailing Anchoring Berthing Diesel-powered vessels with SSE MEa fuel AEb fuel AE fuel/SSE Diesel-powered vessels without SSE ME fuel AE fuel AE fuel Hybrid-powered MASS ME fuel Stored electricity SSE Electric-powered MASS Stored electricity Stored electricity SSE a Main engine. b Auxiliary engines. In contrast to conventional manned vessels that operate with a complete on-board crew, MASS vessels are equipped with advanced intelligent features and hull designs that allow for a reduced crew size. Consequently, operations traditionally conducted by crew members, such as loading and unloading, cleaning, stability assessments, ballast arrangements, and various safety procedures, now necessitate a greater reliance on services provided by the port. This shift necessitates additional training for terminal labor crews to accommodate the operational requirements of MASS. Crew staffing must also be restructured. When MASS docks at container terminals with less automation for loading or unloading activities, there is an increased demand for additional labor services provided by port operators. This situation results in a need to augment the personnel within port crews, thereby incurring corresponding service fees[27].
Mixed-Strategy and Separated-Strategy
-
Compared with manned vessels, MASS have different demands on berth operation environment[13]. First, the berths need to be equipped with additional navigation aids and sensor interfaces to support the autonomous docking operations of MASS. Second, the docking berths for MASS must have comprehensive collision prevention facilities and implement remote monitoring systems[28]. Although standard port berths can accommodate the operational requirements of MASS, upgrading and renovating berth facilities is essential for enhancing efficiency and safety[29].
In order to describe the operational environment requirements for MASS at berths, this study categorizes port berths into two types: MASS-available berths and ordinary berths. Additionally, it proposes two distinct berth allocation strategies: the Mixed-Strategy and the Separated-Strategy, as illustrated in Fig. 3.
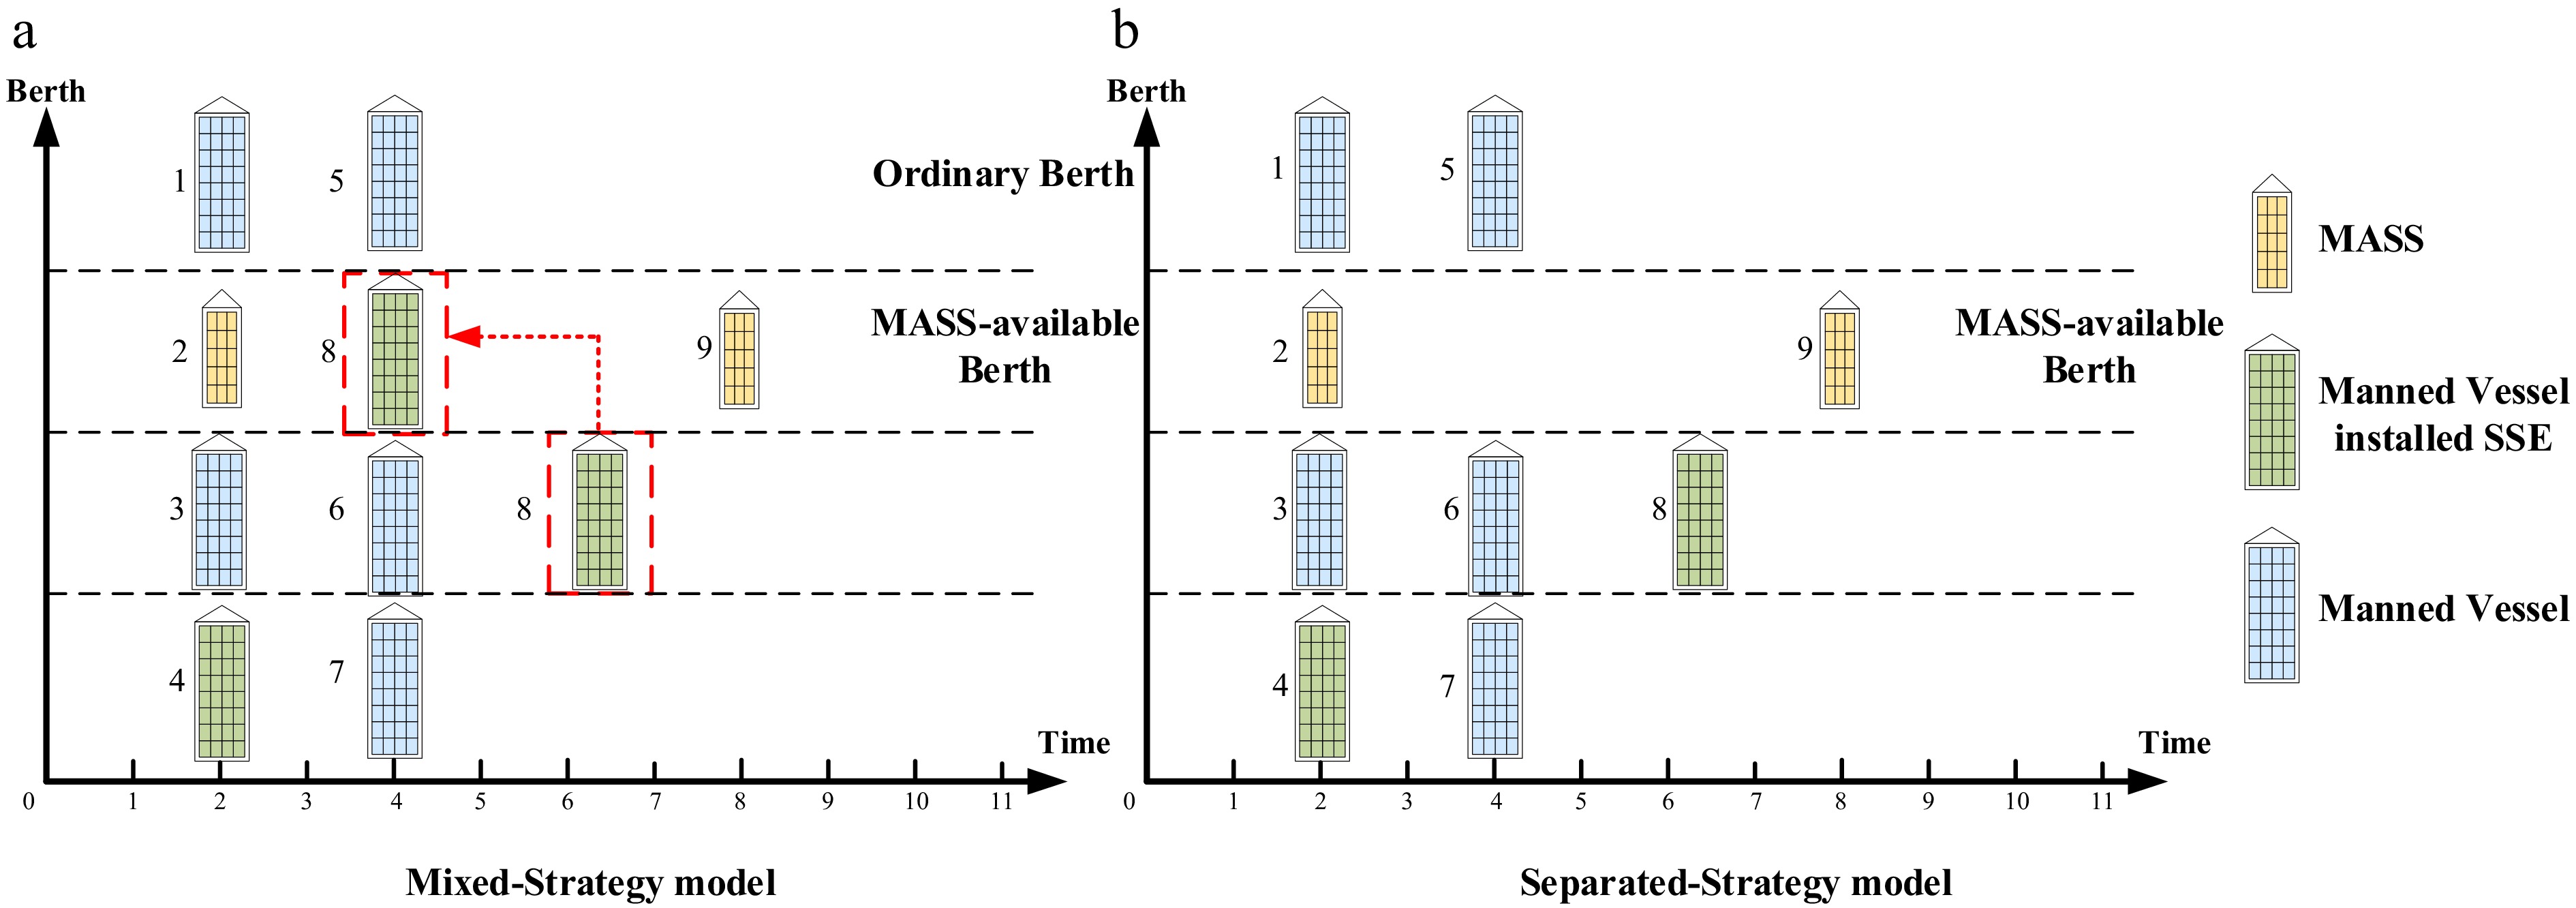
Figure 3.
Berth allocation model for Mixed-Strategy and Separated-Strategy.
The MASS-available berths can accommodate both MASS and manned vessels, while ordinary berths are only suitable for manned vessels. Under the Mixed-Strategy, MASS vessels are restricted to choosing from the available berths for docking, while manned vessels have the flexibility to dock at either type of berth. In contrast, the Separated-Strategy enforces strict berth allocation restrictions, permitting manned vessels to dock only at ordinary berths.
Cost structure
-
Consistent with previous studies, this study quantifies various costs within the model from the perspectives of both ports and shipping companies, including the costs associated with waiting and quay crane services. To accommodate delays, the model does not impose strict constraints on the time window for vessels. Instead, it reduces the turnaround time of vessels at the port by implementing penalties for delayed departures[17]. Additionally, it incorporates costs related to energy consumption and labor expenses for terminal crews to more clearly define the proposed optimization problem. To incentivize vessels to use SSE to reduce carbon emissions during their stay, the model establishes a low-carbon emission reward for vessels using shore power, setting a reward factor
$ \lambda $ -
To formulate the mathematical model of the optimization problem proposed in this study, the following assumptions are made:
(1) All vessels arrive at the port during the planning horizon with the known arrival time.
(2) Vessels start operations immediately upon berthing and depart right after loading or unloading is done.
(3) All berth water depths meet vessel draft requirements.
(4) There's no difference in loading or unloading efficiency between quay cranes, and their efficiency dynamics are not considered.
(5) The capacity of the port's electrical system can meet any vessels' SSE needs, with connection time, frequency, and voltage changes neglected.
(6) MASS needs to use SSE during berthing time.
(7) Labor personnel allocation in the terminal labor crews not involved in on-board operations is not considered.
(8) Environmental factors, such as wind speed, current speed, and other marine conditions, are known and relatively stable.
(9) Communication between vessels and the port management system is reliable, with no delays or packet losses.
Notation
-
The notation is defined as in Table 3.
Table 3. Notations of the model.
Notation Explanation Sets $ V $ The set of vessels, $ V=\left\{1,\;2,\;3,\;\cdots ,\;\left| V\right| \right\} $, where $ \left| V\right| $ is the number of vessels, $ i\in V $ $ B $ The set of berths, $ B=\left\{1,2,3,\cdots ,\left| B\right| \right\} $, where $ \left| B\right| $ is the number of berths, $ b\in B $ $ Q $ The set of QCs, $ Q=\left\{1,2,3,\cdots ,\left| Q\right| \right\} $, where $ \left| Q\right| $ is the number of QCs, $ q\in Q $ $ T $ The set of time units, $ T=\left\{1,2,3,\cdots \left| T\right| \right\} $, where $ \left| T\right| $is the planning horizon, $ t\in T $ Parameters $ {C}_{1} $ Unit cost of waiting berth at anchorage $ {C}_{2} $ Unit cost of using the quay cranes $ {C}_{3} $ The SSE unit price $ {C}_{4} $ The fuel oil unit price $ {C}_{5} $ Unit cost of delay penalty $ {C}_{6} $ Labor cost per unit time $ \lambda $ Reward factor of using SSE service during berthing $ {L}_{i} $ Length of vessel $ i $ $ {L}_{b} $ Length of berth $ b $ $ {A}_{i} $ Arrival time of vessel $ i $ $ {K}_{i} $ Number of loading or unloading containers of vessel $ i $ $ {D}_{i} $ The expected departure time of vessel $ i $ $ q_{\mathrm{i}}^{\min } $ Minimum number of quay cranes assigned to vessel $ i $ $ q_{i}^{\max } $ Maximum number of quay cranes assigned to vessel $ i $ $ \eta $ Speed of quay cranes $ {E}_{i} $ Auxiliary engine power of vessel $ i $ $ {N}^{s} $ The total number of terminal stevedores $ {N}^{c} $ The total number of terminal tally clerks $ Crew_{s}^{mass} $ The number of stevedores in each crew assigned to MASS $ Crew_{c}^{mass} $ The number of tally clerks in each crew assigned to MASS $ Crew_{s}^{m} $ The number of stevedores in each crew assigned to manned vessel $ Crew_{c}^{m} $ The number of tally clerks in each crew assigned to manned vessel $ M $ A large positive number Auxiliary variables $ Eq{v}_{i} $ Binary, 1 if vessel $ i $ is adapted to SSE supplied, else 0 $ Eq{v}_{b} $ Binary, 1 if berth $ b $ is equipped with SSE, else 0 $ M{A}_{i} $ Binary, 1 if vessel $ i $ is MASS, else 0 $ B_{b}^{mass} $ Binary, 1 if berth $ b $ is MASS available berth, else 0 Decision variables $ {S}_{i} $ Berthing time of vessel $ i $ $ {P}_{i} $ Berth allocated to vessel $ i $ $ {d}_{i} $ Departure time of vessel $ i $ $ W_{itq}^{s} $ Integer, allocate the number of stevedores of
quay crane $ q $ for vessel $ i $ at time $ t $$ W_{itq}^{c} $ Integer, allocate the number of tally clerks of
quay crane $ q $ for vessel $ i $ at time $ t $$ {O}_{i} $ Binary, 1 if vessel $ i $ uses SSE during the berthing time, else 0 $ {X}_{itb} $ Binary, 1 if vessel $ i $ is allocated to berth $ b $ at time $ t $, else 0 $ {Y}_{itq} $ Binary, 1 if quay crane $ q $ is assigned to vessel $ i $ at time $ t $, else 0 $ {Z}_{ijb} $ Binary, 1 if vessel $ i $ and vessel $ j $ are allocated to the same berth $ b $ and vessel $ j $ is served after vessel $ i $, else 0 Mathematical model
-
Based on the problem description and assumptions, and in line with previous related studies, a mixed-integer nonlinear programming model under the Mixed-Strategy is proposed to minimize the various costs incurred during the period that vessels are laid up in port.
$ \min {f}_{1}+{f}_{2}+{f}_{3}+{f}_{4}+{f}_{5} $ (1) $ {f}_{1}=\sum \limits_{i\in V}{C}_{1}({S}_{i}-{A}_{i}) $ (2) $ {f}_{2}=\sum \limits_{i\in V}\sum \limits_{t\in T}\sum \limits_{q\in Q}{C}_{2}{Y}_{itq}(1-\lambda {O}_{i}) $ (3) $ {f}_{3}=\sum \limits_{i\in V}[{E}_{i}{O}_{i}({C}_{3}-{C}_{4})({d}_{i}-{S}_{i})+{E}_{i}{C}_{4}({d}_{i}-{S}_{i})+{E}_{i}{C}_{4}(1-M{A}_{i})({S}_{i}-{A}_{i})] $ (4) $ {f}_{4}={\sum \limits_{i\in V}{C}_{5}({d}_{i}-{D}_{i})}^+ $ (5) $ {f}_{5}={C}_{6}\sum \limits_{i\in V}\sum \limits_{t\in T}\sum \limits_{q\in Q}(W_{itq}^{s}+W_{itq}^{c}) $ (6) Objectives (1)−(6) aimed to minimize the vessels waiting cost, quay crane service cost, vessels energy consumption cost, terminal crews labor cost, and delay penalty.
Subject to:
$ {S}_{i}\geq {A}_{i} \;\;\;\;\forall i\in V $ (7) $ {d}_{i}\geq {S}_{i}+\sum \limits_{t\in T}\sum \limits_{q=q_{\mathrm{i}}^{\min }}^{q_{i}^{\max }}{Y}_{itq}\;\;\;\;\forall i\in V $ (8) $ {S}_{i}=\sum \limits_{t\in T}\sum \limits_{b\in B}t{X}_{itb}\;\;\;\;\forall i\in V $ (9) $ {P}_{i}=\sum \limits_{t\in T}\sum \limits_{b\in B}b{X}_{itb}\;\;\;\;\forall i\in V $ (10) $ \sum \limits_{t\in T}\sum \limits_{b\in B}{X}_{itb}=1\;\;\;\;\forall i\in V $ (11) $ \sum \limits_{t\in T}\sum \limits_{b\in B}B_{b}^{mass}{X}_{itb}=1\;\;\;\;\forall i\in V\;\;\;\;\text{s.t.}\;M{A}_{i}=1 $ (12) $ \sum \limits_{t\in T}{X}_{itb}=0\;\;\;\;\forall i\in V\;\;\;\;\text{s.t.}\;M{A}_{i}=1,\;\forall b\in B\;\;\text{s.t.}\;Eq{b}_{b}=0 $ (13) $ \sum \limits_{i\in V}{X}_{itb}\leq 1\;\;\;\;\forall t\in T,\;\;\forall b\in B $ (14) $ {X}_{itb}{l}_{i}\leq {L}_{b}\;\;\;\;\forall i\in V,\;\;\forall t\in T,\;\;\forall b\in B $ (15) $ {O}_{i}=1\;\;\;\;\forall i\in V\;\;\text{s.t.}\;M{A}_{i}=1 $ (16) $ \sum \limits_{t\in T}\sum \limits_{b\in B}Eq{b}_{b}{X}_{itb}\geq {O}_{i}\;\;\;\;\forall i\in V $ (17) $ {O}_{i}\leq Eq{v}_{i}\;\;\;\;\forall i\in V $ (18) $ Eq{v}_{i}-\sum \limits_{t\in T}\sum \limits_{b\in B}Eq{b}_{b}{X}_{itb}\leq M(1-{O}_{i})\;\;\;\;\forall i\in V $ (19) $ {d}_{i}\leq {S}_{j}+M\left(1-{Z}_{ijb}\right)\;\;\;\;\forall i,\;j\in V,\;i\neq j,\;\forall b\in B $ (20) $ \sum \limits_{i\in V}{Y}_{itq}\leq 1\;\;\;\;\forall t\in T,\;\forall q\in Q $ (21) $ \sum \limits_{i\in V}\sum \limits_{q=q_{\mathrm{i}}^{\min }}^{q_{i}^{\max }}{Y}_{itq}\leq \left| Q\right|\;\;\;\; \forall t\in T $ (22) $ q_{i}^{\min }{Y}_{itq}\leq \sum \limits_{q=q_{\mathrm{i}}^{\min }}^{q_{i}^{\max }}{Y}_{itq}\leq q_{i}^{\max }{Y}_{itq}\;\;\;\;\forall i\in V,\;\forall t\in T $ (23) $ {Y}_{itq}+{Y}_{jtq}\leq 1\;\;\;\;\forall i,\;j\in V,\;i\neq j,\;\forall t\in T,\;\forall q\in Q $ (24) $ \sum \limits_{t\in T}\sum \limits_{q=q_{\mathrm{i}}^{\min }}^{q_{i}^{\max }}{Y}_{itq}\eta \geq {K}_{i}\;\;\;\;\forall i\in V $ (25) $ W_{itq}^{s}=\left\{\begin{aligned} & Crew_{s}^{mass}{Y}_{itq}&&{\mathrm{if}}\;\;m{a}_{i}=1&\\ &Crew_{s}^{other}{Y}_{itq}&&{\mathrm{if}}\;\;m{a}_{i}=0& \end{aligned}\right. \forall i\in V,\;\forall t\in T,\;\forall q\in Q $ (26) $ W_{itq}^{c}=\left\{\begin{aligned} &Crew_{c}^{mass}{Y}_{itq}&&{\text{if}}\;\;m{a}_{i}=1&\\ &Crew_{c}^{other}{Y}_{itq}&&{\text{if}}\;\;m{a}_{i}=0& \end{aligned}\right. \forall i\in V,\;\forall t\in T,\;\forall q\in Q $ (27) $ \sum \limits_{i\in V}\sum \limits_{q\in Q}W_{itq}^{s}\leq {N}^{s}\;\;\;\;\forall t\in T $ (28) $ \sum \limits_{i\in V}\sum \limits_{q\in Q}W_{itq}^{c}\leq {N}^{c}\;\;\;\;\forall t\in T $ (29) $ (t+1)\sum \limits_{q=q_{\mathrm{i}}^{\min }}^{q_{i}^{\max }}{Y}_{itq}\leq {d}_{i}\;\;\;\;\forall i\in V,\;\forall t\in T $ (30) $ t\sum \limits_{q=q_{\mathrm{i}}^{\min }}^{q_{i}^{\max }}{Y}_{itq}+T(1-\sum \limits_{q=q_{i}^{\min }}^{q_{i}^{\max }}{Y}_{itq})\geq {S}_{\mathrm{i}}\;\;\;\;\forall i\in V,\;\forall t\in T $ (31) $ {P}_{i}\in B,\;\;\forall i\in V $ (32) $ {X}_{itb},{Y}_{itq},{Z}_{ijb,}{O}_{i}\in \left\{0,1\right\}\;\;\;\;\forall i,\;j\in V,\;t\in T,\;b\in B,\;q\in Q $ (33) Constraints (7) and (8) describe the berthing time and departure time limits of the vessel. Constraints (9) and (10) are used to determine the berthing time and berthing position of the vessel. Constraints (11)−(15) are the constraints related to berth allocation. Especially, constraint (12) and constraint (13) meet the berthing requirements of MASS. Constraints (16)−(19) allocate SSE usage and impose constraints on SSE usage conditions. For instance, SSE usage must be matched with SSE facilities at berths and also with the SSE reception facilities on board. Constraint (20) specifies the berthing sequence of vessels at the same berth, ensuring no berth conflicts occur during berth allocation. Constraints (20)−(24) describe the quay crane assignment. They ensure that the allocated number is within the capacity limit and avoid conflicts and crossing in quay crane assignment. Constraint (25) ensures that the quay cranes' operation time meets the vessel's loading and unloading requirements. Constraints (26)−(29) allocate the required number of stevedores and tally clerks for quay crane handling crews based on vessel types and impose quantity restrictions. Constraints (30) and (31) describe the time continuity of quay crane operations, which specifies the relationship between the time of quay crane operations and the berthing and departure time of vessels.
Under the Separated-Strategy, manned vessels can only berth at general berths. Thus, the optimization model of the Separated-Strategy should add new constraint (34) to strictly restrict berth allocation compared with Mixed-Strategy model.
$ \sum \limits_{t\in T}{X}_{itb}=0\;\;\;\;\forall i\in V,\;\forall b\in B\;\;\;\text{s.t.}\;\;M{A}_{i}=0,\;B_{b}^{mass}=1 $ (34) By introducing constraint (34), the berth allocation of MASS and manned vessels is strictly separated: MASS can only dock at MASS-available berths, while manned vessels are restricted to general berths.
-
As demonstrated in Appendix A, the problem under consideration can be classified as an NP-hard problem. Due to the NP-hard nature, commercial solvers such as Gurobi become impractical for large-scale cases, and exact algorithms often struggle to obtain optimal solutions within a reasonable timeframe. Therefore, we have designed a GA + ALNS algorithm combined with Q-learning, which integrates the global search ability of the genetic algorithm and the local search capability of the adaptive large neighborhood search. The flowchart of the algorithm is presented in Fig. 4.
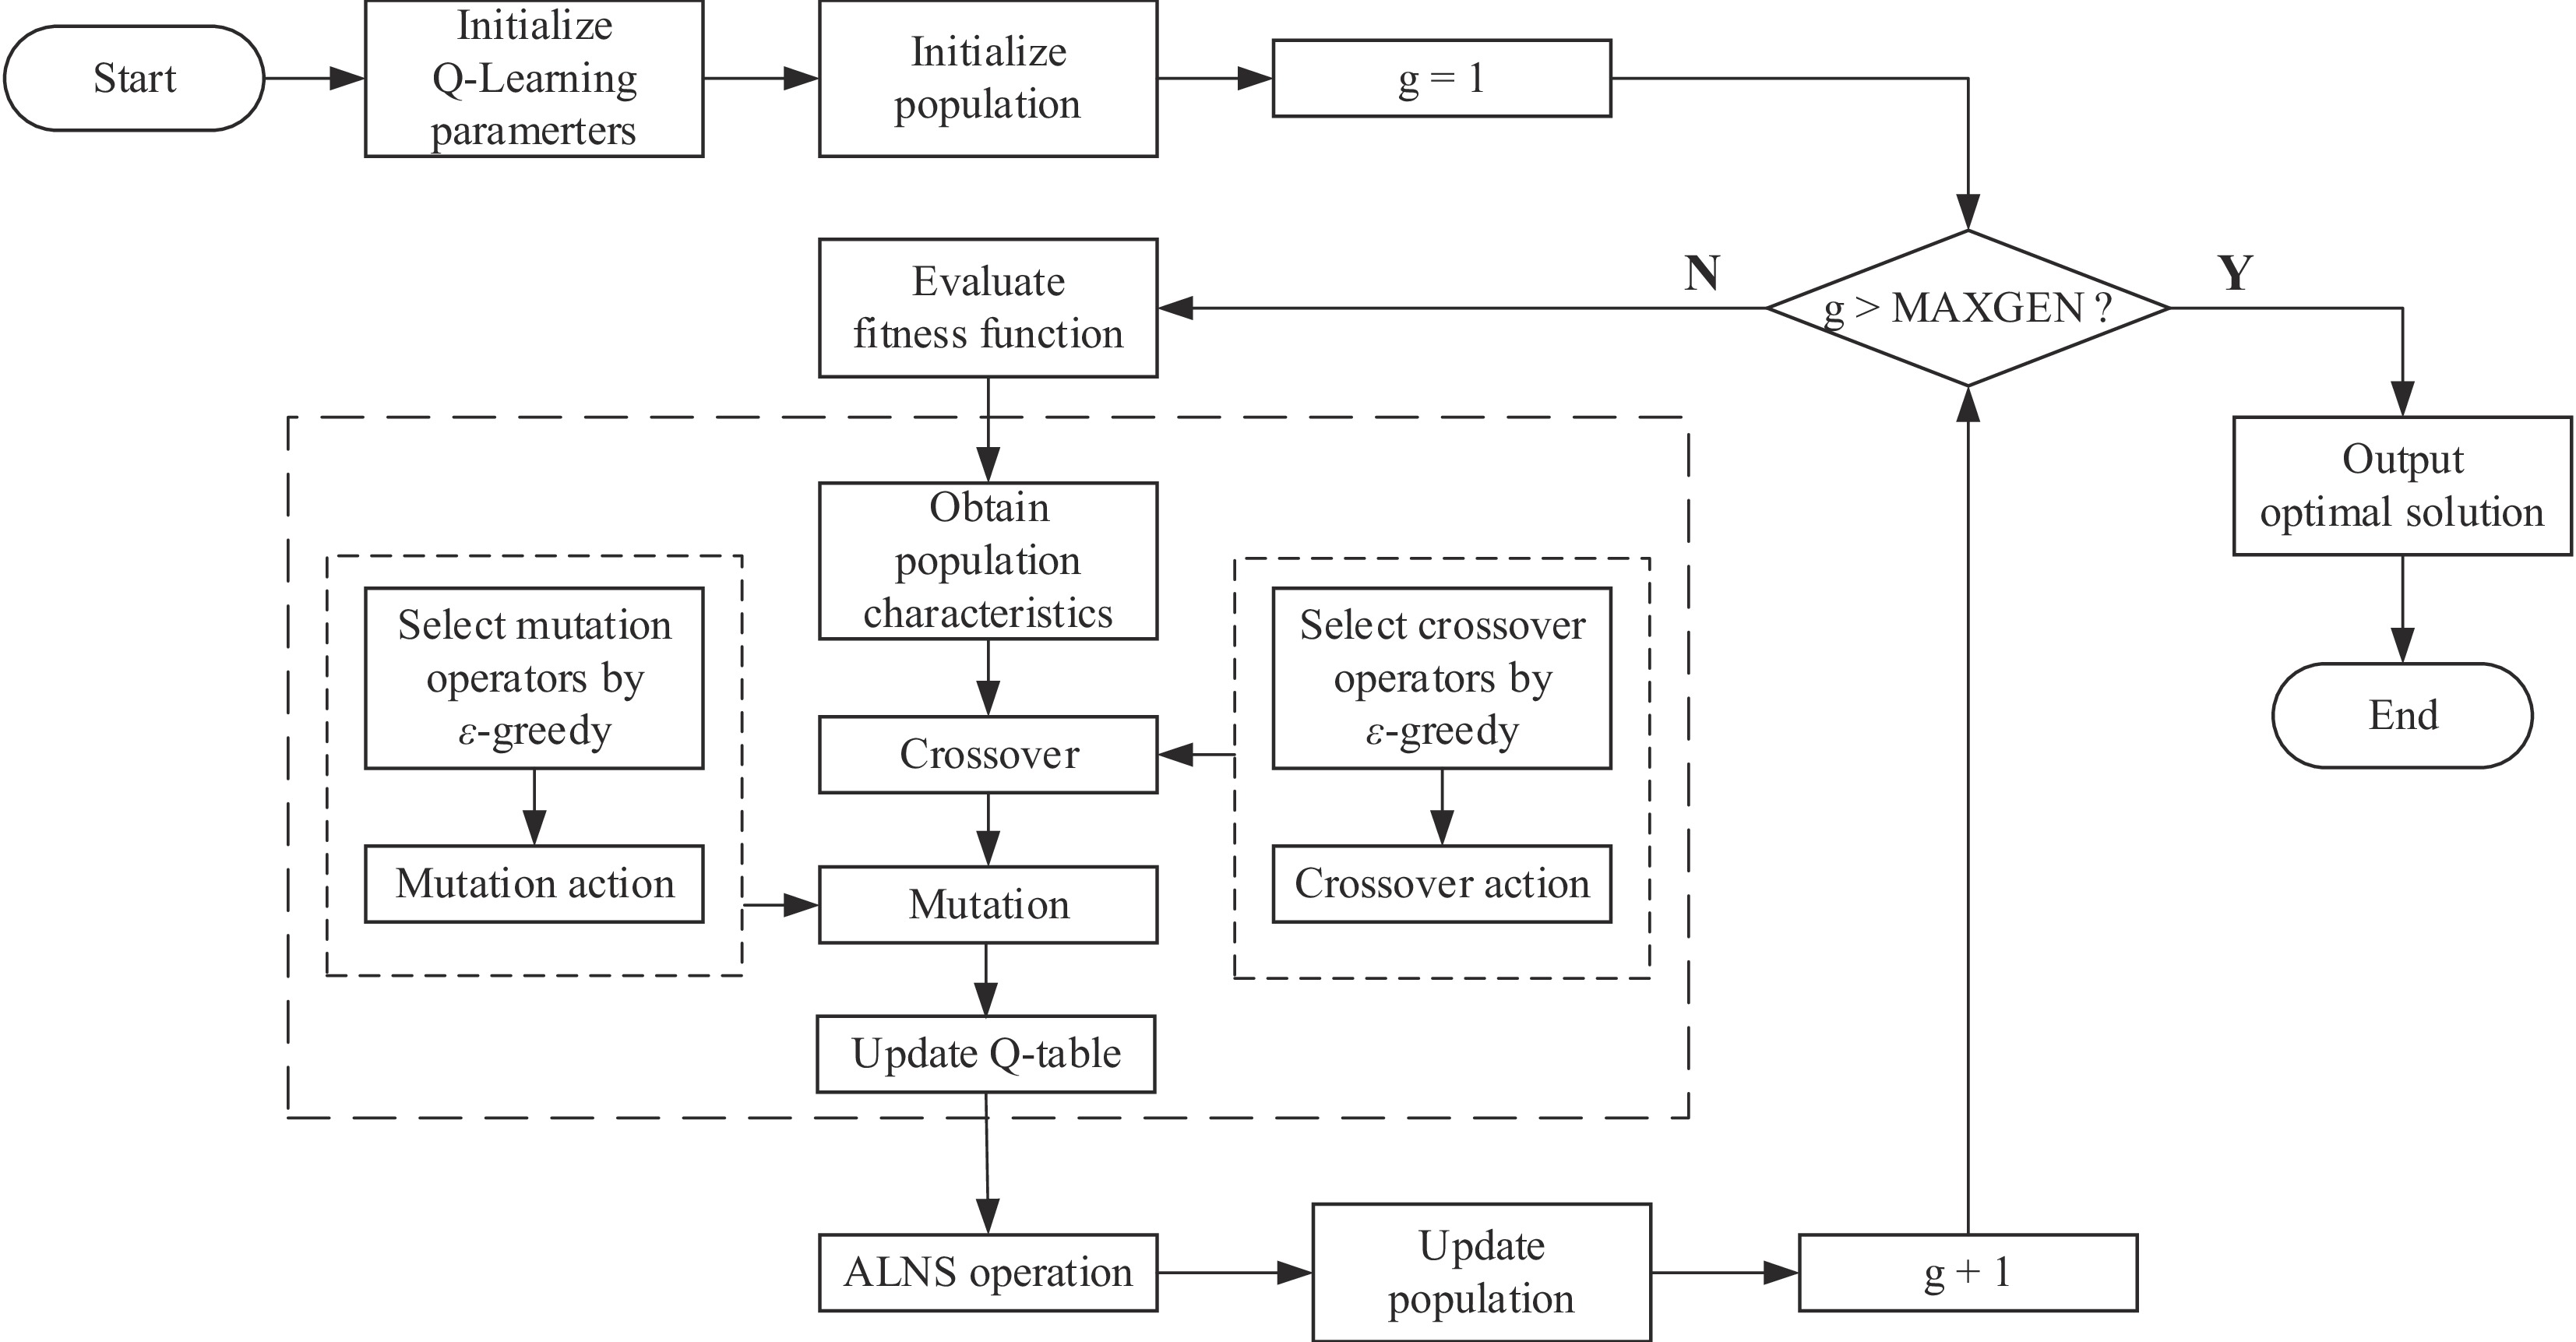
Figure 4.
The flowchart of the GA + ALNS algorithm combined with Q-learning.
In the genetic algorithm part, an elitist preservation strategy is designed to ensure excellent individuals are carried over to the next generation. Q-learning is incorporated to harness the robust learning capabilities of reinforcement learning algorithms. This enhancement improves the selection of crossover and mutation operations within genetic algorithms, optimizes the algorithm's search direction, and reduces both iteration counts and computation time. Additionally, the ALNS operator is integrated after the genetic operations to improve the local search capability of the offspring. The pseudocodes for all algorithms are provided in Appendix B.
Encoding and decoding
-
To enhance the efficiency of the solution, an intuitive real number coding method was employed. In this approach, each chromosome represents a comprehensive vessel scheduling plan and consists of multiple genes. Each gene corresponds to the scheduling arrangements of a vessel. Ultimately, each chromosome is structured as a two-dimensional cell array.
Figure 5 illustrates a scheduling plan for three vessels. The chromosome is decoded as follows:
Vessel 0 berths at berth 0 at time 10, uses 2 quay cranes, and accepts SSE service.
Vessel 1 berths at berth 1 at time 15, uses 3 quay cranes, and does not accept SSE service.
Vessel 2 berths at berth 2 at time 20, uses 2 quay cranes, and accepts SSE service.
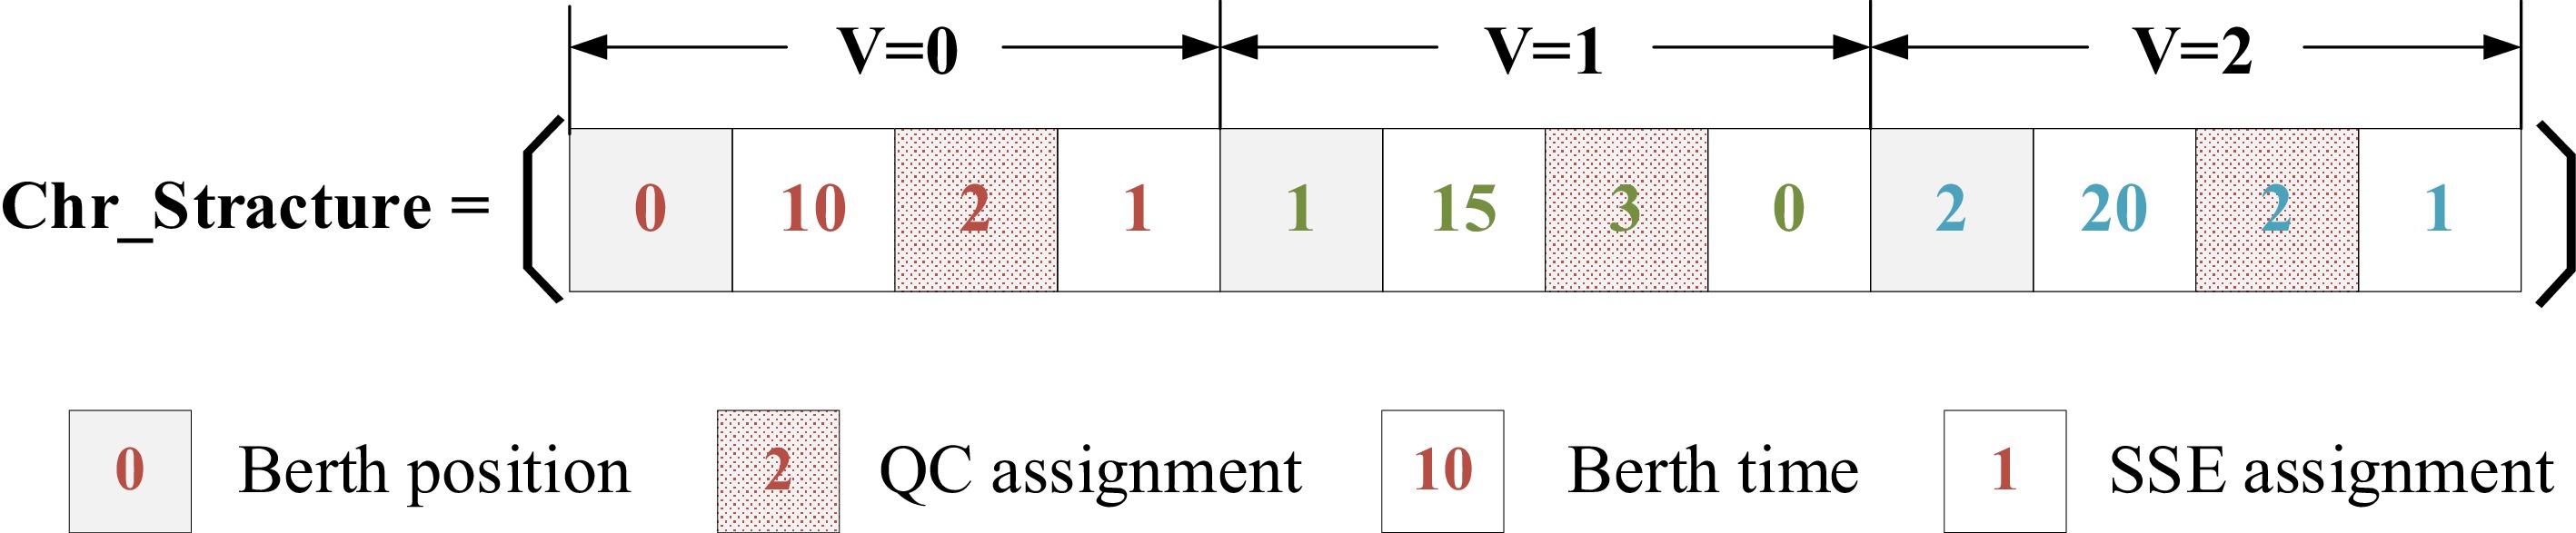
Figure 5.
The example of chromosome structure.
Population initialization
-
In generating the initial population, we utilize a strategy that ensures both diversity and quality. This involves a combination of a random population generation strategy and an individual repair strategy that adheres to time logic and resource constraints. The specific steps are as follows:
(1) Randomly select a vessel, allocate a berth and quay crane to it, compute its service time, and remove the vessel from the list to avoid repeated allocation.
(2) Based on the SSE facilities of the vessel and berth, randomly decide whether the vessel uses SSE.
(3) Repair the individual solution by checking if the berth allocation meets constraints like berthing time, berth length, quay crane number, shore power use, and property limitations. If satisfied, repeat step (1)−(2), if not, re-allocate the vessel.
(4) Repeat the process until all vessels are allocated.
Repeating this process multiple times creates an initial population. The objective function value of each solution in the population is calculated as the fitness function. Subsequently, a tournament selection operator is employed to select superior individuals for crossover and mutation operations, which ensures that weaker individuals do not survive, while optimal individuals consistently prevail.
Crossover and mutation strategy selection based on Q-learning
-
For the selection of crossover and mutation strategies in a genetic algorithm, this study introduces a Q-learning-based reinforcement learning approach for the dynamic selection of crossover and mutation strategies. This method adapts to the complexity and diversity of berth allocation problems. Specifically, the Q-learning algorithm utilizes a Q-table to evaluate the expected reward of each action in a given state, as shown in Eq. (35):
$ Q\left(s,a\right)\leftarrow Q\left(\text{s},a\right)+\alpha \left[r+\gamma \underset{{a}^{\prime}}{\max }Q\left({s}^{\prime},{\mathrm{a}}^{\prime}\right)-Q\left(s,a\right)\right] $ (35) In the equation,
$ s $ $ r $ $ \gamma $ $ \alpha $ $ \underset{{a}^{\prime}}{\max }Q\left({s}^{\prime},{a}^{\prime}\right) $ $ {s}^{\prime} $ Constructions of state
-
In selecting crossover and mutation strategies, the characteristics of the population's state are essential for decisions based on Q-learning. The extraction of state features is as follows:
Population diversity
-
Population diversity reflects the differences among individuals in a population. High diversity means the algorithm is exploring various solution space regions, while low diversity suggests it may be near a local optimum. The calculation formula is shown in Eq. (36), where
$ N $ $ d\left(i,j\right) $ $ i $ $ j $ $ Diversity=\dfrac{1}{N(N-1)}\sum \limits_{i=1}^{N}\sum \limits_{j=i+1}^{N}d\left(i,j\right) $ (36) Average fitness
-
The average of individual fitness in the population. The formula is shown in Eq. (37), where
$ N $ $ f\left(i\right) $ $ i $ $ Average\;\;Fitness=\dfrac{1}{N}\sum \limits_{i=1}^{N}f\left(i\right) $ (37) Constructions of action
-
In the Q-learning framework, actions correspond to the crossover and mutation strategies in genetic algorithms. Single crossover and mutation methods cannot ensure sufficient exploration of the solution space, which limits the algorithm's search capabilities. Therefore, we have developed two crossover methods: single-point and multi-point crossover, and two mutation methods: endpoint and two-point mutation, for genetic algorithms.
Single-point crossover
-
As illustrated in Fig. 6, single-point crossover involves selecting two parent chromosomes, randomly choosing a crossover point, and exchanging the genetic segments that follow this point between the two parents. This process results in the production of two distinct offspring.
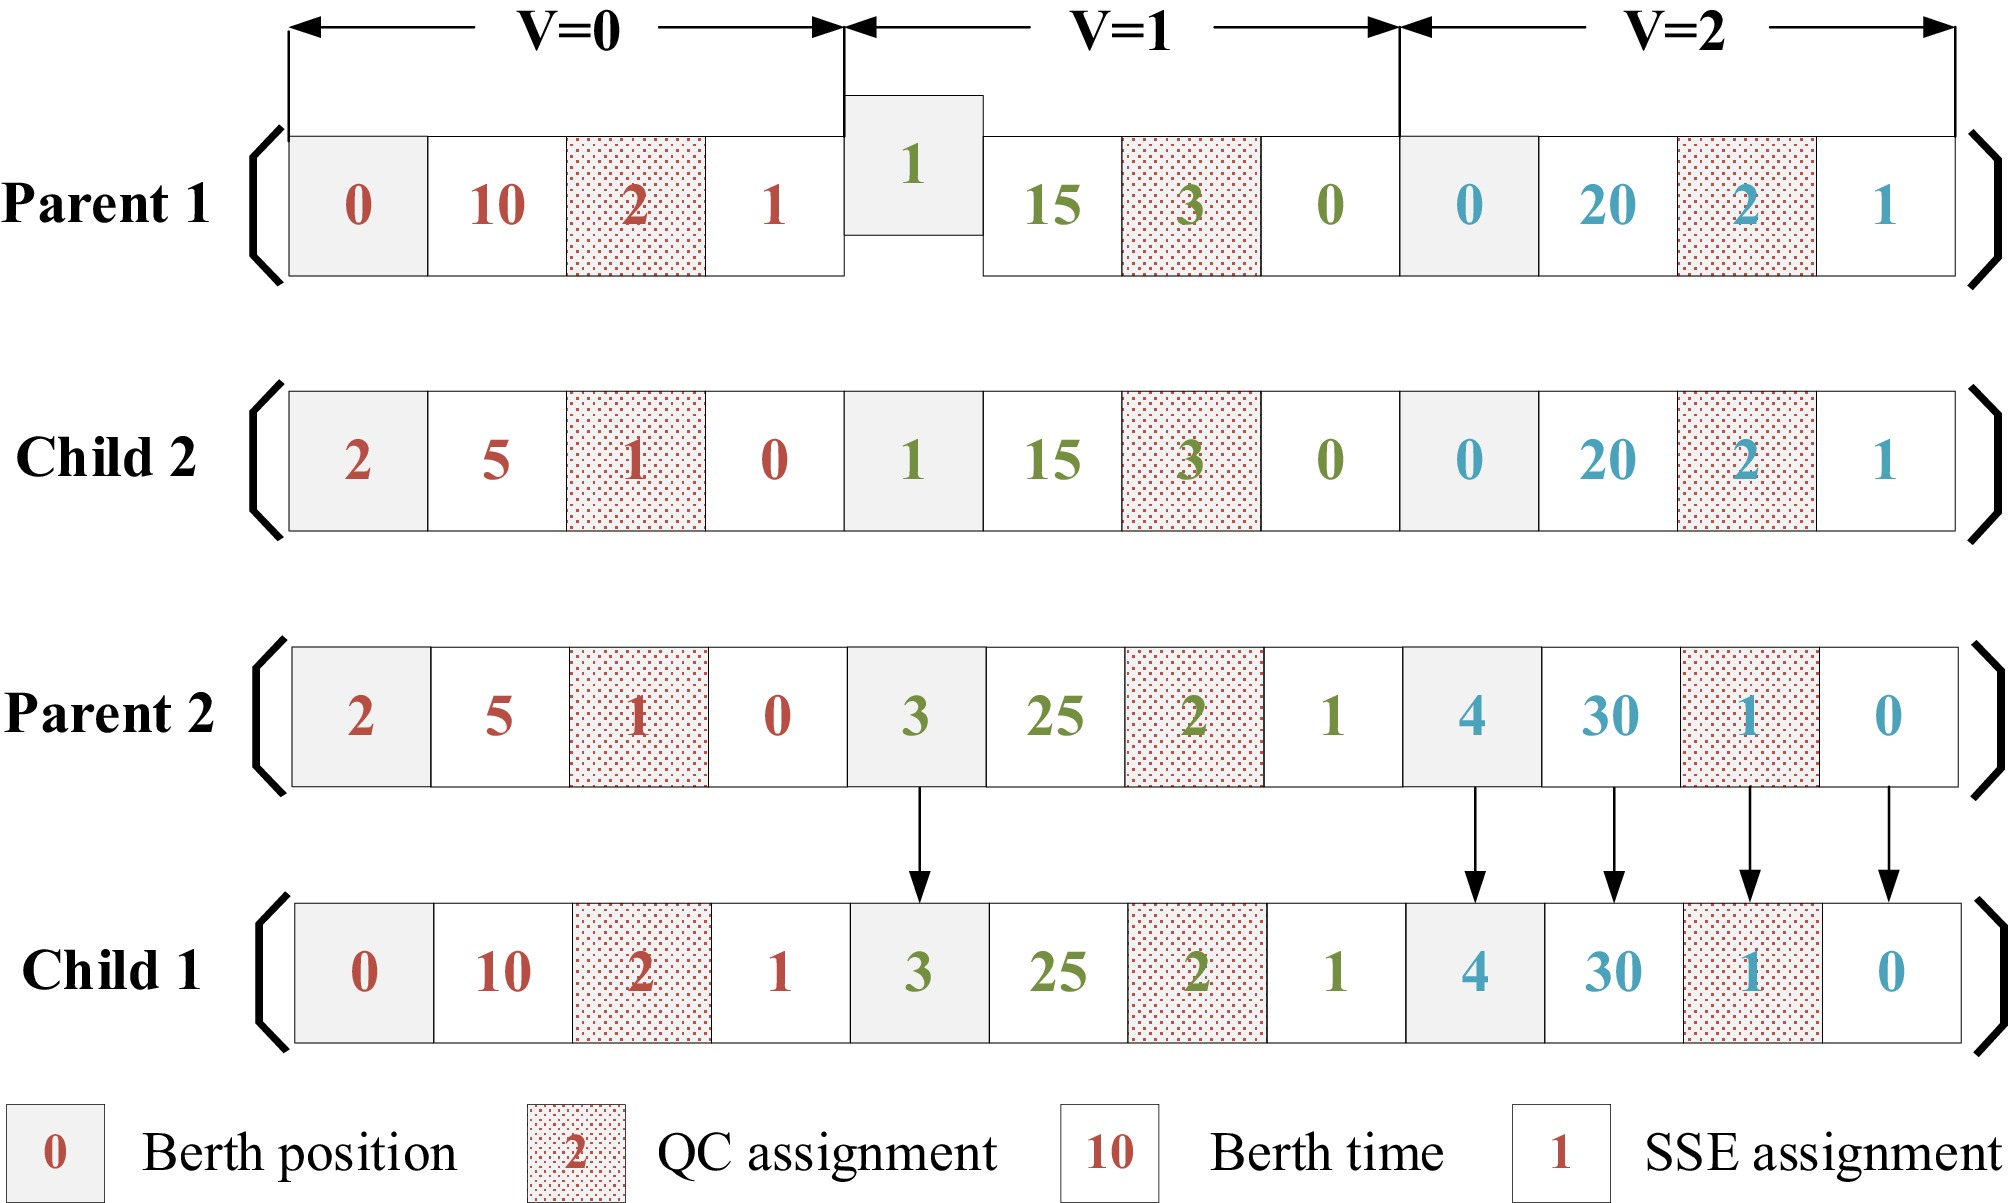
Figure 6.
Single-point crossover.
Multi-point crossover
-
Multi-point crossover involves randomly selecting multiple crossover points on parent chromosomes. As shown in Fig. 7, the genetic segments between these points are then exchanged between the parents to produce two offspring chromosomes.
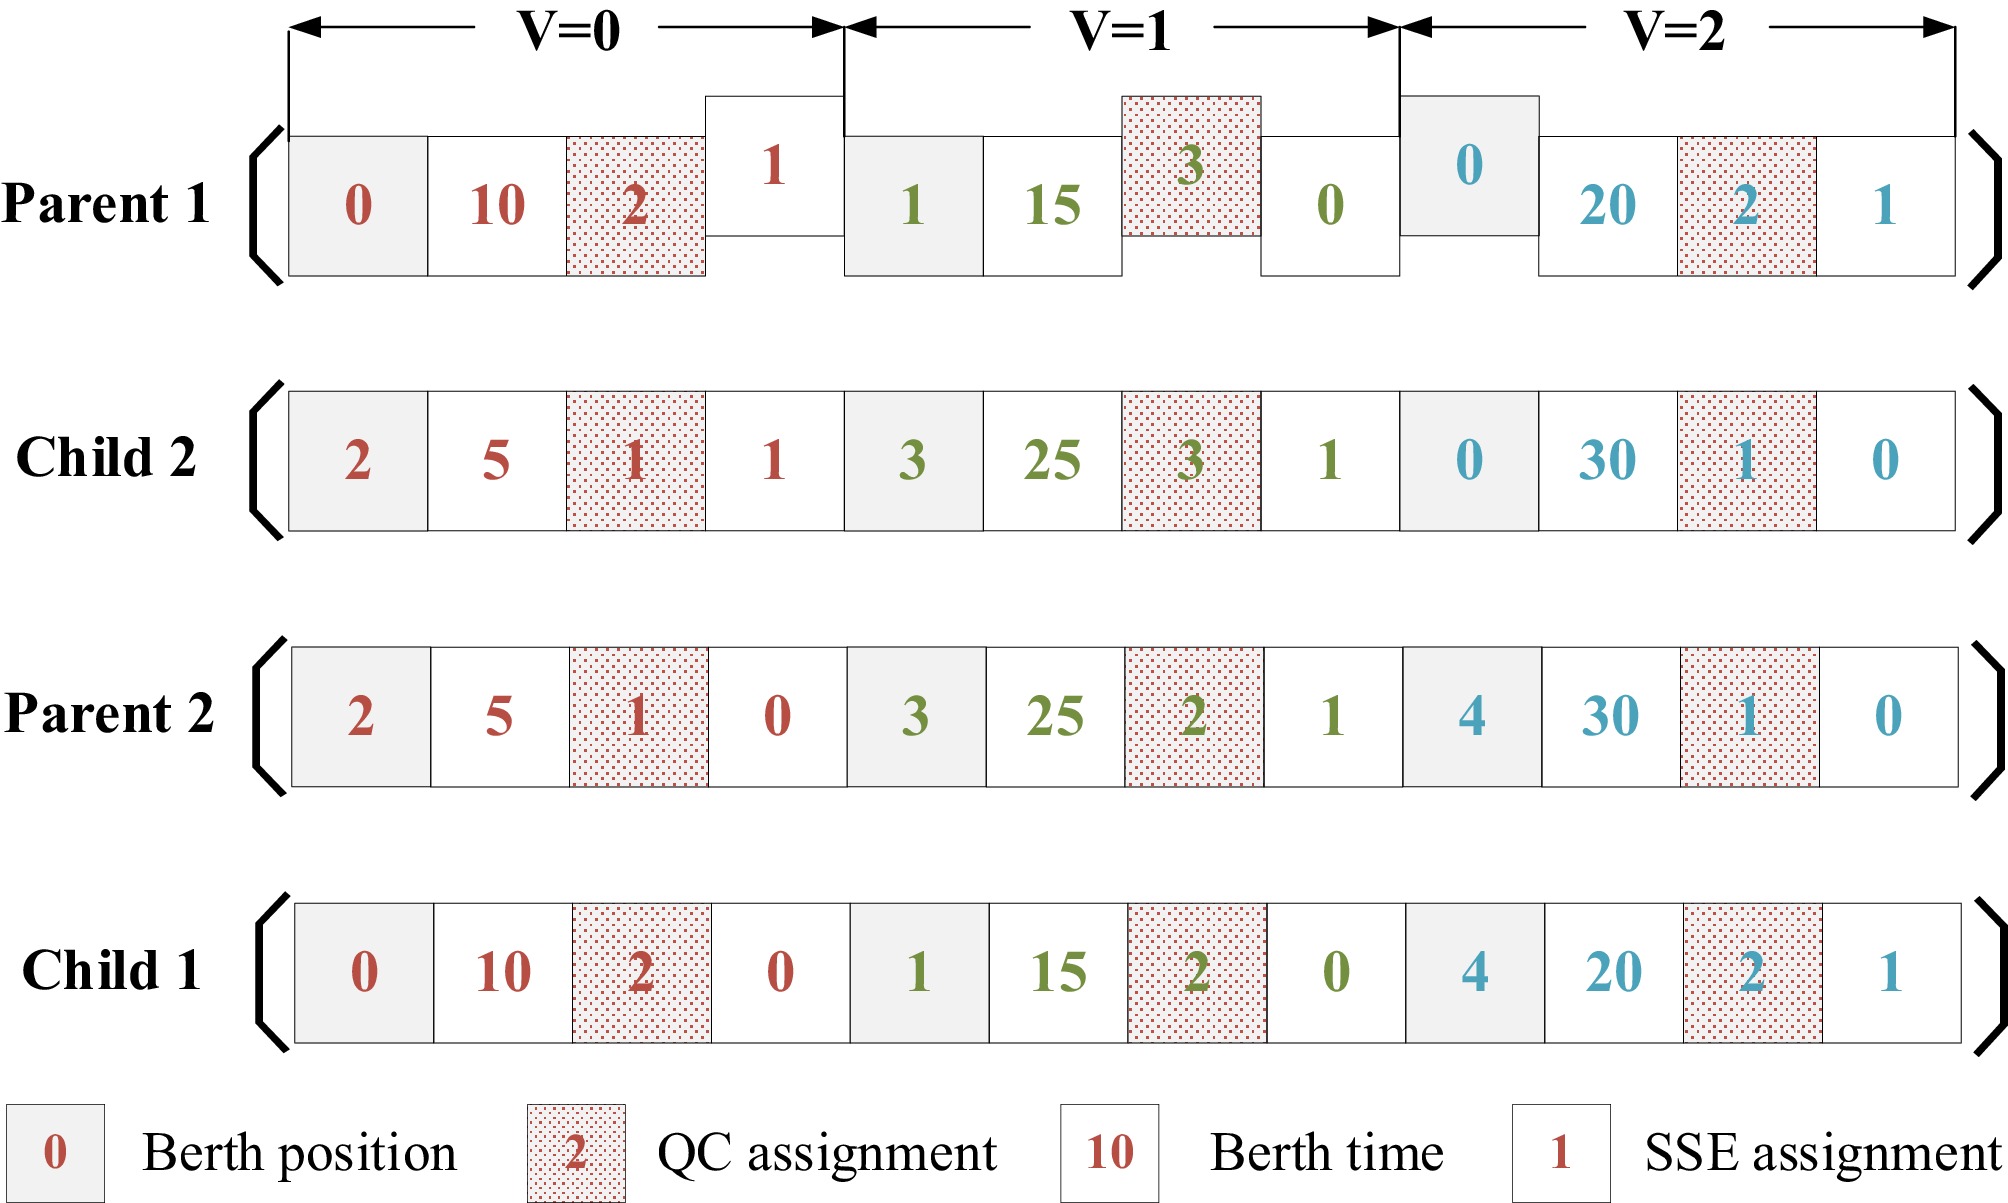
Figure 7.
Multi-point crossover.
Endpoint mutation
-
As shown in Fig. 8, endpoint mutation involves randomly selecting a gene in the parent chromosome that is not a birthing-time decision gene. Subsequently, numerical mutation is applied to the selected gene, with the mutation range regulated by resource constraints, to produce a new offspring individual.
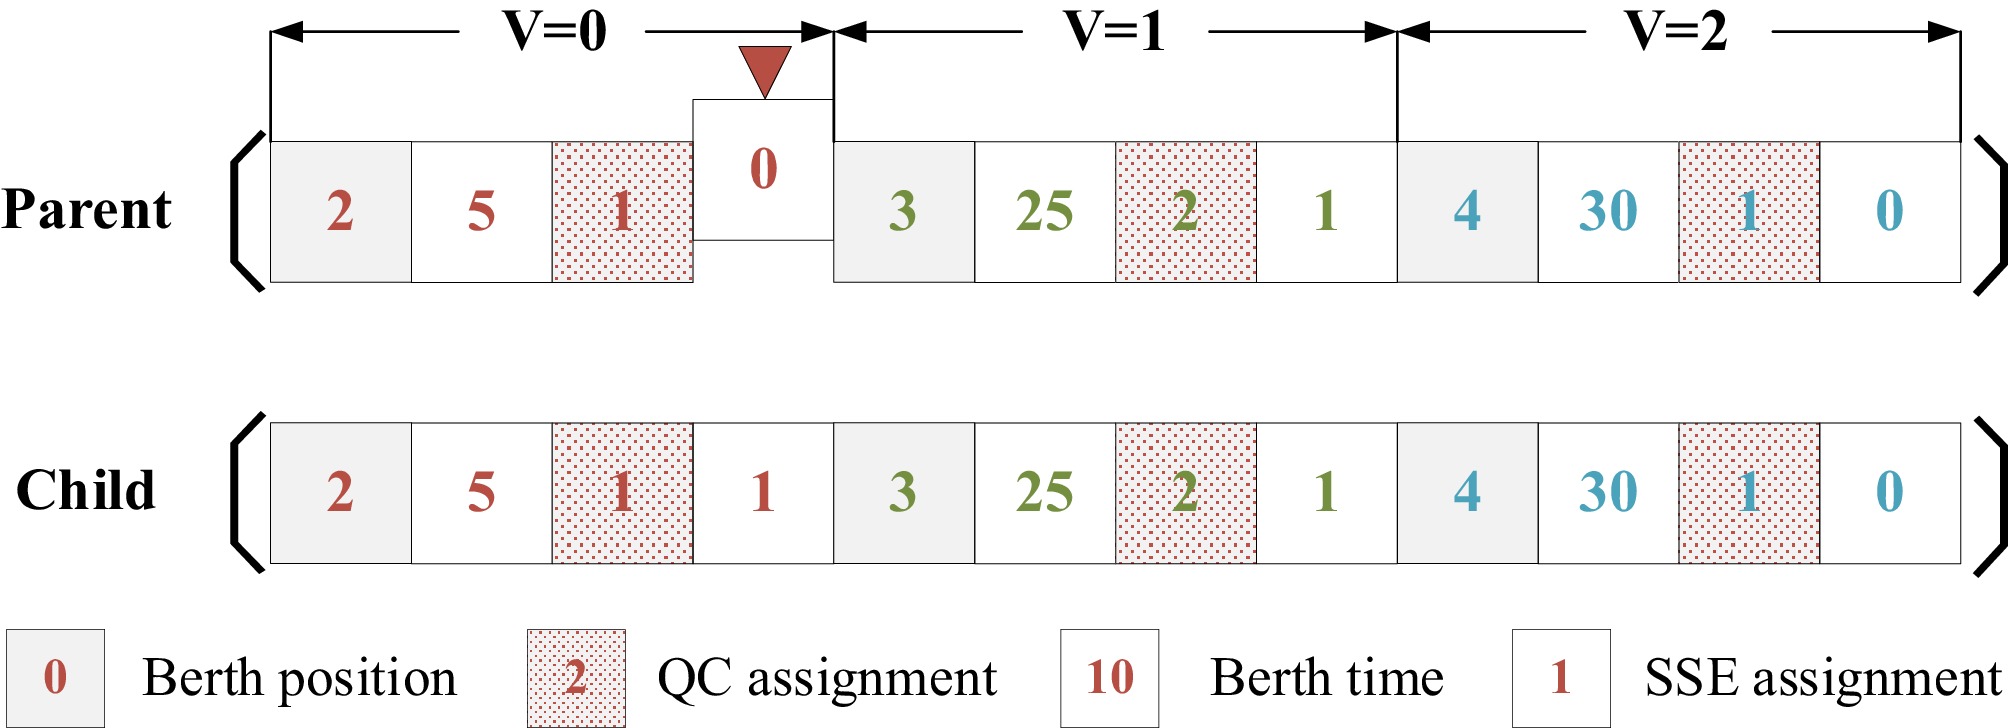
Figure 8.
Endpoint mutation.
Two-point mutation
-
Two-point mutation is a type of uniform mutation that facilitates gene crossover between different vessels through a two-point crossover mechanism. As shown in Fig. 9, two non-berthing time decision genes with the same decision function are randomly selected from the parents, and their positions are crossed to generate offspring individuals.
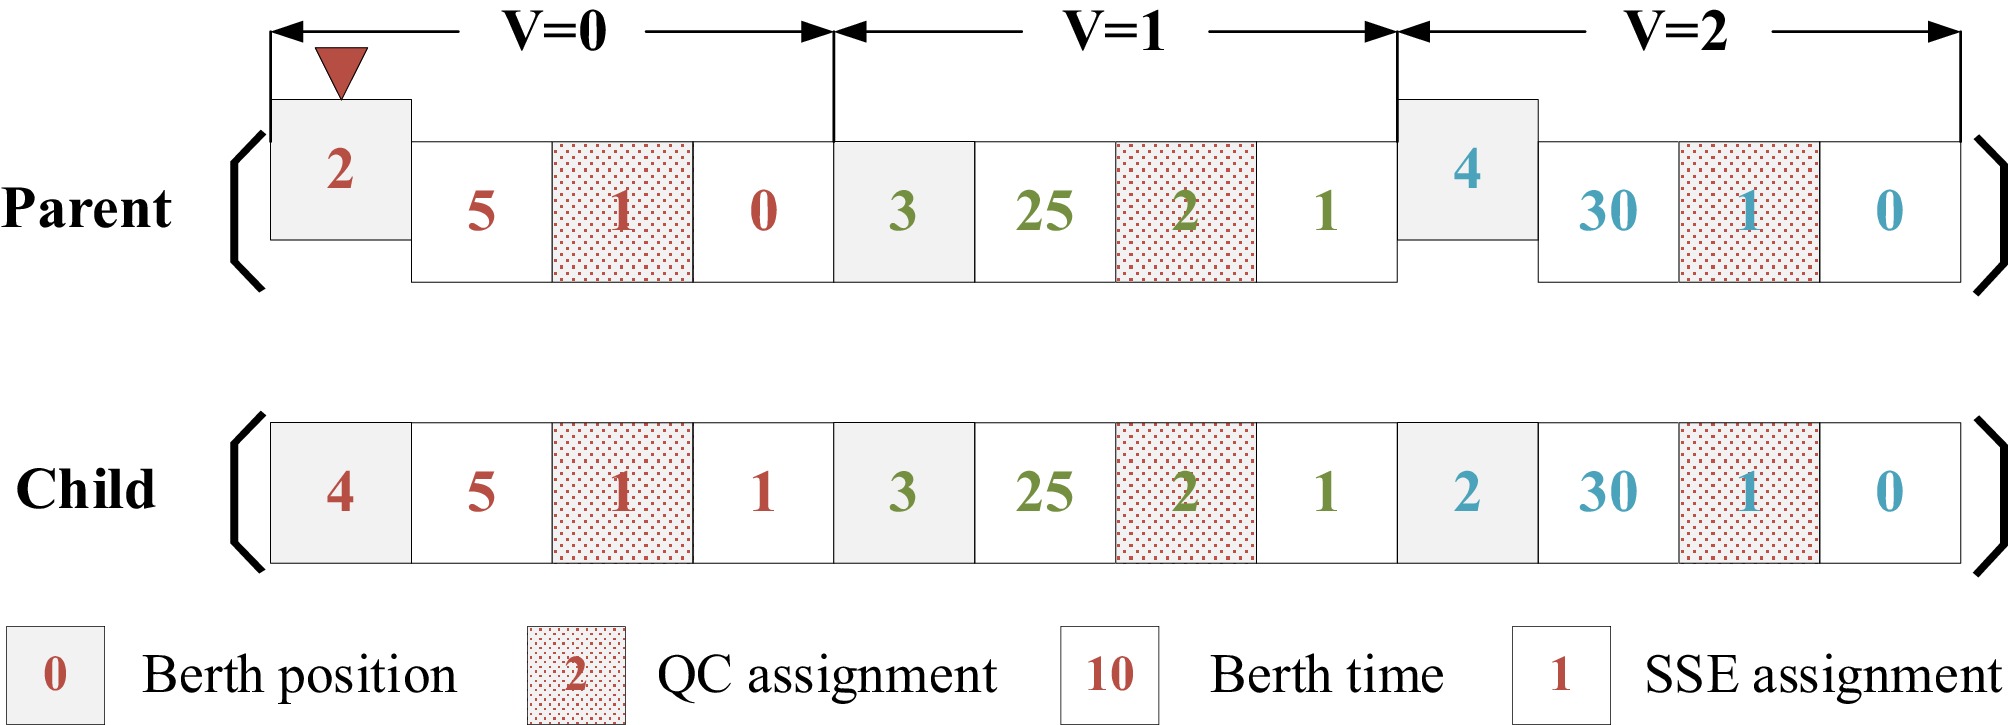
Figure 9.
Two-point mutation.
Strategy of ε-greedy and constructions of reward
-
To balance exploration and exploitation, this study employs the
$ \varepsilon $ $ \varepsilon $ $ 1-\varepsilon $ $ action=\left\{\begin{aligned} & randomaction && \text{with probability }\varepsilon& \\ &\arg \underset{{a}^{\prime}}{\max }Q(s,{a}^{\prime}) && \text{with probability } 1-\varepsilon & \end{aligned}\right. $ (38) The reward function evaluates the action-selection decisions. It is calculated by comparing the fitness of the original and new populations, as demonstrated in Eq. (39). In this context,
$ fitnes{s}^{\prime} $ $ fitness $ $ r=fitnes{s}^{\prime}-fitness $ (39) This dynamic selection process enables the genetic algorithm to adjust its search strategy in real-time according to the problem characteristics and the current search stage, thereby enhancing the algorithm's ability to identify high-quality solutions and accelerating convergence speed.
ALNS operation
-
To enhance the local search capabilities of the algorithm, ALNS operators are introduced to optimize the population following crossover and mutation in the genetic algorithm. In this study, three destroy operators and two repair operators are established. This approach preserves superior individuals and improves the survival rate of offspring.
Destroy operators
Random destroy
-
A destroy operator randomly selects and removes
$ K $ Shaw destroy
-
This operator, first introduced by Shaw[31], selects the most related pairs of assignments. In this approach, similar to previous study[23], the measure of relatedness
$ {M}_{i,j} $ $ i $ $ j $ $ {M}_{i,j}=A\left| {P}_{i}-{P}_{j}\right| +B\left| {S}_{i}-{S}_{j}\right| +C\left| {d}_{i}-{d}_{j}\right| $ (40) In Eq. (40),
$ P $ $ S $ $ d $ $ A $ $ B $ $ C $ $ {M}_{i,j} $ $ i $ $ j $ $ K $ Maximum cost destroy
-
This method calculates the total cost
$ C\left({V}^{\prime}\right) $ $ K $ $ C\left(V\right) $ $ {C}_{i}=C\left(V\right)-C\left({V}^{\prime}\right) $ (41) Repair operators
Greedy repair
-
The greedy repair follows the rule of maximum minimal insertion increment. It repairs and reconstructs a feasible vessel scheduling plan by inserting each vessel from the destroyed set
$ \Omega $ $ I $ $ \Omega $ $ \Omega $ k-Regret repair
-
The k-Regret repair is based on the regret-k heuristic presented by Potvin & Rousseau[32]. This method calculates the regret value
$ re{g}_{i} $ $ i $ $ \Omega $ $ K $ $ re{g}_{i} $ $ \Omega $ $ re{g}_{i} $ $ C_{i}^{1st} $ $ C_{i}^{2nd} $ $ i $ $ re{g}_{i}={C}_{i}{}^{2nd}-{C}_{i}{}^{1st} $ (42) Adaptive weight updates
-
This study proposes an adaptive operator-weight update method to enhance the search efficiency of ALNS. Initially, all operators are assigned equal weights. During the iterations, operator scores are updated based on their performance, as outlined in Table 4, and weights are adjusted using Eq. (43), where
$ \lambda $ $ {w}_{i} $ $ {s}_{i} $ $ {u}_{i} $ $ {w}_{i}={w}_{i}\times \lambda +(1-\lambda )\times \dfrac{{s}_{i}}{{u}_{i}} $ (43) Table 4. The score of destroyed and repaired operators.
Score Criteria description 3 Find a better solution or equal to the optimal solution after using the ALNS operators 1.5 Find a better solution or equal to the current solution after using the ALNS operators 0 Find a solution that is worse than the current solution after using the ALNS operators This approach increases the weight of operators that yield high-quality solutions while decreasing the weight of underperforming operators, thereby optimizing the search process.
-
In this section, numerical experiments are conducted to validate the proposed model and evaluate the performance of the GA + ALNS algorithm combined with Q-learning. We compare the proposed algorithm with widely used heuristic algorithms, including the Genetic Algorithm (GA) and the Adaptive Large Neighborhood Search (ALNS) algorithm. Subsequently, we conduct a sensitivity analysis to illustrate how changes in several key parameters can affect the decision-making behavior of ports. All experimental operations were conducted on the same computer with 12th Gen Intel (R) Core (TM) i5-12400F @ 2.50 GHz and 16.0 GB RAM. All the code in this study was written in Python 3.12.
Parameter settings
-
We designed a 1-week (168-hour) berth planning horizon, during which vessels will arrive randomly. The length of MASS is established between 80 and 150 m, whereas the length of manned vessels ranges from 150 to 350 m. Berth lengths are available in 200, 250, and 350 m. The container handling volume (TEU) of vessels is randomly generated within the vessels' loading capacity limits. The auxiliary engine power of the vessels is set at 800, 1,200, 1,500, 2,400, and 2,700 kW, depending on the size of the vessel[33].
The auxiliary variables
$ M{A}_{i} $ $ Eq{v}_{i} $ $ Eq{b}_{b} $ $ B_{b}^{mass} $ (1) The number of MASS does not exceed 30% of the total vessels within the planning horizon.
(2) Vessels equipped with shore power reception facilities, including MASS, are limited to 50% of their total capacity.
(3) Each berth has a 50% probability of being equipped with SSE facilities; however, the total number of such facilities cannot exceed 50% of the overall berths.
(4) The number of MASS-available berths is limited to 40% of the total berths.
To comprehensively evaluate the performance of the proposed algorithm, cases are categorized as small (
$ \left| V\right| $ $ \left| V\right| $ $ \left| V\right| $ $ \left| V\right| $ Table 5. Values of some parameters.
Parameters Value Ref. $ {C}_{1} $ 800 US${\$} $/h Wang et al.[34] $ {C}_{2} $ 240 US${\$} $/h Model assumption $ {C}_{3} $ 0.15918 US${\$} $/kWh Peng et al.[33] $ {C}_{4} $ 0.13382 US${\$} $/kWh Peng et al.[33] $ {C}_{5} $ 2400 US${\$} $/h Wang et al.[34] $ {C}_{6} $ 40 US${\$} $/h Model assumption $ \eta $ 30 TEU/h Model assumption $ \lambda $ 0.4 HPA[30] $ M $ 100,000 Model assumption $ {c}^{e} $ 0.54 kg/kWh Hall[35] $ {c}^{f} $ 0.6412 kg/kWh Hall[35] To achieve optimal performance for both the proposed algorithm and the benchmark algorithms, we made several experimental adjustments. The parameter settings of the algorithms are detailed in Appendix C. The results obtained from Gurobi serve as the benchmark, and the time limit for solving is set at 3,600 s.
Effectiveness of the Mixed-Strategy
-
Based on the proposed models developed in this study, the validity of the Mixed-Strategy was verified across 20 cases. Table 6 presents the comparison results between the two models, and the GAP value between the objective functions (as shown in Eq. [44]) is utilized to describe the optimization level of the Mixed-Strategy model.
$ GAP=\dfrac{Ob{j}_{2}-Ob{j}_{1}}{Ob{j}_{2}}\times 100{\text{%}} $ (44) Table 6. Gurobi solution results.
$ \left| V\right| $ $ \left| B\right| $ $ \left| Q\right| $ $ \left| B_{b}^{mass}\right| $ Gurobi solving results GAP (%) Mixed-Strategy Separated-Strategy $ Ob{j}_{1} $ (US${\$} $) Times (s) $ Ob{j}_{2} $ (US${\$} $) Times (s) 6 4 9 1 154,678.04 1.76 158,881.69 1.70 2.65 6 12 2 151,661.30 0.94 152,258.62 0.60 0.39 8 15 3 151,661.30 0.96 151,661.30 0.91 0.00 10 18 4 151,661.30 1.14 151,661.30 1.02 0.00 8 4 9 1 192,980.09 2.58 222,112.94 2.23 13.12 6 12 2 189,577.96 2.19 190,560.66 0.92 0.52 8 15 3 189,577.96 1.98 189,577.96 1.54 0.00 10 18 4 189,577.96 2.41 189,577.96 2.15 0.00 10 4 9 1 308,054.41 54.73 334,629.59 3.35 7.94 6 12 2 269,410.28 2.08 296,034.98 2.00 8.99 8 15 3 269,410.28 3.31 295,052.28 2.46 8.69 10 18 4 269,410.28 2.93 269,410.28 2.68 0.00 15 4 9 1 435,356.64 60.47 537,437.17 10.52 18.99 6 12 2 398,567.20 29.29 400,147.21 3.94 0.39 8 15 3 398,567.20 30.48 398,567.20 7.91 0.00 10 18 4 398,567.20 9.87 398,567.20 8.89 0.00 20 4 9 1 727,758.10 1,641.2 889,589.73 627.49 18.19 6 12 2 − 3,600 − 3,600 − 8 15 3 − 3,600 − 3,600 − 10 18 4 − 3,600 − 3,600 − Average 285,086.91 307,395.8 7.26 From Table 6, the Mixed-Strategy model performs at least as well as the Separated-Strategy in all cases. This is particularly evident when terminal resources are limited, as the Mixed-Strategy produces superior results. As the number of berths, quay cranes, and SSE facilities increases, the objective function values for both the two strategies do not consistently decrease. Once terminal resources adequately meet the operational needs of all vessels, these values stabilize and eventually converge. At this stage, both strategies achieve optimal allocation, resulting in minimal cost differences.
To provide a more detailed overview of the solution, we take the example with cases
$ \left| V\right| $ $ \left| B\right| $ Table 7. Key costs calculated under Mixed-Strategy and Separated-Strategy.
Cost (US${\$} $) $ \left| V\right| $ 8 10 15 20 Average GAP (%) Total cost Mixed 192,980.09 308,054.41 435,356.64 727,758.1 363,765.46 15.1 Separated 222,112.94 334,629.59 537,437.17 889,589.73 428,530.22 Waiting cost Mixed 2,400 11,200 12,000 50,400 15,680 51.2 Separated 11,200 19,200 36,800 88,000 32,160 QCs cost Mixed 23,184 31,104 41,808 56,016 34,147.2 18.8 Separated 23,184 31,104 43,440 57,648 34,800 Energy cost Mixed 29,676.09 42,190.41 58,628.64 87,582.1 48,338.26 13.9 Separated 33,208.94 46,365.59 69,477.17 106,981.73 56,130.22 Delay cost Mixed 120,000 103,200 175,200 256,800 446,400 15.8 Separated 141,600 120,000 189,600 321,600 549,600 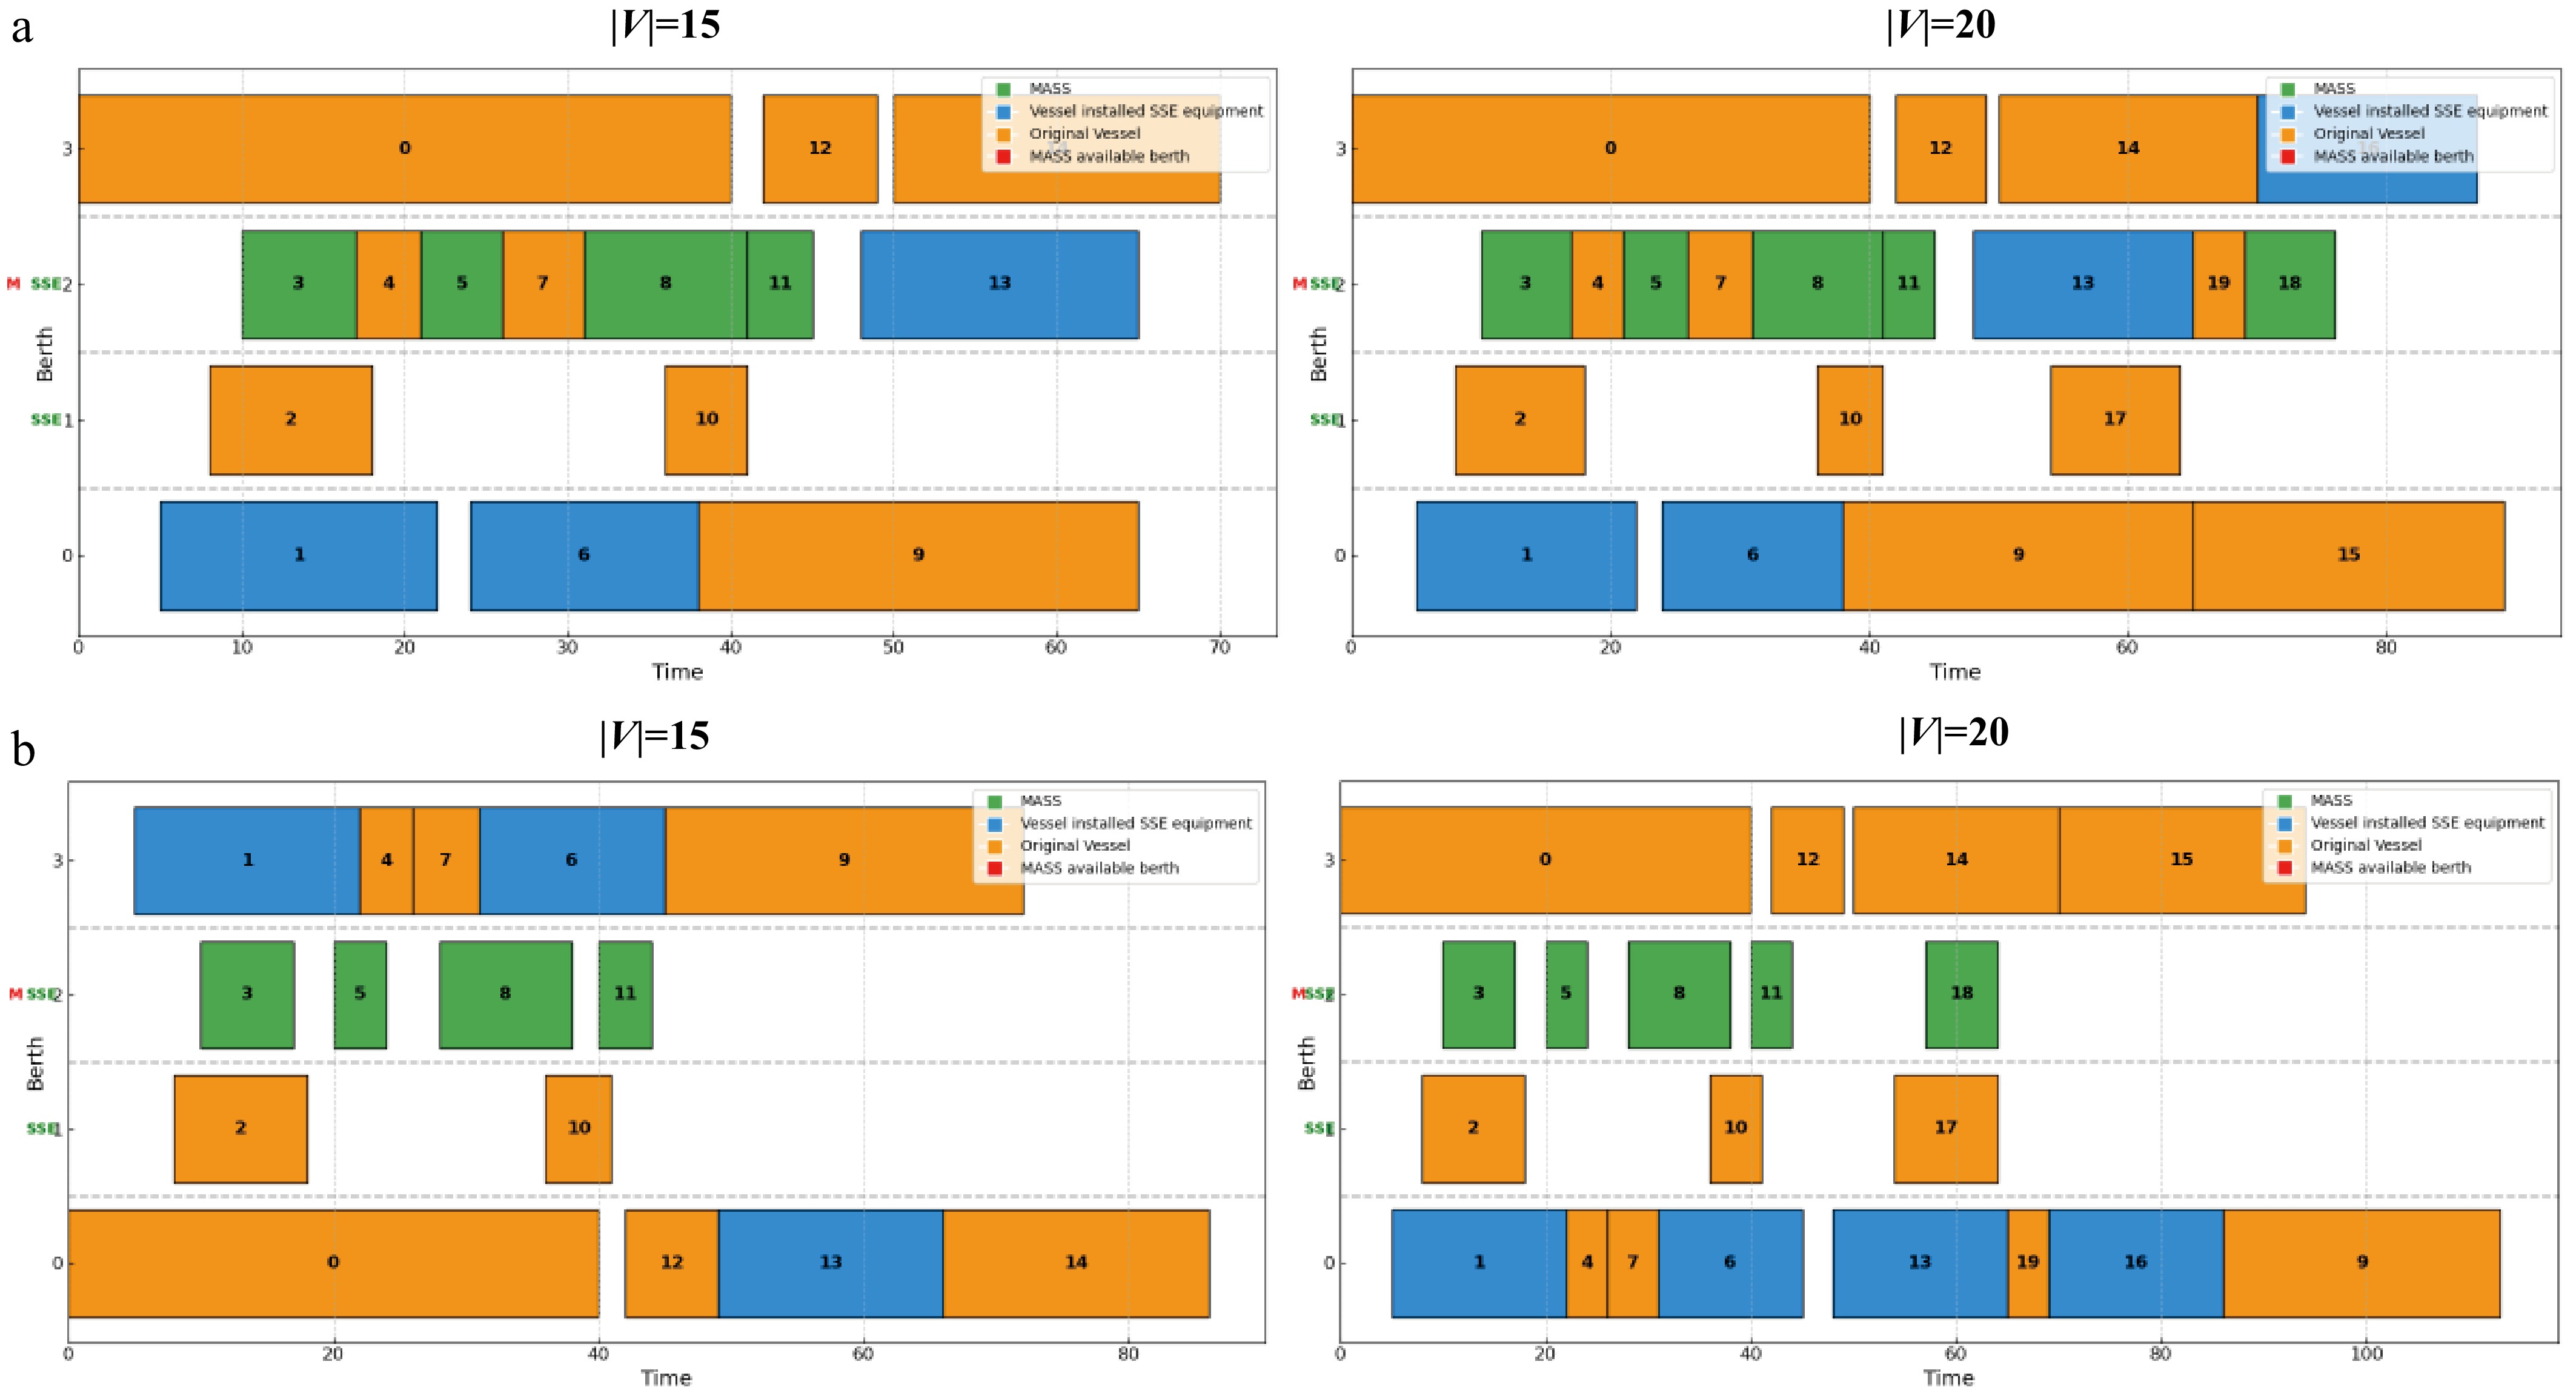
Figure 10.
Space-time diagram of (a) Mixed-Strategy and (b) Separated-Strategy.
As shown in Fig. 10, the Mixed-Strategy outperforms the Separated-Strategy. It facilitates a more efficient allocation of resources and enhances berth utilization, enabling the servicing of a greater number of vessels. Simultaneously, it decreases vessel waiting times and delays in departures, while also preventing waste.
To further investigate the feasibility of the Mixed-Strategy, this study calculates carbon emissions from vessels during their port stay under two different strategies, focusing on the greening of port operations. The carbon emissions of vessels during their port stay depend on the types of energy consumed and the duration of their stay. Vessels produce carbon emissions directly if diesel fuel is employed. In contrast, when vessels utilize stored energy or shore power, the vessels barely generate direct carbon emissions. However, indirect emissions caused by electricity consumption remain significant[17].
According to ISO 14064-1 (2006) and IPCC (2006), the carbon emissions of vessels should be calculated as Eq. (45), where
$ c $ $ {F}_{i} $ $ i $ $ {t}_{i} $ $ i $ $ {C}_{i}=c\times {F}_{i}\times {t}_{i} $ (45) Therefore, we can calculate carbon emissions using Eqs (46)−(48), where
$ {C}_{w} $ $ {C}_{b} $ $ {c}^{f} $ $ {c}^{e} $ $ {C}_{w}=\sum \limits_{i\in V}({S}_{i}-{A}_{i}){E}_{i}\left[{c}^{e}M{A}_{i}+{c}^{f}(1-M{A}_{i})\right] $ (46) $ {C}_{b}=\sum \limits_{i\in V}({d}_{i}-{S}_{i}){E}_{i}\left[{c}^{e}{O}_{i}+{c}^{f}(1-{O}_{i})\right] $ (47) $ C={C}_{w}+{C}_{b} $ (48) As shown in Table 8, the total carbon emissions of vessels discussed in this section were calculated using the equation provided above. Compared to the Separated-Strategy, the Mixed-Strategy model reduces total carbon emissions by an average of 14.65%.
Table 8. Comparison of carbon emissions between tow berth allocation strategies.
$ \left| V\right| $ Carbon emissions (kg) GAP (%) Mixed-Strategy Separated-Strategy 6 111,899.76 116,708.76 4.12 8 140,946.12 157,873.8 10.72 10 200,422.92 219,132.36 8.54 15 269,819.52 329,159.04 18.03 20 412,487.16 507,615.36 18.74 Average 227,115.1 26,6097.9 14.65 The results presented above demonstrate that the optimization outcomes achieved through the Mixed-Strategy exceed those obtained with the Separated-Strategy. Thus, the Mixed Strategy more effectively fulfills the operational requirements of both MASS and manned vessels.
Performance of the proposed algorithm
-
To verify the effectiveness of the GA + ALNS algorithm combined with Q-learning, experiments were conducted for the proposed problem under the Mixed-Strategy. The results of GA + ALNS, GA, and ALNS are compared and presented in Table 9, where Gap (%) denotes the gap between the results of each algorithm and those obtained from Gurobi.
Table 9. Comparison of results of different algorithms.
Algorithm Our method ALNS GA $ \left| V\right| $ Case $ Ob{j}_{1} $ CT (s) Gap $ Ob{j}_{2} $ CT (s) Gap $ Ob{j}_{3} $ CT (s) Gap 6 1 156,378.04 5.55 1.09 157,044.07 5.81 1.51 158,442.37 1.85 2.38 2 152,876.58 5.63 0.79 153,481.17 7.88 1.19 154,641.17 2.00 1.93 3 152,229.14 5.65 0.37 153,043.34 10.61 0.90 154,297.42 1.92 1.71 4 151,917.81 6.38 0.17 153,312.35 7.75 1.08 154,205.57 1.97 1.65 8 1 195,932.36 6.71 1.51 198,024.80 7.45 2.55 203,866.44 2.37 5.34 2 192,382.78 6.87 1.46 195,104.03 8.63 2.83 207,339.07 1.85 8.57 3 191,648.06 6.86 1.08 194,461.90 11.24 2.51 202,450.95 2.42 6.36 4 191,184.36 6.78 0.84 193,666.21 15.72 2.11 201,704.02 2.52 6.01 10 1 316,972.67 7.67 2.81 334,296.79 12.38 7.85 350,287.69 3.04 12.06 2 276,229.36 7.80 2.47 291,651.20 14.48 7.63 306,379.28 2.84 12.07 3 275,324.49 7.91 2.15 285,127.84 18.96 5.51 301,053.86 3.02 10.51 4 275,012.08 8.70 2.04 281,047.88 21.74 4.14 298,938.24 3.84 9.88 15 1 453,425.37 11.45 3.98 469,563.09 21.57 7.28 493,484.25 4.29 11.78 2 414,993.68 11.29 3.96 428,555.32 25.07 7.00 452,447.37 4.51 11.91 3 416,609.86 10.73 4.33 425,594.14 31.25 6.35 442,073.82 4.43 9.84 4 414,493.16 11.80 3.84 422,031.97 30.39 5.56 442,394.65 4.02 9.91 20 1 771,630.94 17.76 5.69 801,368.39 30.28 9.19 881,017.78 5.98 17.40 2 651,233.08 20.77 − 697,908.48 41.27 − 727,124.39 6.01 − 3 629,316.41 22.37 − 652,647.68 54.01 − 672,714.46 5.95 − 4 627,808.35 25.65 − 644,477.01 49.39 − 661,304.62 5.69 − 30 1 1,044,593.77 29.68 − 1,377,603.23 68.11 − 1,667,353.24 9.43 − 2 932,048.17 36.26 − 999,053.32 86.65 − 1,345,368.42 9.03 − 3 921,896.12 37.47 − 968,950.33 106.33 − 1,120,027.34 8.75 − 4 917,101.77 41.94 − 963,263.93 100.25 − 1,114,765.17 8.96 − 40 1 1,574,540.08 54.04 − 1,701,024.87 155.63 − 2,340,866.86 18.76 − 2 1,341,607.22 66.72 − 1,588,796.82 161.82 − 2,063,518.60 19.35 − 3 1,189,445.17 68.39 − 1,562,007.22 165.73 − 1,808,089.58 18.85 − 4 1,060,306.03 70.96 − 1,300,407.35 209.49 − 1,512,966.78 23.36 − Average 567,469.18 22.13 2.27 628,339.81 52.85 4.42 729,968.69 6.68 8.19 The data in Table 9 indicate that GA + ALNS produced superior solutions for most small-scale in outperforming ALNS and GA in terms of solution quality across all scales. Additionally, GA + ALNS exhibits superior CPU time compared to ALNS for all cases. As the scale of the cases increases, GA + ALNS consistently demonstrates strong stability. Notably, despite its shorter CPU time, GA often converges on local optima, leading to inferior objective values when compared to ALNS and GA + ALNS.
Figure 11 displays the convergence of various algorithms. GA converges faster, but it is susceptible to premature convergence. Conversely, ALNS benefits from dynamically adjusted operators, resulting in better solutions than GA. However, its lower search efficiency within the solution space leads to longer CPU time and slower convergence compared to GA. In contrast, GA + ALNS demonstrates superior search capabilities and can effectively escape local optimal solutions during the search process.
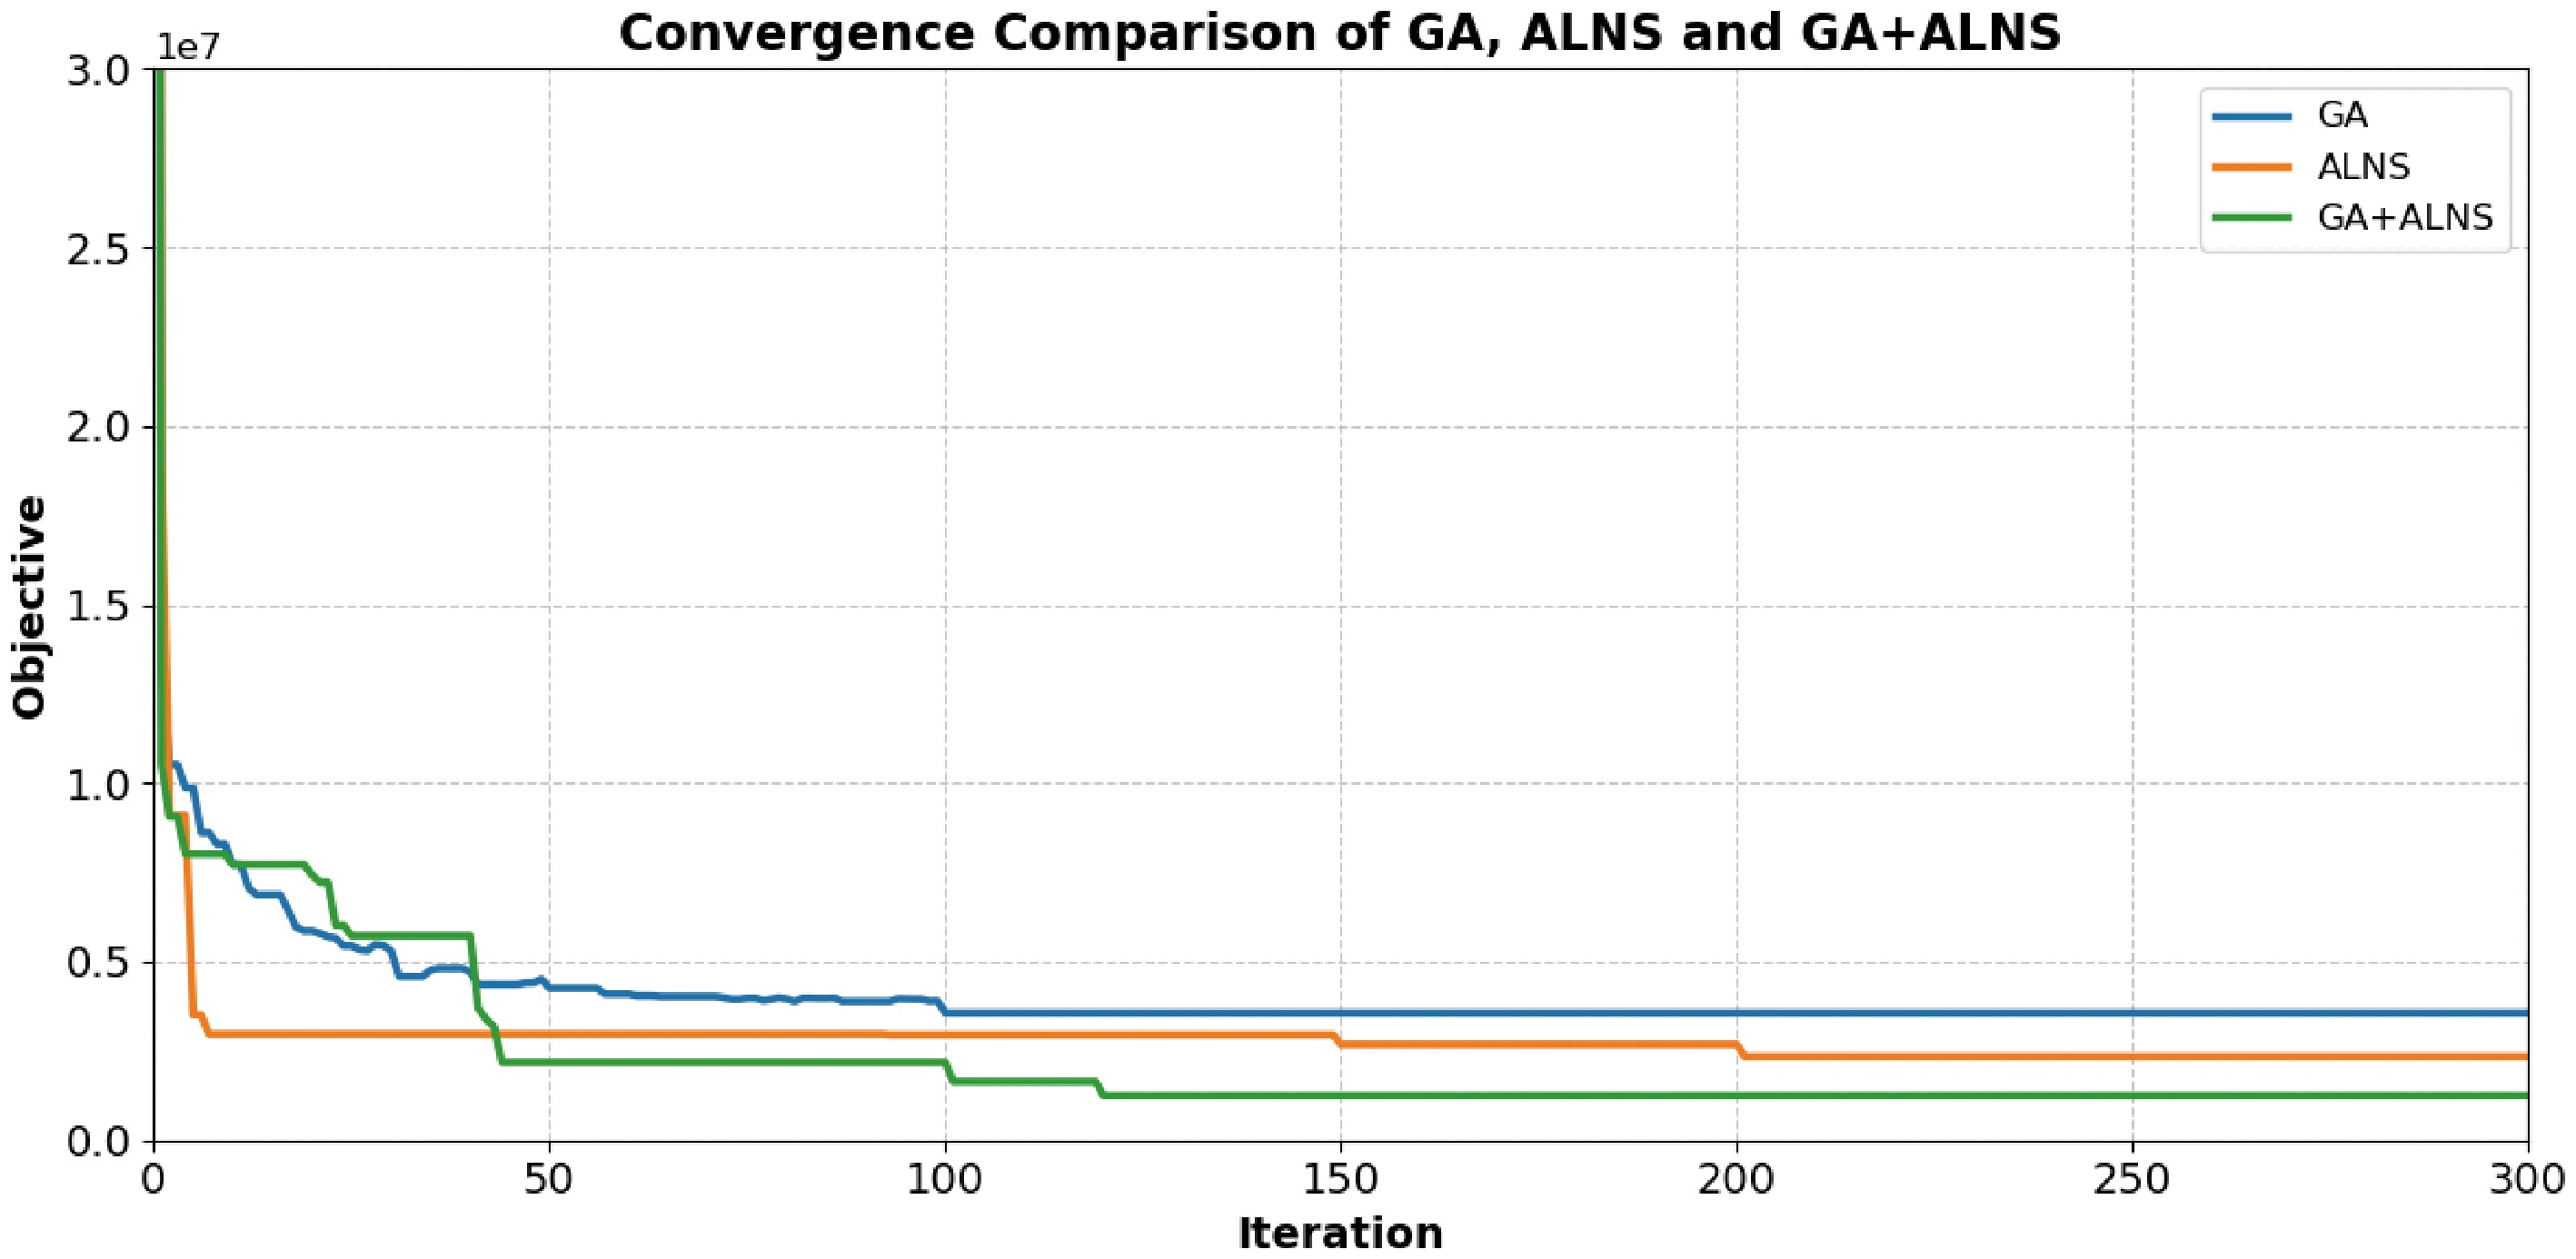
Figure 11.
Convergence comparison of algorithms.
Validation based on real port environments
-
Yantian International Container Terminal (YICT), a crucial gateway for China's import and export trade, is one of the preferred ports for ultra-large vessels worldwide and ranks among the busiest container terminals globally. This section uses YICT as a case study to validate the berth allocation strategies and evaluate the effectiveness of the proposed algorithm. The experimental parameter settings are presented in Table 10.
Table 10. Parameter settings based on the real environment of YICT.
Parameters Value Total number of berths 20 Total number of QCs 85 Total number of MASS-available berths 3 Total number of SSE facilities 6 The planning horizon 168 Total number of vessels 30, 40 Total number of MASSs 8, 10 Total number of manned vessels equipped
with SSE reception facilities6, 8 Figure 12 illustrates the berth allocation schemes for large-scale instances obtained using the GA + ALNS algorithm combined with Q-learning. In this figure, the X-axis represents time, while the Y-axis denotes berth numbers. Green rectangles indicate MASS, blue rectangles represent manned vessels equipped with SSE reception facilities, and orange rectangles correspond to manned vessels without SSE reception facilities. The length of each rectangle reflects the vessel's stay duration in the port, and its position along the Y-axis indicates the allocated berth.
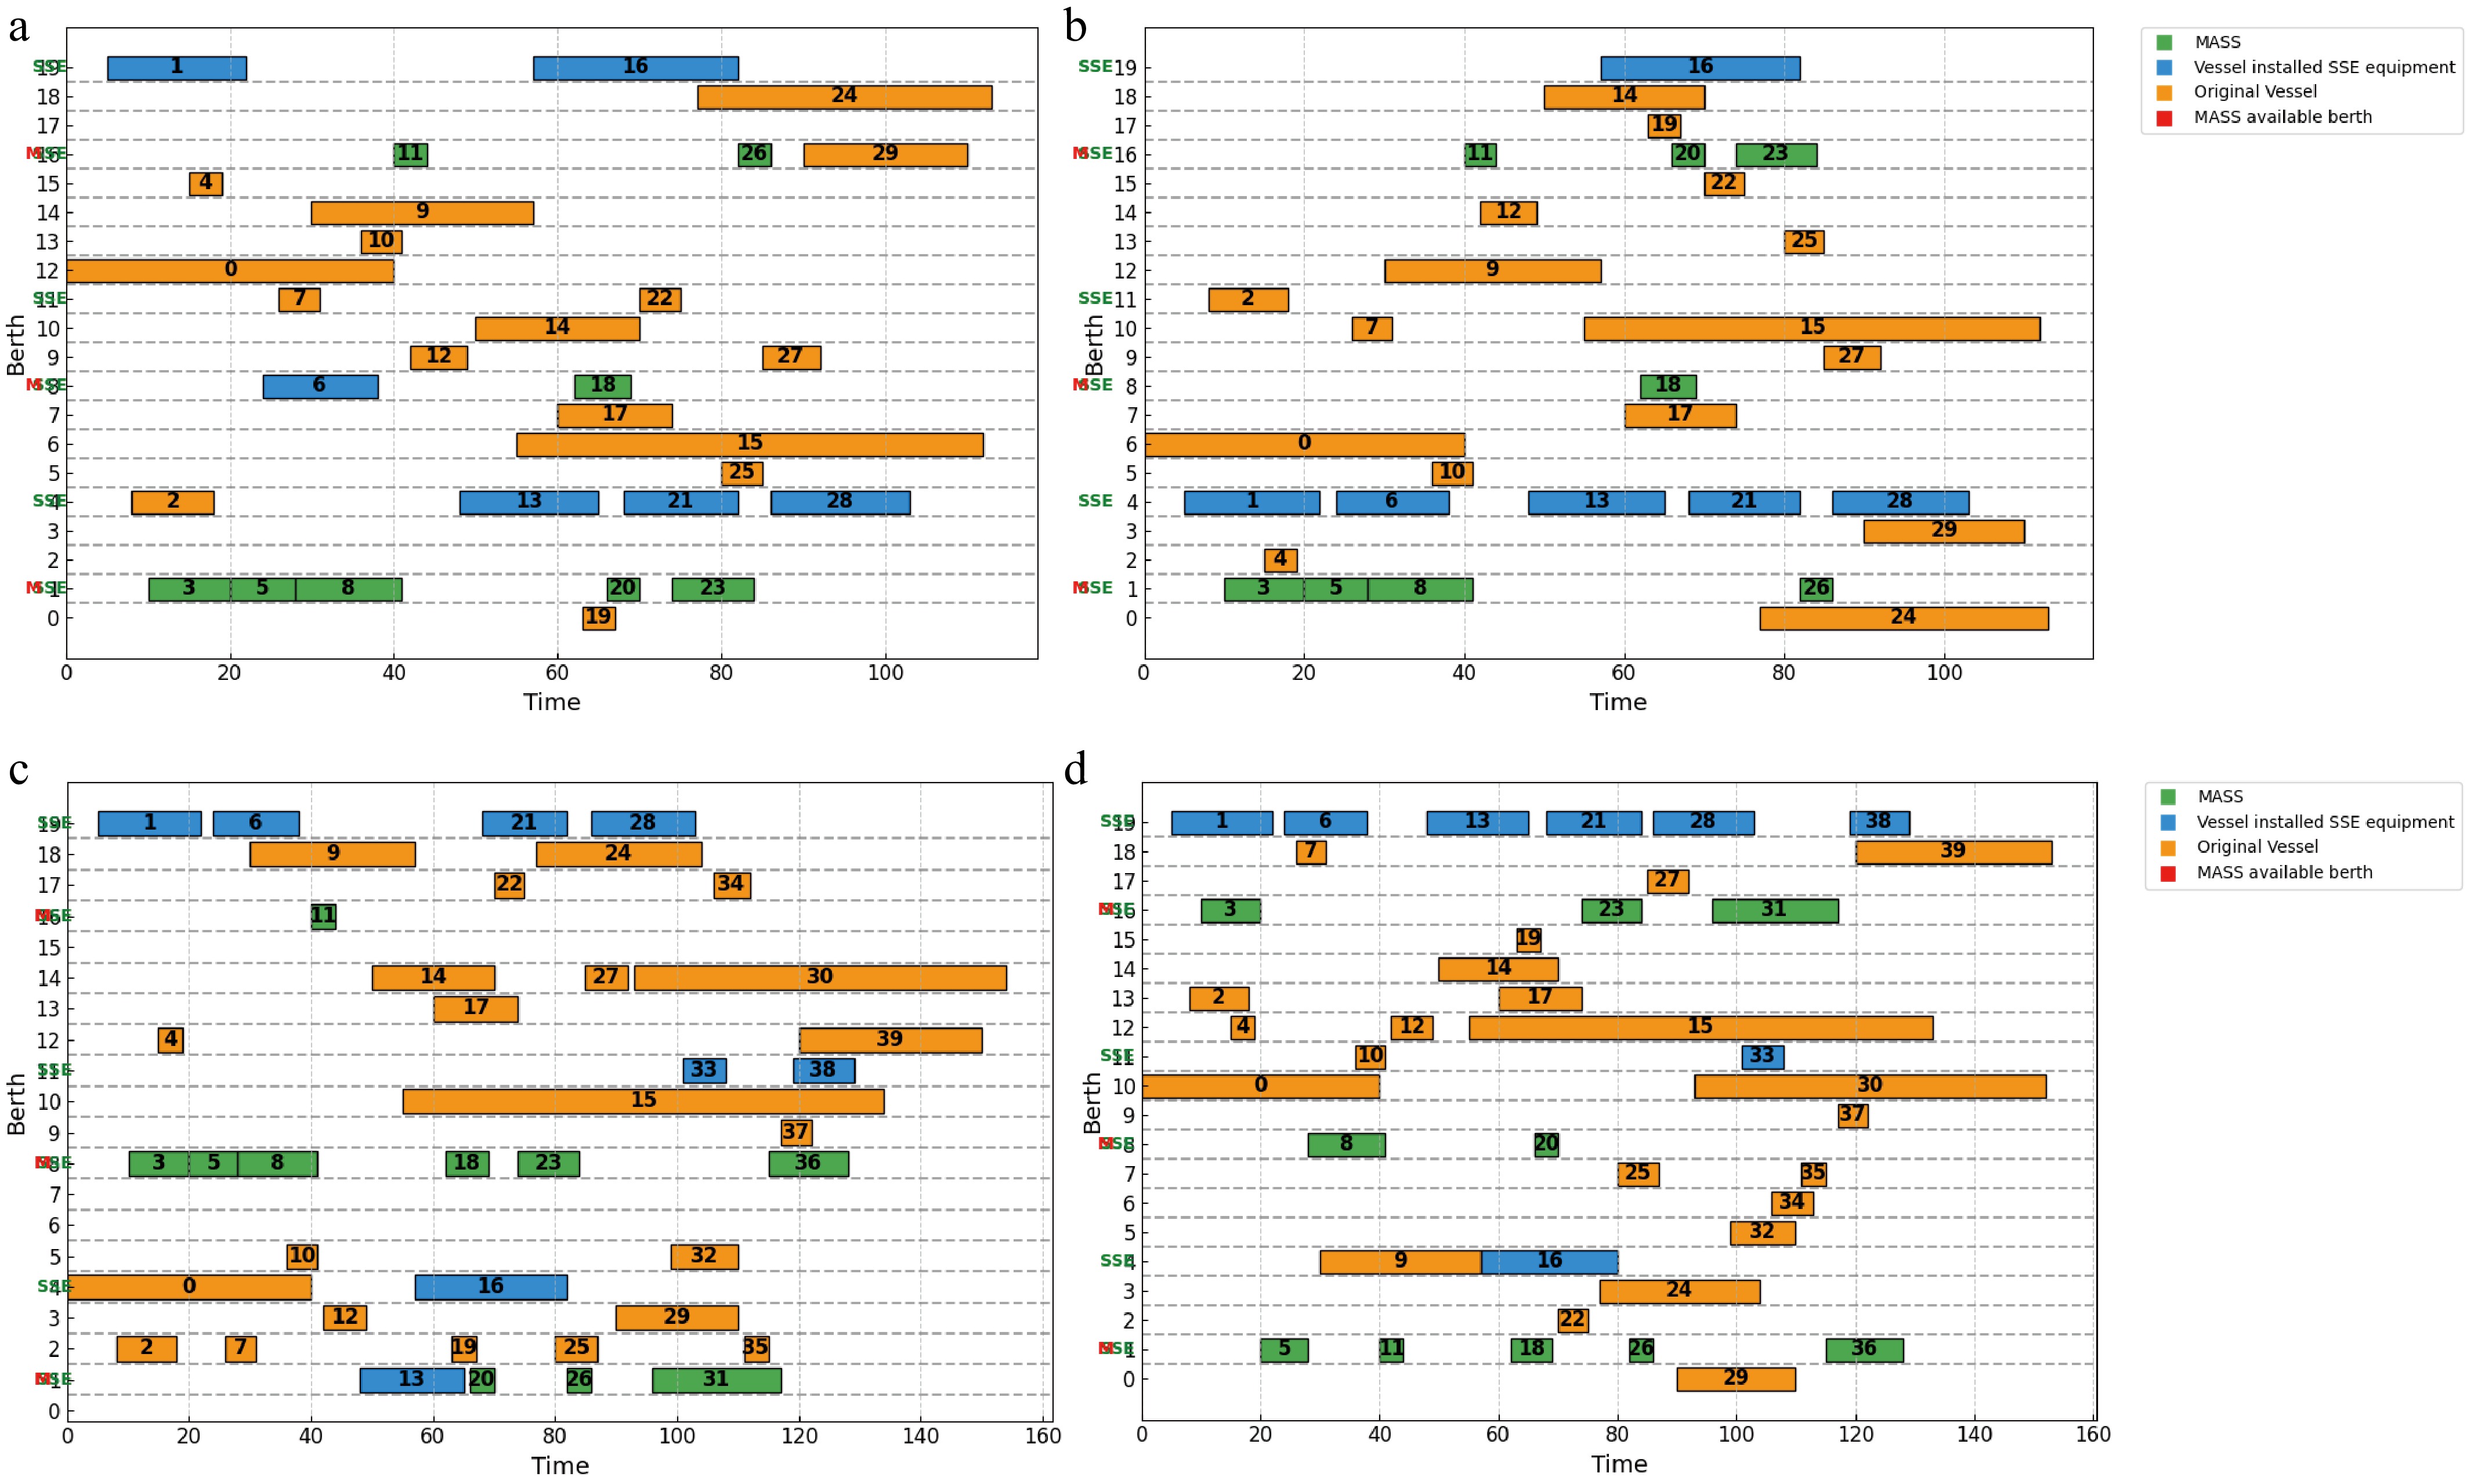
Figure 12.
Berth allocation schemes at YICT under Mixed-Strategy and Separated-Strategy. (a) $ \left| V\right| $ = 30 Mixed-Strategy; (b) $ \left| V\right| $ = 30 Separated-Strategy; (c) $ \left| V\right| $ = 40 Mixed-Strategy; (d) $ \left| V\right| $ = 40 Separated-Strategy.
As shown in Fig. 12, the Mixed-Strategy maximizes the utilization of berth resources. In contrast, the Separated-Strategy may result in idle MASS-available berths while other berths become congested. The Mixed-Strategy also demonstrates greater flexibility in managing time windows. On a larger scale, the distribution of vessel completion times under the hybrid strategy is more uniform, whereas ships tend to cluster under the separate strategy. Regarding planning period capacity, the hybrid berth allocation strategy outperforms the separate approach by employing globally optimized scheduling, allowing different types of ships to complementarily fill time gaps.
In today's busy and often congested port environments, achieving mixed operational scenarios involving both MASS and manned vessels requires not only consideration of factors such as port resource limitations but also the pursuit of efficient berth allocation strategies by port operators. The Mixed-Strategy, by breaking the fixed association between vessel type and berth, enables global optimization of resources. It outperforms the Separated-Strategy in terms of berth utilization, time efficiency, and scheduling flexibility, making it particularly suitable for scenarios where ship arrival times are highly variable, and the proportion of MASS changes dynamically.
Table 11 presents the experimental results of test cases using different solving algorithms. Regarding solution quality, the GA + ALNS algorithm combined with Q-learning improved the objective function value by an average of 4.39% compared to the hybrid heuristic GA + ALNS algorithm, and by 7.78% and 8.45%, respectively, compared to the traditional heuristic algorithms ALNS and GA. Through improved search logic and a dynamic adjustment strategy based on reinforcement learning, the global optimization capability was significantly enhanced, overcoming the common drawback of traditional heuristics being prone to local optima. Regarding solving time, although the GA + ALNS algorithm combined with Q-learning was slightly slower than the GA alone, it achieved time savings of 3.39% and 36.2% compared to GA + ALNS and ALNS, respectively. This indicates that introducing the improved strategy did not result in a substantial increase in time complexity. Its computational efficiency remains within a reasonable range acceptable for engineering applications, effectively meeting practical requirements for solution timeliness in complex combinatorial optimization problems. These results confirm that the GA + ALNS algorithm combined with Q-learning offers enhanced strategy adaptability and performance stability.
Table 11. Results of different algorithms at YICT under Mixed-Strategy and Separated-Strategy.
$ \left| V\right| $ Strategies Novel GA + ALNS GA + ALNS ALNS GA $ Ob{j}_{1} $ CT (s) $ Ob{j}_{2} $ CT (s) $ Ob{j}_{3} $ CT (s) $ Ob{j}_{4} $ CT (s) 30 Mixed 876,010.54 48.3 917,101.77 46.2 933,979.66 77.4 935,903.24 34.5 Separated 876,281.38 50.5 917,310.26 54.4 935,664.19 85.1 936,230.78 40.3 40 Mixed 1,187,623.68 62.8 1,223,508.41 64.9 1,305,649.48 94.3 1,317,627.52 56.7 Separated 1,218,904.03 65.2 1,292,038.28 70.6 1,334,883.52 98.7 1,352,913.46 60.4 Average 1,039,704.91 56.7 1,087,489.68 59.03 1,127,544.21 88.87 1,135,668.75 47.98 Sensitivity analysis and discussion
The impact of MASS quantity on costs and carbon emissions
-
Eight sets of cases under the different total numbers of berths
$ \left| B\right| $ $ \alpha $ $ \left| V\right| $ From Fig. 13, it is evident that as the number of MASS increases, total costs exhibit a general upward trend. This change is most pronounced when the number of berths is six. This phenomenon can be attributed to the requirement that an increase in the number of MASS necessitates a corresponding increase in the availability of berths. When berth resources are constrained, especially in scenarios where MASS vessels constitute 75% of the total fleet, these vessels experience extended waiting times for suitable berths. Consequently, this leads to heightened waiting costs and delay penalties, thereby escalating overall operational expenses.
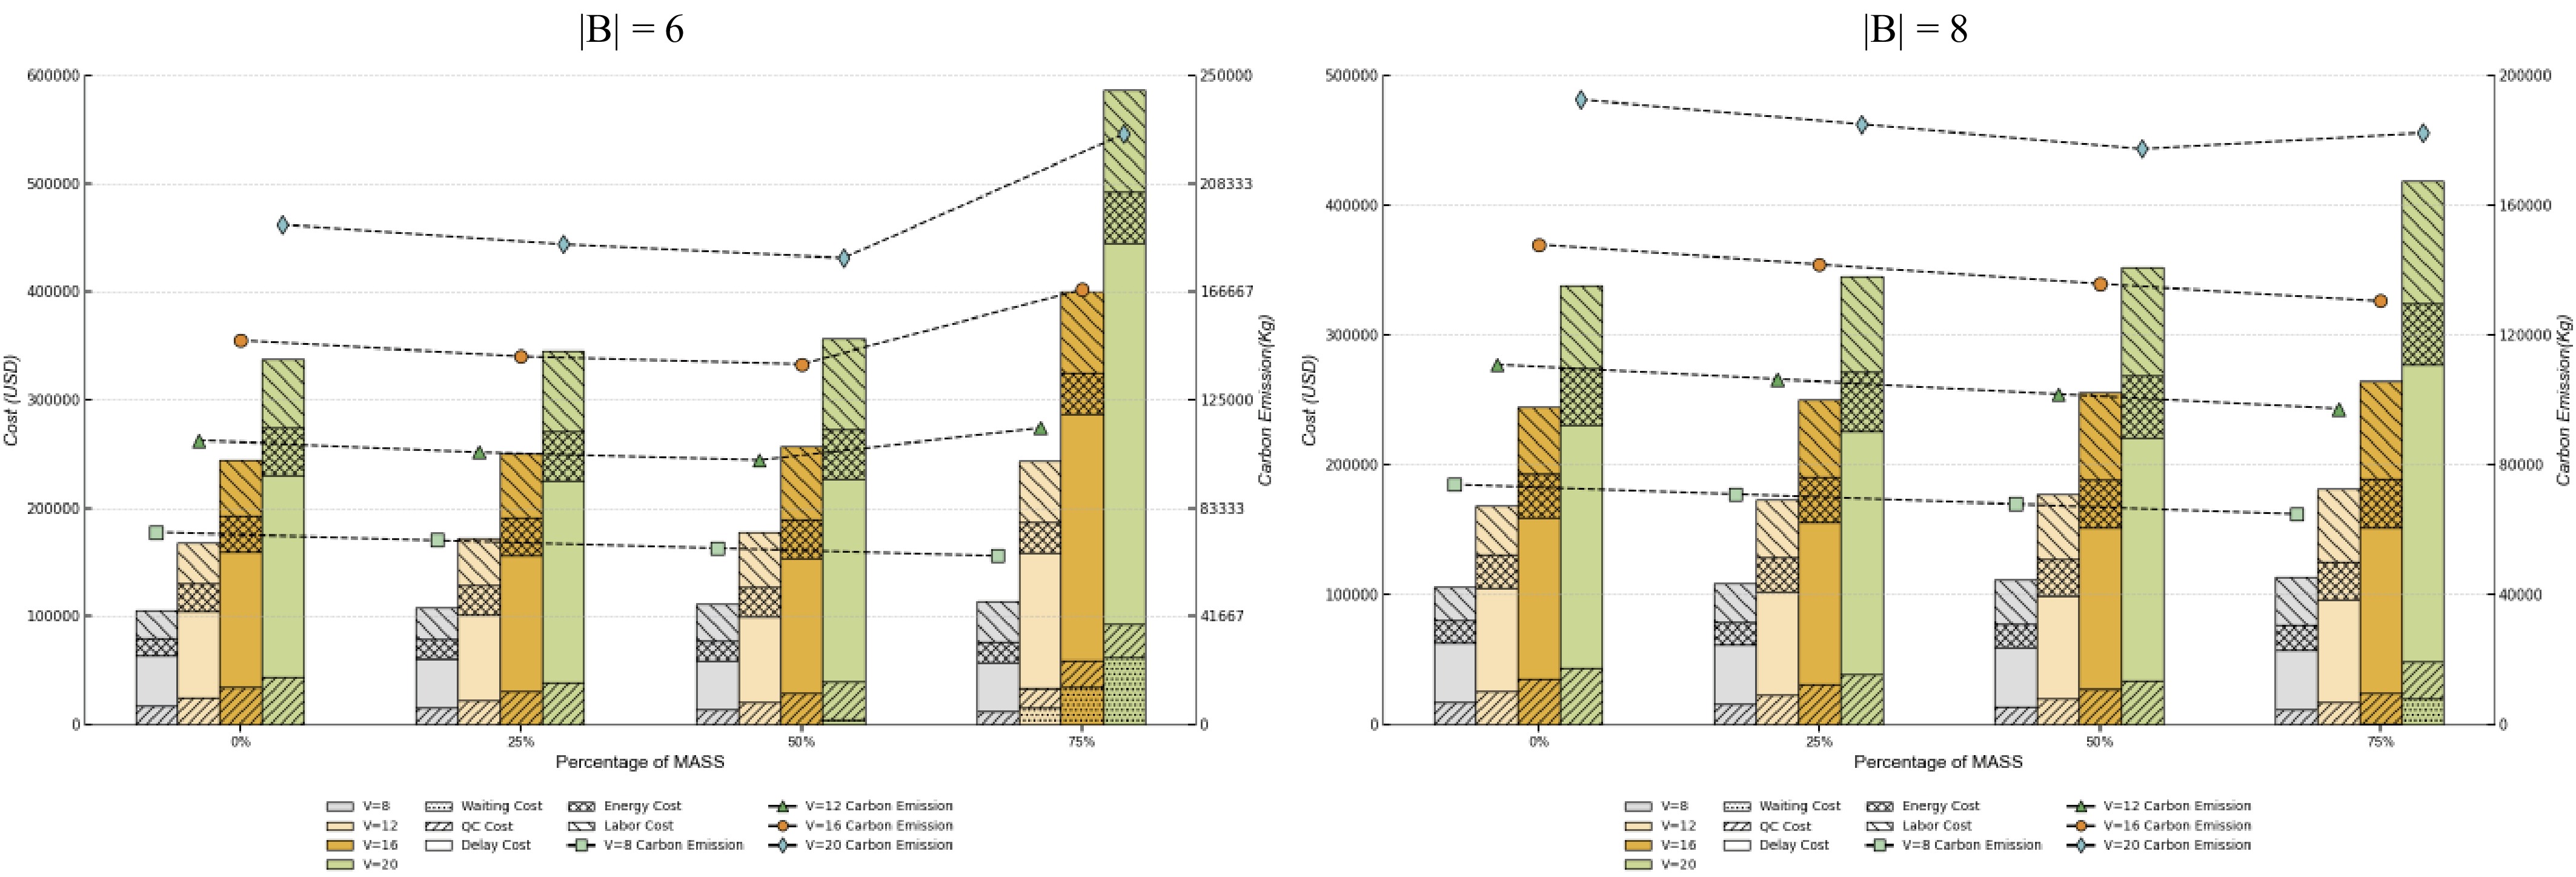
Figure 13.
The impact of MASS quantity on cost composition and carbon emissions.
The changes in carbon emissions illustrated in Fig. 13 indicate that MASS positively contributes to port greening, provided that sufficient berth resources are available, such as when the number of berths is eight. When the number of berths is six, and the proportion of MASS exceeds 50%, carbon emissions increase, with the rate of increase positively correlated with the total number of vessels. This further underscores the importance of having sufficient berth resources for MASS operations.
The impact of SSE facilities on costs and carbon emissions
-
With the purpose of assessing the impact of the number of SSE facilities on the total cost and carbon emissions under the Mixed-Strategy, eight sets of cases under different total numbers of berths
$ \left| B\right| $ $ \beta $ $ \left| V\right| $ 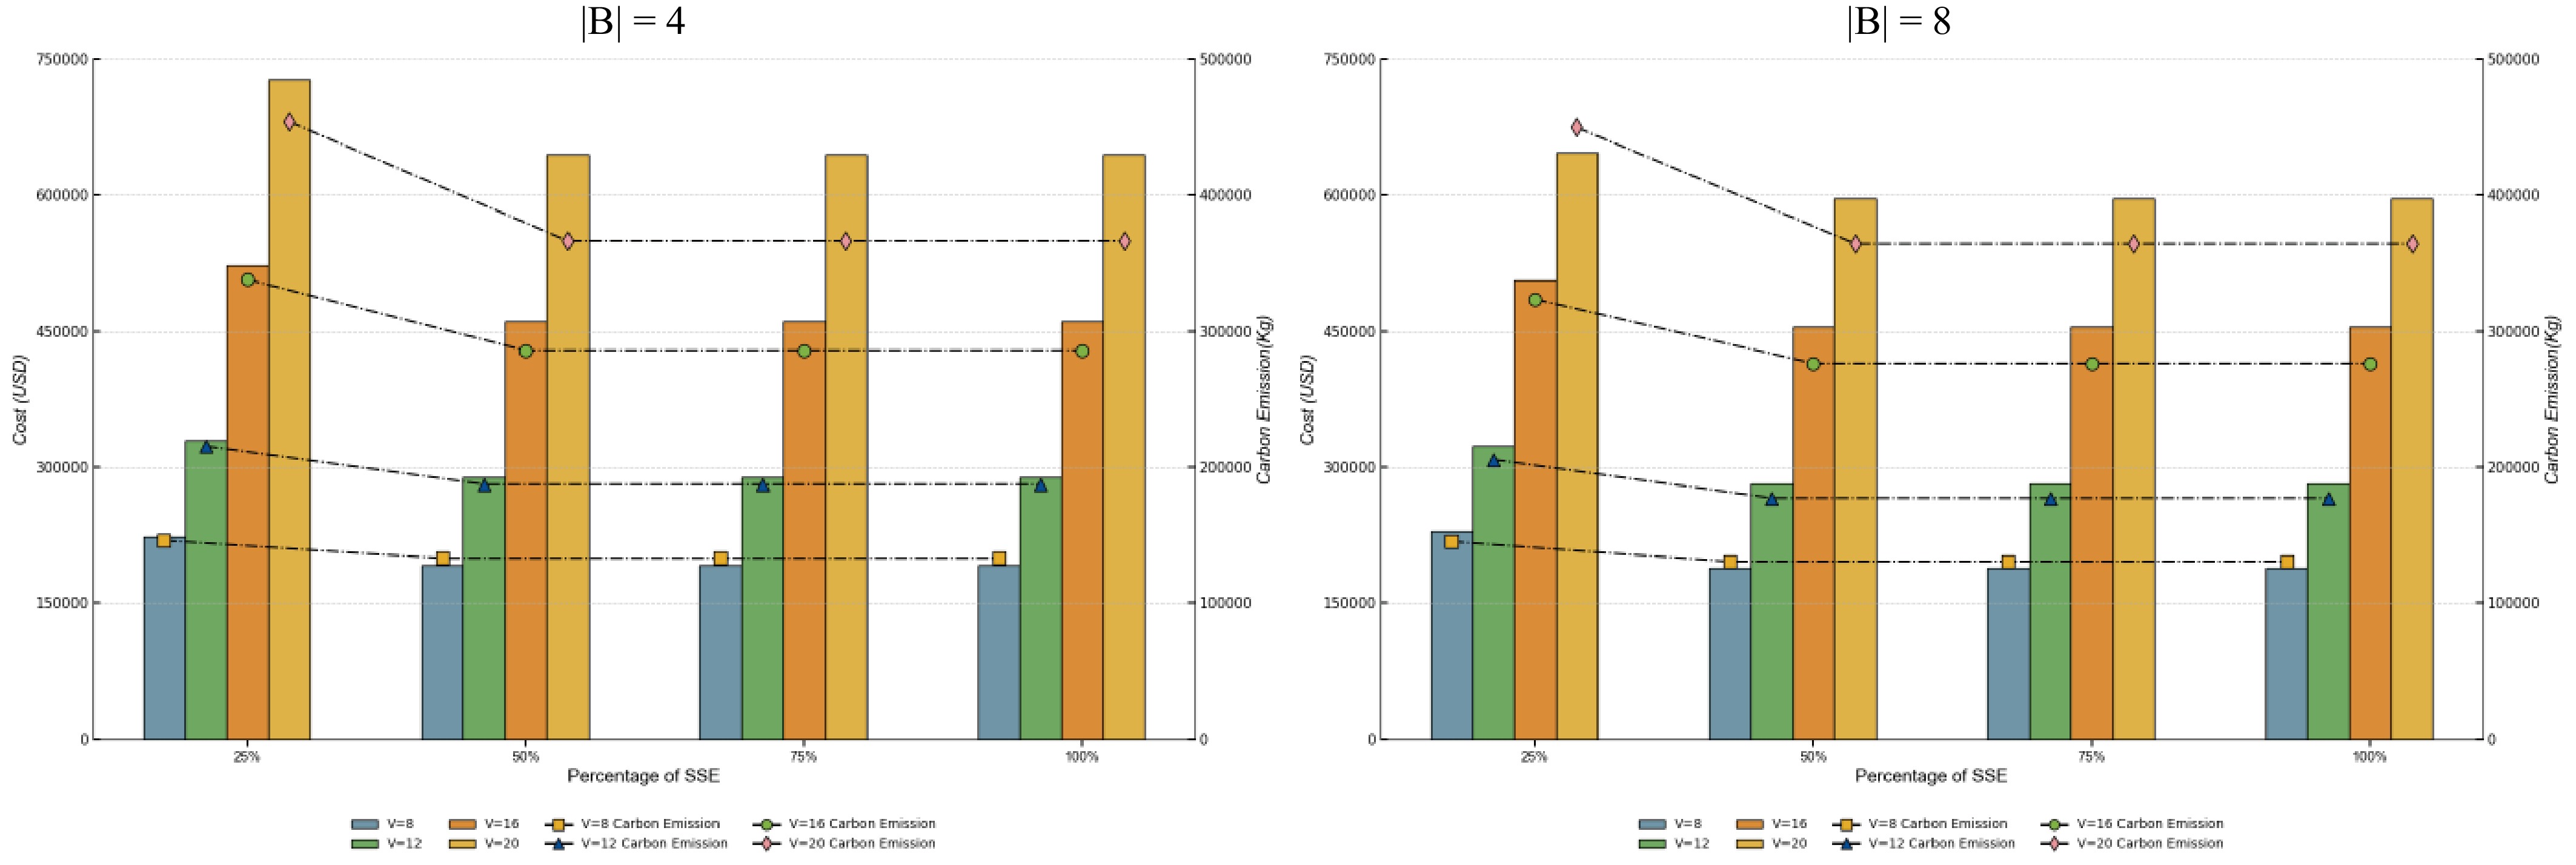
Figure 14.
The impact of the change in the quantity of SSE on total cost and carbon emissions.
From Fig. 14, as the proportion of berths equipped with SSE facilities rises from 25% to 50%, both total costs and carbon emissions decrease. This trend becomes increasingly pronounced as the total number of vessels increases. The preliminary analysis is attributed to the increased availability of SSE facilities, which has reduced the waiting time for some vessels intending to use the SSE. We found that as the number of SSE facilities increases, more vessels are willing to use the SSE. This trend has the potential to lower quay service fees for shipping companies through incentives from the port, while also contributing to a reduction in pollution emissions at the port.
However, when the number of SSE facilities exceeds 50%, this trend does not continue, and total costs as well as carbon emissions no longer decline. We have determined that this phenomenon may be attributed to the saturation of berth SSE equipment. This suggests that an overabundance of SSE facilities is not always beneficial. When the supply of these facilities surpasses the demand from vessels, it leads to a waste of SSE resources, which port operators aim to avoid.
The impact of MASS-available berth quantity on costs
-
In order to demonstrate the impact of the number of MASS-available berths in the Mixed-Strategy on total costs, we conducted multiple sets of cases examining the number of berths ranging from 3 to 10, as well as the number of MASS-available berths ranging from 1 to 10, and performed numerical experiments using a large number of vessels, with 30% of them being MASS. The experimental results are illustrated in Fig. 15.
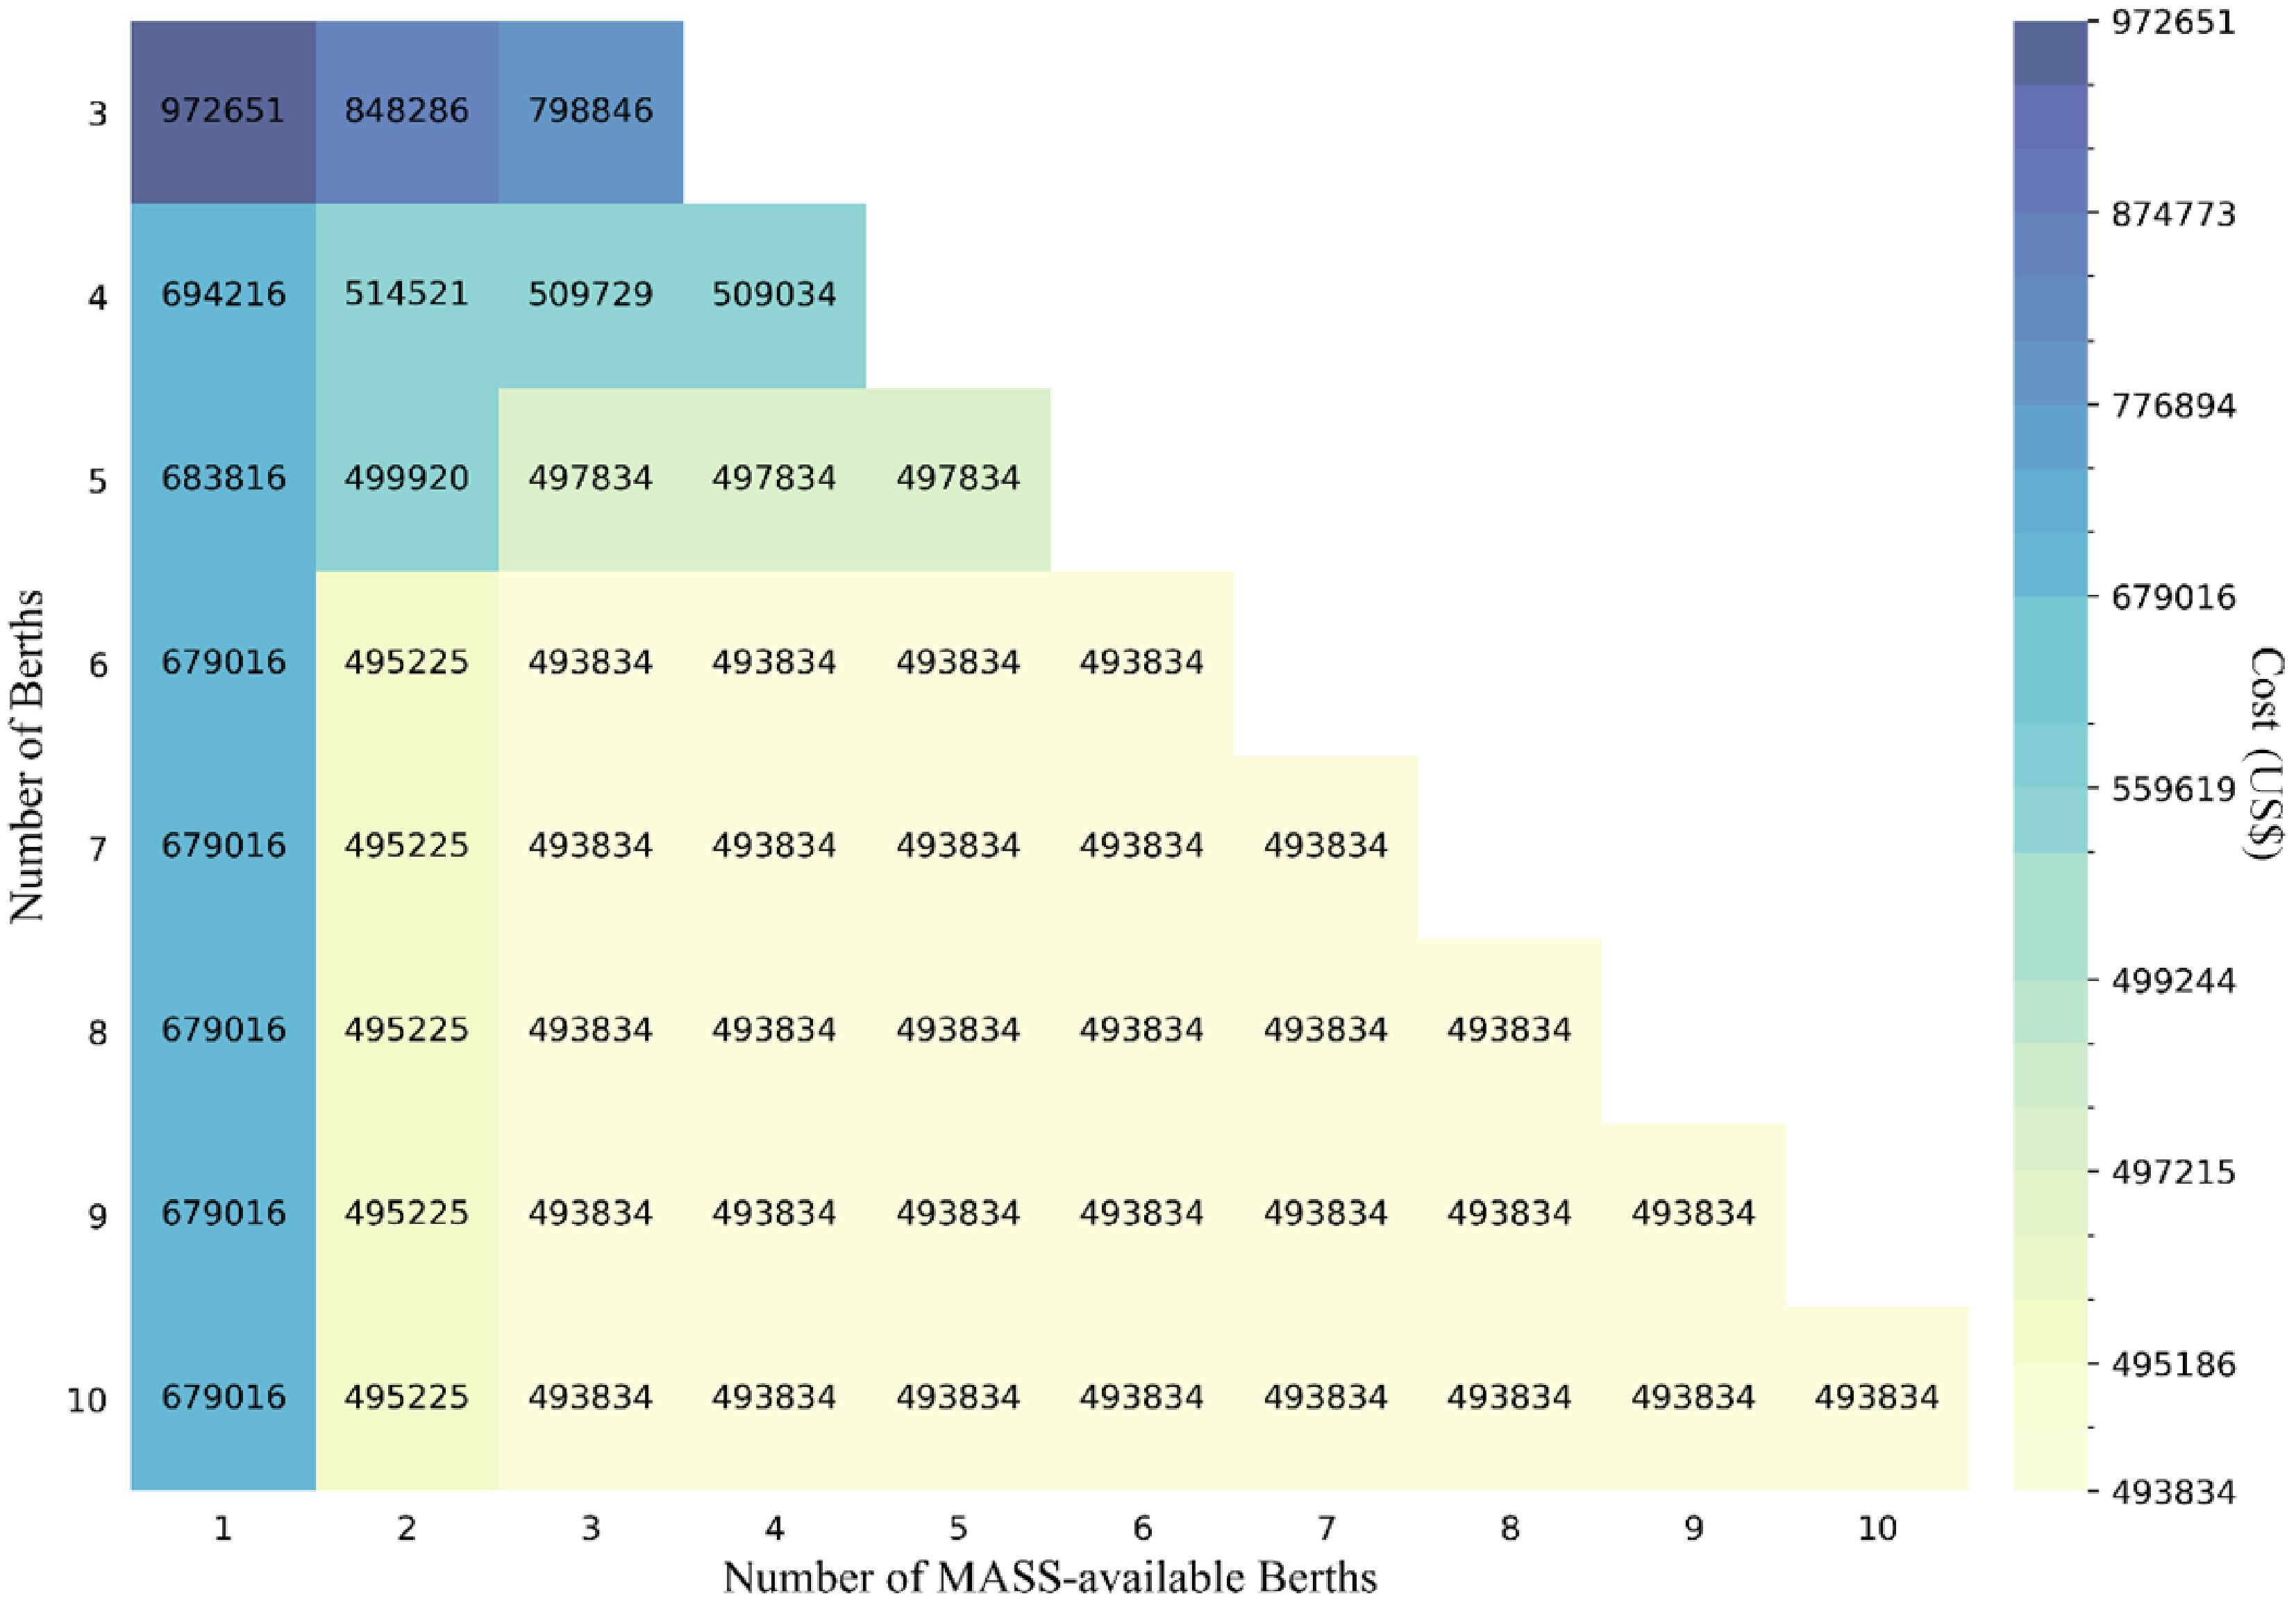
Figure 15.
The impact of the change in the quantity of MASS-available berths on total cost.
As shown in Fig. 15, when the number of berths is fewer than five, the total cost decreases as the number of MASS-available berths increases. This indicates that when the port berth resources are limited, the addition of MASS-available berths can reduce the waiting time of MASS and help alleviate congestion. However, once the number of berths exceeds four and the proportion of MASS-available berths reaches a specific threshold, the total cost no longer decreases and stabilizes at a constant value. This indicates that the current number of MASS-available berths represents the most appropriate port investment in terms of transformations. At this point, saturated MASS-available berths not only result in unnecessary investments for ports but also lead to the waste of berth resources.
-
This study addresses a combinatorial optimization problem involving berth allocation, quay crane assignment, SSE allocation, and terminal labor crew scheduling within a mixed operational scenario of MASS and manned vessels. To meet the port operational and berthing requirements for MASS, this study proposes two distinct berth allocation strategies: the Mixed-Strategy and the Separated-Strategy. From the perspective of port and shipping companies, this study quantifies the economic costs associated with vessel stays at the port in the model formulation. Two mixed-integer programming models are developed. Additionally, a novel GA + ALNS algorithm is employed to solve the problem. To enhance the search ability, a reinforcement learning method based on Q-learning is introduced. Through numerical experiments, the effectiveness of the model and the feasibility of the algorithm are verified. Compared to the Separated-Strategy, the model under the Mixed-Strategy reduces total costs by an average of 7.26% and carbon emissions by 14.65%. As related technologies advance and supporting facilities improve, the Mixed-Strategy is expected to become a more efficient mode of berth allocation. Furthermore, it is evident that the GA + ALNS algorithm combined with Q-learning surpasses Gurobi, GA + ALNS, GA, and ALNS, particularly for medium- to large-scale problems.
Based on the findings of this study, we propose several managerial insights and policy recommendations for port authorities and policymakers. First, the proportion of MASS significantly impacts optimization results, particularly when exceeding 50%, as scheduling costs increase sharply due to berth shortages. Therefore, phased integration pathways are recommended, starting with limited multi-purpose berths, as demonstrated in our YICT case study, before scaling up. Second, SSE proves highly effective for emission reduction; achieving 50% berth coverage significantly decreases total costs. Policymakers should implement differentiated pricing and subsidies to encourage adoption, while acknowledging that mandatory SSE requirements for MASS impose unequal cost burdens. Third, ports with limited resources must carefully evaluate upgrade investments for MASS-available berths. Our analysis indicates that total costs stabilize once a threshold is reached, suggesting that further renovations yield diminishing returns. Finally, regulatory frameworks should balance operational efficiency with safety requirements for autonomous operations by ensuring adequate remote monitoring capabilities and crew training protocols.
The construction and commercial operation of autonomous ships remain in the early experimental stage. Regarding economic boundary conditions, the managerial insights in this study are contingent upon an exogenous fleet composition and assume static infrastructure costs, without incorporating broader economic factors such as MASS vessel construction costs, autonomous system procurement, or life-cycle maintenance differentials. This study acknowledges a limitation concerning the fixed operational constraints for MASS. The energy supply mode and berth allocation for MASS are treated as predetermined parameters rather than decision variables, reflecting current operational protocols in which unmanned vessels require mandatory shore-side power connections and specialized berth assignments due to safety regulations and remote monitoring requirements. Consequently, variations in cost parameters, such as SSE pricing or fuel costs, influence only the energy choices of conventional manned vessels rather than the entire fleet, thereby limiting the scope of comprehensive sensitivity analysis. Furthermore, this fixed assignment approach may encounter scalability challenges under scenarios with high MASS penetration. Future research should investigate flexible MASS energy modes and berth selection once operational data on MASS flexibility become available. Additionally, dynamic berth reconfiguration strategies, such as modular SSE retrofitting for conventional berths, and emerging technologies including floating SSE facilities or mobile SSE units, should be explored to accommodate higher MASS penetration rates without compromising system efficiency.
-
The authors confirm their contributions to the paper as follows: study conception and design: Li N; analysis and interpretation of results draft: Li N, Li Y; data collection, manuscript preparation: Li Y. All authors reviewed the results and approved the final version of the manuscript.
-
All data generated or analyzed during this study are included in this article.
-
The authors declare that they have no conflict of interest.
- Appendix A NP-hard proof.
- Appendix B The pseudocodes for all algorithms.
- Appendix C The parameter settings of the algorithms.
- Copyright: © 2026 by the author(s). Published by Maximum Academic Press, Fayetteville, GA. This article is an open access article distributed under Creative Commons Attribution License (CC BY 4.0), visit https://creativecommons.org/licenses/by/4.0/.
-
About this article
Cite this article
Li N, Li Y. 2026. Berth related resource scheduling: the impact of the commercialization of Maritime Autonomous Surface Ships on port operations. Digital Transportation and Safety 5(3): 199−215 doi: 10.48130/dts-0026-0016 

Berth related resource scheduling: the impact of the commercialization of Maritime Autonomous Surface Ships on port operations
- Received: 26 March 2026
- Revised: 01 May 2026
- Accepted: 28 May 2026
- Published online: 30 September 2026
Abstract: With the commercialization of Maritime Autonomous Surface Ships (MASS), integrating MASS with port operations has become a critical issue. This study addresses a berth allocation problem that integrates quay crane assignment, shore-side electricity (SSE) allocation, and terminal labor crew assignment within a mixed operational scenario involving both MASS and manned vessels. Considering the berthing requirements of MASS, two berth allocation strategies, namely the Mixed-Strategy and the Separated-Strategy, are proposed. Two mixed-integer programming models are developed with the objective of minimizing the costs associated with vessel stays at the port. To solve the problem, a novel algorithm combining Genetic Algorithm and Adaptive Large Neighborhood Search (GA + ALNS) with Q-learning is employed. Numerical experiments demonstrate that the Mixed-Strategy reduces total costs by an average of 7.26% and carbon emissions by 14.65% compared to the Separated-Strategy. Additionally, the proposed algorithm outperforms benchmark methods. This study suggests that additional berth upgrades are essential as the number of MASS increases. Increasing the coverage of SSE facilities to 50% would significantly benefit the port both economically and environmentally. The number of MASS-available berths does not necessarily correlate with improved outcomes; rather, exceeding a certain threshold can lead to unnecessary investments and inefficient use of berth resources.