












-
The rapid digitalization of the maritime industry is radically transforming the structure of onboard decision-support systems. Modern intelligent bridge systems consolidate navigation sensors, communication systems, automation, and data analysis tools into integrated digital networks. However, despite technological progress, most operational systems still focus exclusively on navigational and engineering information, almost completely ignoring the dynamics of the operator's functional state.
As maritime technologies are rapidly evolving toward intelligent and human-centered digital systems, the continuous assessment of an operator's functional state is becoming a fundamental element of next-generation maritime decision-support systems. Integrating psychophysiological data into digital workflows enables proactive risk management rather than simply reacting to incidents as part of a traditional approach to safety.
Fatigue is widely recognized as one of the most persistent and complex threats to safety in transport systems, including maritime transport, aviation, and road traffic[1,2]. In the maritime domain, fatigue-related impairments are particularly critical due to the continuous nature of ship operations, prolonged watchkeeping periods, and the high cognitive demands placed on navigators responsible for maintaining safe navigation[3−5]. Numerous accident investigations indicate that fatigue contributes directly or indirectly to maritime incidents each year, posing risks to human life, property, and the marine environment[6,7].
As shipboard technologies evolve toward intelligent, human-centered systems, continuous monitoring of the operator's functional state is becoming a fundamental component of onboard decision-support systems. The integration of psychophysiological metrics into digital control loops enables a shift from traditional reactive safety assessment to proactive, real-time risk management.
The psychophysiological state of a ship navigator is shaped by a complex interaction of physiological, psychological, and environmental factors. Stress responses, which represent non-specific physiological reactions to external demands, significantly influence human performance and cognitive functioning[8]. Additional contributing factors include prolonged time spent on board and social isolation during long voyages[9], circadian rhythm disruptions associated with watchkeeping schedules[2], individual adaptive capacity and resilience[10], and coping strategies that determine the ability to recover from operational stressors[11]. These mechanisms collectively influence the depletion of functional resources, leading to progressive fatigue and reduced cognitive performance[12−14].
Fatigue-related degradation affects several critical aspects of operator performance, including situational awareness, decision-making quality, and reaction time[15−17]. In safety-critical maritime operations, such impairments may compromise the navigator's ability to process complex navigational information and respond to dynamic environmental conditions. Fatigue is therefore frequently identified as a contributing human-factor element in maritime incidents, often amplified by excessive workload, multitasking requirements, crew shortages, and complex navigational scenarios[6,18]. An analysis of maritime accidents shows that crew fatigue leads to the neglect or improper use of critical safety systems, in particular the Bridge Navigation Watch Alert System (BNWAS) and Electronic Chart Display and Information Systems (ECDIS)[19,20]. Under these conditions, reduced alertness and delayed reactions significantly undermine the effectiveness of technological safeguards designed to prevent navigational errors.
Investigations of maritime accidents have also revealed that fatigue may lead to neglect or improper use of critical safety systems such as the Bridge Navigational Watch Alarm System and Electronic Chart Display and Information Systems[19,20]. In such situations, decreased vigilance and delayed responses can significantly reduce the effectiveness of technological safeguards designed to prevent navigational errors. Despite the growing level of automation on modern ships, most navigation systems primarily process technical and environmental data, while the dynamic psychophysiological state of the navigator is rarely incorporated into operational control algorithms[21−23]. This creates a gap between the capabilities of modern maritime technology and the cognitive limitations of human operators working under conditions of fatigue and stress[24,25].
Research in other transport domains has demonstrated the effectiveness of physiological monitoring approaches for detecting fatigue and cognitive overload. Various studies have applied electroencephalography (EEG), biometric indicators, and behavioral monitoring to identify early signs of reduced alertness in drivers and operators[26−31]. Spectral and temporal characteristics of EEG signals have been shown to provide reliable indicators of cognitive workload, fatigue, and reduced vigilance under both simulated and real operational conditions[27,29,32]. Additional physiological indicators derived from wearable sensors and motion data have also demonstrated potential for detecting fatigue states in human operators[33].
In recent years, automated and intelligent approaches for fatigue detection have gained increasing attention. Machine learning techniques, including neural networks, long short-term memory models, and attention-based architectures, enable the integration of multimodal data for predictive fatigue monitoring[14,34−36]. Such systems support the transition from reactive safety management toward predictive decision support capable of identifying risk conditions before accidents occur[24,36]. Similar developments in aviation, industrial safety, and smart manufacturing highlight the importance of integrating cognitive monitoring into safety-critical operations[15,36−38].
At the same time, fatigue is influenced not only by physiological mechanisms but also by psychological and psychosocial factors. Coping strategies, self-regulation abilities, anxiety levels, and psycho-emotional stability significantly affect the manifestation and perception of fatigue[8,39,40]. Studies also emphasize the role of resilience and individual adaptation in maintaining performance under prolonged stress conditions[10,11]. Analytical approaches to evaluating stress and its impact on human performance have been explored in health and educational contexts as well[41,42].
Within the maritime sector, fatigue among seafarers is increasingly recognized as a systemic safety issue rather than merely an individual problem. Analytical reports, policy studies, and modeling approaches confirm the importance of sleep patterns, watchkeeping schedules, and workload management in maritime safety[3−7,12,13,18]. These findings align with broader research on human sleep physiology demonstrating the fundamental role of sleep regulation in maintaining cognitive performance and alertness[2].
Research on navigational decision-support systems and maritime risk management further demonstrates the potential for integrating human-factor considerations into operational systems[16,17,19−21,23]. Technical aspects of shipboard system performance, including engineering constraints and fuel-related operational characteristics, may also influence the reliability of shipboard systems and the broader safety environment in maritime operations[25]. Developments in operator training technologies and simulation environments also contribute to improving situational awareness and decision-making skills under complex operational conditions[43,44]. At the same time, broader institutional, legal, and social factors influence the implementation of such technologies in maritime practice, including jurisdictional issues and the rights and responsibilities of seafarers[42,45−48].
The broader technological context also demonstrates the increasing role of data-driven monitoring and intelligent decision support in safety-critical systems. Diagnostic modeling of marine machinery provides additional evidence of the importance of continuous technical-state assessment for reliable ship operation[49], while machine learning approaches increasingly support maritime accident severity classification[50]. Similar developments in road transportation demonstrate the applicability of interpretable machine learning to crash-severity assessment[51] and deep neural networks to adaptive traffic control[52]. At a wider digital-system level, smart-city studies illustrate the continuing expansion of interconnected digital services and data-driven infrastructures[53,54]. Collectively, these developments reinforce the transition toward integrated intelligent environments in which human-state monitoring can complement technical and operational data within predictive maritime decision-support systems.
Despite the extensive body of research on fatigue and human performance in transport systems, current maritime navigation systems rarely incorporate real-time monitoring of the navigator's psychophysiological state. Existing systems primarily process technical and environmental navigation parameters, while the cognitive and physiological state of the human operator remains largely outside automated safety frameworks[21−23]. At the same time, research on fatigue detection demonstrates that physiological signals such as EEG and other biometric indicators can provide reliable markers of reduced vigilance and cognitive workload[14,27,29−32]. However, these approaches remain insufficiently integrated into operational maritime decision-support systems, where technological infrastructures still focus mainly on navigational and engineering data[24].
Consequently, a significant scientific and technological gap persists in the development of integrated frameworks capable of combining physiological monitoring, psychological characteristics, and operational navigation data in real time.
As maritime technologies are rapidly evolving toward intelligent and human-centered digital systems, the continuous assessment of an operator's functional state is becoming a fundamental element of next-generation maritime decision-support systems. Integrating psychophysiological data into digital workflows enables proactive risk management, rather than simply reacting to incidents as part of a traditional approach to safety.
To address this gap, the present study aims to develop an automated system for monitoring and predicting navigator fatigue and stress by integrating psychophysiological indicators with operational navigation data. The proposed approach combines physiological signal analysis with intelligent data-processing methods to enable early detection of fatigue-related risk states during ship navigation.
The objective of the experimental investigation is not to derive population-level statistical inference but to demonstrate the feasibility and practical applicability of the proposed decision-support methodology under representative operational conditions. Accordingly, the experimental study should be regarded as a proof-of-concept validation of the proposed framework rather than a large-scale epidemiological or data-driven investigation.
The present study advances maritime safety research by addressing the integration of psychophysiological monitoring within operational safety management frameworks. The proposed approach establishes a connection between indicators of the navigator's psychophysiological state and operational navigation data, enabling a more comprehensive assessment of human performance in safety-critical maritime environments. The integration of these data sources supports the development of predictive safety strategies that extend beyond traditional reactive accident analysis toward the proactive identification of emerging risk conditions. In this context, the proposed framework also provides a conceptual foundation for future intelligent maritime navigation systems capable of incorporating both technological parameters and the cognitive limitations of human operators, thereby facilitating safer and more informed decision-making in complex maritime operations.
Scientific contributions of the study
-
The scientific contributions of this study are as follows:
‐A digital framework integrating psychophysiological monitoring with maritime decision-support functions is proposed.
‐A hybrid decomposition model separating circadian rhythms, adaptation processes, fatigue accumulation, and stress dynamics is developed.
‐A predictive digital representation of navigator functional states based on the Abstract Information Automaton (AIA) is introduced.
‐A methodology for integrating functional-state prediction into intelligent maritime operational support systems is established.
‐Experimental validation using simulator and onboard data confirms the feasibility of the proposed digital framework for proactive maritime safety management.
-
The proposed methodology is structured as a digital information processing system consisting of five sequential levels: physiological data collection, signal preprocessing, functional state decomposition, predictive modeling, and decision generation to support the operator. This architecture ensures the continuous conversion of raw physiological data into specific practical recommendations for the navigator's safety.
General research logic
-
The research aims to develop an automated approach to assessing and predicting fatigue and stress in ship operators as critical human risk factors in maritime safety systems. The general methodology is based on the analysis of the operator's psychophysiological signals, their temporal decomposition, and the construction of models describing the influence of various components of the functional state on the behavior of the ship's captain in the human-machine control loop (Fig.1).
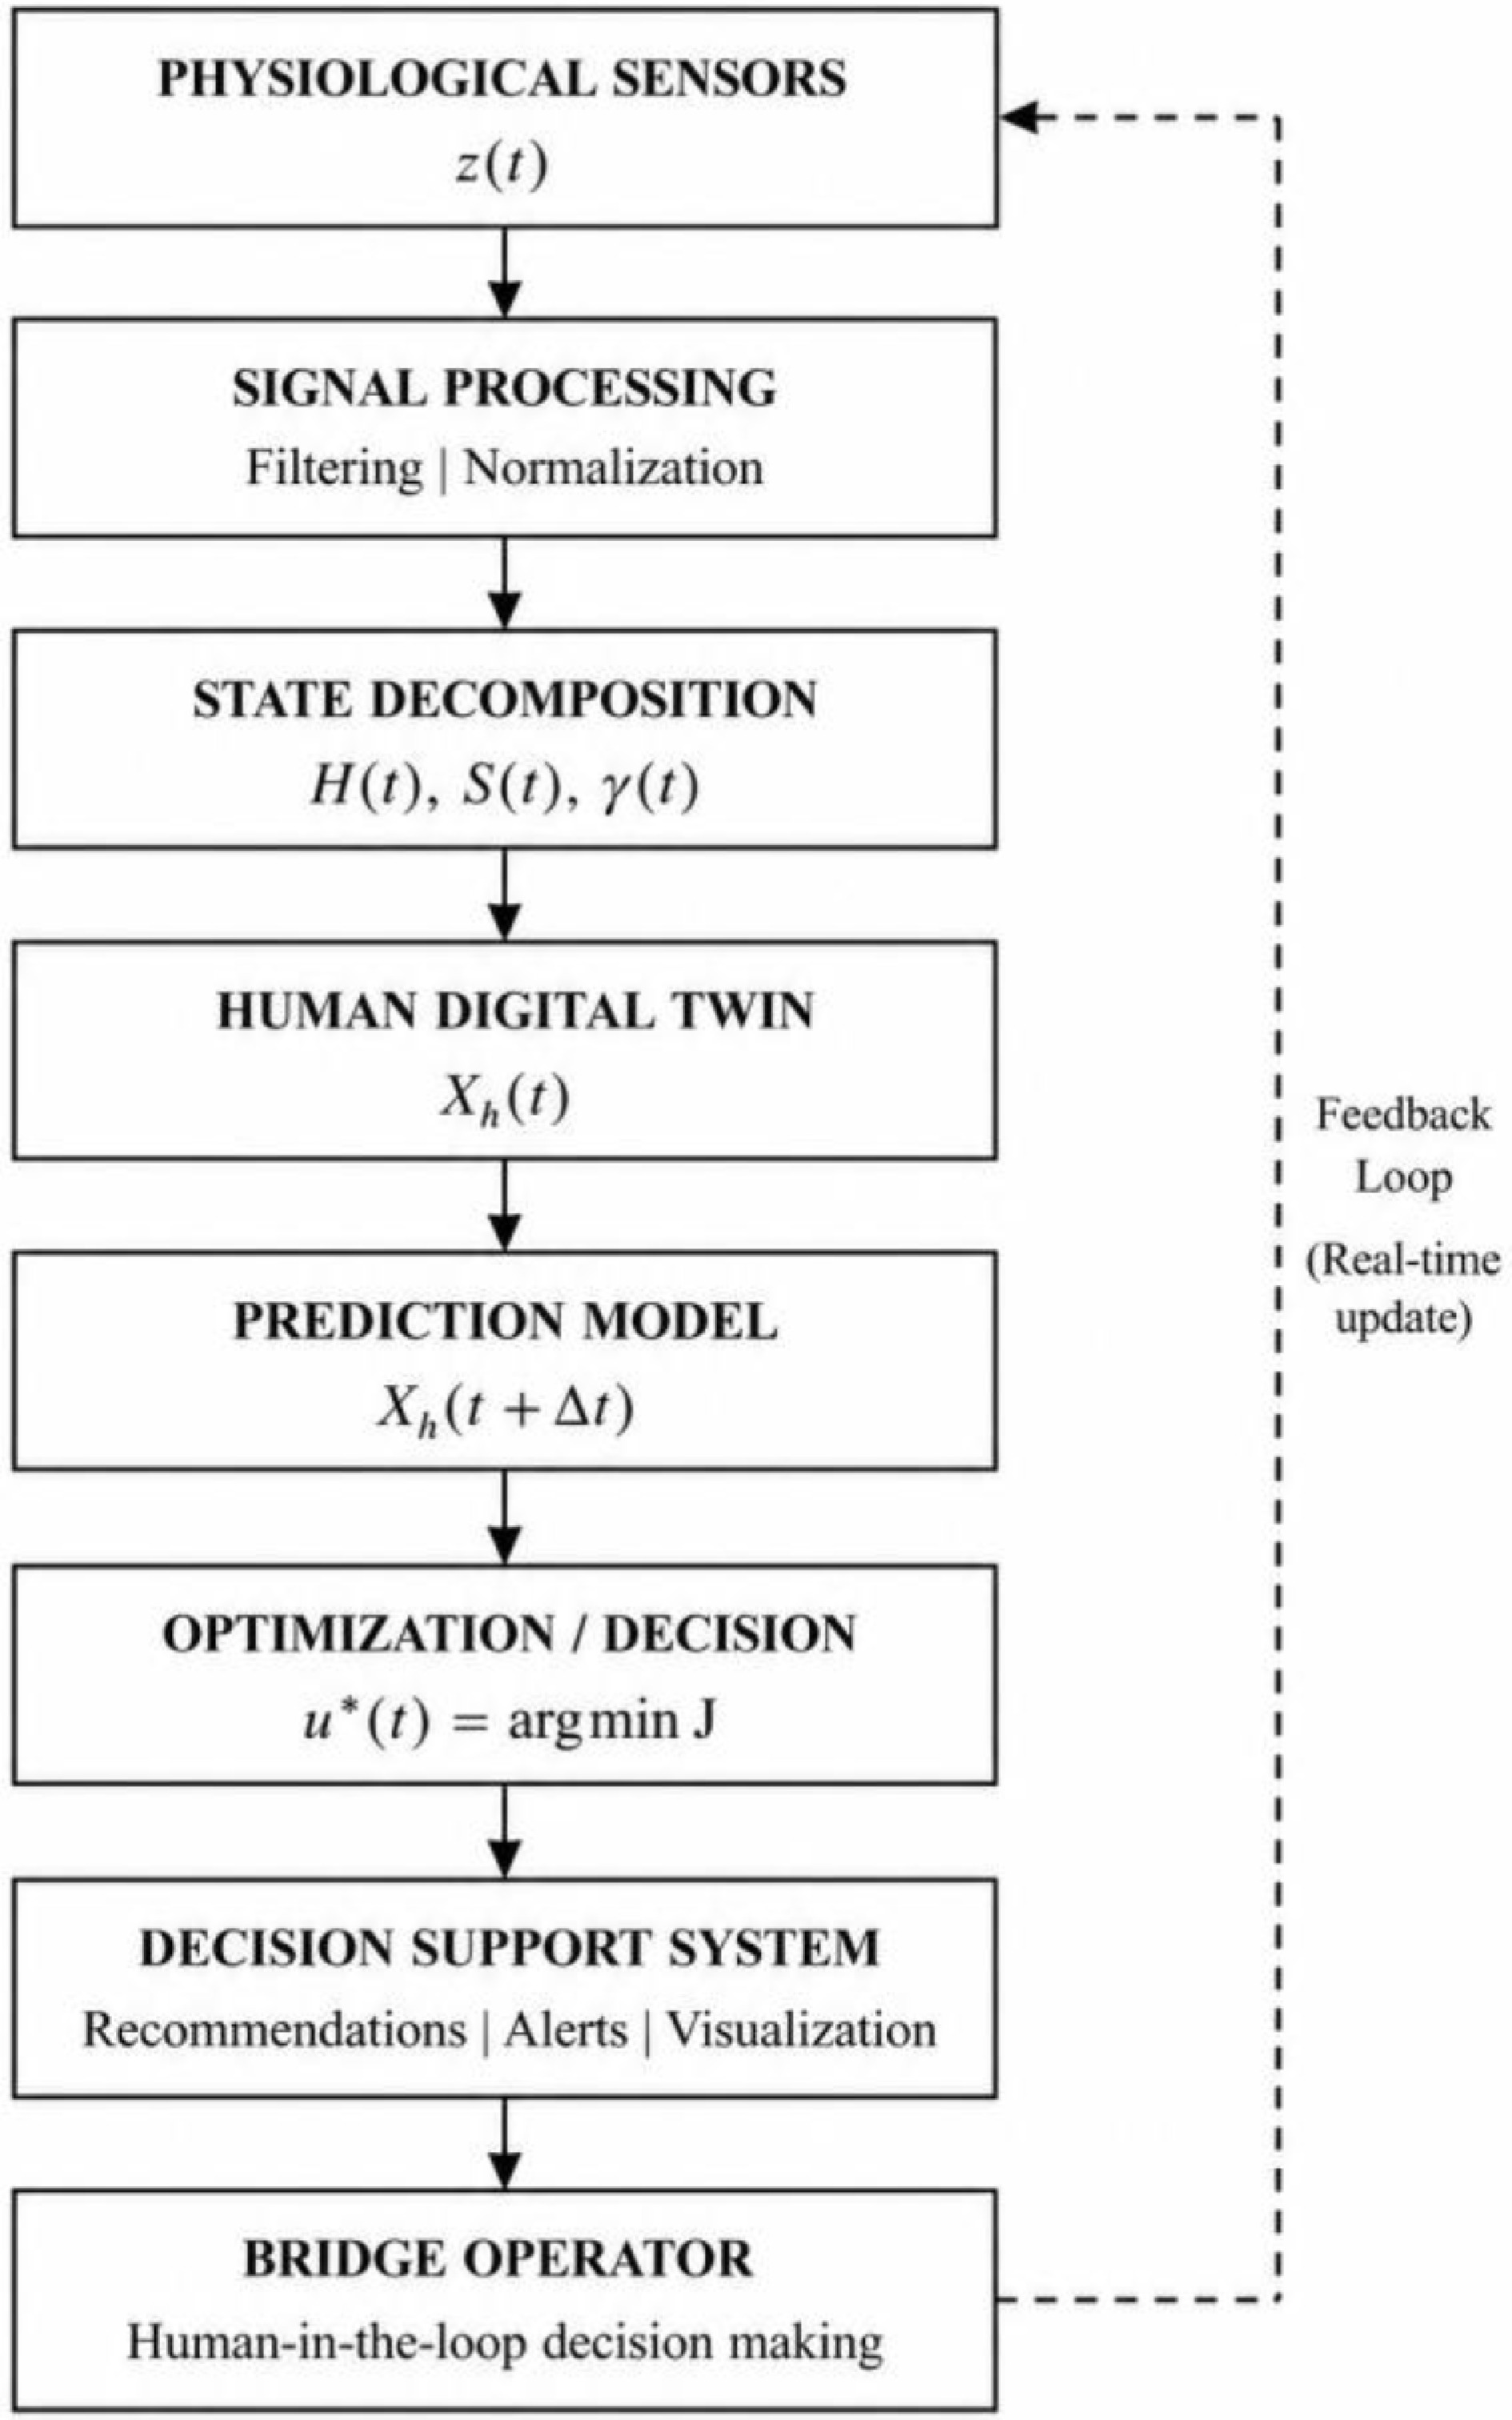
Figure 1.
Digital framework.
From the perspective of digital transformation, the proposed framework represents the navigator as an active digital component of the shipboard decision-support environment. Rather than treating physiological indicators as isolated medical measurements, the proposed approach incorporates them into a digital representation of operator functional states suitable for predictive monitoring and operational decision support.
The proposed approach combines the monitoring of physiological indicators, mathematical modeling of their dynamics, and decision support mechanisms focused on the early detection of dangerous conditions.
The experimental protocol was intentionally designed as a methodological validation study aimed at verifying the functionality and predictive capability of the proposed framework under controlled operational conditions. The focus of the investigation was on continuous longitudinal monitoring of each participant rather than on population-wide statistical inference.
Data and experimental conditions
-
To validate the proposed framework, psychophysiological data were collected under two complementary experimental conditions: (i) controlled experiments using the certified Full-Mission Bridge Simulator Navi Trainer 5000 and (ii) routine shipboard operations during actual navigation. The study involved seven professional navigators, including masters, chief officers, and second officers, representing different operational responsibilities and levels of navigational experience.
All participants underwent continuous psychophysiological monitoring under standard watchkeeping conditions and varying levels of navigational workload. Depending on the operational schedule and voyage duration, the monitoring periods ranged from 15 to 46 d. The experimental design enabled the observation of navigator functional states under both standardized simulator scenarios and real maritime environments.
Because physiological signals were recorded continuously throughout the monitoring period, the collected data formed longitudinal time series rather than discrete, independent observations. Accordingly, the primary objective of the experimental study was to investigate temporal dynamics of navigator functional states and to validate the predictive capability of the proposed framework under representative operational conditions rather than to perform population-wide statistical inference.
The field and simulation-based research program combined simulator experiments to replicate predefined navigation scenarios with onboard monitoring to evaluate the system under real-world navigation conditions. This complementary methodology ensured the theoretical and methodological verification and practical validation of the developed approach to predictive support for navigational decision-making.
Modeling of psychophysiological state
-
The analysis of time series of psychophysiological indicators was carried out by decomposing them into separate components corresponding to the baseline level of activity, circadian influences, adaptation processes, fatigue accumulation, and random or stress-induced deviations. Regression models and transfer functions were used to quantitatively describe the relationships between these components and the operator's behavioral characteristics.
This approach allows formalizing the influence of the psychophysiological state on the effectiveness of the ship operator's actions and describing the dynamics of changes in the functional state over time.
Abstract Information Automaton and forecasting
-
To integrate the modeling results into the decision support system, the concept of an Abstract Information Automaton (AIA) was used. AIA generates generalized information about the current and predicted functional state of the operator based on identified models and allows assessing trends in the development of fatigue and stress. The use of AIA enables proactive response to dangerous changes in the navigator's condition before the onset of obvious symptoms of decreased performance.
Validation of the approach
-
The effectiveness of the proposed methodology was evaluated by comparing model estimates with actual data obtained under experimental conditions. The results demonstrated that the proposed modeling framework adequately captured the principal temporal characteristics of navigator functional states and is suitable for predictive monitoring within maritime human-factor decision-support systems.
-
The circadian rhythm is the human biological clock that regulates the daily cycle of activity. To identify its chronological influence on each participant in the experiment, heart rate (HR) observations were collected over a period of 15 to 46 d. Each day was divided into 6-h intervals.
By calculating the average HR for each time segment, datasets were generated corresponding to 00:00, 06:00, 12:00, and 18:00 hours. Using the linear interpolation method, weighting coefficients for the circadian rhythm were determined, ranging from 0 to 1.
The presented results demonstrate the operational feasibility of the proposed framework. They should therefore be interpreted as methodological validation rather than evidence intended for population generalization.
Based on this, graphs were constructed to visualize the influence of circadian rhythms on HR variations, serving as a basis for further development of a multiplicative model. This model integrates circadian phase data as a key component in forecasting HR and, by extension, in evaluating the psychophysiological condition of the navigator in real time.
The mathematical framework combines time-series decomposition, robust regression analysis, transfer-function identification, and statistical hypothesis testing to characterize the temporal evolution of navigator functional states. Time-series decomposition was used to separate circadian, adaptive, fatigue-related, and stochastic components of physiological signals. Robust regression was applied to reduce the influence of occasional physiological outliers, while transfer-function models were employed to describe the dynamic relationships between physiological indicators and functional-state variables. Model development assumed temporal continuity of physiological processes, local stationarity within individual observation intervals, and independence of model residuals. Model performance was subsequently evaluated using the coefficient of determination (R2), Fisher's F-test, approximation error, and residual analysis to verify the adequacy and predictive capability of the proposed models.
$ {f}_{\left(x\right)}={f}_{\left({x}_{1}\right)}+\left(x-{x}_{1}\right)\dfrac{f\left({x}_{2}\right)-f\left({x}_{1}\right)}{{x}_{2}-{x}_{1}}. $ (1) Equation (1) was used to interpolate circadian weighting coefficients between consecutive observation intervals. This procedure ensured a smooth representation of circadian influences and provided the basis for subsequent decomposition of physiological signals into their principal functional components.
The obtained samples were analyzed using the t-test, a statistical test for assessing significance in small sample sizes. Given that the samples were of equal size, the following formula was applied:
$ t=\dfrac{\left| {M}_{1}-{M}_{2}\right| }{\sqrt{\dfrac{\sigma _{1}^{2}}{{N}_{1}}+\dfrac{\sigma _{2}^{2}}{{N}_{2}}}} ,$ (2) where, M1 and M2 are the sample means, σ1 and σ2 are the standard deviations, and N1 and N2 are the sample sizes[21]. Table 1 presents the similarities of circadian rhythms according to the t-test.
Table 1. Similarity of circadian rhythms according to the t-test.
Rank 2nd Officer (a) Ch. Officer (b) Master (c) 2nd Officer (d) Ch. Officer (e) Ch. Officer (f) 2nd Officer (g) 2nd Officer (a) − SZ NSZ NSZ NSZ NSZ NSZ Ch. Officer (b) SZ − NSZ UZ NSZ UZ SZ Master (c) NSZ NSZ − NSZ NSZ NSZ NSZ 2nd Officer (d) NSZ UZ NSZ − NSZ NSZ NSZ Ch. Officer (e) NSZ NSZ NSZ NSZ − NSZ NSZ Ch. Officer (f) NSZ ЗНВ NSZ NSZ NSZ − NSZ 2nd Officer (g) NSZ SZ NSZ NSZ NSZ NSZ − SZ - Significance Zone, NSZ - Non-significance Zone, UZ - Uncertainty Zone. Based on the obtained data, the graph was plotted (Fig. 2).
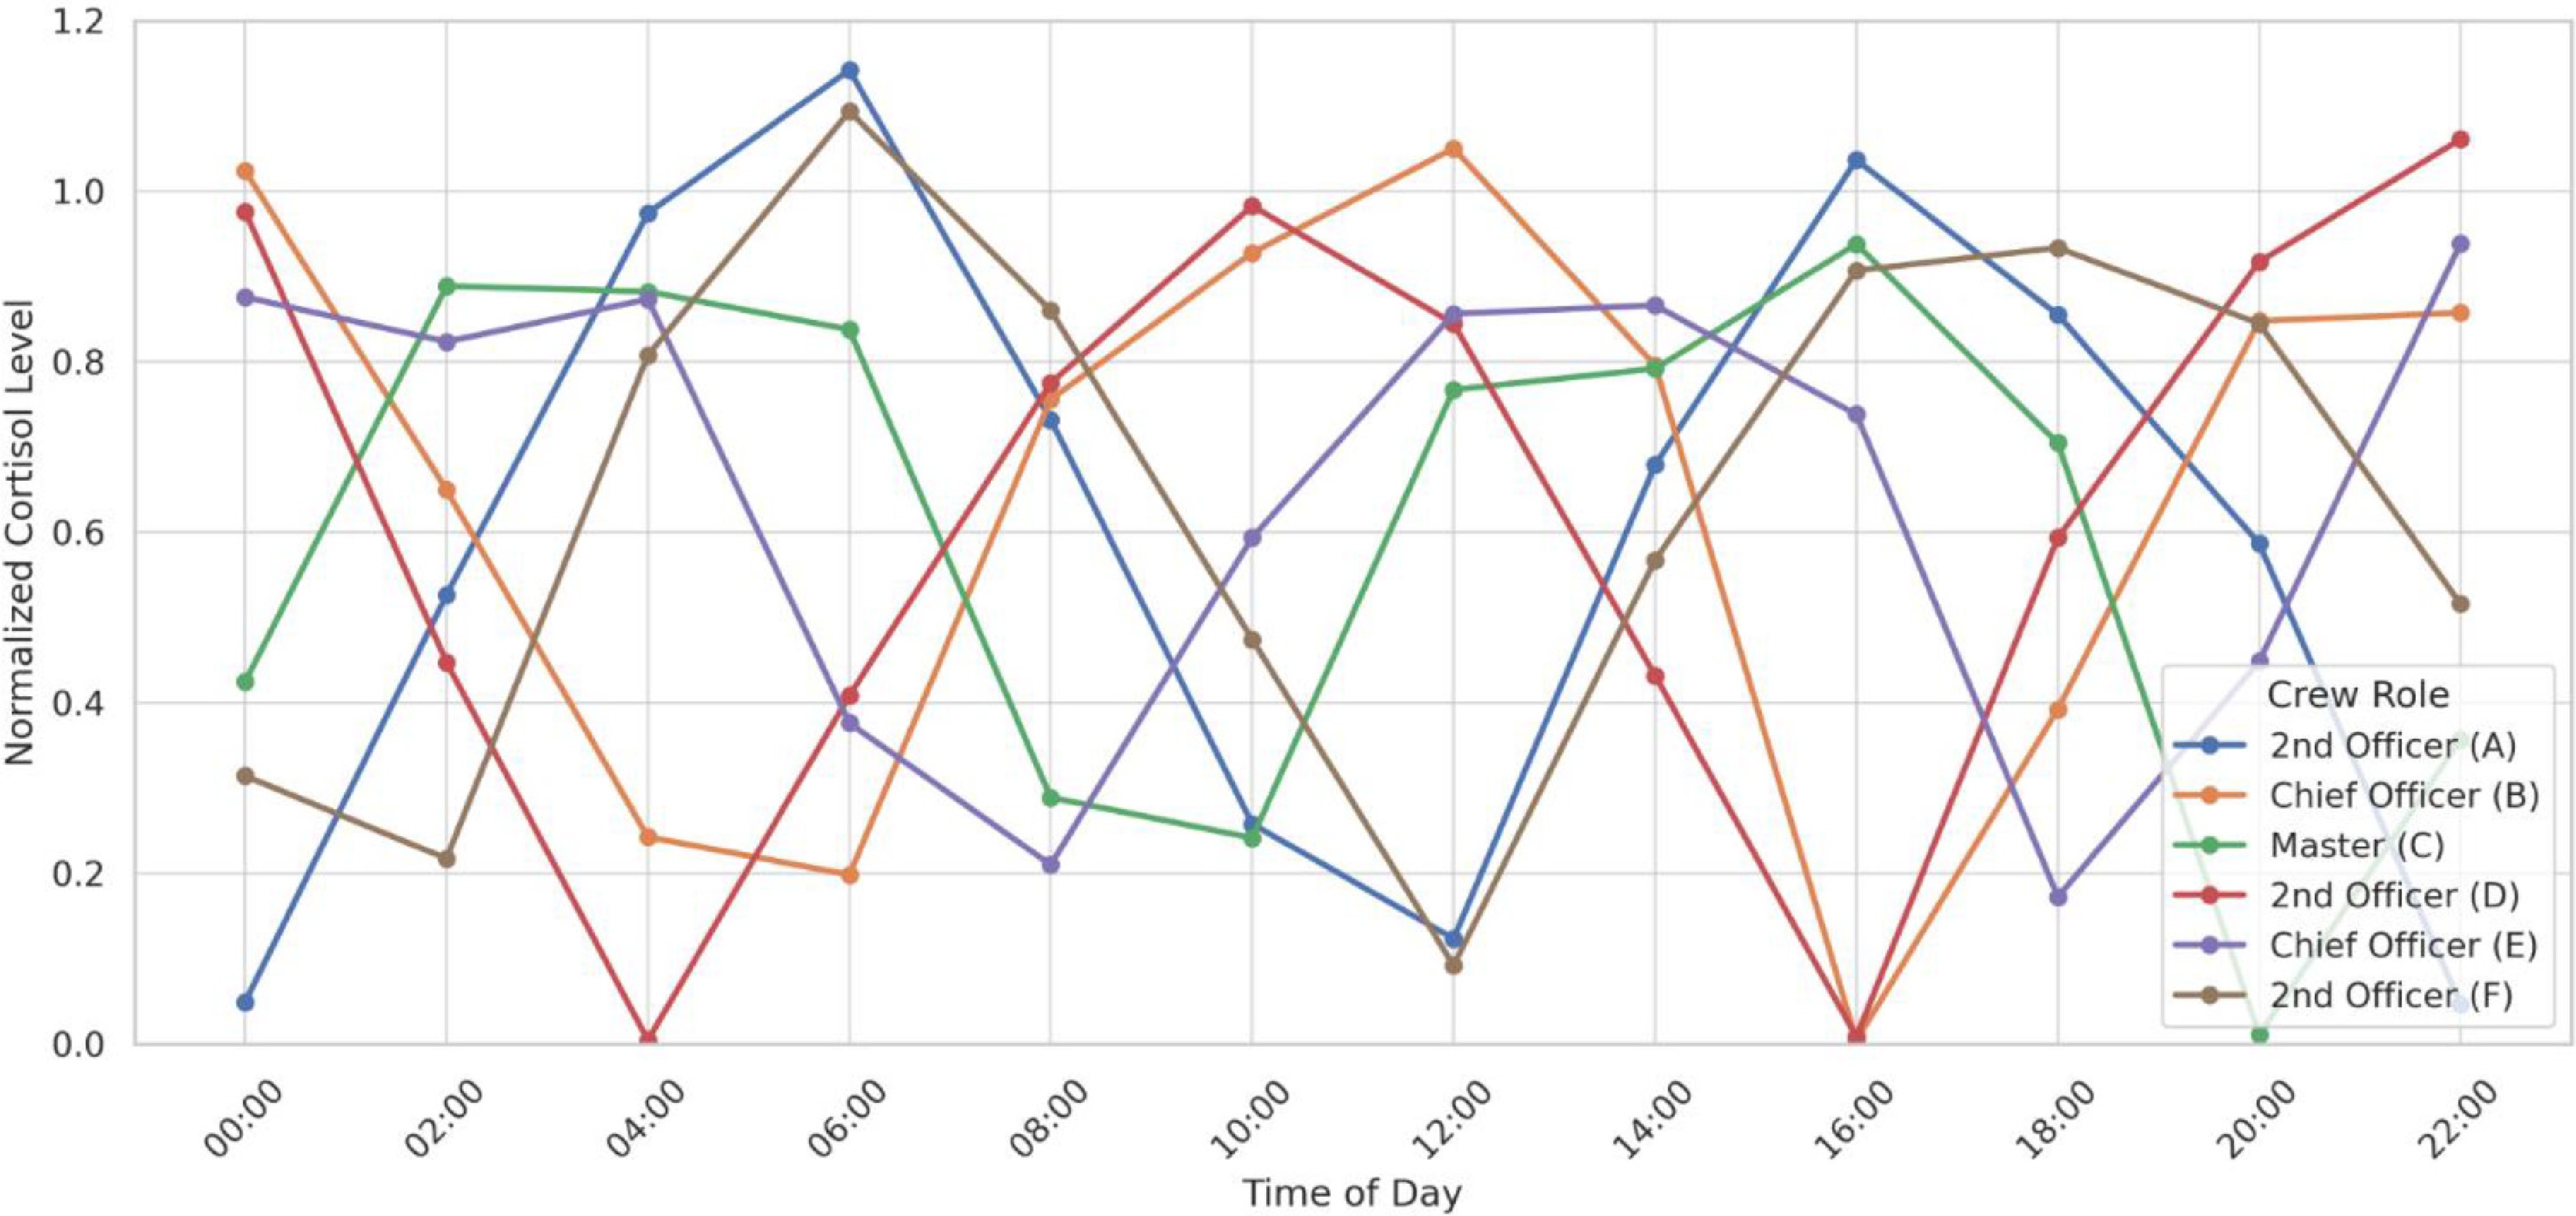
Figure 2.
Distribution of circadian rhythms in crew members based on t-test cortisol concentration results.
Statistically, circadian rhythms differ only marginally and could be considered equivalent; however, differences that are statistically insignificant should not always be disregarded from a physiological perspective. For this reason, graphical modeling is commonly used[26]. Indeed, the graph clearly shows that each respondent has unique tendencies and rates of state changes, as well as different timings of activity peaks and troughs, implying that the timing of potential critical events will also vary.
Formalization of the individual biological activity of a ship operator
-
According to the literature, the baseline state of the organism corresponds to a state of rest, which is influenced by multiple factors, including stress, time spent on board, fatigue, individual adaptive characteristics, and the circadian rhythm. The circadian rhythm defines the daily pattern of physiological activity, with responses inherently interconnected through this cyclicity. To characterize the general state of rest, time series were constructed and analyzed using a multiplicative model[21].
The general form of the multiplicative model is
$ Y=TSE,$ (3) where, each level of the time series is represented as the product of the trend (T), seasonal (S), and random (E) components.
The components of the time series describing changes in the physiological parameter of heart rate variability (HRV) were calculated as follows:
Moving average for all time points (to eliminate the seasonal component)
$ {\overline{y}}_{n}=\dfrac{{y}_{t}+{y}_{t+1}}{2},$ (4) where, yt is the heart rate value at the initial time point, and yt+1 is the value at the subsequent time point within the period n.
The values were aligned with the actual time points by calculating the averages of two consecutive moving averages, referred to as centered moving averages:
$ \overline{y}_{n}^{\text{'}}=\dfrac{{\overline{y}}_{{{n}_{1}}}+{\overline{y}}_{{{n}_{2}}}}{m},$ (5) where, n1 and n2 are the periods of time, and m is the number of consecutive observations.
Seasonal component estimates were derived by dividing the actual series levels by the centered moving averages
$ \dfrac{{y}_{t}}{{\overline{y}}_{n}} $ The average estimate of the seasonal component
$ {\overline{S}}_{i}=\dfrac{\displaystyle\sum\limits_{n}^{n+1}\left(\dfrac{{y}_{t}}{\overline{y}_{n}^{\text{'}}}\right)}{n+1}. $ (6) Corrected seasonal component
$ {S}_{i}={\overline{S}}_{i}\cdot k. $ (7) In the multiplicative model, the sum of the seasonal component values should equal the number of periods in the cycle.
Coefficient of correlation
$ k=\dfrac{4}{\displaystyle\sum\limits_{n}^{n+1}\left(\dfrac{{y}_{t}}{\overline{y_{n}^{t}}}\right)/n+{1}_{p}},$ (8) where, p = 1…4.
Dividing each level of the original series by the corresponding seasonal component values yields the resulting values T × E = Y/S, which contain only the trend and the random component.
The equation parameters were determined by the least squares method
$ {a}_{0}n+{a}_{1}+\sum t={\sum y,a}_{0}\sum t+{a}_{1}\sum{t}_{2}=\sum y t . $ (9) The value of a0 found in the first equation was substituted into Eq. (2), and the values of а and b. The average value of y was calculated using the formula:
$ \overline{y}=\dfrac{\sum{y}_{i}}{m} ,$ (10) where, m is the number of observations.
The T component of this model was determined by the analytical smoothing method (T + E) using a linear trend, and the analytical smoothing data, a + bt, were obtained. In this case, the trend reflects the overall state of the physiological parameter at rest. By substituting values t = 1...100 into this equation, the levels of T were found for each time point.
The series levels were calculated by multiplying the values of T by the corresponding seasonal component values. The error in the multiplicative model was determined using the formula
$ E=\sum Y/(TS)=100. $ (11) These equations describe the decomposition of physiological time series into trend, seasonal, and random components. Such decomposition enables independent analysis of long-term adaptation processes, circadian variability, and stochastic fluctuations affecting navigator functional states.
The coefficient of determination was calculated using Eqs (12) and (13). The calculation results are presented in Table 2.
$ {R}^{2}=1-\dfrac{S_{e}^{2}}{\displaystyle\sum\limits_{i=1}^{n}({y}_{i}-\overline{y}{)}^{2}},$ (12) $ F=\dfrac{{R}^{2}}{1-{R}^{2}}\cdot \dfrac{n-m-1}{m} . $ (13) Table 2. Coefficients of determination and F-test values for the experiment participants.
Rank 2nd Officer (a) Ch. Officer (b) Master (c) 2nd Officer (d) Ch. Officer (e) Ch. Officer (f) 2nd Officer (g) R2 0.46 0.19 0.18 0.17 0.27 0.14 0.47 F 83.9 11.3 22.14 17.05 20.53 7.9 86.25 The forecasted value Ft of the time series level in the multiplicative model is the product of the trend and the seasonal component. To determine the trend component, the trend equation was used.
$ T=a+bx. $ (14) Thus, considering that in all cases F > Fkp, it can be concluded that the indicators of the multiplicative model are statistically significant and represent the state of the object in 14%−47% of cases (Fig. 3).
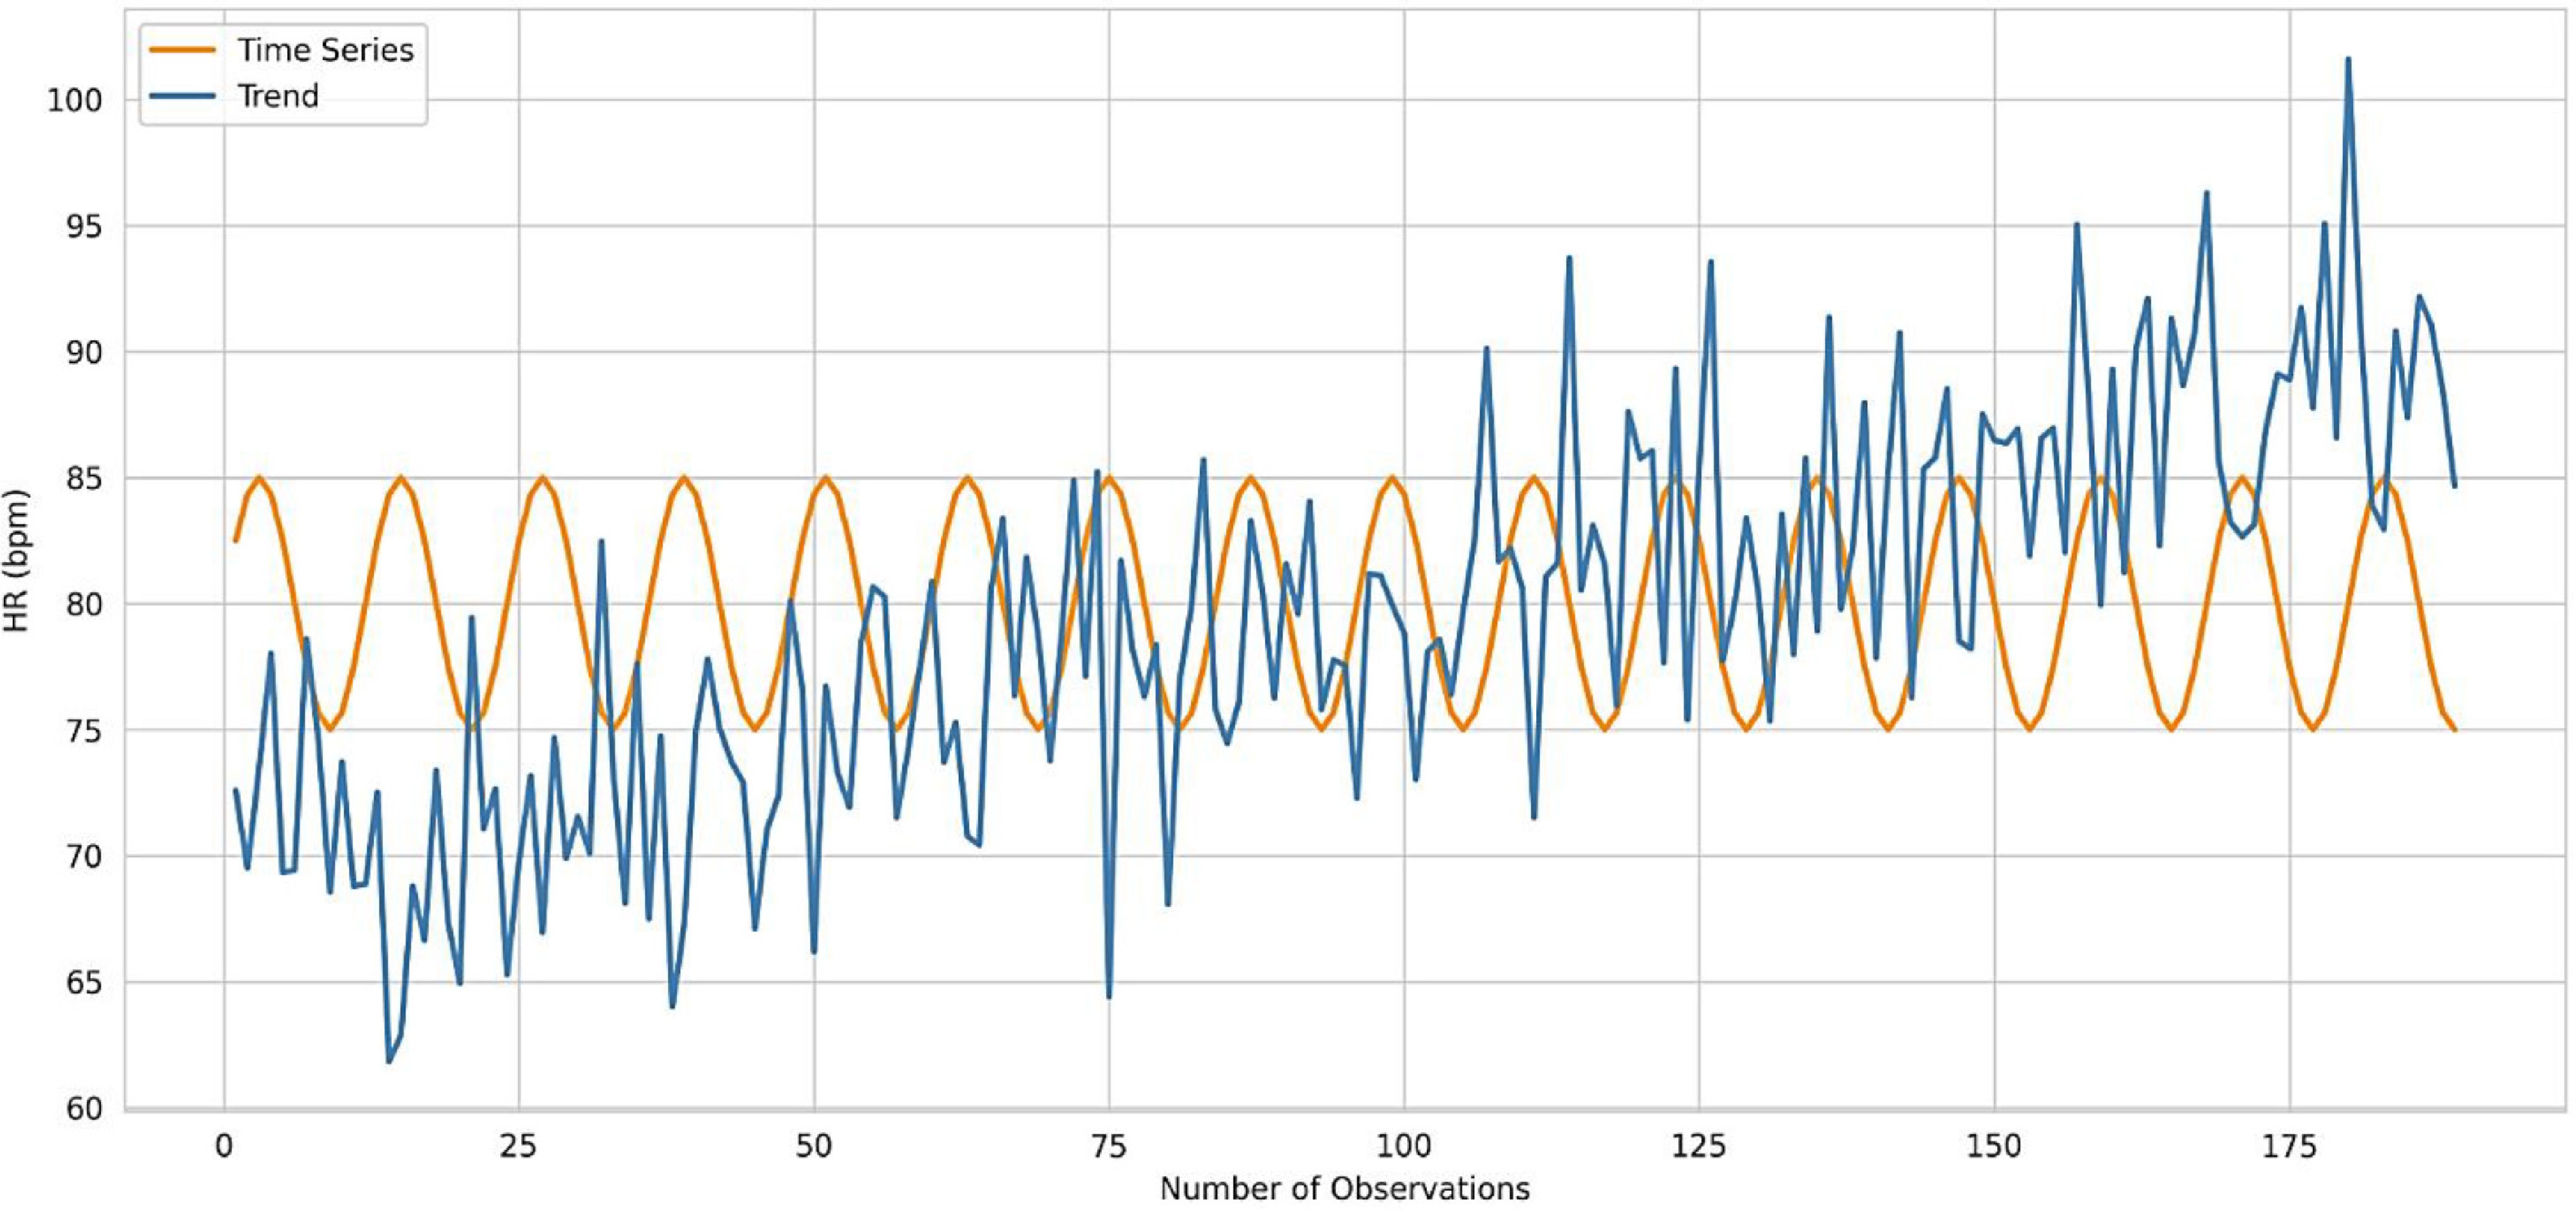
Figure 3.
Trend of the navigator's states.
Exponential measurements are most commonly used in physiology research to study dependencies. To determine the influence of other components on the output heart rate signal, a regression analysis was performed between time t and the time series readings, between the trend (T·Si) and the time series, as well as between the time series and the circadian rhythm.
A graphical approach was employed to perform the regression analysis. For this purpose, graphs were plotted in a rectangular coordinate system by plotting individual values of the dependent variable Y and the independent variable X. A correlation field was obtained, presented in Figs 4−6, based on which a hypothesis can be proposed that the relationship between all possible values of X and Y has an exponential nature[21]:
$ y=a\cdot {e}^{bx}. $ (15) 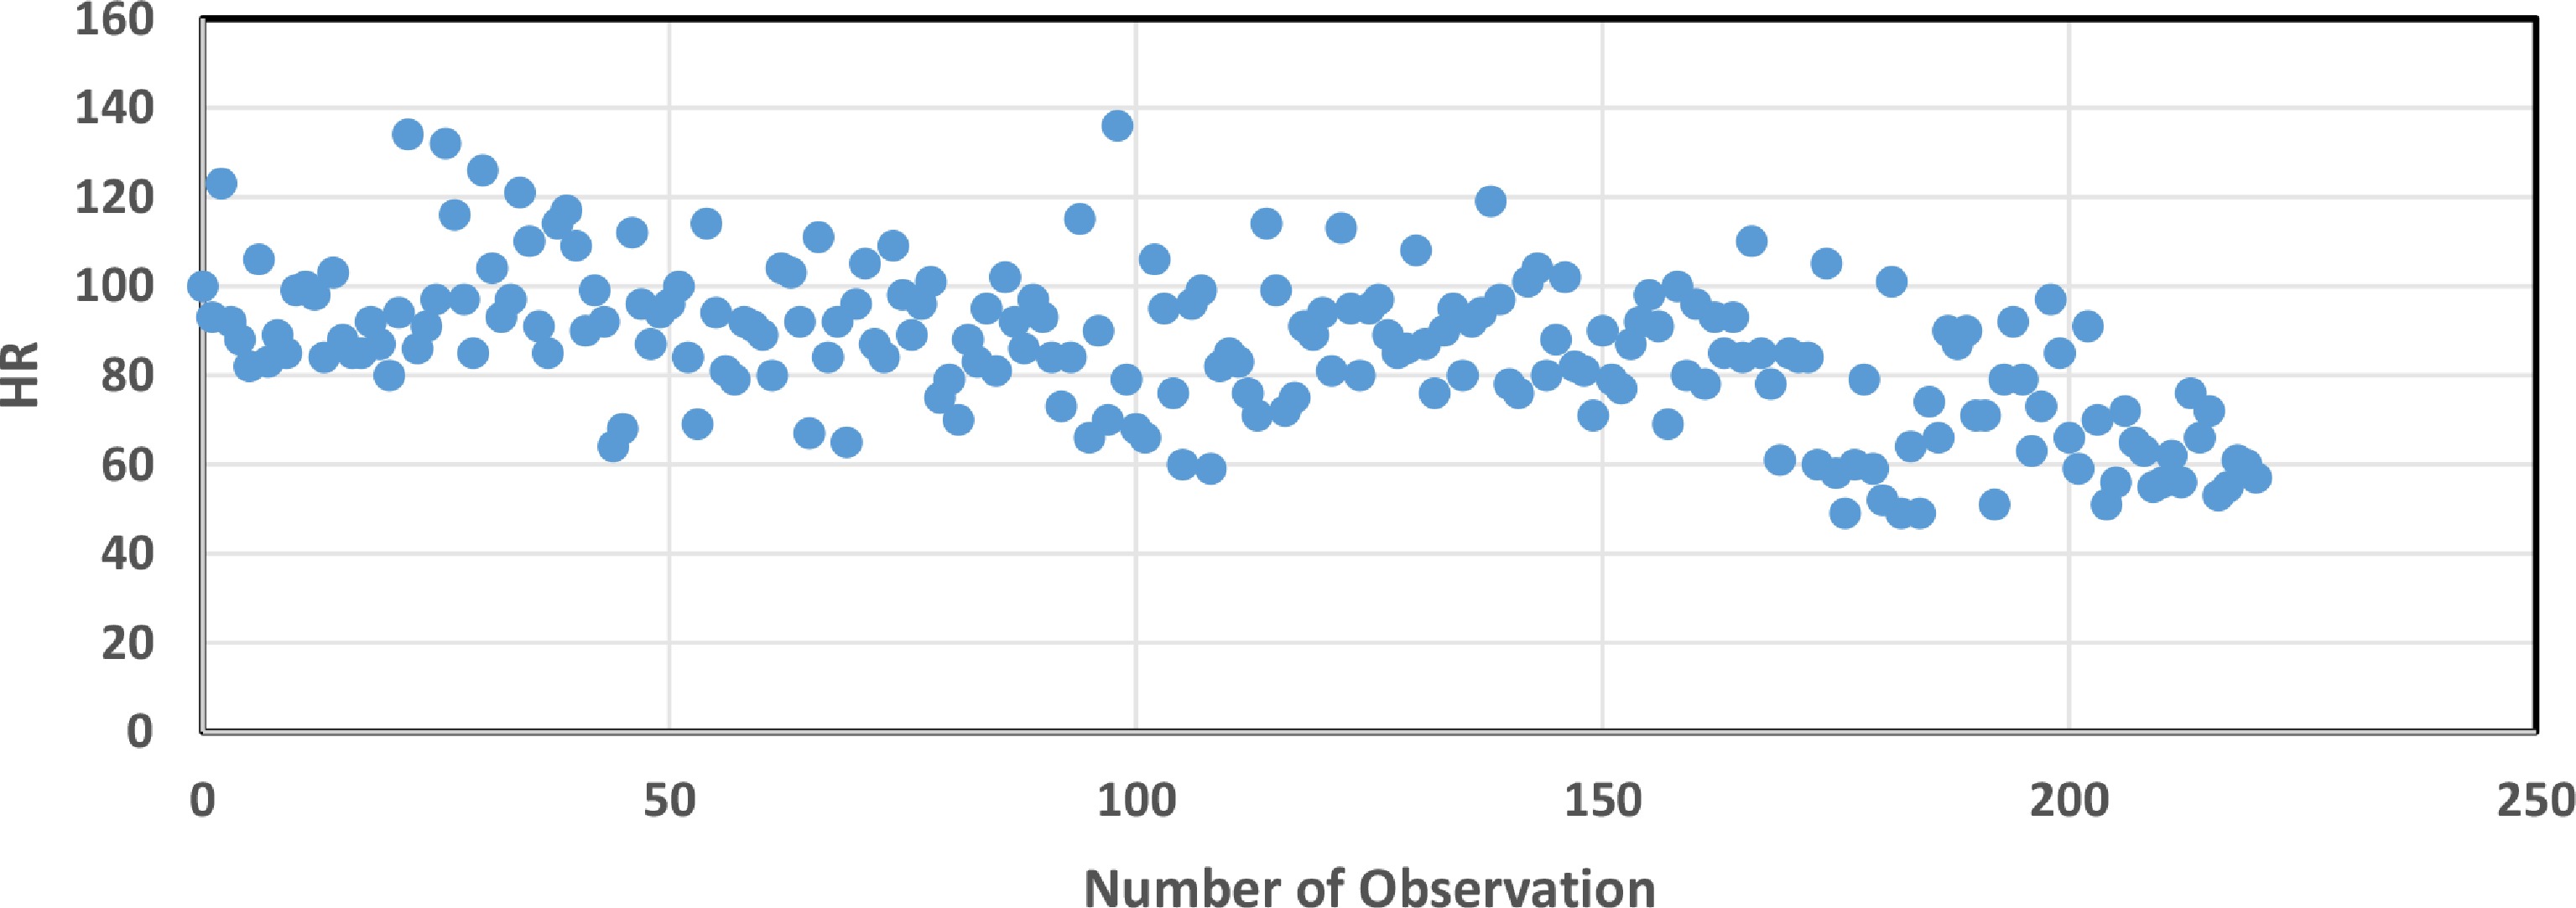
Figure 4.
Correlation field for yt.
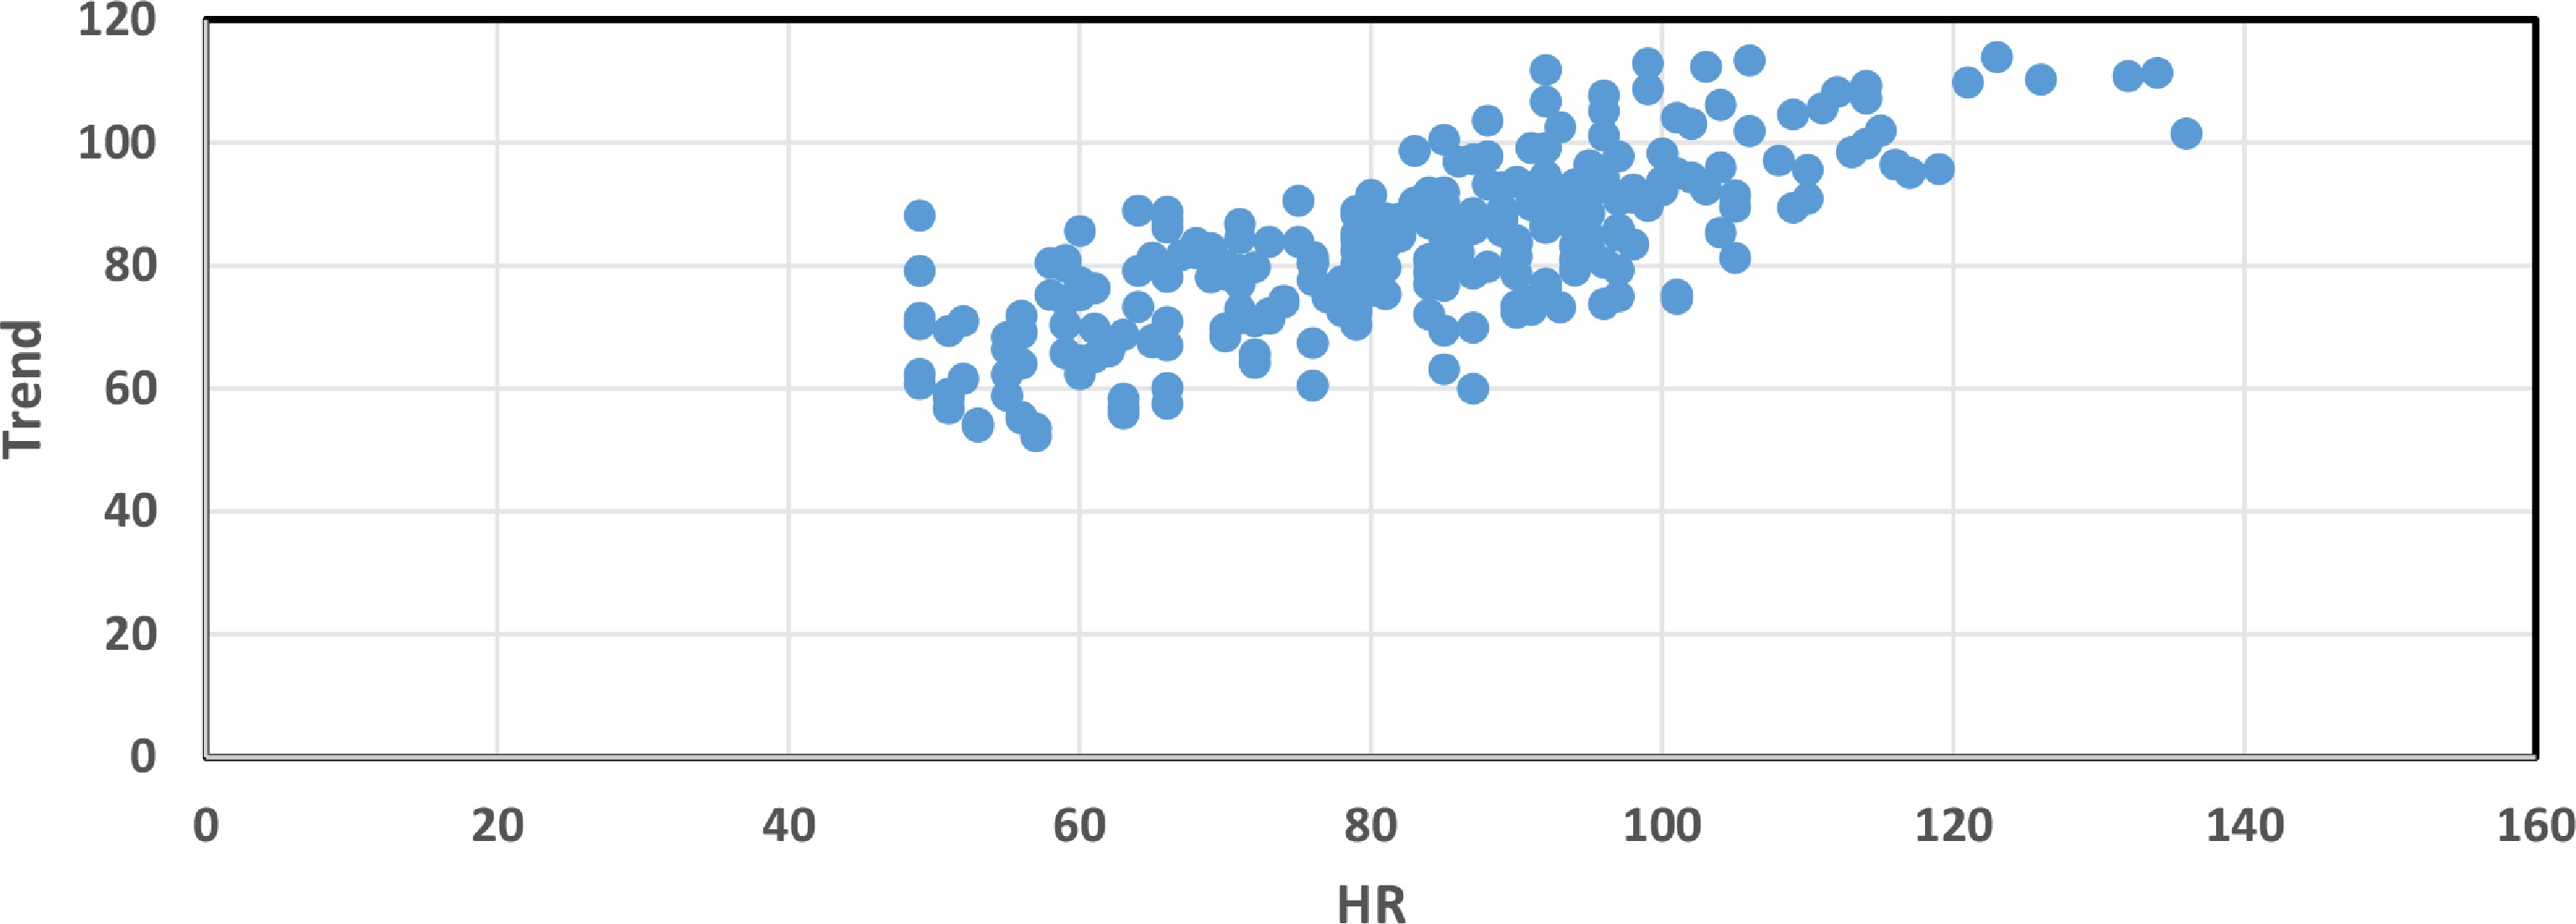
Figure 5.
Correlation field for $ {y}_{T{{S}_{i}}} $.
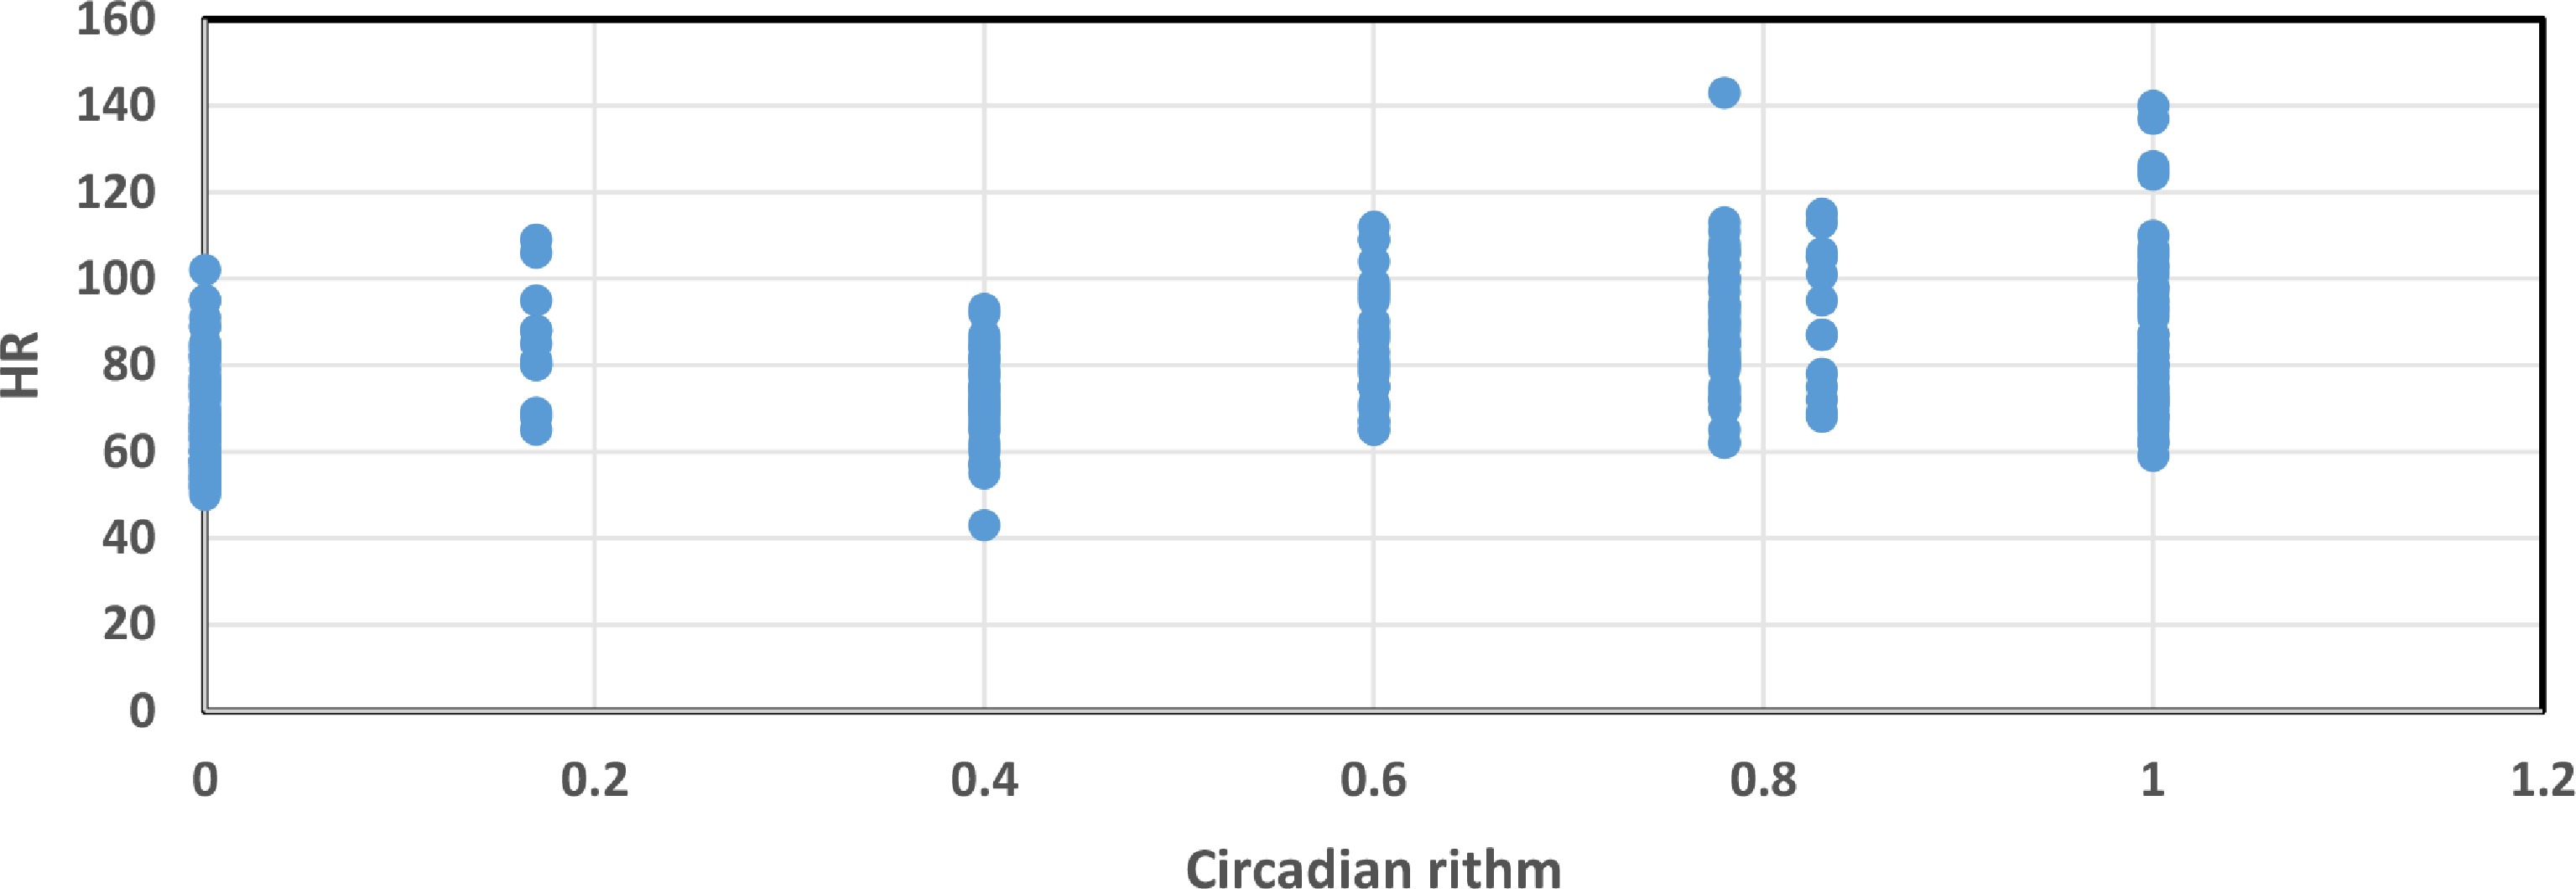
Figure 6.
Relationship between heart rate and circadian rhythm weighting.
The equation was linearized using the base-10 logarithm.
The estimated regression equation
$ y=a\cdot {e}^{bx}+\varepsilon . $ (16) Since the deviations ɛi for each individual observation i are random and their values in the sample are unknown, we can conclude the following:
Based on the observed values of xi and yi, we can only obtain estimates of the parameters α and β. These estimates, denoted by a and b, respectively, are themselves random variables, as they depend on a random sample.
After linearization, we obtain:
$ \mathit{\ln } (y)=\mathit{\ln } (a)+bx. $ (17) To estimate the parameters α and β, the method of least squares is used.
Formally, it can be expressed as
$ S=\sum_{ }^{ }\left(y_i-y\cdot i\right)^2\rightarrow min. $ (18) The system of normal equations will be
$ a-n+b-\sum x=\sum y-x . $ (19) By equating (1) and (2) with respect to the coefficient a, multiplying by the corresponding coefficient
$ -\sum\dfrac{x}{n} $ The parameters of the regression equation have been calculated for each sample:
(1) Sample means
$ \overline{x}=\dfrac{\sum{x}_{i}}{n},\overline{y}=\dfrac{\sum{y}_{i}}{n},\overline{x}\overline{y}=\dfrac{\sum{x}_{i}{y}_{i}}{n} . $ (20) (2) Selective dispersions
$ S{\left(x\right)}^{2}=\dfrac{\sum x_{i}^{2}}{n}-{\overline{x}}^{2},S{\left(y\right)}^{2}=\dfrac{\sum y_{i}^{2}}{n}-{\overline{y}}^{2}. $ (21) (3) Mean square deviation
$ S\left(x\right)=\sqrt{{S}^{2}\left(x\right)},S\left(y\right)=\sqrt{{S}^{2}\left(y\right)}. $ (22) The correlation coefficient b can be found using the formula
$ b=\dfrac{\overline{x}\overline{y}-\overline{x}\cdot \overline{y}}{s_{x}^{2}},$ (23) coefficient a
$ a=\overline{y}-b\overline{x} . $ (24) To determine the impact of the standard deviation of the dependent variable when the independent variable changes, the coefficient βj is calculated using the following formula:
$ {\beta }_{j}={b}_{j}\cdot \dfrac{{S}_{\left(x\right)}}{{S}_{\left(y\right)}} . $ (25) The quality of the equation is assessed by the approximation error
$ \overline{A}=\dfrac{\displaystyle\sum\limits_{i=1}^{n}\dfrac{\left| {y}_{i}-{y}_{x}\right| }{{y}_{i}}}{n}\cdot 100{\text{%}} . $ (26) To understand the closeness of the relationship between the characteristics under consideration and the reliability of the regression equation, the correlation index R was found:
$ R=\sqrt{1-\dfrac{\sum{\left({y}_{i}-{y}_{x}\right)}^{2}}{\sum{\left({y}_{i}-y\right)}^{2}}}. $ (27) The measure of statistical agreement
$ {R}^{2} $ Table 3. Estimated coefficients of the regression equation.
y t a b x y xy S ( x )2 S ( y )2 S ( x ) S ( y ) β A R R2 F 2nd Officer (a) 2.0082 −0.00076 110 1.925 208.612 4070 0.00807 63.797 0.0898 −0.54 3.18% 0.54 0.291 90.009 Ch. Officer (b) 1.8574 −0.00128 24 1.827 43.583 200 0.00796 14.142 0.0892 −0.203 3.96% 0.203 0.04131 2.025 Master (c) 1.8737 0.00021 93.5 1.893 177.64 2,945.22 0.00487 54.27 0.0698 0.163 2.97% 0.163 0.026 5.082 2nd Officer (d) 1.9049 0.0001 42 1.909 80.244 602 0.0682 24.536 0.0826 0.0299 3.45% 0.0299 0.000891 0.074 Ch. Officer (e) 1.8935 0.000839 29 1.918 55.844 270.67 0.00839 16.452 0.0916 0.151 3.99% 0.151 0.0227 1.277 Ch. Officer (f) 1.9618 −0.00117 24 1.934 46.176 200 0.00462 14.142 0.068 −0.243 2.57% 0.243 0.0592 2.957 2nd Officer (g) 1.876 −5.603 92 1.871 171.989 28.52 0.00757 53.404 0.087 −0.0344 3.77% 0.0344 0.0012 0.217 Table 4. Estimated coefficients of the regression equation.
$ {{y}}_{{T}\cdot {{{S}}_{{i}}}} $ a b x y xy S(x)2 S(y)2 S(x) S(y) β A R R2 F 2nd Officer (a) 1.688 0.00281 85.814 1.929 166.325 289.64 0.00419 17.019 0.0648 0.737 1.80% 0.737 0.544 260.765 Ch. Officer (b) 1.7355 0.00144 68.551 1.834 126.039 214.08 0.0023 14.632 0.048 0.438 1.84% 0.438 0.192 11.176 Master (c) 1.7504 0.00176 79.266 1.89 150.144 181.04 0.00202 13.455 0.0449 0.528 1.60% 0.528 0.279 71.941 2nd Officer (d) 1.8459 0.000844 82.588 1.916 158.411 243.96 0.00101 15.619 0.0319 0.414 1.22% 0.414 0.171 17.153 Ch. Officer (e) 1.7984 0.00149 84.596 1.925 163.337 341.19 0.00278 18.471 0.0527 0.523 2.03% 0.523 0.274 20.714 Ch. Officer (f) 1.8777 0.000698 86.939 1.938 168.661 202.34 0.000672 14.225 0.0259 0.383 1.02% 0.383 0.147 8.072 2nd Officer (g) 1.7222 0.00205 75.859 1.878 142.973 245.31 0.00286 15.662 0.0535 0.602 1.93% 0.602 0.363 104.097 Table 5. Estimated coefficients of the regression equation.
уc a b x y xy S(x)2 S(y)2 S(x) S(y) β A R R2 F 2nd Officer (a) 1.882 0.1009 0.422 1.925 0.825 0.13 0.00807 0.363 0.0898 0.408 3.34% 0.408 0.167 43.811 Ch. Officer (b) 1.7723 0.09586 0.556 1.827 1.048 0.14 0.00796 0.368 0.0892 0.395 3.76% 0.395 0.156 8.694 Master (c) 1.8406 0.08972 0.588 1.893 1.125 0.14 0.00487 0.372 0.0698 0.478 2.42% 0.478 0.228 55.028 2nd Officer (d) 1.8621 0.09085 0.518 1.909 1.001 0.12 0.00682 0.353 0.0826 0.389 3.13% 0.389 0.151 14.772 Ch. Officer (e) 1.8419 0.125 0.607 1.918 1.182 0.14 0.00839 0.375 0.0916 0.512 3.44% 0.512 0.262 19.513 Ch. Officer (f) 1.9095 0.056 0.433 1.934 0.847 0.15 0.00462 0.39 0.068 0.321 2.65% 0.321 0.103 5.411 2nd Officer (g) 1.8072 0.1176 0.544 1.871 1.035 0.14 0.00757 0.38 0.087 0.514 3.23% 0.514 0.264 65.575 $ {R}^{2}=1-\dfrac{\sum{\left({y}_{i}-{y}_{x}\right)}^{2}}{\sum{\left({y}_{i}-y\right)}^{2}}. $ (28) $ F=\dfrac{{R}^{2}}{1-{R}^{2}}\cdot \dfrac{n-m-1}{m} . $ (29) where, m is the number of factors in the model.
The equations and their corresponding values have been obtained:
$ {y}_{t}=1{0}^{{{a}_{t}}\cdot }{e}^{{{b}_{t}}{{x}_{t}}}. $ (30) $ {y}_{T\cdot {{S}_{i}}}=1{0}^{{{a}_{T\cdot {{S}_{i}}}}}\cdot {e}^{{{b}_{T\cdot {{S}_{i}}}}\cdot {{x}_{T\cdot {{S}_{i}}}}},$ (31) where, 10a is the coefficient of the indicator, and b represents the rate of increase or decrease of the indicator
$ {y}_{c}=1{0}^{{{a}_{c}}\cdot }{e}^{{{b}_{c}}c},$ (32) where, 10a is the coefficient of the indicator, and b represents the rate of increase or decrease of the indicator.
The regression models quantify the relationships between physiological indicators and the identified functional-state components. The obtained parameters characterize both the intensity and temporal evolution of physiological responses associated with fatigue and stress development.
The calculations indicate that both the time spent on board and the circadian rhythm influence the navigator's condition to varying degrees, while the trend reflects a general tendency toward calmness but accounts for only 14% to 54% of the observed variation in condition.
Investigation of the ship navigator's behavior using multiple regression and the least squares method
-
To understand how the time spent on board, circadian rhythm, and trend collectively influence the main time series, a multiple regression of the form was calculated
$ y={b}_{0}+{b}_{1}{X}_{1}+{b}_{2}{X}_{2}+{b}_{3}{X}_{3}0 . $ (33) The multiple regression equation is usually represented as
$ Y=f(\beta ,X)+\varepsilon ,$ (34) where, X = X (X1, X2, …, Xm), vectors of independent variables; β, vector of parameters to be determined; ɛ, random deviation; and Y, dependent variable.
The theoretical linear equation of multiple regression is
$ Y={\beta }_{0}+{\beta }_{1}{X}_{1}+{\beta }_{2}{X}_{2}+~...~+{\beta }_{m}{X}_{m}+\varepsilon ,$ (35) where, β0 is the intercept term, which defines the value of Y when all explanatory variables Xj are equal to zero.
The empirical multiple regression equation has the form
$ Y={b}_{0}+{b}_{1}{X}_{1}+{b}_{2}{X}_{2}+~...~+{b}_{m}{X}_{m}+e ,$ (36) where, b0, b1, … bm are the estimates of theoretical values β0, β1, β2, … βm, or empirical regression coefficients, and e is the deviation assessment of ɛ.
To evaluate the parameters, we will use the least squares method, according to which vector S can be obtained from the expression
$ S=({X}^{T}X{)}^{-1}{X}^{t}Y . $ (37) To do this, a column of ones is added to the matrix Xj to obtain a new matrix. This matrix is then transposed to form XT, and multiplied by t XT to X and XT to Y. The inverse matrix (XT X)−1 is then computed.
As a result, we obtain the vector of estimated regression coefficients:
$ ({X}^{T}X{)}^{-1}{X}^{T}Y=y(x)={b}_{0}+{b}_{1}{X}_{1}+{b}_{2}{X}_{2}+{b}_{3}{X}_{3}. $ (38) The constant b0 reflects the impact of all factors not included in the model xj on Y and indicates the value of Y when all xj are equal to zero. The coefficients b1, b2, and b3 indicate the increase or decrease in Y as X1, X2, and X3 increase, respectively.
To assess the overall significance of the regression equation and its coefficients, as well as to analyze the relative and absolute approximation errors, we proceed with the statistical analysis of the equation.
To obtain an unbiased estimate of the variance, the following calculations are performed:
Unbiased error (absolute approximation error):
$ \varepsilon =Y-Y\left(x\right)=Y-X\cdot s. $ (39) The average approximation error is
$ A=\dfrac{\sum\limits_{j=1}^{n}\left| \dfrac{\varepsilon }{Y}\right| }{n}\cdot 100\% . $ (40) Dispersion estimation
$ {{{s}_{e}}}^{2}={\left(Y-Y\left(X\right)\right)}^{T}\left(Y-Y\left(X\right)\right) . $ (41) The multiple regression model integrates the individual contributions of temporal, circadian, and adaptive factors into a unified predictive representation of navigator functional states. This enables simultaneous evaluation of their combined influence on physiological responses.
The significance of the multiple regression equation (Table 6) was assessed by testing the hypothesis of zero coefficient of determination R2, calculated based on the data of the general population and an F-test (Eqs [28], [29]).
Table 6. Estimated coefficients of the multiple regression equation.
y b0 b1 b2 b3 ԑ/Y A Se2 R2 F 2nd Officer (a) 0.4845 −0.00203 1.611 0.9893 24.62 11.09% 28,537.288 0.6 108.993 Ch. Officer (b) 0.4573 0.00149 −2.7542 1.0138 7.682 15.36% 8,453.35 0.44 12.048 Master (c) 3.9055 −0.0129 −0.7099 0.9859 20.067 10.62% 24,409.705 0.3941 40.105 2nd Officer (d) 1.3395 0.00619 1.4031 0.9713 20.796 14.34% 31,341.188 0.4841 44.108 Ch. Officer (e) 0.3255 −0.00137 1.1833 0.9908 5.547 11.09% 8,470.239 0.511 16.024 Ch. Officer (f) 33.9381 0.07623 12.8967 0.4795 8.787 15.42% 14,024.849 0.2788 6.831 2nd Officer (g) −1.1437 −0.00045 −0.2643 1.0145 23.554 12.66% 28,909.747 0.4343 46.579 The calculations indicate that b3X3, where X3 represents the trend indicator, consistently contributes to an increase in the output heart rate (HR) signal.
Thus, several preliminary conclusions can be drawn. The time-dependent relationship includes a component that, for some participants, contributes to a reduction in stress with increasing time spent on board, potentially reflecting a positive adaptive function. All elements influence each other and the output signal as a whole; however, their combined effect is neither a simple sum nor an average of the individual contributions, indicating a synergistic nature of the human system. Furthermore, the analysis suggests the presence of an additional influencing component, implying that over time, any situation on board may eventually be perceived as stressful. To quantify the impact of the adaptive component, a specific coefficient was calculated, and the corresponding graphs were constructed (Fig. 7).
$ {y}_{adop}={y}_{T{{S}_{i}}}-({y}_{t}+{y}_{1}) . $ (42) 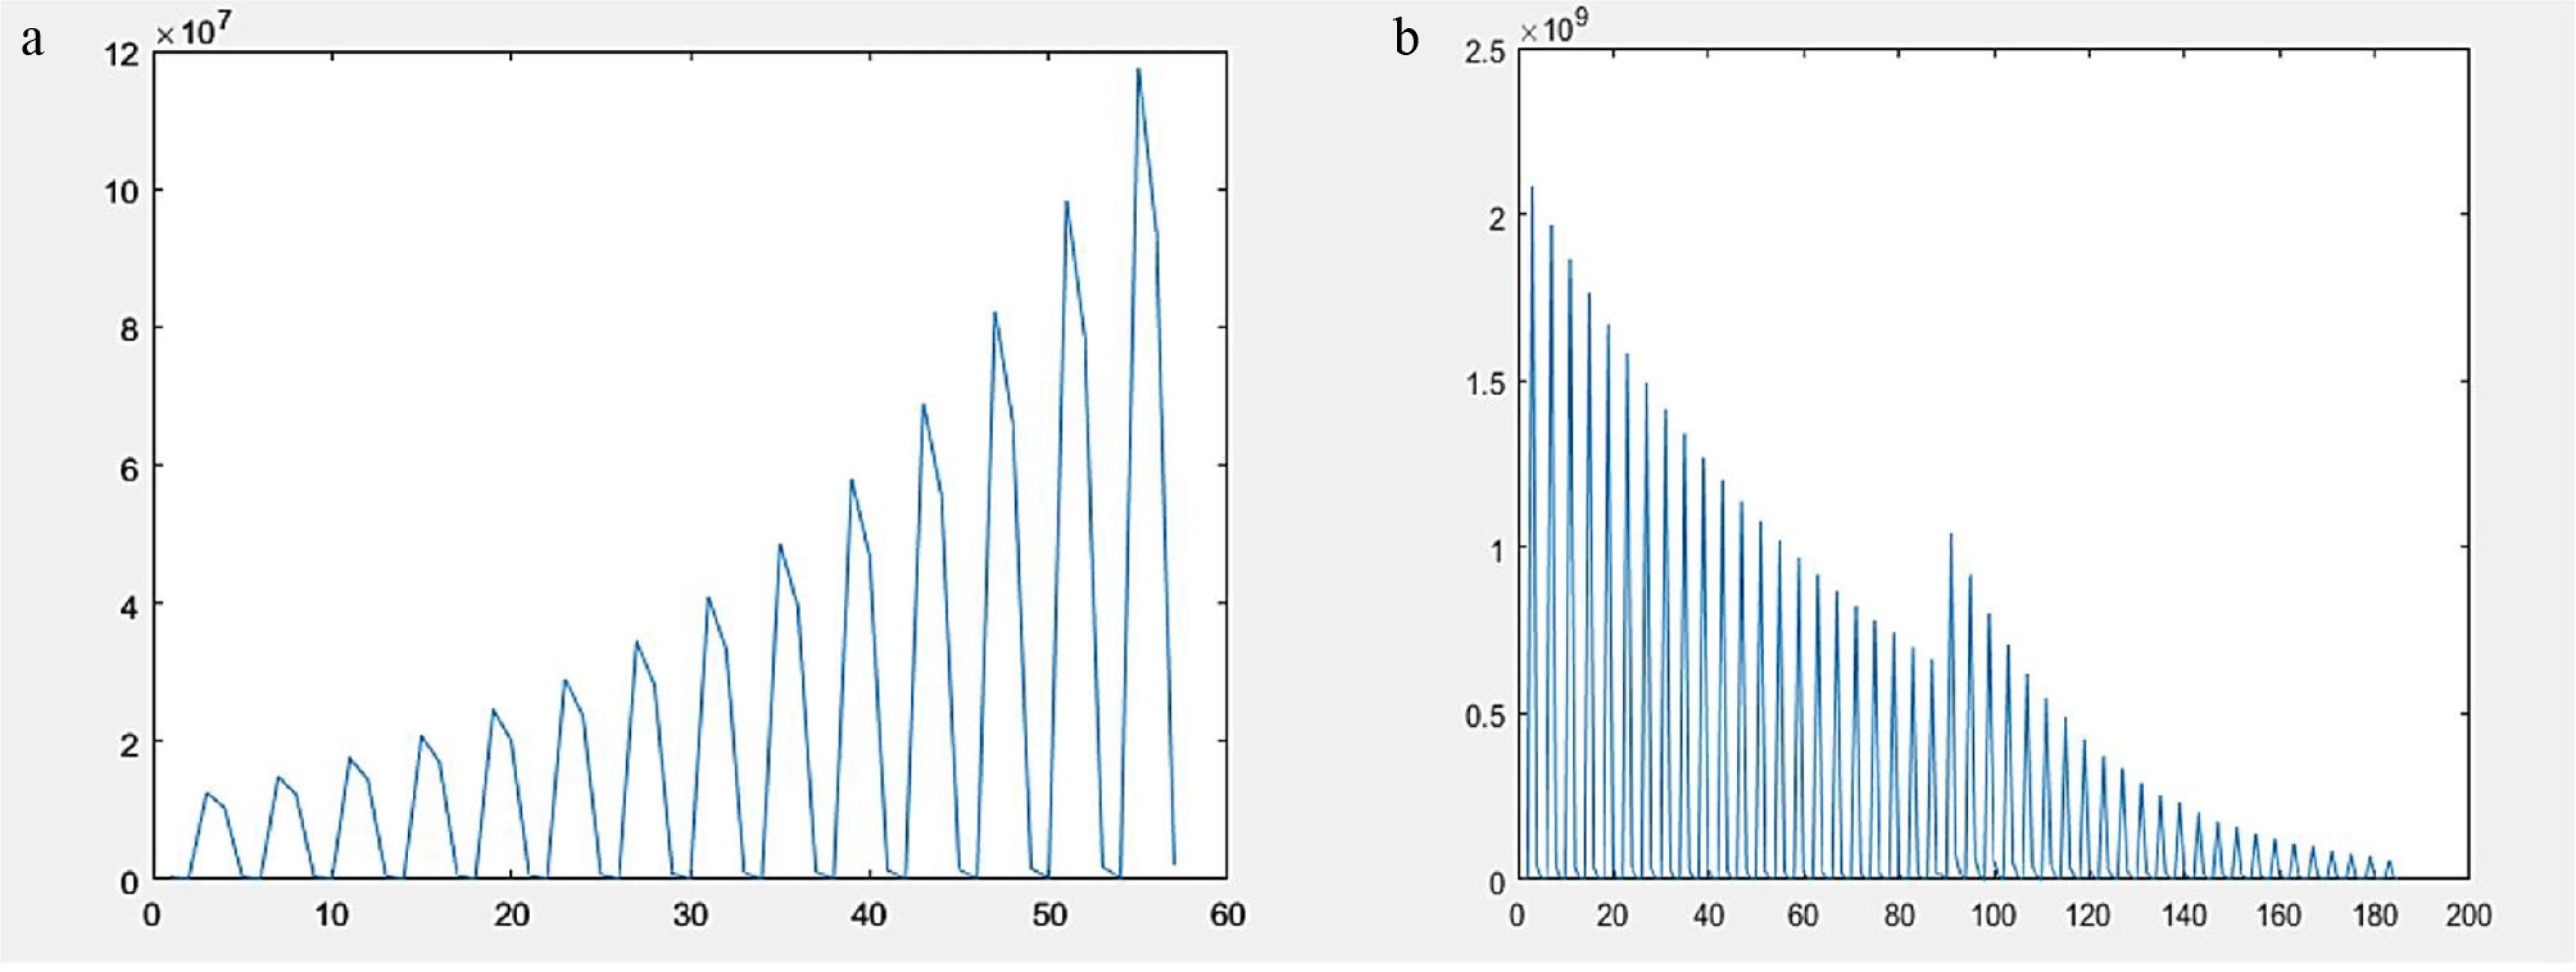
Figure 7.
Adaptation coefficient graph: (a) increasing trend; (b) decreasing trend.
The coefficients of the equation were calculated using MATLAB:
$ {y}_{1}=1{0}^{a}\cdot power(exp(x),(x\cdot b)) ,$ (43) $ {y}_{2}=1{0}^{{{a}_{2}}}\cdot power(exp({x}_{2}),({x}_{2}\cdot {b}_{2})) ,$ (44) $ {y}_{3}=1{0}^{{{a}_{3}}}\cdot power(exp({x}_{3}),({x}_{3}\cdot {b}_{3})) ,$ (45) $ {y}_{4}={y}_{2}-\left({y}_{1}+{y}_{3}\right) . $ (46) As shown in Fig. 7, each subject exhibits a distinct behavioral parameter that trends either toward an increase or a decrease in biological activity, potentially reflecting individual adaptive capacity. Lower values of this parameter indicate faster depletion of the individual's functional resources in response to stressors. Consequently, the fatigue factor exerts its effects more rapidly and strongly, increasing the likelihood of errors.
The impact of fatigue-related components on the overall time series was further analyzed using multiple regression based on Eqs (33)−(41). This approach enabled the quantification of the influence of fatigue-related factors on the navigator's overall condition, as summarized in Table 7.
Table 7. Assessment of the accuracy of fatigue-related factors' influence on the navigator's overall condition.
Rank A R2 2nd Officer (a) 2.89 0.54 Ch. Officer (b) 2.76 0.115 Master (c) 2.38 0.303 2nd Officer (d) 3.11 0.153 Ch. Officer (e) 3.43 0.277 Ch. Officer (f) 2.49 0.198 2nd Officer (g) 2.92 0.379 The results of the regression analysis indicate that prolonged time on board, routine tasks, and circadian rhythm decline are strong indicators of fatigue. However, their combined impact on the navigator's overall condition accounts for no more than 54% of cases, suggesting the presence of an additional component—a stress response factor.
By applying a logarithmic transformation, the relative contributions of physiological indicators associated with fatigue were quantified. Removing these fatigue-related components from the overall output signal allowed us to derive the residual indicator representing the effect of stress, denoted as
$ {y}_{stress}=y-\left(\mathit{\log } \left({y}_{em}\right)+\mathit{\log } \left({y}_{T{{S}_{i}}}\right)+\mathit{\log } \left({y}_{t}\right)+\mathit{\log } \left({y}_{1}\right)\right),$ (47) where, yem is the emotional or stress-related component.
A regression analysis was conducted (Table 8) to examine the relationships between the stress component and the time series using a graphical method according to the procedure, resulting in the following equation:
$ {y}_{stress}=1{0}^{{{a}_{stress}}}\cdot {e}^{{{x}_{stress}}{{b}_{stress}}}. $ (48) Table 8. Estimated parameters of the relationship between overall condition and the stress component.
Rank ast bst A R2 2nd Officer (a) 1.5385 0.000585 0.68 0.027 Ch. Officer (b) 1.1455 0.00642 1.64 0.887 Master (c) 0.9162 0.0082 3.24 0.757 2nd Officer (d) 1.0212 0.00799 1.43 0.929 Ch. Officer (e) 0.9576 0.00789 2.95 0.857 Ch. Officer (f) 1.2038 0.00646 0.71 0.964 2nd Officer (g) 0.2027 0.000766 6.04 0.05 To investigate the dependence of the stress component on fatigue-related factors, a multiple regression analysis was conducted:
$ {Y}_{stress}={b}_{0}+{b}_{1}{X}_{1}+{b}_{2}{X}_{2}+{b}_{3}{X}_{3}+{b}_{4}{X}_{4} ,$ (49) where,
$ {Y}_{stress}={y}_{stress},{X}_{1}={y}_{t},{X}_{2}={y}_{T\cdot {{S}_{i}}},{X}_{3}={y}_{c},{X}_{4}={y}_{adop} $ Table 9. Indicators of the stress component's dependence on fatigue-associated factors.
Rank R2 rX1 rX2 rX3 rX4 β1 β2 β3 β4 2nd Officer (a) 0.6 −0.78 −0.54 0.031 −0.54 −0.75 −0.032 0.0506 0 Ch. Officer (b) 0.33 0.073 0.073 0.39 −0.073 34.39 0 0.992 −35.13 Master (c) 0.06 −0.075 0.18 0.21 0.18 −0.219 11.259 0.0004 −10.984 2nd Officer (d) 0.12 0.0766 0.34 0.32 0.34 0.154 −40.99 0.506 40.83 Ch. Officer (s) 0.1146 0.0462 0.3 0.33 0.3 0.0838 −0.197 0.51 1.2Е-5 Ch. Officer (f) 0.08 0.11 0.241 0.240 0.242 0.385 −52.38 0.433 52.06 2nd Officer (g) 0.9968 0.988 0.0685 0.054 0.0685 0.998 0.0096 −0.00419 0 As seen from the R2 value, fatigue-associated factors can almost entirely explain the presence of stress, as in the case of the 2nd Officer (female), indicating severe fatigue. Conversely, they may have little to no influence, which could suggest the effect of a genuine stressor and, consequently, potential danger.
To assess the combined influence of all factors on the original time series, a multiple regression analysis was conducted:
$ Y={b}_{0}+{b}_{1}{X}_{1}+{b}_{2}{X}_{2}+{b}_{3}{X}_{3}+{b}_{4}{X}_{4}+{b}_{5}{X}_{5},$ (50) where,
$ Y=y,{X}_{1}={y}_{stress},{X}_{2}={y}_{t},{X}_{3}={y}_{T{{S}_{t}}},{X}_{4}={y}_{c},{X}_{5}={y}_{adop} $ Table 10. Indicators of the dependence of overall conditions on the stress component and fatigue-associated factors.
Rank R2 rX1 rX2 rX3 rX4 rX5 β1 β2 β3 β4 β5 2nd Officer (a) 0.946 −0.019 0.55 0.74 0.45 0.742 0.999 0.843 0.687 0.0048 0 Ch. Officer (b) 0.985 0.96 0.34 0.34 0.57 0.42 0.94 −0.98 0 −0.02 1.263 Master (c) 0.977 0.91 0.2 0.53 0.45 0.53 0.857 0.125 1.773 0.0176 −1.459 2nd Officer (d) 0.968 0.98 0.083 0.41 0.39 0.41 0.95 −0.0247 6.333 −0.143 −6.102 Ch. Officer (e) 0.975 0.96 0.12 0.52 0.51 0.52 0.886 0.0227 0.37 −0.131 2E-6 Ch. Officer (f) 0.971 0.97 0.26 0.38 0.3 0.38 0.973 0.119 −3.05 0.0213 3.18 2nd Officer (g) 0.372 0.035 −0.0347 0.6 0.42 0.6 −1.177 −1.172 0.606 −0.00488 2Е-6 The calculations indicate that in most cases, the navigator's overall condition can be accurately described by the following formula:
$ \begin{gathered}(1{0}^{{{a}_{t}}\cdot }{e}^{{{b}_{t}}{{x}_{t}}}),(1{0}^{{{a}_{T\cdot {{S}_{i}}}}}\cdot {e}^{{{b}_{T\cdot {{S}_{i}}}}\cdot {{x}_{T\cdot {{S}_{i}}}}}),(1{0}^{{{a}_{c}}}\cdot {e}^{{{b}_{c}}{{x}_{c}}}).\\ ({{{{{y}_{T}}}_{*}}}_{Si}-({y}_{t}+{y}_{c})).(1{0}^{{{a}_{stress}}}\cdot {e}^{{{x}_{stress}}{{b}_{stress}}}).\end{gathered} $ (51) In this case, the sensations of fatigue and stress at a given moment can be described by a transfer function representing the influence of these factors. Since no classical transfer function exists for nonlinear exponential regression relationships, but both input and output signal values are known, an empirical transfer function of the following form can be constructed:
$ {Y}_{state}\approx f({Y}_{t},{Y}_{T\cdot S},{Y}_{circ},{Y}_{adop},{Y}_{stres)} . $ (52) Using the MATLAB System Identification Toolbox, we obtained a transfer function of the form
$ {Y}_{state}={c}_{0}+{c}_{1}{Y}_{t}+{c}_{2}{Y}_{T\cdot S}+{c}_{3}{Y}_{circ}+{c}_{4}{Y}_{adop}+{c}_{5}{Y}_{stres},$ (53) where,
$ {c}_{0}\cdots {c}_{5} $ Based on the analysis of the transfer function, trends in the navigator's condition influenced by stress, fatigue, or their combined effects can be detected even at early stages. This approach enables timely identification of potentially error-prone situations and supports preventive adjustments in safety management.
A model of the proposed system was developed in MATLAB/SIMULINK and tested on a dataset comprising 884 heart rate (HR) observations with a 1-h sampling interval (37 d) and 221 observations with a 6-h sampling interval (55 d) (Fig. 8).
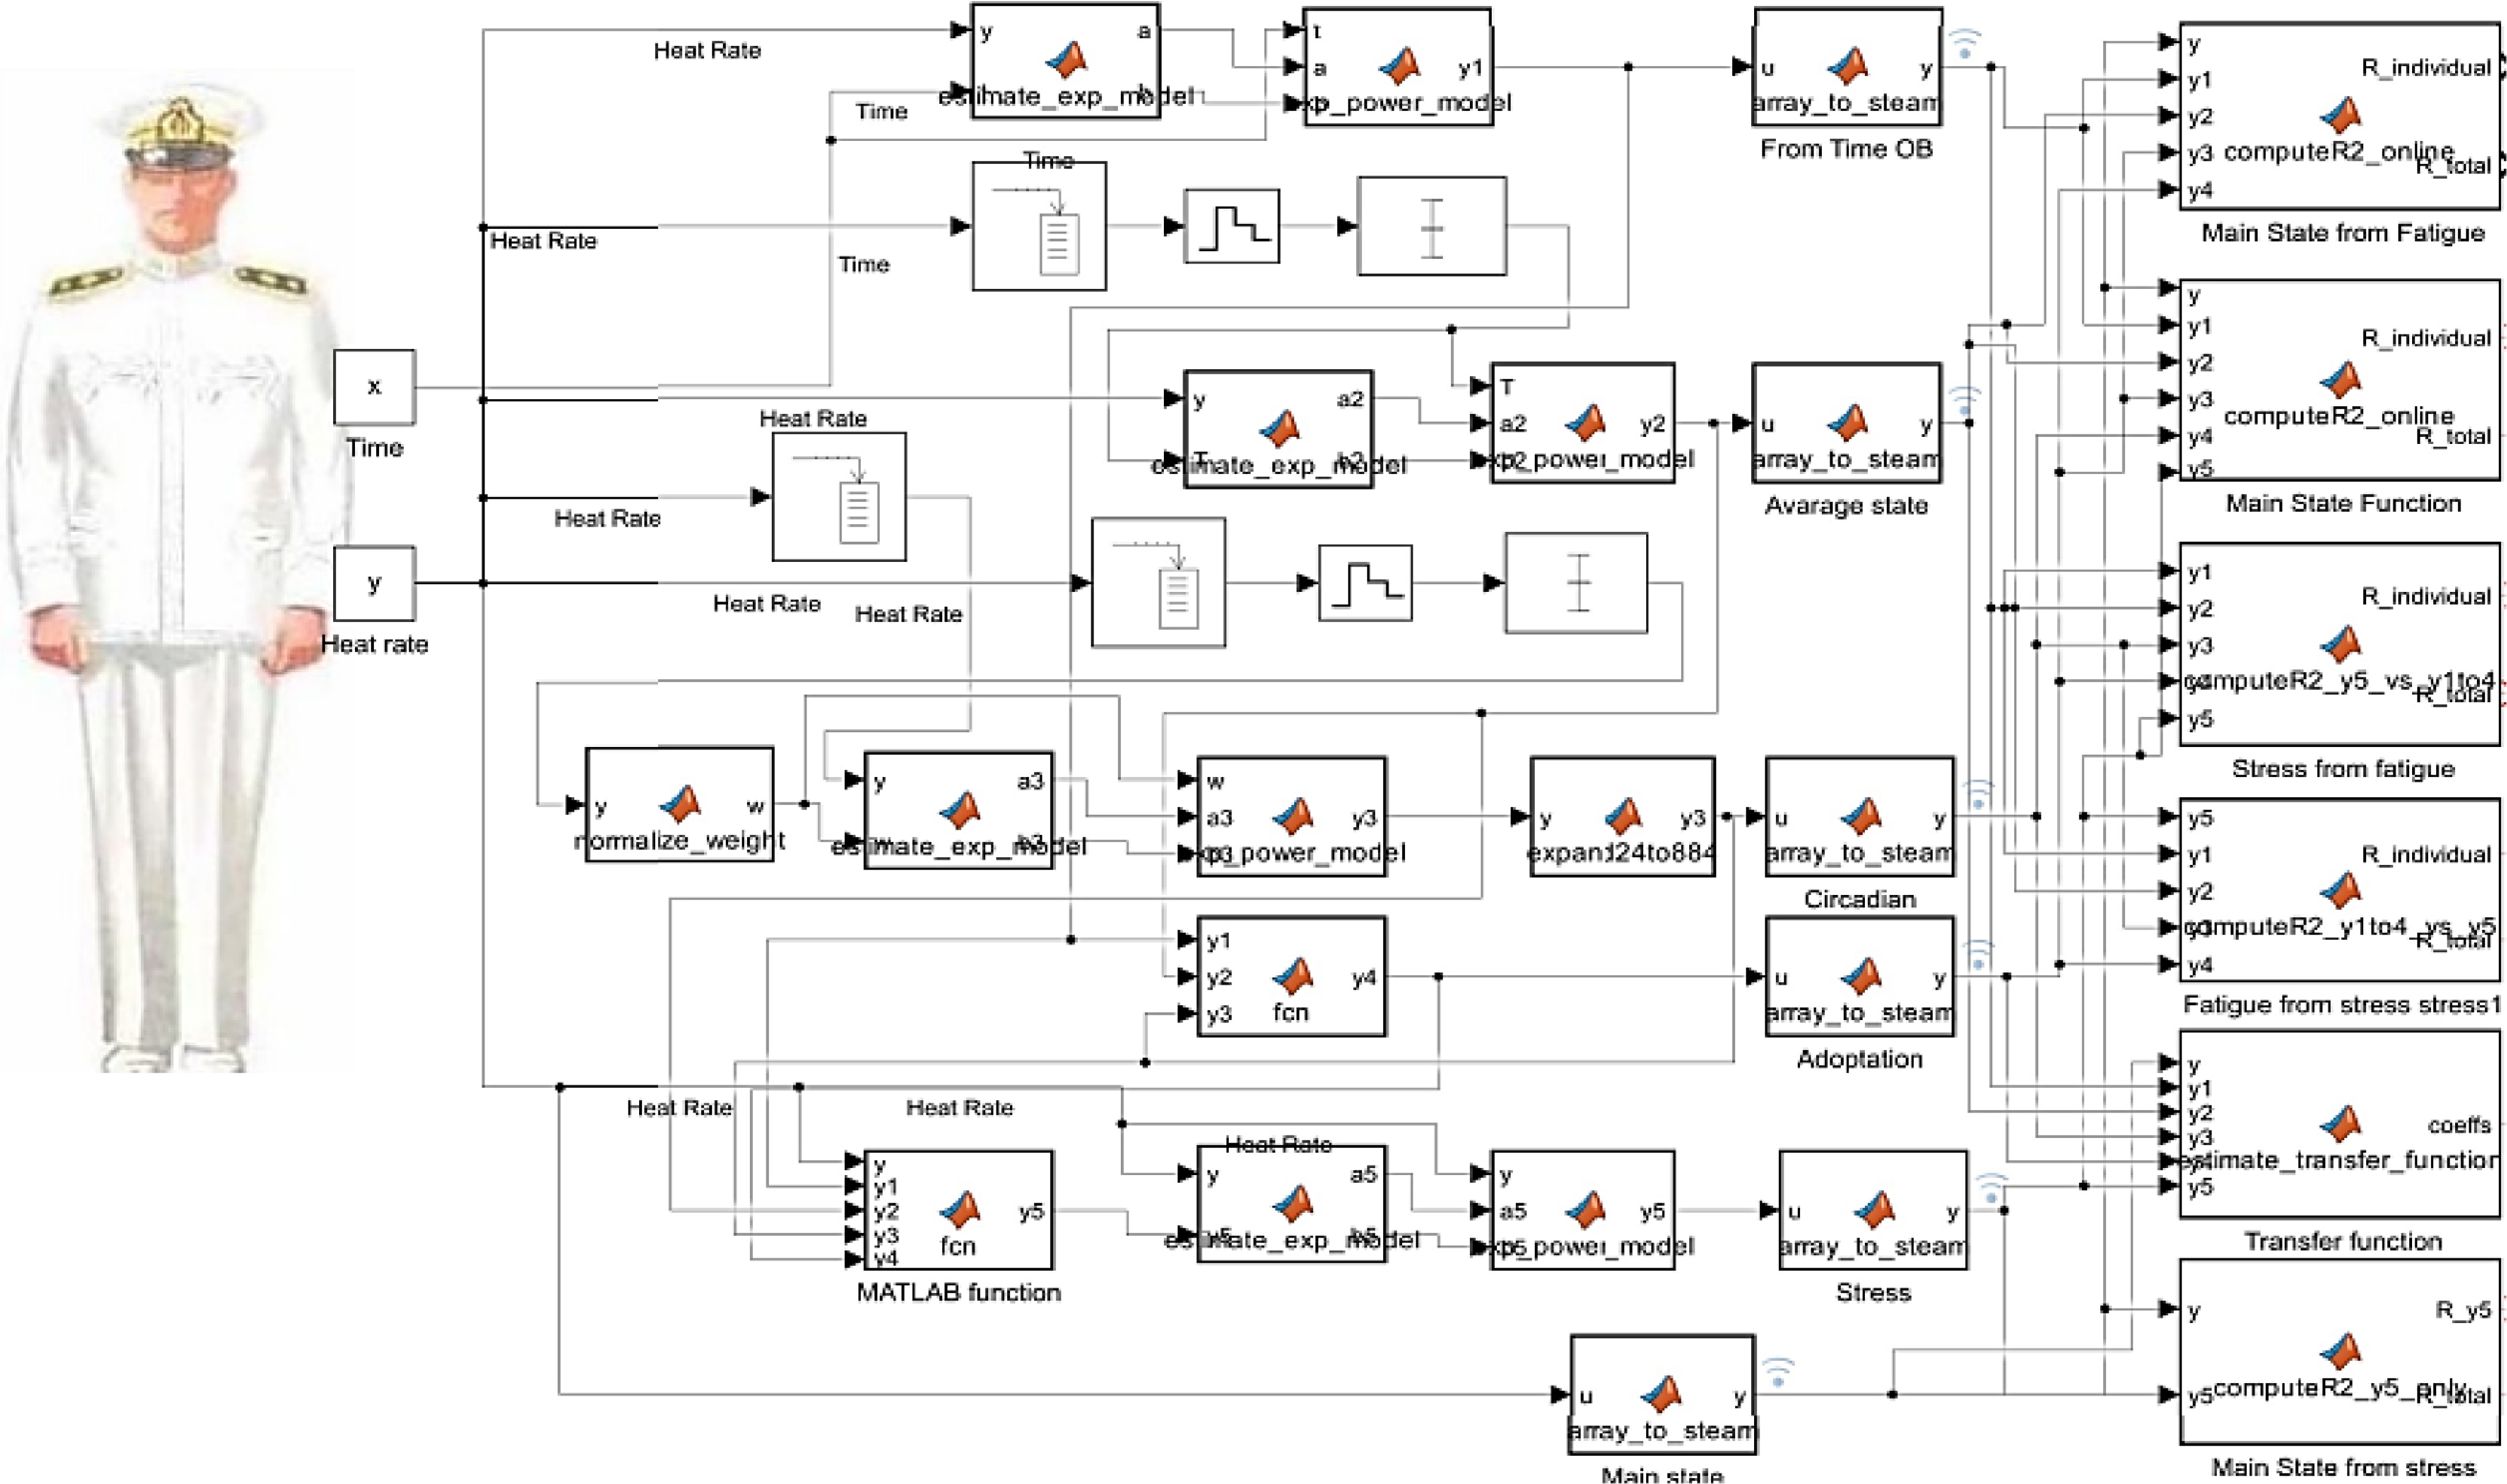
Figure 8.
Model of the monitoring and forecasting system for the psychophysiological states of the ship navigator.
Simulation results were obtained (Figs 9 and 10).
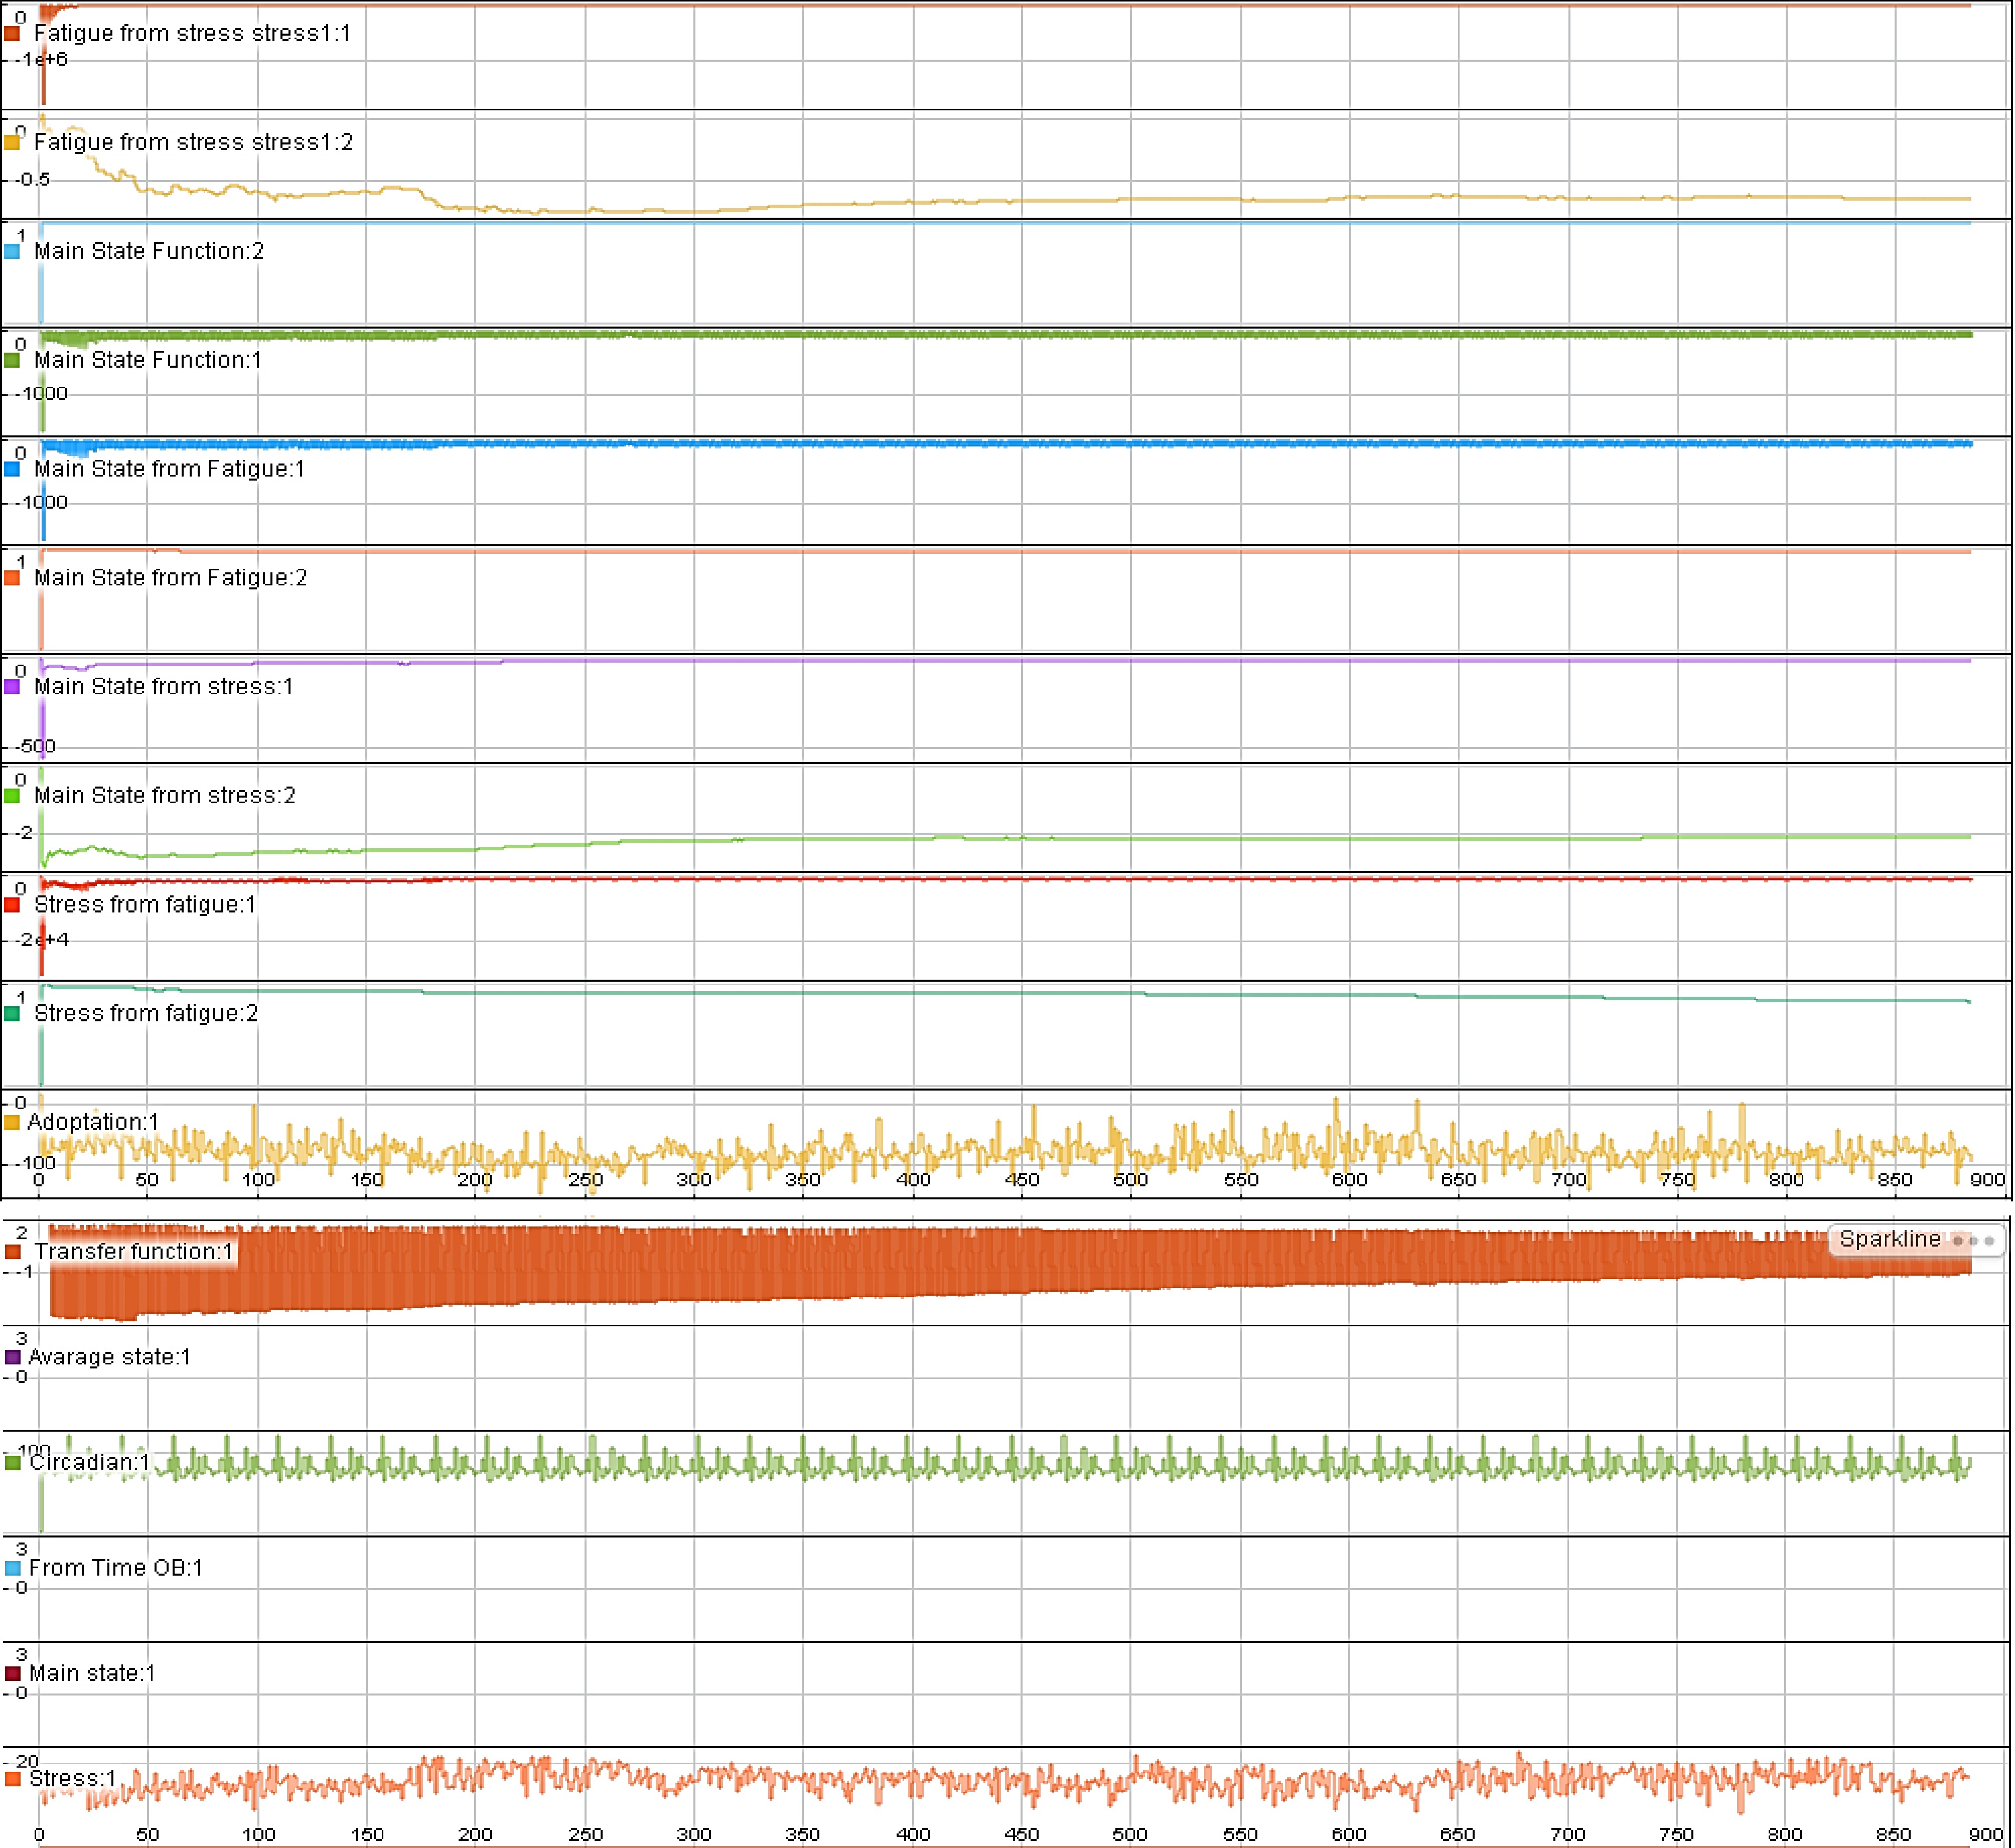
Figure 9.
Simulation of the state with predominance of fatigue.
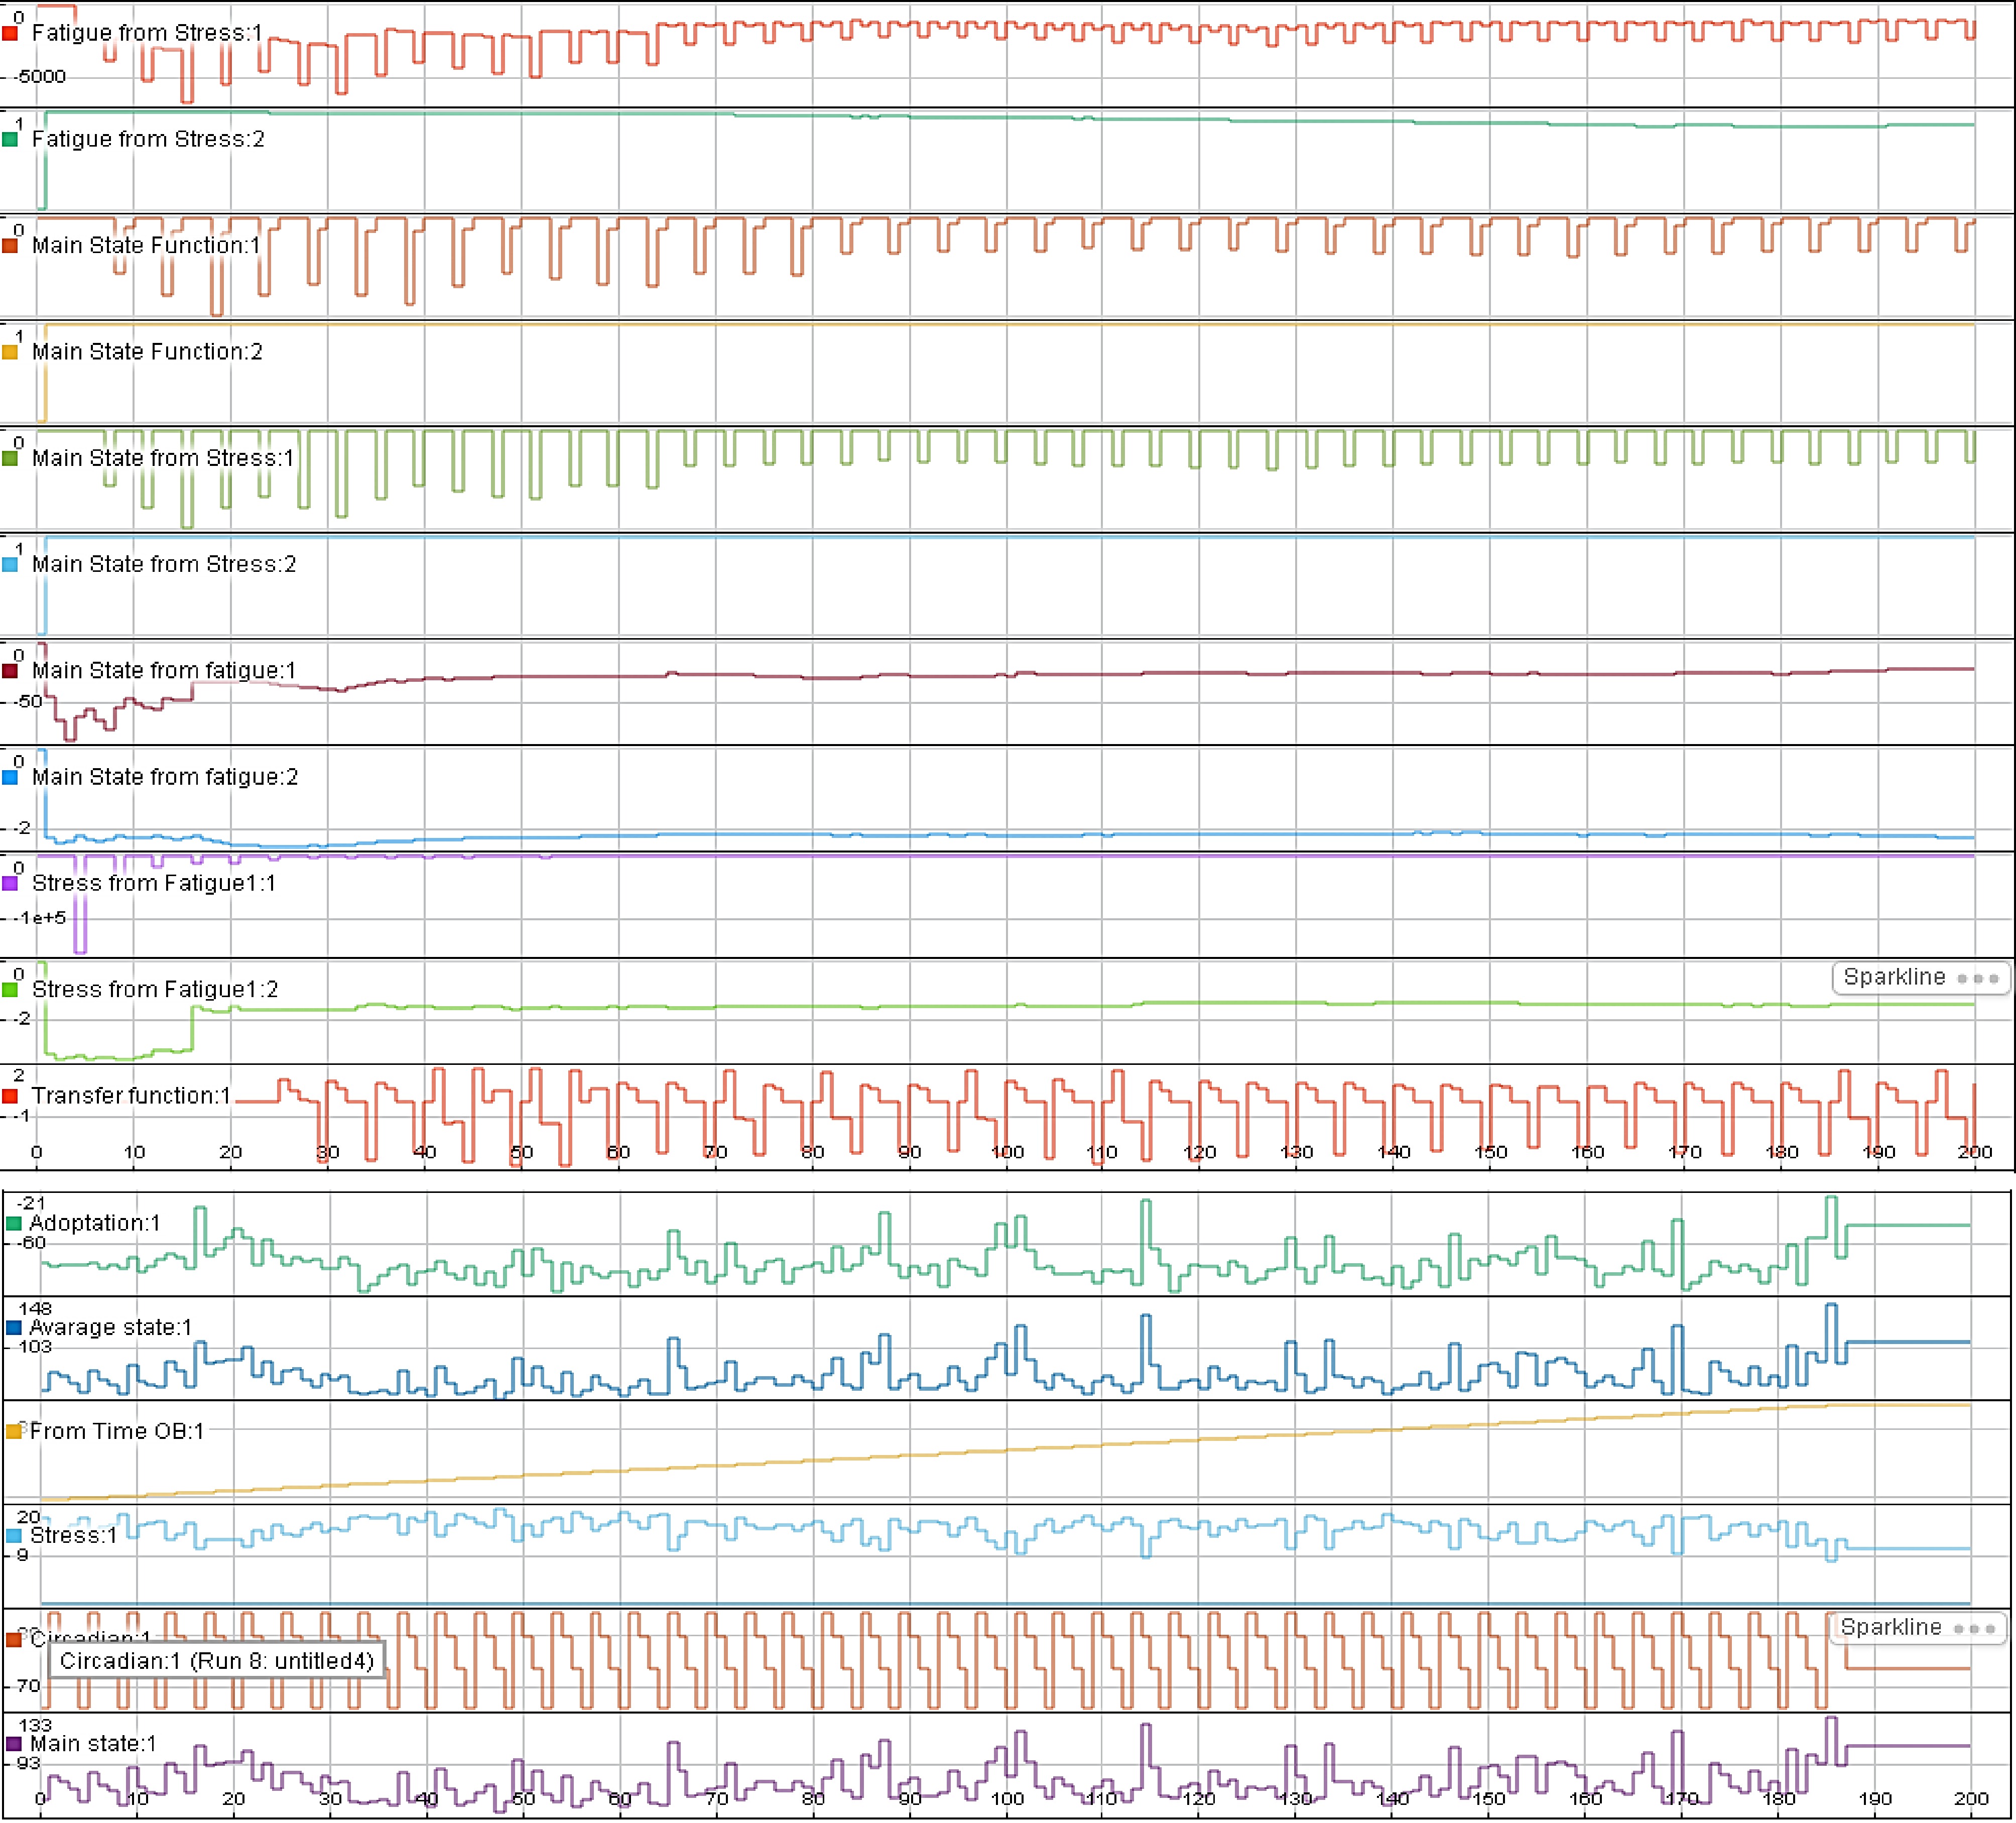
Figure 10.
Simulation of the state with predominance of stress.
Unlike other systems that identify fatigue-related symptoms, compare them with subjective scales, or simply recognize them as manifestations, this system detects the indicator's intensity and its changes. This enables the detection of fatigue even before the first symptoms and manifestations appear.
According to Selye, a person is constantly in a state of stress, and understanding their final condition requires accounting for the influence of all contributing factors to the overall state. This influence, as demonstrated by Eq. (50), is reflected with approx 90% accuracy by the correlation coefficient R2. These calculations also make it possible to identify the frequency of factor influence
$ {r}_{{{X}_{i}}} $ The results of modeling the psychophysiological state of a ship's captain showed that the proposed structure allows for an adequate description of the dynamics of fatigue and stress in shift work conditions. The decomposition of the time series ensured the separation of the baseline level of activity, circadian fluctuations, adaptation processes, components of fatigue accumulation, and short-term stress reactions.
The identified regression models and transfer functions demonstrated high explanatory power, as confirmed by the coefficient of determination, which exceeded 0.9 in most experiments. This indicates the possibility of reliably reproducing changes in the psychophysiological state based on a limited set of measurable indicators.
The use of an abstract information automaton made it possible to carry out short-term forecasting of fatigue and stress development trends, which is critically important for the early detection of potentially dangerous conditions for the operator.
Predictive performance was evaluated by comparing model-generated trajectories with the corresponding observed temporal evolution of psychophysiological indicators throughout the monitoring period. The agreement between predicted and observed trends confirmed the capability of the proposed framework to identify changes in navigator functional states prior to observable operational performance degradation. Because the primary objective of the study was methodological validation, external validation using an independent dataset was not performed at this stage.
-
The results obtained confirm that fatigue and stress in ship operators are systemic in nature and cannot be effectively assessed using individual instantaneous indicators. The proposed approach allows us to move from reactive assessment of the state to proactive prediction of changes in the functional state in the human-machine control loop.
Unlike conventional fatigue-monitoring approaches that mainly identify existing symptoms, the proposed framework treats navigator functional states as continuously evolving digital entities capable of supporting predictive operational decisions. This concept aligns with current developments in intelligent maritime systems, digital twins, and human-centered automation.
From a maritime safety perspective, the ability to detect dangerous trends early creates the conditions for timely adjustments to watch schedules, navigation loads, or automation levels. This is consistent with modern approaches to human factor management in high-risk systems, where the key is not to eliminate the consequences, but to prevent the development of critical conditions. Thus, the proposed AIA model and concept can be considered an effective element of decision support systems for improving maritime safety by accounting for the operator's dynamic state.
Comparison with recent AI-based approaches
-
Recent studies are increasingly using machine learning and deep learning methods (in particular, deep, recurrent, and transformer networks)[50−54] to assess functional states and detect fatigue based on physiological signals. Despite high prediction accuracy on large datasets, these approaches require significant computational resources and large training datasets, operating on a 'black box' principle with low interpretability.
In contrast, the developed mathematical framework is adapted to the operating conditions of ships, which are characterized by a limited volume of continuous time series of physiological observations. The proposed approach does not replace artificial intelligence tools, but rather forms an interpretable model for formalizing the processes of physiological adaptation, circadian rhythms, fatigue accumulation, and stress responses. Due to its low computational complexity, this model is suitable for integration into existing real-time decision support systems.
In light of this, the developed mathematical framework should be viewed as complementary to modern artificial intelligence methods. A direction for further research is the development of hybrid architectures that combine interpretable mathematical models with machine learning algorithms, which will improve forecasting accuracy while maintaining the transparency and operational interpretability of the results obtained.
Practical implementation in intelligent bridge systems
-
The developed mathematical framework is designed to be integrated into modern integrated bridge systems as an additional decision-support module that operates in parallel with the existing navigation support system. Continuous collection of psychophysiological indicators using wearable or non-invasive sensors allows for real-time assessment of the operator's functional state, while the predictive module ensures early detection of fatigue accumulation, increased stress levels, or decreased operational readiness before physical deterioration in task performance occurs.
The proposed architecture does not replace the navigator's decision-making but complements it by providing objective data on the predicted dynamics of the operator's condition. This facilitates adaptive bridge resource management (BRM), dynamic workload distribution, and the timely implementation of preventive safety measures. Furthermore, the developed approach is compatible with digital shipboard technologies, the concept of Human Digital Twins, and human-centered cyber-physical systems for maritime transport.
Limitations
-
The present study has several limitations. The number of participants was intentionally limited because the primary objective was methodological validation of the proposed framework rather than statistical generalization. Each participant, however, contributed an extensive longitudinal physiological dataset collected during both simulator-based and real onboard operations. An additional limitation is that external validation using an independent cohort of navigators was beyond the scope of the present proof-of-concept study. Future research will include multi-vessel and multi-company datasets to evaluate the generalizability and predictive robustness of the proposed framework across broader operational conditions.
Future research
-
Future research will focus on extending the proposed framework through large-scale multi-vessel validation, integration with wearable sensing technologies, explainable artificial intelligence, and digital twin architectures. Particular attention will be devoted to developing adaptive human-centered decision-support systems capable of continuously assessing navigator functional states within intelligent maritime environments.
-
The paper proposes an automated approach to monitoring and predicting fatigue and stress in ship operators as key human risk factors in maritime safety systems. The methodology combines the analysis of psychophysiological indicators, mathematical modeling of their temporal dynamics, and the concept of an abstract information automaton to support decision-making in the human-machine control loop.
The results of experimental testing on navigation simulator data and real navigation confirmed the ability of the proposed model to adequately describe and predict changes in the functional state of the operator, in particular the processes of fatigue accumulation and the development of stress reactions. The high explanatory power of the models indicates their practical suitability for use in proactive safety management systems.
The practical significance of the study lies in the possibility of early detection of potentially dangerous conditions of the ship's captain and the timely implementation of preventive measures, such as adjusting watch schedules or the level of automation. The limitations of the work are the use of a limited sample and the static nature of the models, which determines the advisability of further research in the direction of expanding the experimental base, integrating adaptive and fuzzy models, as well as testing the approach in real operating conditions.
Beyond maritime safety applications, the proposed framework establishes a digital foundation for integrating human functional state awareness into future intelligent bridge systems, autonomous vessels, and digital maritime ecosystems where human operators remain an essential component of cyber-physical decision-support architectures. This study is a proof-of-concept that demonstrates the feasibility of integrating psychophysiological monitoring into shipboard decision-support systems. The proposed approach lays the foundation for modern bridge systems capable of combining psychophysiological monitoring, predictive analytics, and human-centered decision support within a single digital environment. The next steps involve implementing the system in real time, testing it on various types of vessels, and integrating it with digital twin technologies and explainable artificial intelligence.
The authors would like to thank the staff of the Maritime Training Center for their assistance during the simulator-based experiments and all participants who took part in the study. This research received no external funding.
-
The authors confirm their contributions to the paper as follows: conceptualization: Nosov P, Melnyk O, Koretsky O; methodology: Nosov P, Melnyk O, Koretsky O; software: Nosov P, Zinchenko S; validation: Nosov P, Koretsky O, Zinchenko S, Melnyk O; formal analysis: Melnyk O, Malaksiano M; investigation, Nosov P, Koretsky O, Kucherenko V; resources: Burmaka O, Kucherenko V; data curation: Nosov P, Zinchenko S; writing—original draft preparation: Nosov P, Melnyk O; writing—review and editing: Melnyk O, Onishchenko O, Malaksiano M, Burmaka O, Kucherenko V; visualization: Nosov P, Zinchenko S; supervision: Melnyk O; project administration: Melnyk O. All authors have read and agreed to the published version of the manuscript.
-
The data presented in this study are available from the corresponding author upon reasonable request. The data are not publicly available due to privacy considerations related to the psychophysiological measurements collected from study participants.
-
The authors declare that they have no conflict of interest.
- Copyright: © 2026 by the author(s). Published by Maximum Academic Press, Fayetteville, GA. This article is an open access article distributed under Creative Commons Attribution License (CC BY 4.0), visit https://creativecommons.org/licenses/by/4.0/.
-
About this article
Cite this article
Nosov P, Melnyk O, Koretsky O, Zinchenko S, Malaksiano M, et al. 2026. A predictive decision-support framework for monitoring navigator functional states using psychophysiological modeling. Digital Transportation and Safety 5(3): 273−288 doi: 10.48130/dts-0026-0022 

A predictive decision-support framework for monitoring navigator functional states using psychophysiological modeling
- Received: 14 July 2026
- Revised: 29 July 2026
- Accepted: 11 August 2026
- Published online: 30 September 2026
Abstract: The transformation of maritime operations demands intelligent decision-support systems that integrate navigational, engineering, and human-state information into a unified operational environment. However, existing shipboard systems primarily process technical and environmental parameters, while the dynamically evolving functional state of the navigator remains largely excluded from real-time decision-making. This study proposes a digital decision-support framework for predictive monitoring of navigator functional states based on psychophysiological modeling. The proposed framework combines time-series decomposition, robust regression, transfer-function identification, and the Abstract Information Automaton (AIA) to construct a digital representation of operator functional states, including circadian rhythms, adaptation processes, fatigue accumulation, and stress responses. The methodology was validated using experimental data collected both in a certified navigation simulator (Navi Trainer 5000) and during real ship operations. The proposed framework extends conventional fatigue-monitoring approaches by integrating predictive human-state assessment into digital maritime decision-support systems and provides a foundation for future intelligent bridges, autonomous vessels, and human-centered cyber-physical maritime environments.