













-
Global warming is a phenomenon observed in all regions of the planet, directly linked to greenhouse gas (GHG) emissions, such as carbon dioxide (CO2). In the context of climate change, the role of forests in reducing GHGs in the atmosphere through carbon sequestration has been emphasized[1], as has the importance of understanding the dynamics and processes involved in carbon removal in forest ecosystems[2]. However, the carbon flow is conditioned by numerous abiotic, biotic, and anthropogenic factors[3,4].
Carbon sequestration, i.e., the long-term removal of CO2 from the atmosphere by forests[5], can be quantified using estimates of aboveground and belowground plant biomass[6]. Trees remove CO2 from the atmosphere through photosynthesis, storing a portion in woody tissues and other components such as lignin and related compounds, whereas the remainder is released through respiration[7,8]. As tree species have large root systems, they play a key role in nutrient cycling by returning part of the absorbed carbon to the soil via litterfall and gradual root decomposition[9].
Litter deposition is an important source of carbon input into the soil[10−12], as part of the carbon absorbed by trees is stored in their leaves, bark, branches, and root exudates[13−16]. After physiological senescence, these components are deposited onto the soil's surface as litter[16]. Under suitable temperature and moisture conditions, this organic material is decomposed by microorganisms, releasing part of the CO2 back into the atmosphere while incorporating the rest as organic matter into the soil[17−19], which is largely composed of carbon[20,21].
However, tree species exhibit substantial variation in carbon content across their leaves and other components[10,13,22], which makes the relationship among the vegetation, litter, and soil compartments inherently complex. The terrain's slope can further influence these relationships through rainfall-driven surface runoff[23,24], directly affecting the amount of plant biomass deposited on the soil's surface. In addition, climate also plays a key role in these interactions[4,25], as soils in high-altitude subtropical and temperate regions tend to exhibit slower microbial activity compared with tropical regions, where decomposition rates and CO2 release are higher[26]. This pattern applies to the mixed ombrophilous forest (MOF) in southern Brazil, which is predominantly located in high-altitude areas and is subject to low temperatures and frequent frost events[27,28]. This forest type is characterized by the presence of the emblematic species Araucaria angustifolia (Bertol.) Kuntze, which contributes significantly to the forest's structure and litter composition[29,30].
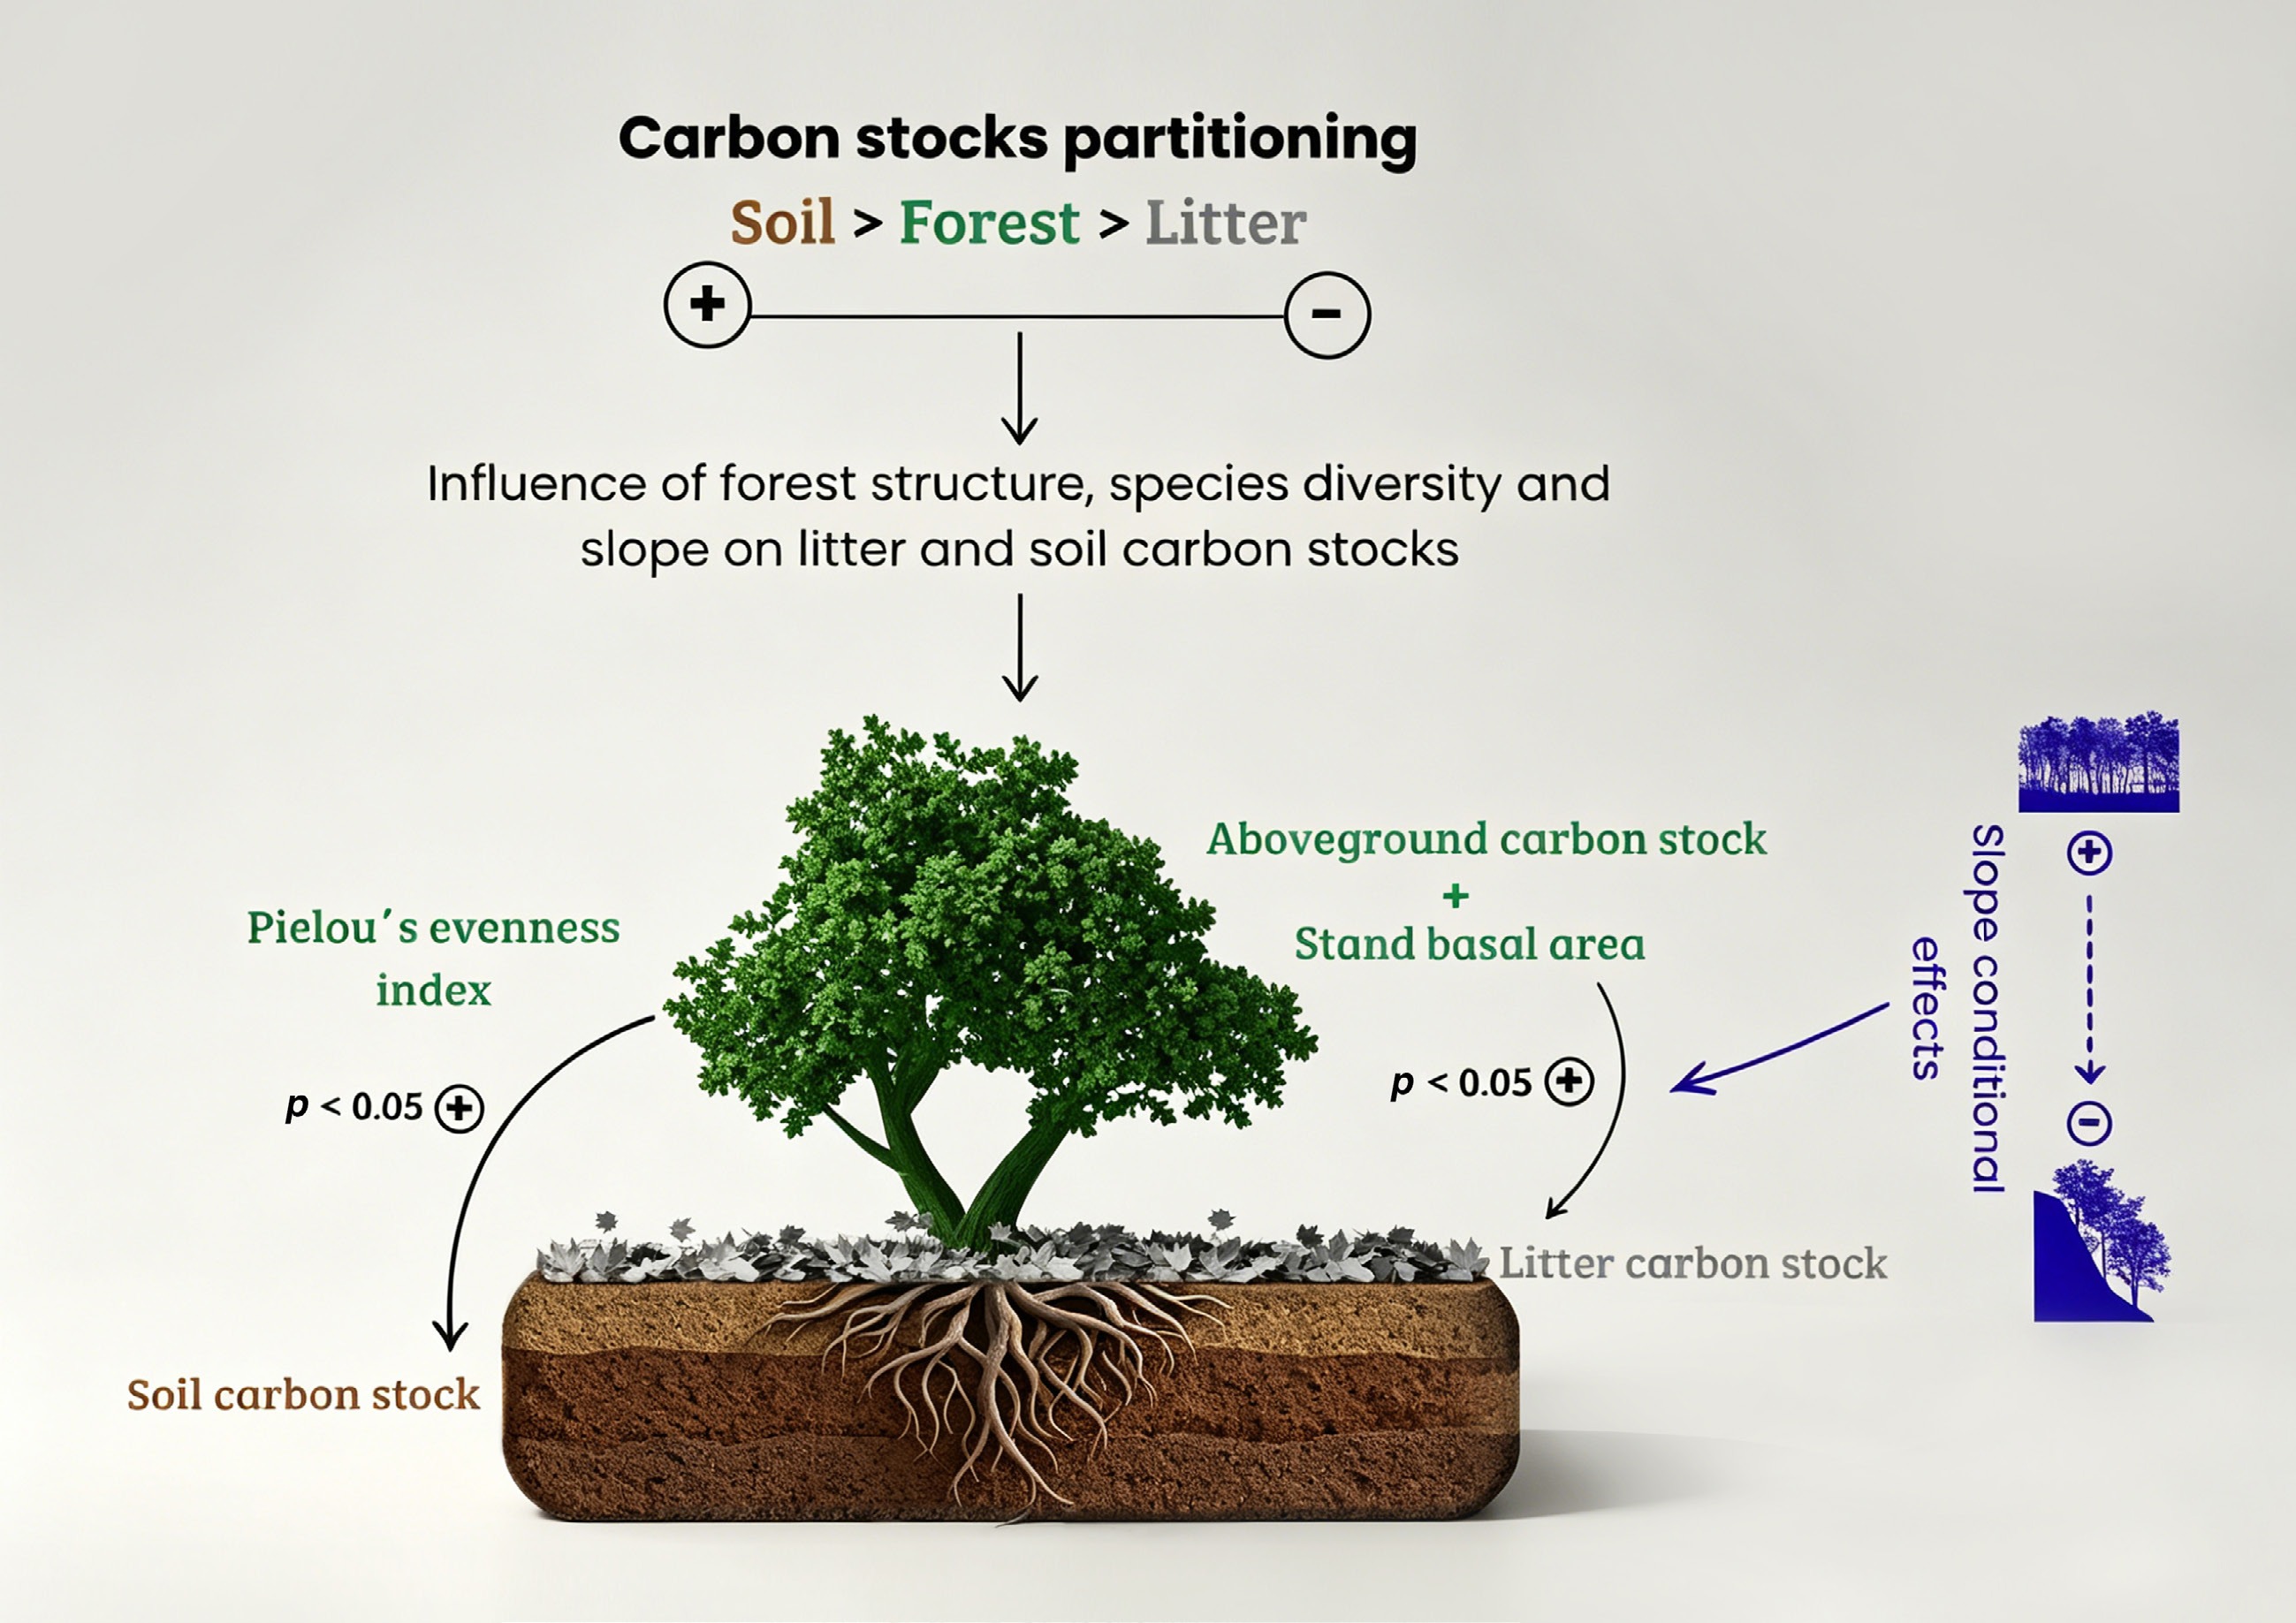
Given the global importance of forest ecosystems for carbon sequestration and storage, understanding the factors that influence carbon fluxes and partitioning is essential for developing effective climate change mitigation strategies[31,32]. Although litter and soil play a key role in carbon sequestration and balance[29,33−35], studies conducted in MOF have primarily focused on vegetation and aboveground carbon stocks[30,36,37]. Accordingly, the objective of this study was to identify the factors influencing carbon partitioning among the vegetation, litter, and soil in a fragment of MOF. According to the premise of carbon fluxes among these compartments, we tested (i) the influence of the forest's attributes on litter carbon stocks, (ii) the influence of the forest's attributes and litter on soil carbon stocks, and (iii) the influence of the terrain's slope on these relationships.
-
The study was conducted in an area of 8.3 ha of MOF located in Curitibanos, Santa Catarina, southern Brazil (Fig. 1). The region is characterized by a Cfb climate, classified as humid temperate with mild summers and cold winters[38,39], with a mean annual temperature of 16 °C, mean annual precipitation ranging from 1,500 to 1,700 mm, and a mean altitude of 830 m above sea level. The soils in the study area are predominantly Neosols and Cambisols, both characterized as shallow and poorly developed. The surrounding landscape consists mainly of pasturelands and agricultural and forestry areas, with small patches of secondary forest[40].
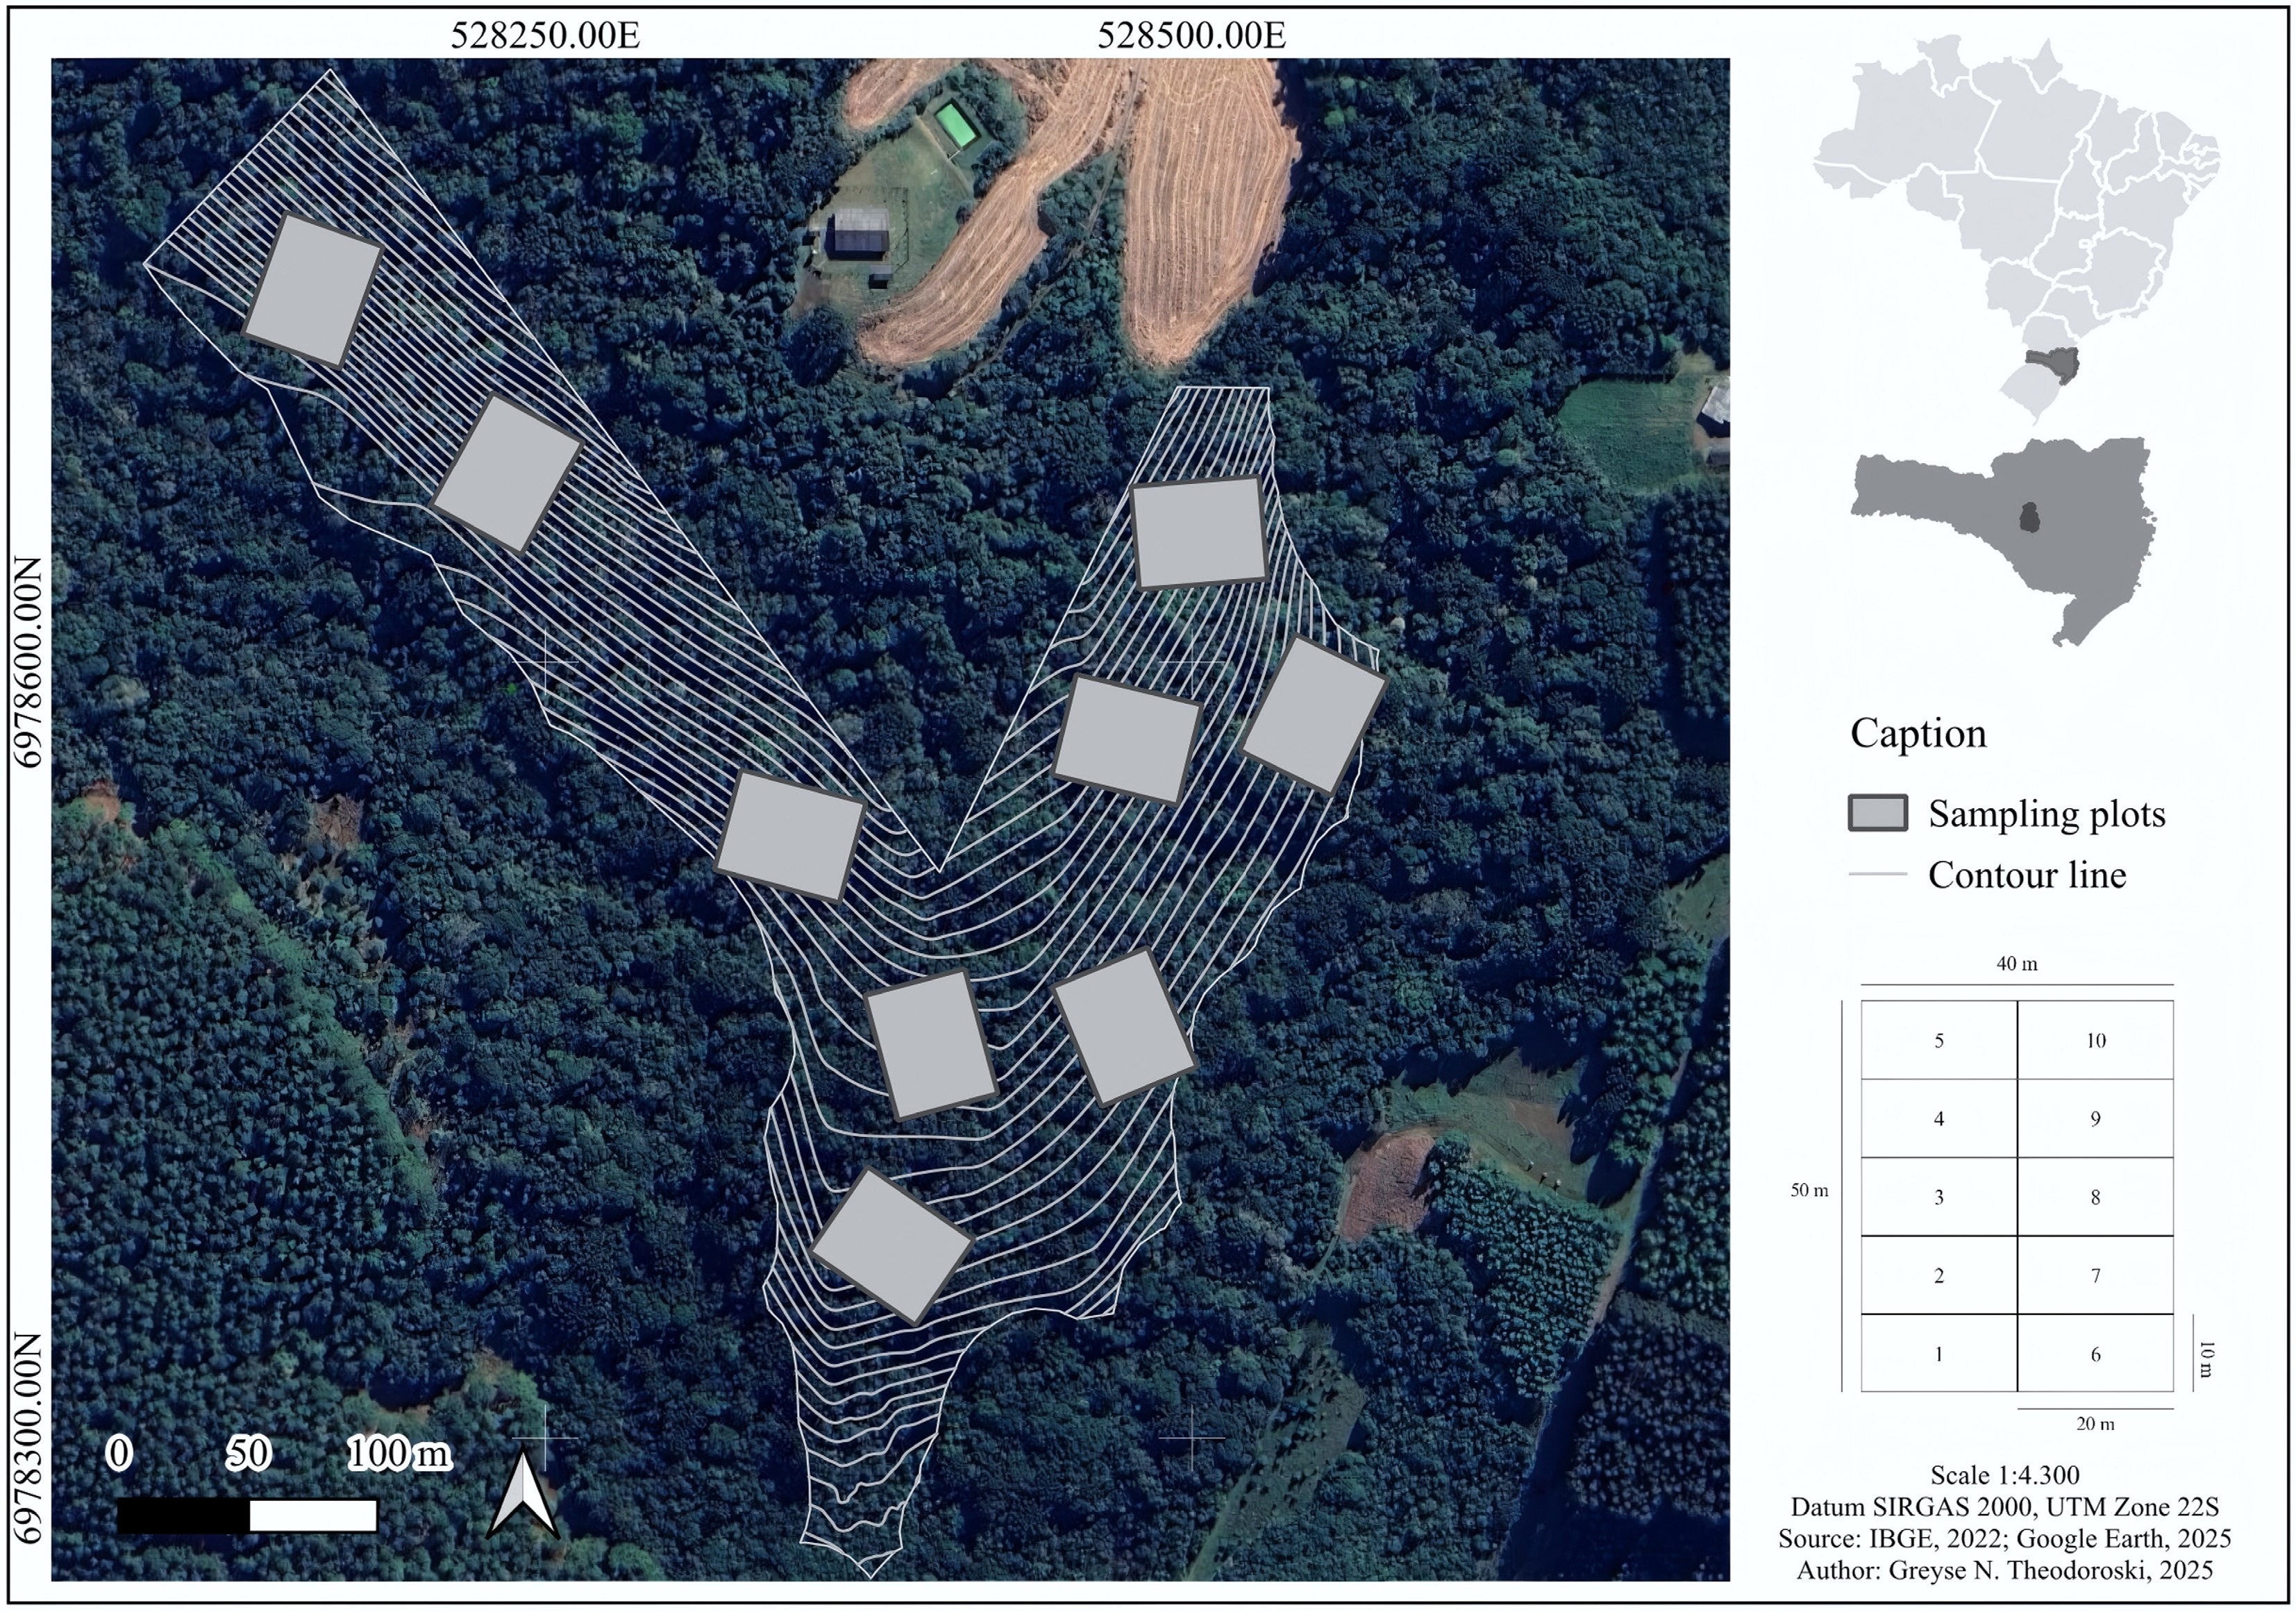
Figure 1.
Location of sampling plots in the study area, Curitibanos, Santa Catarina, Brazil. Top right: Brazil is shown in light gray and Santa Catarina state in dark gray. Center right: The county of Curitibanos in Santa Catarina. Left: field design of the sampling plots. The contour lines are spaced at 5 m.
Data collection
Forest structure, diversity, and carbon stocks
-
Field data were collected in February 2023 from nine permanent sampling plots of 40 × 50 m (2,000 m2) established in the study area (Fig. 1). Each sampling plot unit was subdivided into 10 subplots of 10 m × 20 m to facilitate data collection and organization. All trees within the sampling plots with a diameter at breast height (DBH, measured at 1.3 m above ground) ≥ 10 cm were assessed, measured, and identified to the species or genus level. Tree height was measured using a Haglöf Vertex V laser hypsometer. Species were classified according to the Angiosperm Phylogeny Group system (APG IV), and their taxonomic nomenclature was verified using the Flora and Fungi of Brazil database[41].
Basal area (G, m2 ha−1) was used as a proxy for forest structure, whereas the Shannon diversity index (H') and Pielou's evenness index (J) were used as proxies for species diversity, and aboveground carbon stock (AGC, Mg ha−1) was used as a proxy for forest carbon stocks. All variables were quantified and analyzed at the sampling unit level (plot level). The equations used to calculate the diversity and evenness indices are presented in Eqs 1 and 2. The aboveground biomass (AGB) of all trees was estimated, based on field-measured diameters and heights using Eq. (3)[42]. Species-specific wood density values were obtained from the study by Oliveira et al.[43]. The carbon stock per tree was estimated by multiplying tree biomass by a conversion factor of 0.456, as recommended for subtropical mixed forests[6]. To estimate AGC, tree-level carbon values were summed for each sampling unit and extrapolated to 1 ha. The AGC of Araucaria angustifolia (hereafter referred to as Araucaria) was also used as a proxy for forest carbon stocks, given its important role as a carbon sink in MOF[30]. In addition, the terrain's slope for each sampling unit was quantified at a 5-m resolution using data from the Santa Catarina Geographic Information System[44].
$ {H}^{\text{'}}=~-\sum\limits_{i=1}^{S}{p}_{i}\times \ln{p}_{i} $ (1) $ J=\dfrac{H'}{{H}_{\max}} $ (2) $ AGB=0.0567\times {\left({DBH}^{2}\times H\times \rho \right)}^{0.989} $ (3) where, pi is the proportion of individuals per i species; ln is the Neperian logarithm; S is species richness; Hmax is the logarithm of species richness, i.e., ln(S); AGB is individual aboveground biomass (kg); DBH is diameter at breast height (cm); H is tree total height (m); and ρ is the wood density (g cm–3).
Litter carbon stock
-
Litter was collected from the four corners of each sampling unit using a 0.5 m × 0.5 m grid. Within each grid, all dead organic material deposited on the soil was collected and subsequently stored. The samples were then dried in ovens with air circulation and renewal at 65 °C until they reached a constant weight. After drying, the samples were ground using a knife mill and sieved for carbon content analysis using the muffle furnace method[45,46], following the procedures described in the Brazilian Association of Technical Standards No. 13,999[47]. Samples were placed in a muffle furnace at 525 °C for 3 h and then weighed on a precision balance. The organic matter content was determined on the basis of the mass loss of the incinerated material, according to Eq. (4).
$ MO\left(\% \right)=\dfrac{(P-\left(T-C\right))\times 100}{P} $ (4) where, MO (%) is the organic matter content, P is the sample's weight after drying at 65 °C (g), C is the crucible's tare (g), and T is the weight of ash and the crucible (g). Organic matter was converted to carbon using the factor proposed by Carmo & Silva[46], i.e., dividing the organic matter content by two. To estimate litter carbon stock (LCS), the carbon quantified in the samples (the mean of four 0.5 m × 0.5 m quadrats) was extrapolated to the standard unit of 1 ha. The step-by-step procedure for quantifying LCS is detailed in the Supplementary Material (Supplementary Fig. S1).
Soil carbon stock
-
To quantify organic carbon in the soil, a trench approximately 0.5 m deep was excavated in each sampling unit to collect soil samples from the soil layers at 0–10, 10–20, and 20–30 cm deep. In each trench, one undisturbed soil sample per layer was collected using cylindrical cores for determining bulk density[48]. In the same layers, additional soil samples were collected for analysis of the soil organic carbon (SOC). Subsequently, the soil samples were oven-dried at 60 °C in a forced-air circulation oven and stored for carbon quantification.
Soil organic carbon was quantified from organic matter using the methodology described by Tedesco et al.[49], which is based on the oxidation of soil organic matter with a sulfochromic solution and spectrophotometric determination of Cr3+, with absorbance measured at 645 nm. After determining the carbon for each soil layer, the obtained values were extrapolated to a per-hectare basis (1 ha) for each layer individually and for the total soil profile by summing the carbon stocks of the three layers. The soil carbon stock (SCS) was calculated using Eq. (5)[50].
$ SCS=\dfrac{SOC\times Ds\times E}{10} $ (5) where, SCS is the soil carbon stock (t ha−1), SOC is the soil organic carbon content, Ds is the soil bulk density (g cm−3); E is the soil layer's thickness (cm); and 10 is a unit conversion factor to scale the results to a per-hectare basis. Detailed procedures for quantification of SCS are provided in the Supplementary Material (Supplementary Fig. S2).
Data analysis
-
First, all variables were subjected to an exploratory data analysis by calculating the descriptive statistics of central tendency and dispersion[51]. We then assessed the carbon stock partitioning at the sampling unit level by calculating total carbon for each compartment (vegetation, litter, and soil) in both absolute and relative terms. Carbon stocks were compared using stacked bar charts. Principal component analysis (PCA) was applied to explore multivariate patterns in the dataset and to identify variables associated with carbon stocks. Following the ordination of sampling plots, each variable was compared to identify variations across the study area. Variables for each group of sampling plots generated by the PCA were compared using the nonparametric Mann–Whitney test (α = 0.05).
Variables associated with LCS and SCS identified by the PCA were selected to test (i) the effect of forest‘s attributes on litter carbon, and (ii) the combined effect of forest‘s attributes and litter on soil carbon. Simple and multiple linear regression models were fitted using the selected variables to test the individual effect of each predictor on LCS and SCS. We then tested the conditional effect of the terrain's slope on these predictors by refitting the previous models and including multiplicative interaction terms between slope and each significant predictor[52], allowing us to assess the influence of slope on LCS and SCS. The conditional effect of the terrain's slope (i.e., interaction terms in the linear models) was tested on the basis of the statistical significance of their coefficients (p ≤ 0.05). To visualize the effect of slope on the relationships between variables, interactions between slope and the predictors were plotted at three levels, representing mean slope, low slope (mean – 1 standard deviation [SD]), and high slope (mean + 1 SD). This procedure generated one regression line for each level, allowing an examination of how the predictors' effects vary across different slopes.
Model coefficients and confidence intervals were estimated using bootstrap resampling procedures based on repeated random sampling with replacement. Model significance was evaluated using F-tests, and the significance of the regression coefficients was assessed using Wald tests (α = 0.05). A predictor's effect was considered to be significant when the overall model was statistically significant (p ≤ 0.05). The models' performance was evaluated using the coefficient of determination (R2), which quantifies the proportion of variance explained by the model or predictor[53], and the residual standard error (RSE), which measures the average deviation of observed values from the model's predictions. The models' assumptions were assessed using graphical diagnostics, including checks for residual normality and homoscedasticity. All analyses and model fitting procedures were performed in R version 4.3.2[54], using the following packages: ds[55] for descriptive statistics, ggplot2[56] for graphical analyses, interactions[57] for visualizing interaction effects in linear models, FactoMineR[58] and factoextra[59] for PCA, and vegan[60] for calculating species diversity and evenness indices.
-
The descriptive statistics for all analyzed variables are presented in Table 1. Regarding forest-related variables, the values of H' and J indicate moderate species diversity and high species evenness, whereas the basal area and AGC values reflect high forest cover. Among these variables, carbon stocks exhibited the greatest variability, particularly the AGC of Araucaria (AGCa), which ranged from 0.5 to 25.9 Mg ha−1. LCS and SCS also showed high variability, ranging from 2.2 to 5.9 and from 11.2 to 40.3 Mg ha−1, respectively. Variation in soil carbon stocks was also pronounced among soil layers (Table 1; Supplementary Fig. S3). An analysis of the carbon stocks across different ecosystem compartments revealed substantial variation in carbon partitioning among the sampling plots (Fig. 2a). Relative values showed that soil accounted for the largest fraction of total carbon in most sampling plots (Fig. 2b); however, in some plots, vegetation stored more carbon than the soil.
Table 1. Summary of variables on forest structure, species diversity, and carbon stocks in a MOF fragment in southern Brazil
Descriptor Forest structure Species diversity Carbon stocks Stand basal area Shannon's index Pielou's index Forest Araucaria Litter Soil at 0.10 m Soil at 0.20 m Soil at 0.30 m Soil total Mean 29.8 2.49 0.82 69.0 10.6 3.7 28.0 22.3 22.6 73.0 Min. 20.8 2.26 0.73 45.9 0.5 2.2 16.8 17.4 11.2 46.0 Max. 38.3 2.67 0.85 95.3 25.9 5.9 41.7 32.9 40.3 102.0 SD 6.0 0.15 0.04 17.3 8.9 1.1 10.2 5.6 9.0 17.7 CV% 20.1 6.02 4.88 25.0 84.1 30.3 36.6 24.9 39.7 24.2 RSE% 15.4 4.63 3.48 19.2 64.6 23.3 28.1 19.2 30.5 18.6 SD, standard deviation; CV%, relative coefficient of variation; RSE%, relative sampling error. Basal area is expressed in m2 ha−1 and carbon stocks in Mg ha−1. 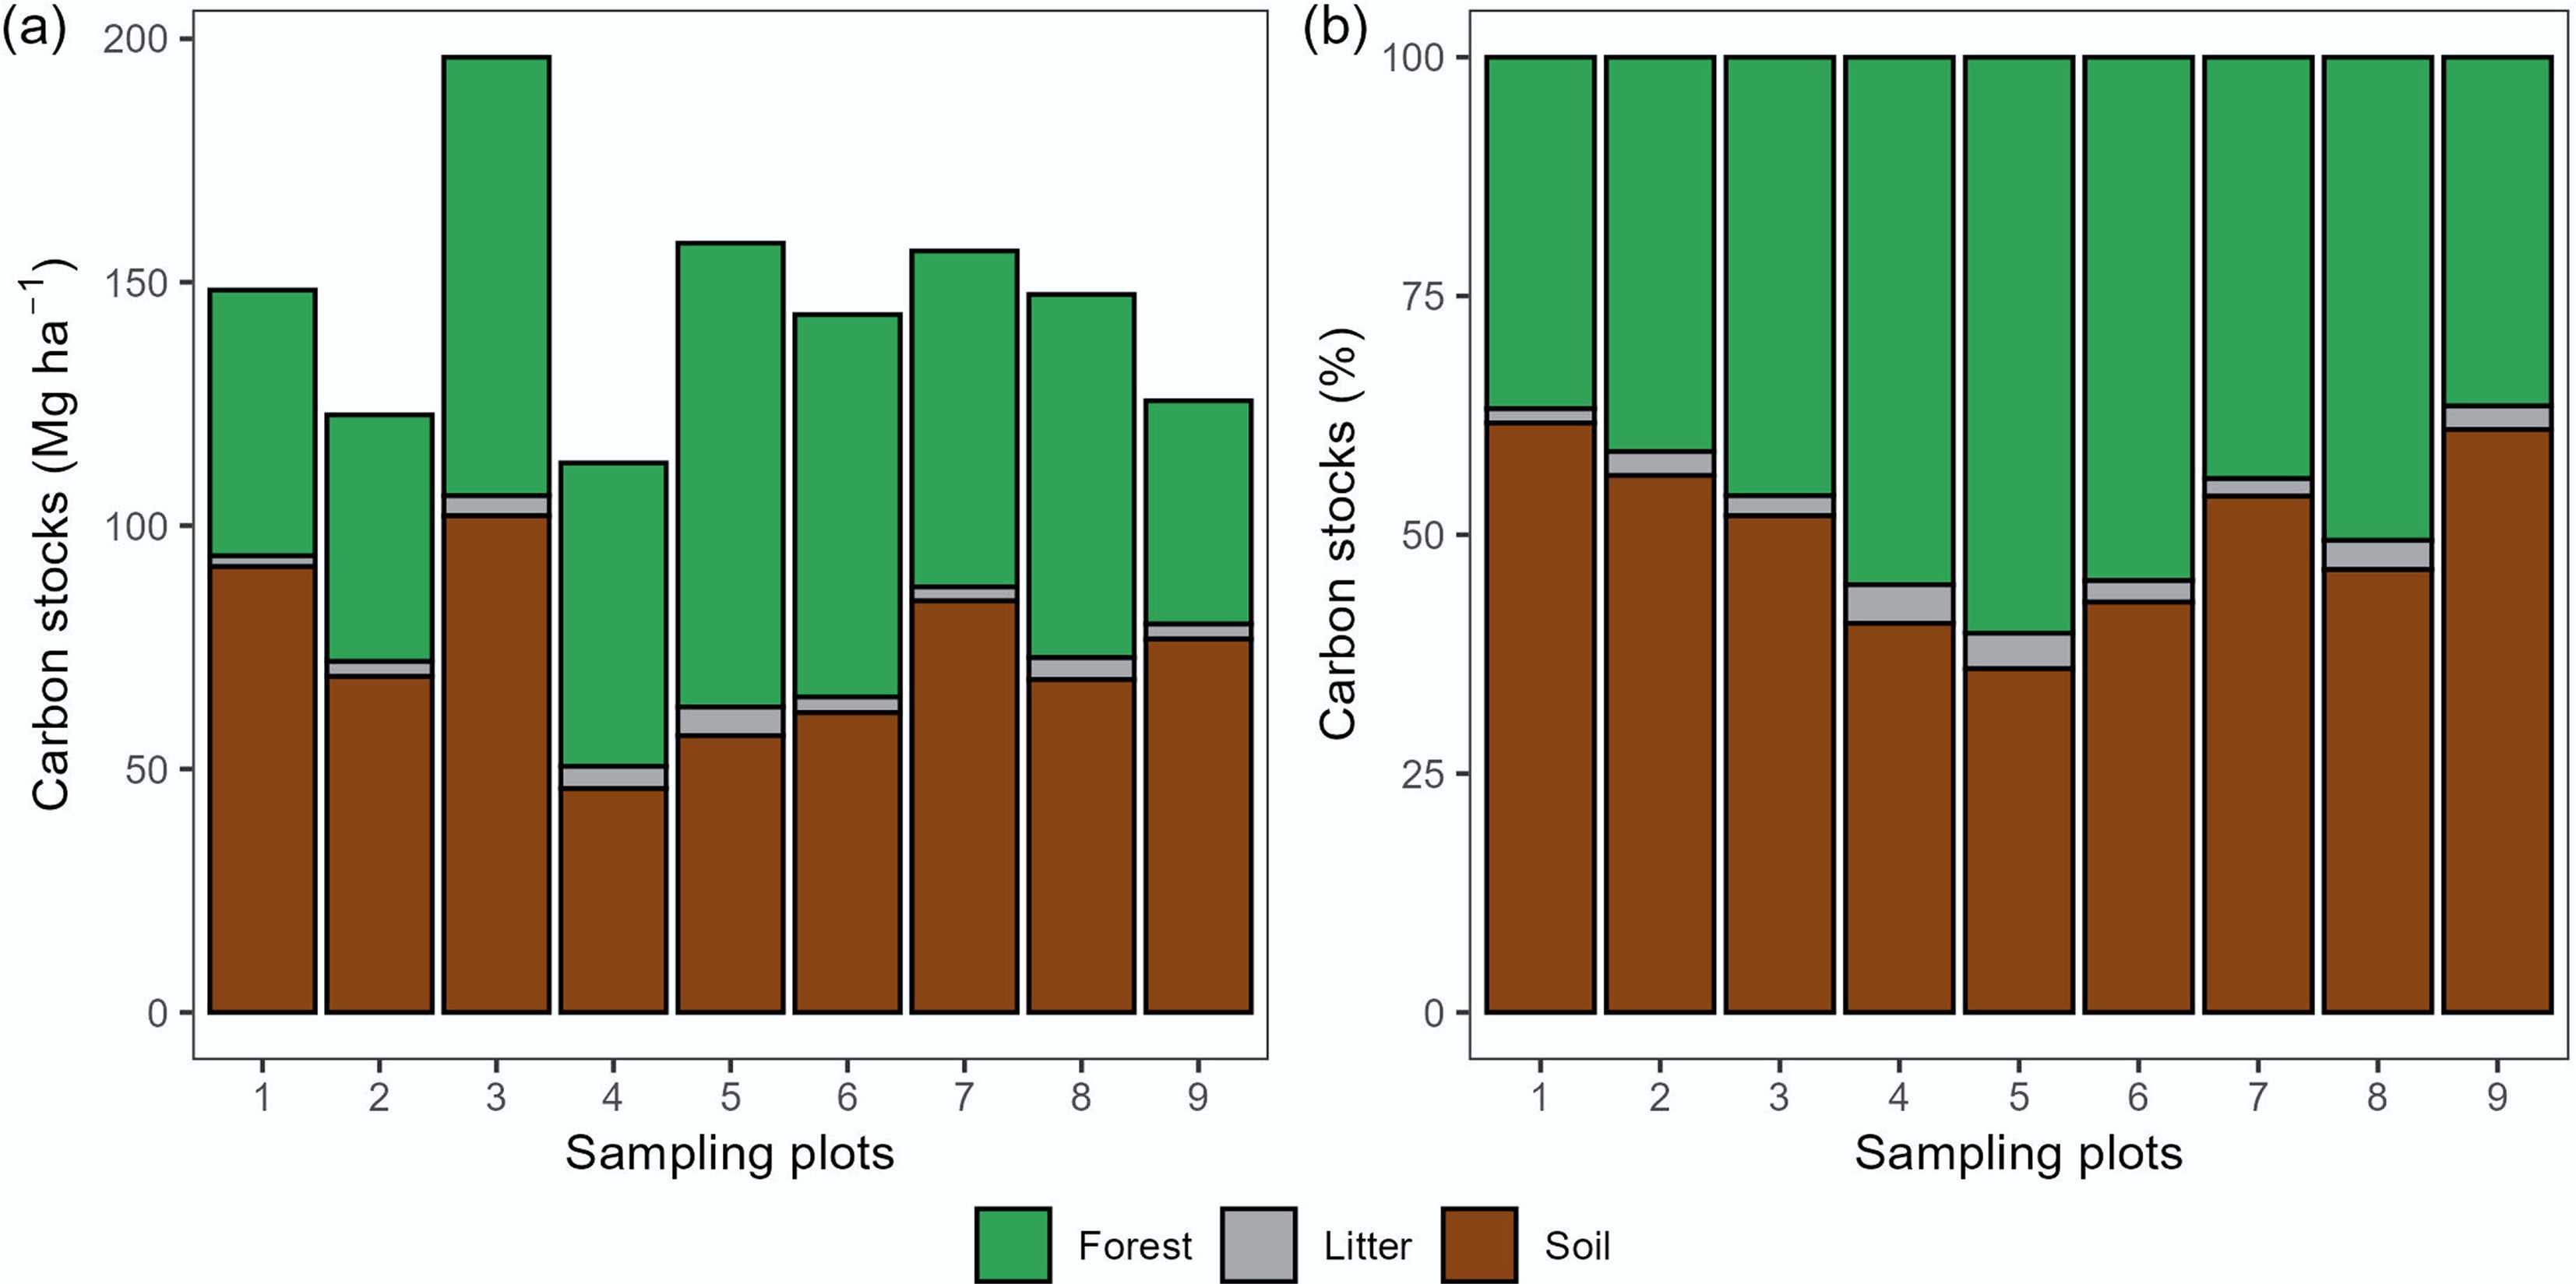
Figure 2.
Partitioning of carbon stocks in forest, litter, and soil by sampling plot in a MOF in southern Brazil.
Principal component analysis (PCA) revealed a distinction among sampling plots based on the analyzed variables (Fig. 3). One group, positioned on the left side of the PCA ordination (plots 4, 5, 6, and 8), was associated with basal area (G) and AGC, AGCa and LCS. The second group, located on the right side of the PCA ordination (plots 1, 2, 3, 7, and 9), was associated with SCS, slope, and species diversity (H') and evenness (J) indices. Sampling plots belonging to the first group indeed exhibited higher carbon stocks in vegetation and litter compared with those of the second group, which showed higher soil carbon stocks (Fig. 2a, b). When comparing variables between groups of sampling plots, significant differences (p < 0.05) were detected for litter and soil carbon stocks, as well as for species evenness (Fig. 4). Differences were also observed in forest structure (G), AGC, species diversity (H'), and slope, although these were not statistically significant (p > 0.05). Combined with the PCA results, these findings highlight variations in LCS and SCS associated with local differences in forest structure and topographic features.
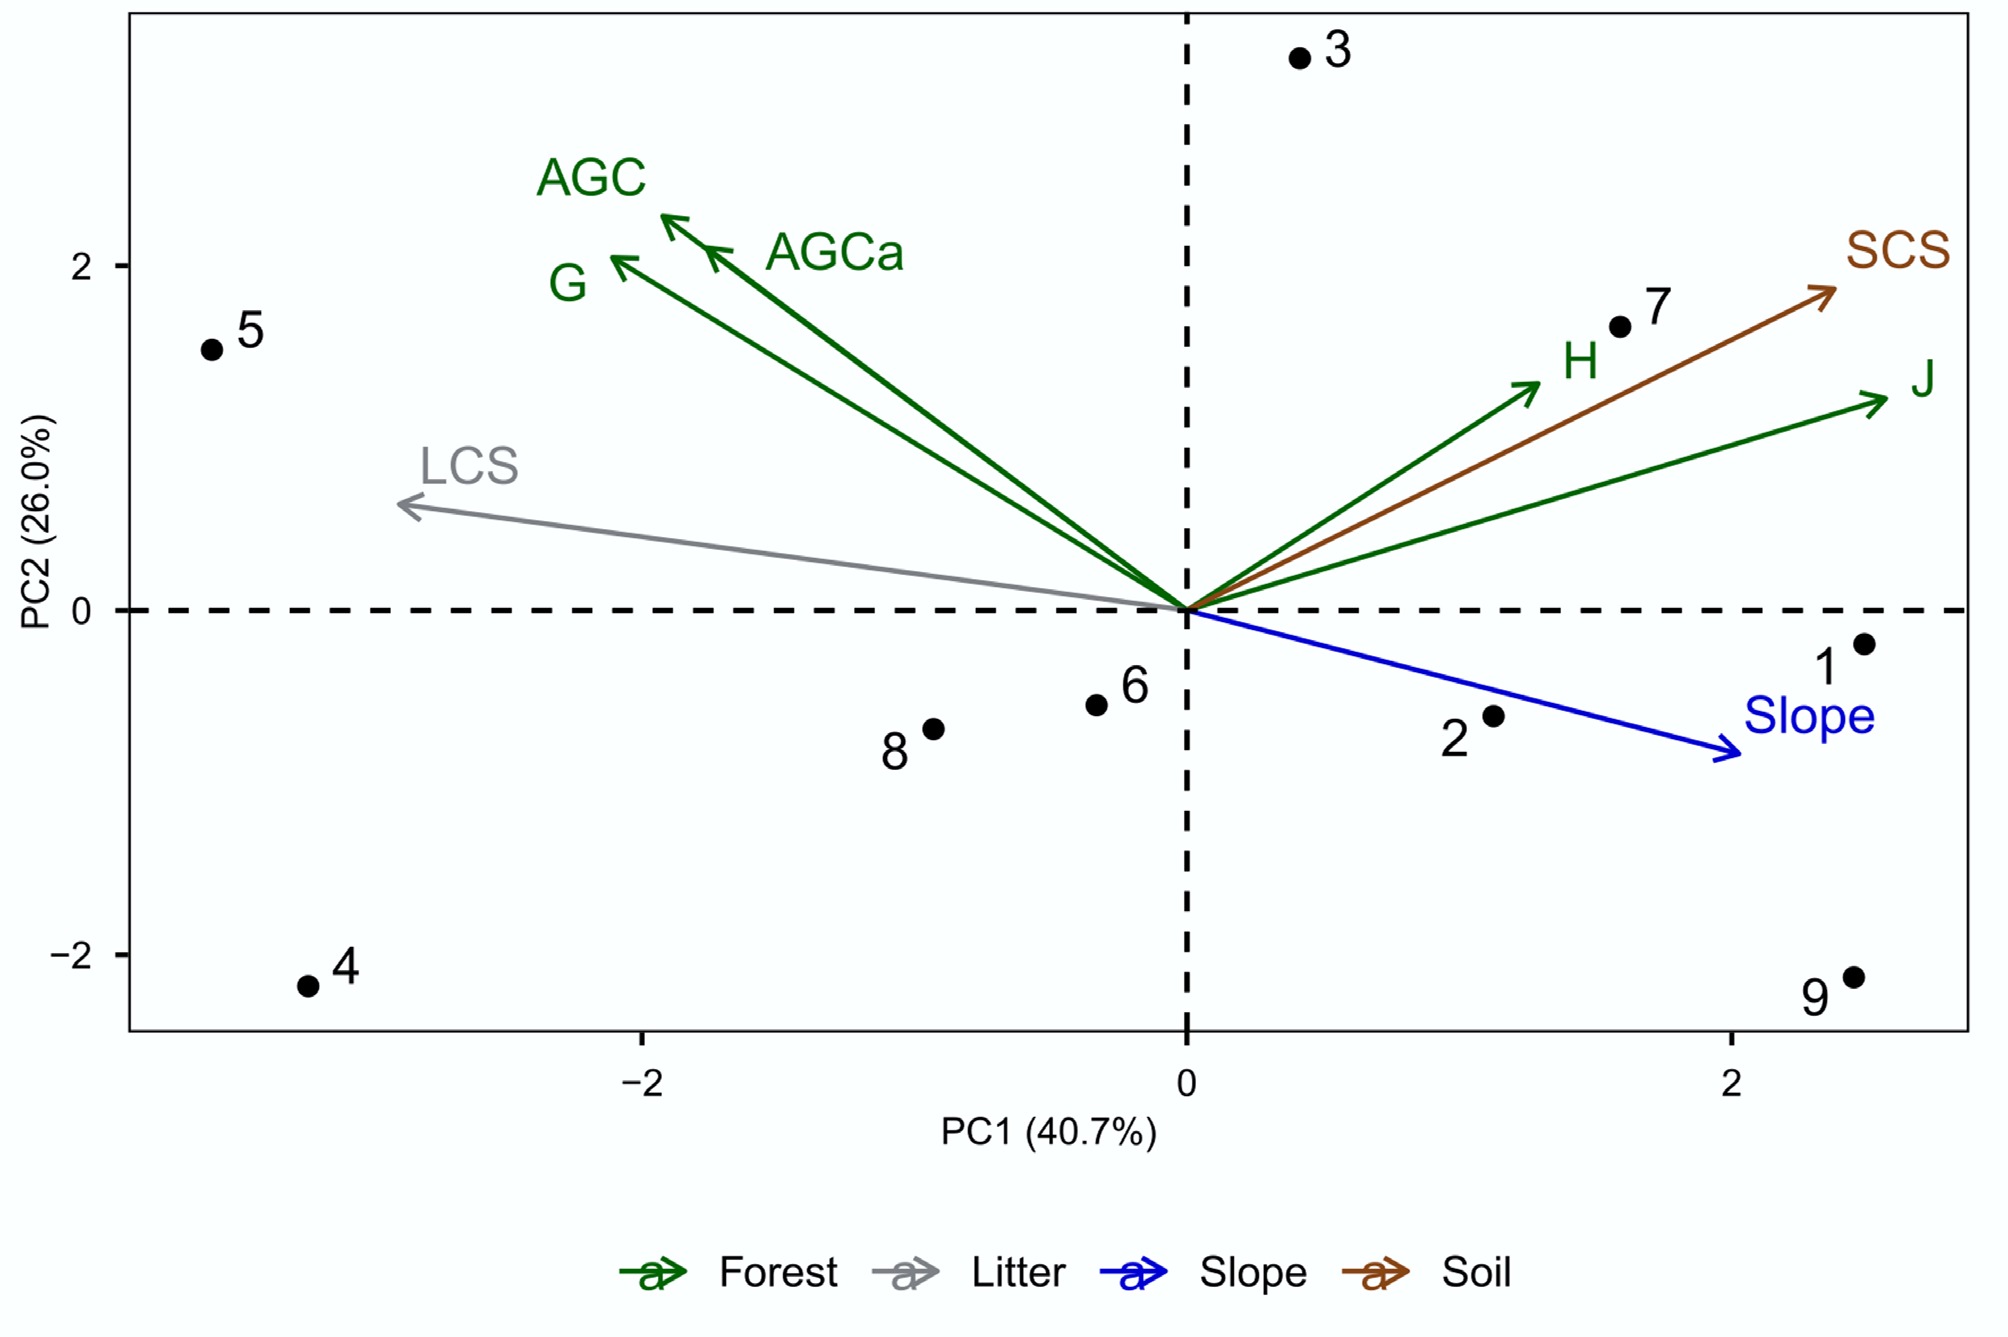
Figure 3.
Principal component analysis (PCA) for ordering the plots and variables in a MOF fragment in southern Brazil. G, stand basal area; H', Shannon's diversity index; J, Pielou's evenness index; AGC, aboveground carbon stock; AGCa, the AGC of Araucaria; LCS, litter carbon stock; SCS, soil carbon stock.
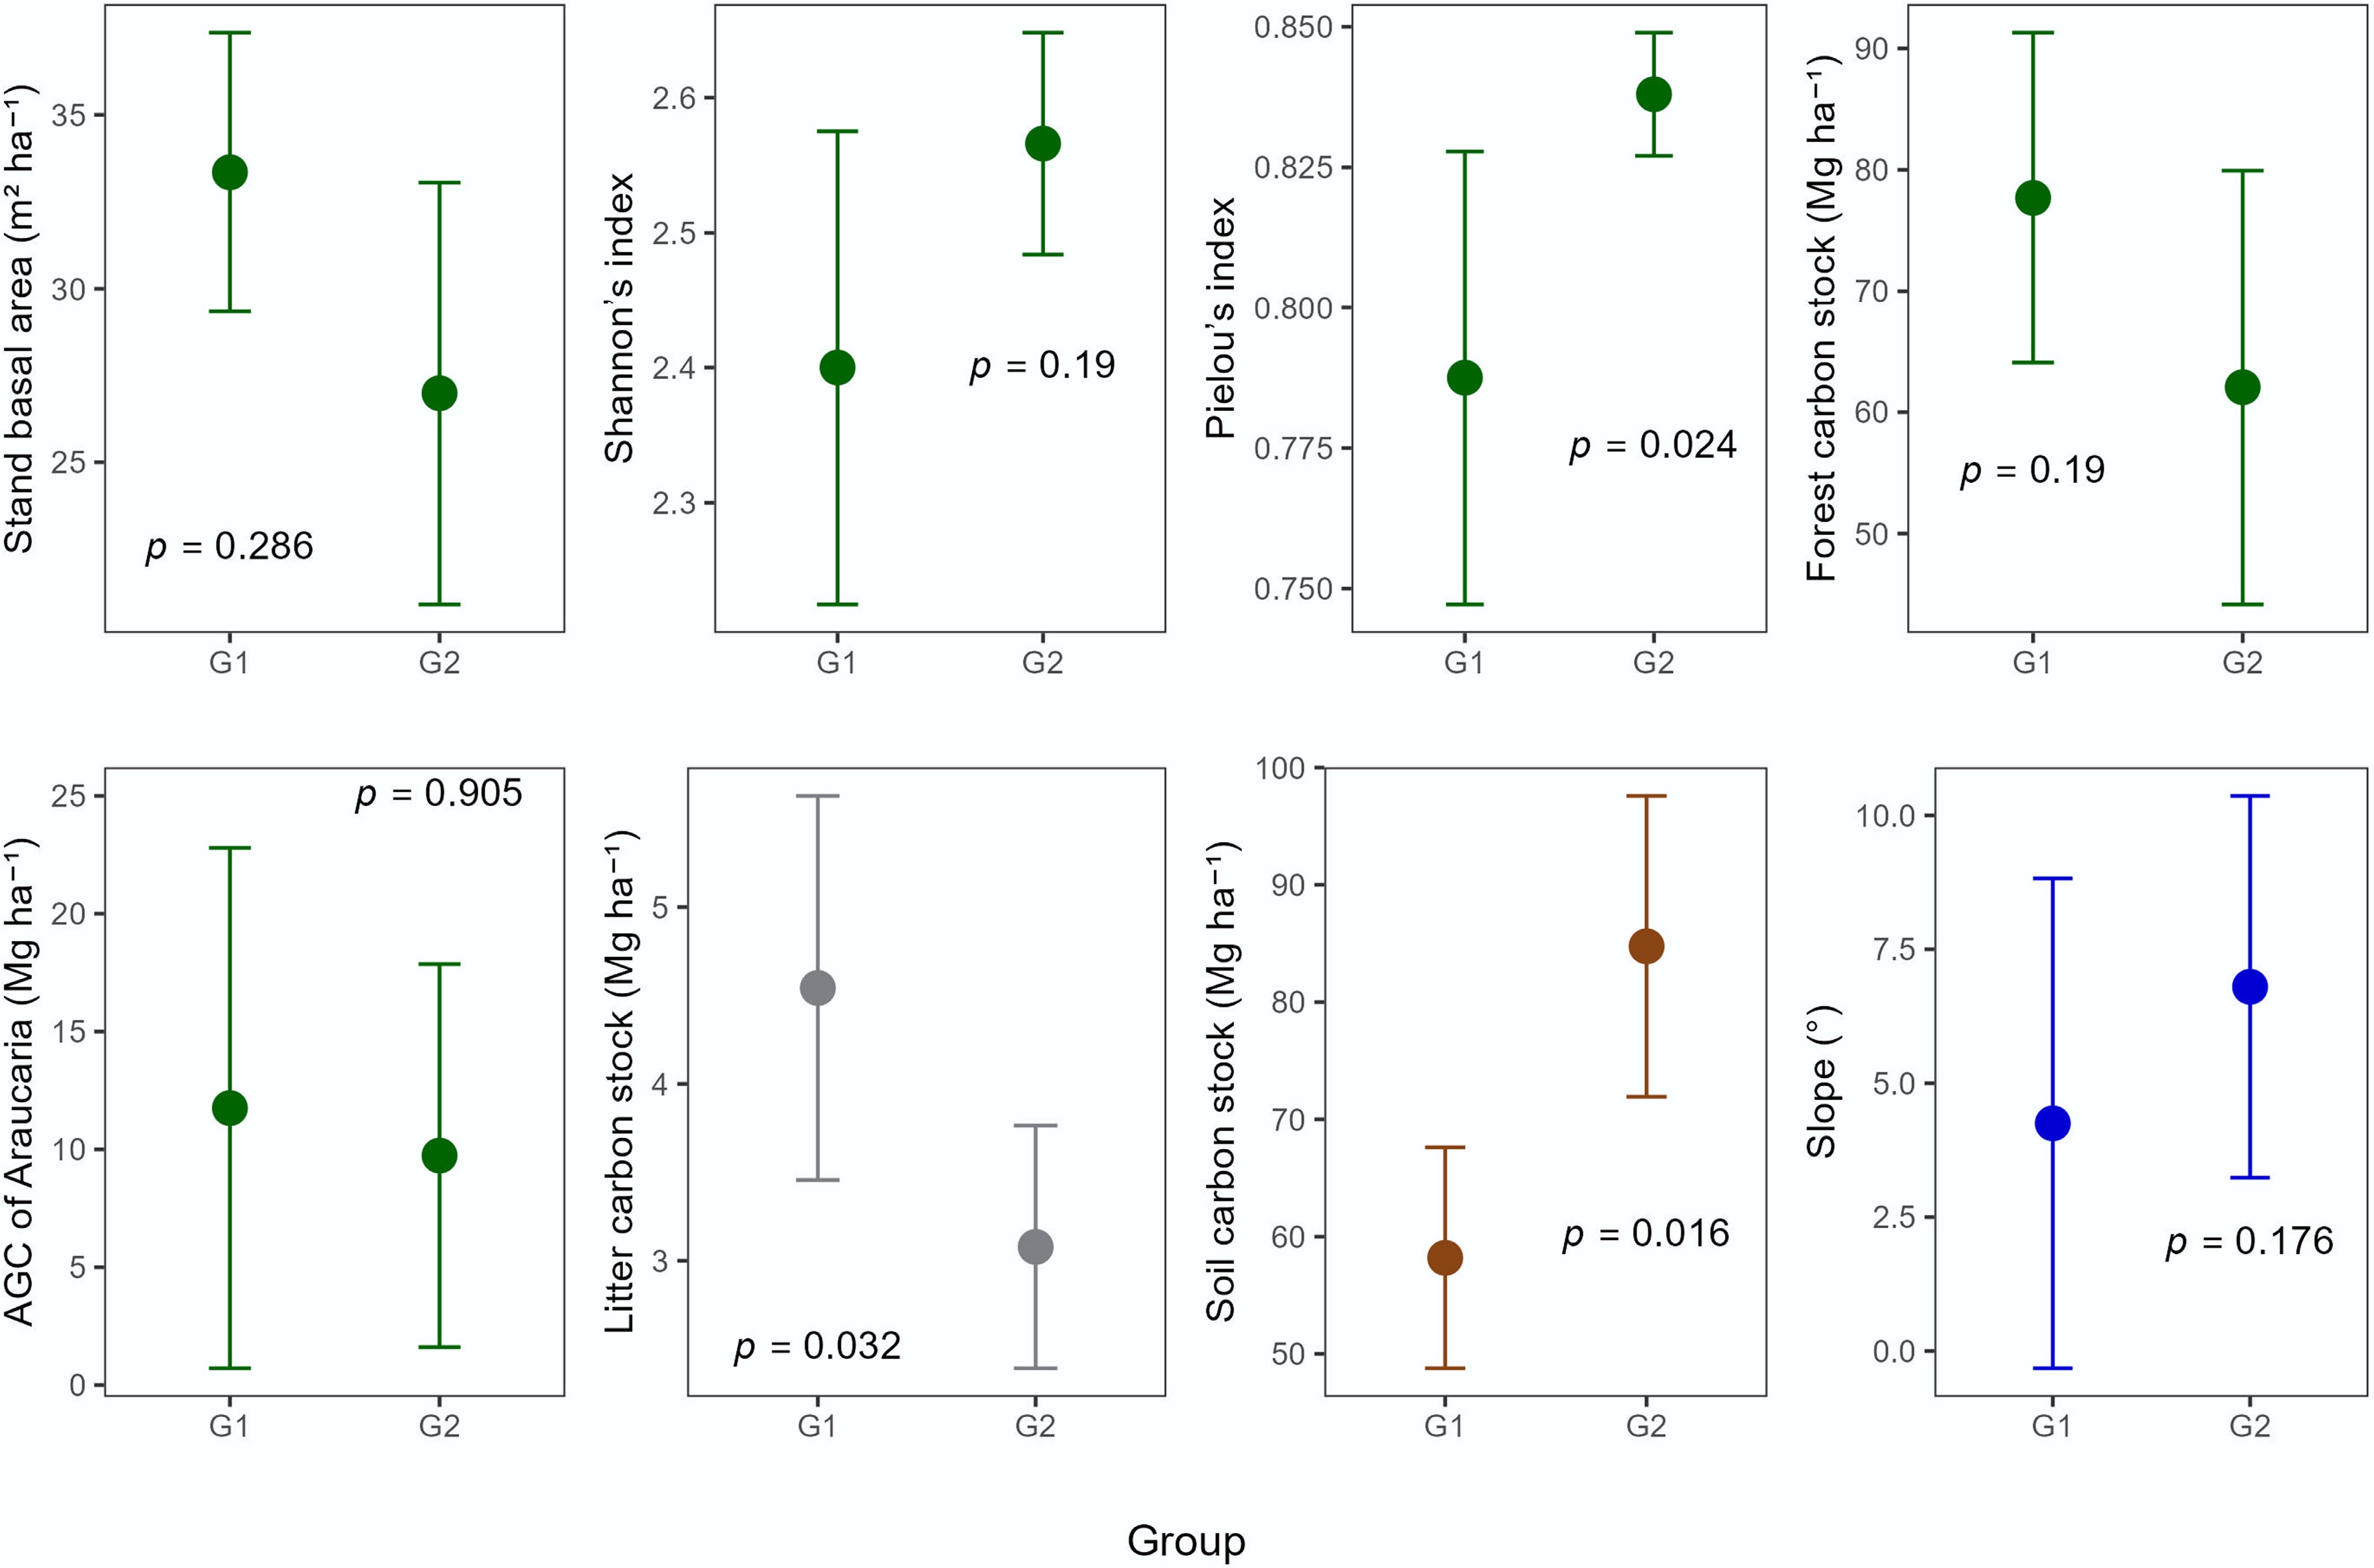
Figure 4.
Mean and standard deviation for the variables by plot groups (G1 and G2) in a MOF in southern Brazil. The p-value is based on the Mann–Whitney test at the 5% significance level. AGC, aboveground carbon stock; G1, Plots 4, 5, 6, and 8; G2, Plots 1, 2, 3, 7, and 9.
Effects of predictors on LCS and SCS
-
According to the PCA results (Fig. 3), the variables of forest's basal area, forest carbon stock, and AGCa were tested as predictors of LCS, whereas LCS and the species diversity and evenness indices were tested as predictors of SCS. forest's basal area and AGC showed a significant positive effect on LCS, whereas J was the only variable with a significant effect on SCS (Table 2). The interactive effect of the terrain's slope was significant (p < 0.05) only for LCS, negatively moderating the influence of basal area and AGC (Table 2; Fig. 5). Accordingly, basal area and AGC showed no effect on LCS in steeper sampling plots (+1 SD), in contrast to less steep sites, where the effects of these variables were stronger (Fig. 5).
Table 2. Linear models to test the effect of predictors on LCS and SCS in a MOF fragment in southern Brazil
Response Predictor F Df p-value R² RSE LCS G 5.67 7 0.042 0.447 0.897 G × slope 6.26 5 0.038 0.789 0.654 AGC 6.32 7 0.040 0.474 0.875 AGC × slope 5.42 5 0.041 0.764 0.692 AGCa 4.38 7 0.074 0.385 0.946 AGCa × slope 2.99 5 0.134 0.428 0.853 SCS J 9.19 7 0.019 0.567 12.41 J × slope 2.23 5 0.2025 0.572 14.60 H' 0.835 7 0.391 0.106 17.84 H' × slope 0.531 5 0.680 0.241 19.44 LCS 2.46 7 0.161 0.260 16.23 LCS × slope 0.902 5 0.501 0.351 17.98 G, stand basal area; AGC, aboveground carbon stock; AGCa, the AGC of Araucaria; J, Pielou's evenness index; H', Shannon's diversity index; LCS, litter carbon stock; F, F-statistic; Df, the model's degrees of freedom; R², coefficient of determination; RSE, residual standard error. The p-value is for the fitted model. 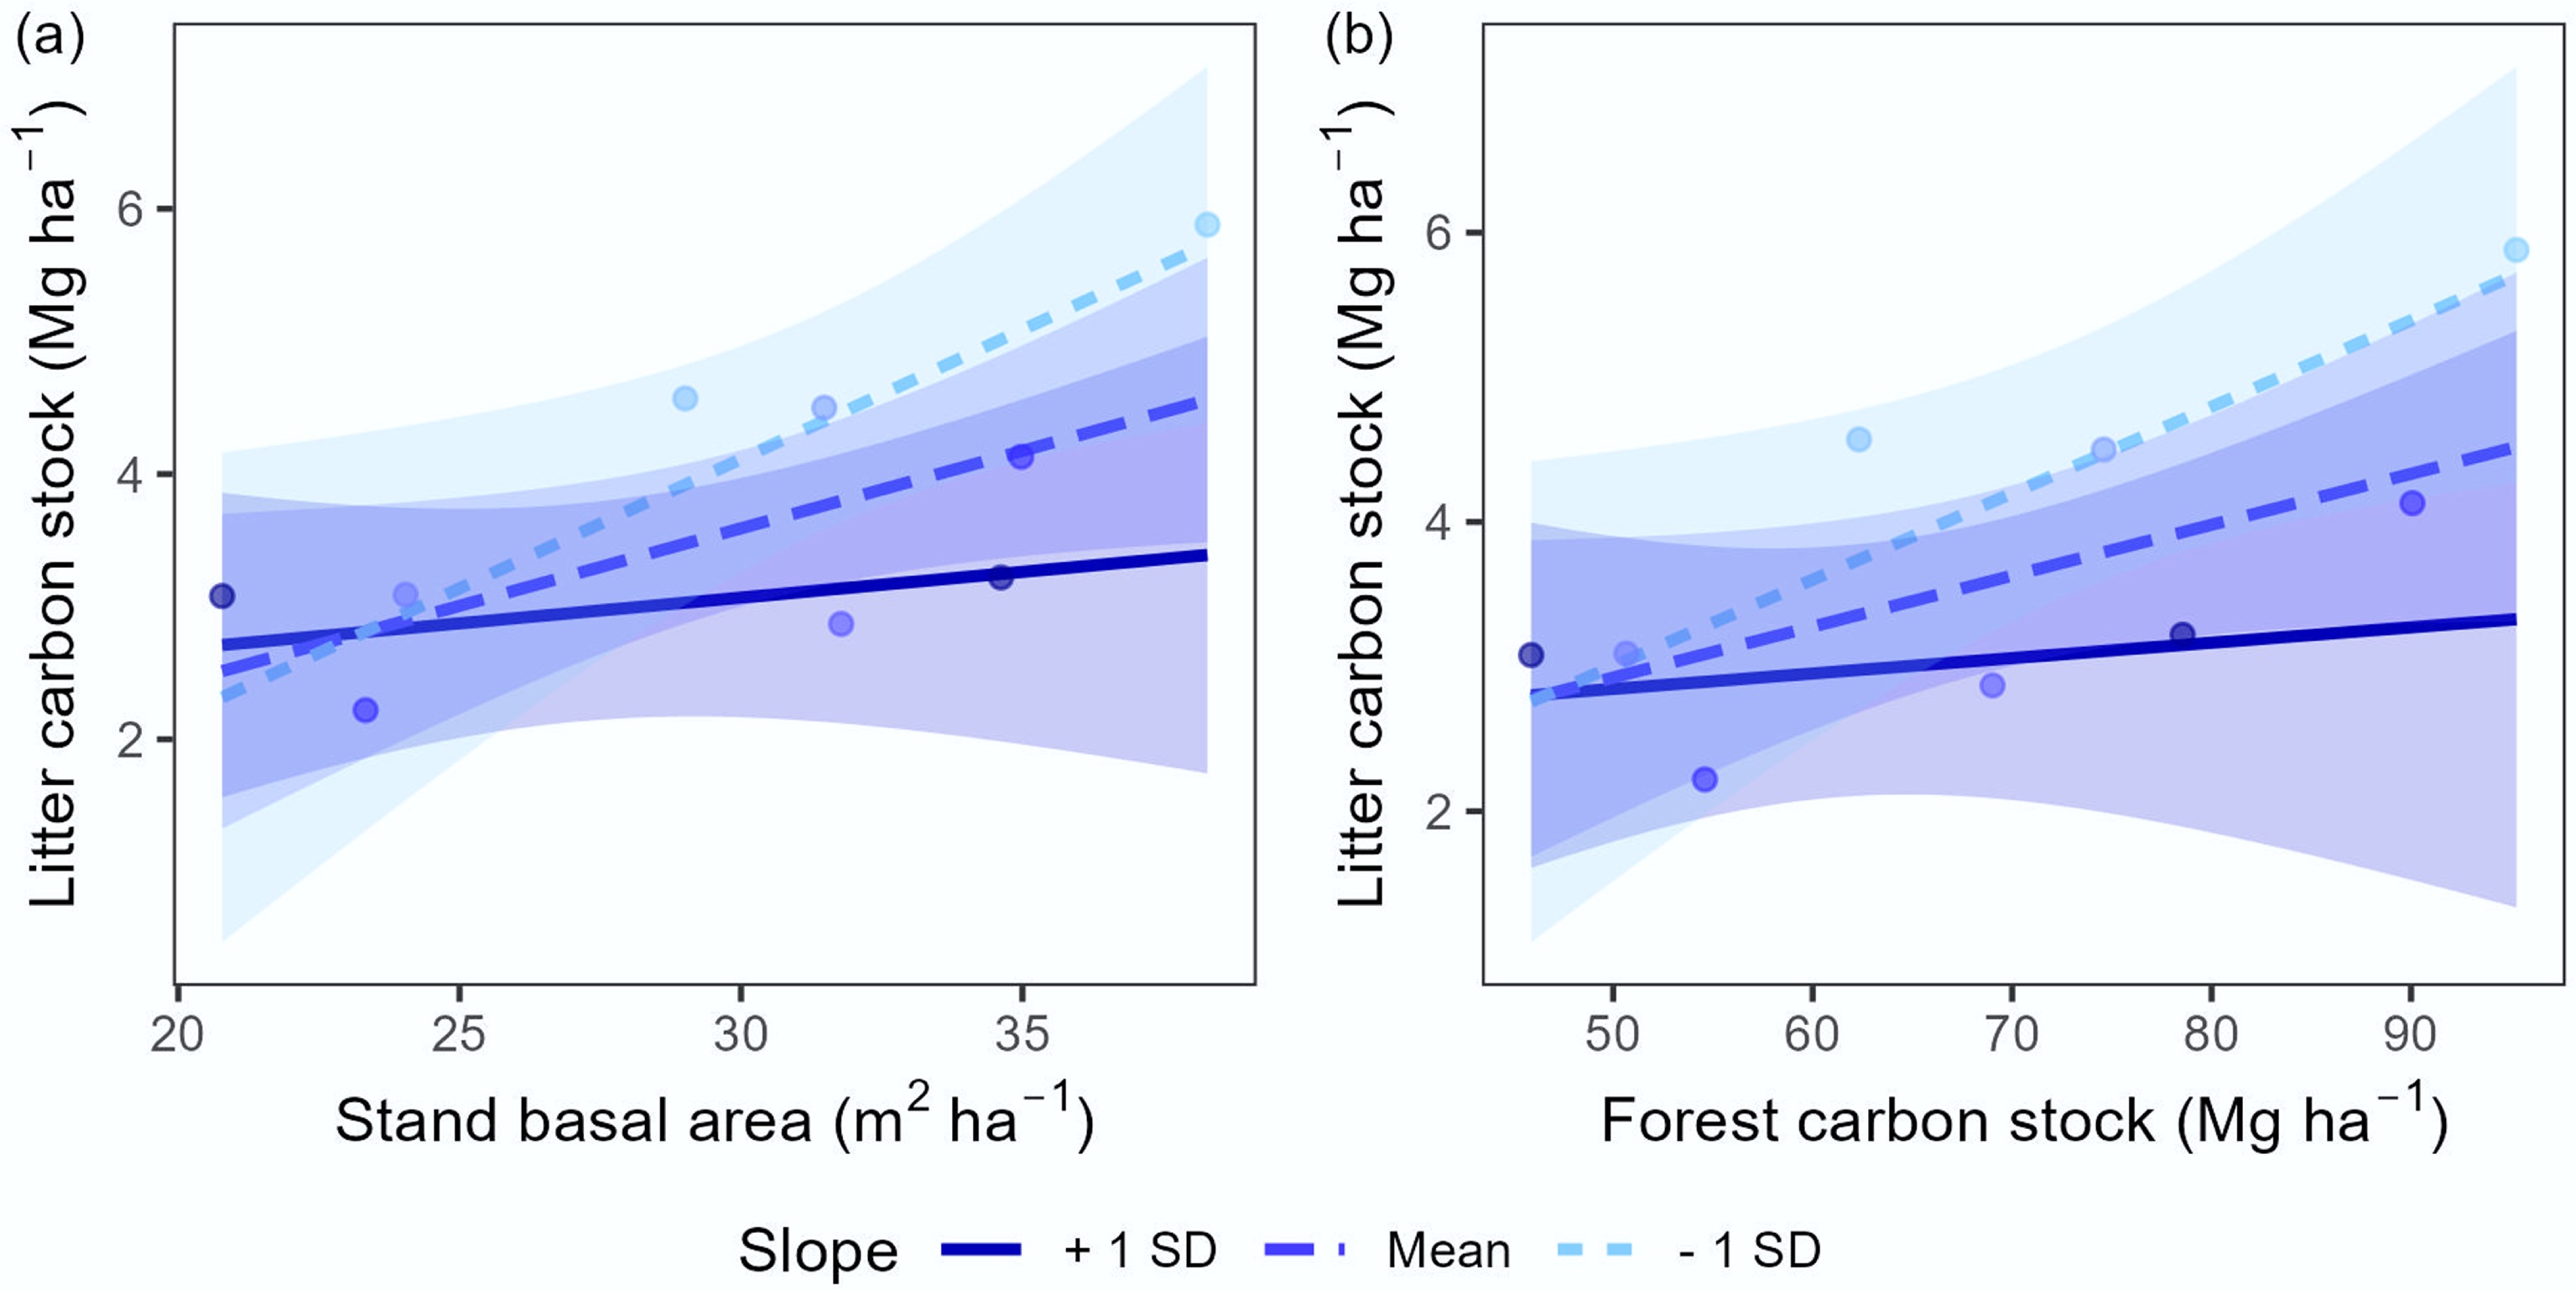
Figure 5.
Conditional effects of slope combined with (a) the stand basal area and (b) forest carbon on LCS in a MOF in southern Brazil. The shaded areas around the regression lines represent the 95% confidence intervals and SD denotes the standard deviation for the low, mean, and high slope lines.
-
Shannon's (H') and Pielou's (J) indices indicated moderate species diversity and high species evenness compared with other MOF sites[61,62], with little variation among sampling plots. This pattern is primarily driven by the dominance of nontimber species such as Campomanesia xanthocarpa (Mart.) O. Berg., Myrcia palustris DC., Lithraea brasiliensis Marchand, Banara tomentosa Clos, Cinnamodendron dinisii Schawacke, and Myrcia oblongata DC.[63]. Such dominance suggests legacy effects of past logging, reflected in the simplification and homogenization of species[64]. Similarly, carbon stocks were lower than those reported for other MOF sites[30,36,37], which generally range from approximately 101.6 to 104.7 Mg ha−1, but were substantially higher than state-level estimates for MOF in Santa Catarina state with 39.2 Mg ha−1[28]. Lower carbon stocks relative to other MOF areas, together with high local variability, particularly in the carbon stock of Araucaria[30], further reinforce evidence of past anthropogenic disturbance. These differences are likely associated with variations in the forest's successional stage, the intensity of historical disturbance, and the environmental conditions of MOF remnants. Together, these results indicate that the forest in the study area represents a secondary forest under regeneration, with high potential for carbon sequestration[65].
In contrast, the LCS values are consistent with those reported for other MOF sites[29,66]. Its variability is likely associated with both abiotic and biotic factors, including vegetation cover, species composition, decomposition rates, climatic seasonality, and phenological dynamics[67,68]. SCS, in turn, is higher than that reported for forest fragments in MOF at the same soil depth (0–30 cm)[43] and even at greater depths, such as 0–40 cm[33]. Nevertheless, our results may underestimate the total SCS, as deeper soil layers (0.5–1.0 m) can contain a substantial proportion of stored carbon[35]. This underestimation results from the inability to sample deeper soil layers because of the very stony nature of the soil (Supplementary Fig. S4). Therefore, future studies in MOF should include deeper soil sampling to improve estimates of total soil carbon storage and better understand vertical carbon distribution patterns.
The significant differentiation among forest‘s attributes and carbon stocks in the litter and soil highlights the environmental heterogeneity of the study area[40]. These patterns suggest that variations in the forest's structure and composition influence carbon stocks and their partitioning[4,68,69]. In summary, LCS was primarily related to basal area and the AGC stock, whereas SCS was associated with species diversity and evenness. When testing the effects of the predictor variables on LCS and SCS, the forest's basal area and AGC positively affected LCS. At the same time, species evenness positively influenced SCS. Increases in basal area and AGC reflect greater canopy cover, tree biomass, and ecosystem productivity, resulting in higher inputs of organic residues (leaves, branches, reproductive material, and root exudate) to the soil surface and, consequently, higher LCS[15,70−72].
In tropical forests, tree species diversity generally exerts a positive effect on LCS but not on SCS[73]. In the present study, we observed the opposite pattern, as species evenness was associated with higher SCS. This discrepancy is likely related to differences in climatic regimes and their influence on litter decomposition and carbon dynamics[4,25,26]. Specifically, the study area is located in a subtropical climate characterized by low temperatures, a key factor for soil carbon storage[74]. Under subtropical conditions, a positive effect of the dominant species on soil carbon has also been reported[69], supporting the relationship observed here between species evenness (J) and SCS.
Contrary to expectations, we found no relationship between LCS and SCS. This result may be partially influenced by the winter sampling period, as decomposition rates decline under lower temperatures[72,75], potentially reducing short-term litter decomposition and carbon accumulation in the soil. However, further studies are needed to better understand soil carbon fluxes, particularly through direct measurements of litter's decomposition rates and soil respiration across different seasons. Different temporal dynamics may also contribute to the absence of a relationship, as soil carbon integrates organic matter over longer timescales, whereas litter represents a more dynamic and short-lived compartment[8,26,67]. In addition, the absence of a relationship may also reflect the high spatial variability of SCS and the relatively limited sample size in the study area.
Although a relationship between AGCa and both LCS and SCS was previously expected, we did not find a significant effect of AGCa on either LCS or SCS. This expectation is supported by the fact that this species (Araucaria) is a major contributor to AGC in MOF[30], and exhibits high carbon content in its leaves, making a substantial contribution to the litter's composition[29,76]. However, its low representation in the study area because of past logging activities[63] may have attenuated its role as a source of organic matter, thereby explaining the lack of a detectable effect on LCS and SCS.
Although the forest's basal area and AGC represent important sources of carbon to the litter layer, this organic matter input was strongly modulated by the terrain's slope. Accordingly, the negative effect of slope on litter carbon inputs was expected, given the greater accumulation potential in flat areas compared with steeper sites, where deposited material is more prone to displacement and leaching[72,77]. However, this effect was not observed for SCS. This pattern may be explained by the shallow soils in the study area, which promote intensive root exploitation by vegetation and, consequently, high carbon inputs to the soil via root biomass and turnover[78]. In addition, steeper areas are generally less attractive for anthropogenic land use, favoring long-term carbon accumulation[77,79]. Nevertheless, our models are limited by the small sample size, which may reduce their explanatory power and broader generalizability. Therefore, further studies in MOF are needed, particularly across broader edaphic, climatic, and topographic gradients, supported by direct field measurements and long-term monitoring.
-
The forest's basal area and AGC showed a positive effect on LCS. However, this effect was attenuated in steeper areas, indicating that the terrain's slope may modulate the input and accumulation of organic material on the soil's surface. SCS, in turn, was influenced by species evenness, suggesting a potential role of floristic composition in belowground carbon fixation processes. The absence of a relationship between LCS and SCS suggests an influence of the sampling season, resulting in a temporal lag between organic matter inputs and their incorporation into the soil. Overall, these findings suggest that forest structure, composition, and carbon stocks, combined with topographic variation, may shape carbon storage across ecosystem compartments. Accordingly, the integrated quantification of carbon stocks in vegetation, litter, and soil is essential to support ecosystem-based climate mitigation strategies and to improve our understanding of carbon fluxes and partitioning in MOF.
We thank Núcleo de Estudos em Dendrometria, Inventário e Manejo Florestal (NeDIM-UFSC), Allison Pilar, and Pedro Reis for their support during fieldwork, and the anonymous reviewers for their valuable comments and suggestions.
-
It accompanies this paper at: https://doi.org/10.48130/ebp-0026-0009.
-
Not applicable.
-
The authors confirm their contributions to the paper as follows: Greyse Naira Theodoroski: writing – original draft, conceptualization, investigation, methodology, visualization, and formal analysis; Vinicius Costa Cysneiros: writing – review and editing, conceptualization, methodology, visualization, formal analysis, supervision, and funding acquisition; Djalma Eugenio Schmitt: writing – review and editing, methodology, visualization, and formal analysis; Larissa Regina Topanotti: writing – review and editing, methodology, and visualization. All authors reviewed the results and approved the final version of the manuscript.
-
The datasets generated and/or analyzed during the current study are available from the corresponding author on reasonable request.
-
The authors declare that they have no known competing financial interests or personal relationships that could have appeared to influence the work reported in this paper.
-
Full list of author information is available at the end of the article.
- The supplementary files can be downloaded from here.
- Copyright: © 2026 by the author(s). Published by Maximum Academic Press, Fayetteville, GA. This article is an open access article distributed under Creative Commons Attribution License (CC BY 4.0), visit https://creativecommons.org/licenses/by/4.0/.
-
About this article
Cite this article
Theodoroski GN, Cysneiros VC, Schmitt DE, Topanotti LR. 2026. Carbon partitioning in a mixed ombrophilous forest fragment in southern Brazil. Environmental and Biogeochemical Processes 2: e013 doi: 10.48130/ebp-0026-0009 

Carbon partitioning in a mixed ombrophilous forest fragment in southern Brazil
- Received: 16 March 2026
- Revised: 01 June 2026
- Accepted: 18 June 2026
- Published online: 13 July 2026
Abstract: Forest ecosystems play an important role in the context of climate change, since trees sequester carbon dioxide from the atmosphere during photosynthesis, converting it into organic carbon and fixing it in plant biomass and soil. Given the importance of these ecosystems, it is essential to understand the factors that influence carbon flux and partitioning. The objective of this study was to understand the factors that influence carbon partitioning among vegetation, litter, and soil in a fragment of mixed ombrophilous forest (MOF) in southern Brazil. Data on forest structure, species diversity, and carbon stocks in the vegetation, litter, and soil were collected in nine sample plots. Data analyses indicated significant differences among sampling plots, driven by variations in forest characteristics and their associated carbon stocks. The forest's basal area and carbon stocks in the vegetation exhibited a positive effect on litter carbon stock; however, this effect was negatively influenced by the terrain's slope, indicating that slope modulates the input of organic material into the soil. In contrast, species evenness positively influenced soil carbon stocks, independent of slope. The findings highlight the importance of integrated quantification of carbon stocks in vegetation, litter, and soil to support climate mitigation strategies based on forest ecosystems. However, further studies are still needed, especially on the broader edaphic, climatic, and topographic gradients in MOF.
-
Key words:
- Brazilian Atlantic Forest /
- Brazilian hotspot /
- Carbon sinks /
- Carbon flux