


-
The chemical industry, as a vital pillar of the global economy, plays a significant role in driving technological advancements and societal development. However, it also faces increasingly severe safety challenges[1]. With the growing complexity of chemical reaction systems and the expansion of industrial scales, effectively controlling exothermic reactions and mitigating thermal runaway risks has become a core issue in the field of chemical process safety[2]. High-risk exothermic reactions, due to their intense heat release properties, are particularly susceptible to thermal runaway under uncontrolled external conditions or improper operational practices, potentially leading to safety incidents[3]. As a result, enhancing the inherent safety of high-heat-releasing reactions has become a critical focus in chemical safety research[4].
Diazotization reactions represent a fundamental method for synthesizing organic compounds, extensively used in the production of dyes, pharmaceutical intermediates, pesticides, and other fine chemicals since Griess et al. first reported them[5,6].
These reactions typically involve the interaction of aromatic amines with nitrites in an acidic medium, resulting in the formation of diazonium salts. The process is characterized by significant exothermic properties, with the enthalpy change typically ranging from −65 to −150 kJ/mol[7]. Even under low-temperature conditions (e.g., −10 °C), these reactions proceed rapidly, exhibiting high reactivity and substantial thermal hazards[8]. The diazonium salts generated in these reactions act as highly reactive intermediates, enabling the synthesis of a variety of valuable organic compounds, making diazotization one of the most important reactions in organic synthesis[9].
However, the exothermic nature of diazotization reactions and the instability of the resulting diazonium salts pose considerable safety risks in industrial-scale processes. In practice, industrial accidents involving diazotization reactions are common, as the diazonium salts they produce can undergo violent decomposition at room temperature or slightly elevated temperatures, leading to thermal runaway and explosion hazards[10,11]. In industrial applications, diazotization reactions are generally conducted in semi-batch reactors, with the temperature controlled within the range of 0–5 °C to minimize thermal runaway risks. However, issues such as prolonged residence times, limited heat transfer efficiency, and poor mixing often lead to increased side reactions, affecting the selectivity and yield of the desired product[12].
Taking the diazotization of 2-amino-naphthalene-1,5-disulfonic acid (2-ANDSA) as a case study, this reaction not only exhibits significant exothermic behavior, but the diazonium salt produced serves as a crucial intermediate in dye synthesis, with similar thermal safety risks to other aryl diazonium salts in terms of thermal stability. Therefore, an in-depth study of the reaction mechanism and thermal runaway behavior of 2-ANDSA diazotization is essential for optimizing process parameters and enhancing production safety.
Recent studies have investigated the thermal behavior and thermal runaway risks associated with such reactions. For instance, Sheng et al. employed differential scanning calorimetry (DSC) and reaction calorimetry to demonstrate that some diazonium salts can undergo violent decomposition even at slightly elevated room temperatures, showing extremely high explosive sensitivity in the solid state, which highlights safety concerns during storage and handling[7]. de Souza et al. examined 58 types of aryl diazonium tetrafluoroborates and found that 23 exhibited a TD24 (temperature at TMRad = 24.0) below 25 °C at 35 °C, indicating that these compounds can still undergo autocatalytic exothermic reactions at ambient temperatures, challenging conventional views on the stability of diazonium salts[13]. Xie et al. reported that the initial decomposition temperature of aniline diazonium salts could be as low as 27.21 °C, with complete decomposition occurring within 24 h at 20 °C, indicating a high risk of self-accelerating decomposition[14]. Zhu et al. used partial least squares (PLS) regression modeling to analyze the effects of sulfuric acid concentration and diazonium salt concentration on TD24, optimizing the process parameters (sulfuric acid ≥ 76.2%, diazonium salt ≤ 38.2%), resulting in an increase of TD24 to 38.2 °C and a significant reduction in thermal runaway risks[15].
Current literature predominantly employs thermal analytical methods such as differential scanning calorimetry (DSC) and accelerating rate calorimetry (ARC) to systematically characterize the thermal decomposition behaviors and potential runaway phenomena of various diazonium salts. While these studies provide essential theoretical foundations for understanding the thermal stability and decomposition features of aromatic diazonium salts, notable research deficiencies persist. Specifically, existing research rarely investigates the interrelationship between exothermic characteristics inherent to diazotization reactions and their underlying mechanistic details. Moreover, there is insufficient in-depth combined theoretical and experimental analysis regarding critical nodes within reaction pathways and their corresponding thermal hazard.
In recent years, rapid developments in advanced thermal analysis techniques coupled with quantum chemical computations have enabled detailed investigations into thermal hazards and reaction mechanisms of various high-risk exothermic chemical reactions, exemplified by the successful application of combined reaction calorimetry and density functional theory (DFT) approaches[16]. However, such sophisticated analytical and theoretical frameworks have not yet been effectively extended to diazotization reaction systems, notably lacking comprehensive investigations on industrially significant diazonium salts such as 2-aminonaphthalene-1,5-disulfonic acid (2-ANDSA). This limitation impedes the industry's full understanding of thermal hazards intrinsic to relevant diazotization processes and constrains effective process safety management and optimization.
To address these critical research gaps, this study systematically integrates state-of-the-art reaction calorimetry technologies (EasyMax), differential scanning calorimetry (DSC), accelerating rate calorimetry (ARC), and density functional theory (DFT) calculations. This integrated approach elucidates the exothermic behaviors, mechanistic details at critical reaction nodes, and intrinsic thermal runaway triggers associated with the synthesis of 2-ANDSA diazonium salt. Moreover, this research establishes a comprehensive, closed-loop risk evaluation framework—termed 'Calorimetry–DFT–Risk Mapping' - to deliver systematic theoretical foundations and practical engineering guidance. The ultimate objective is to significantly enhance both theoretical insights and engineering practices in chemical process safety for analogous high-risk aromatic diazonium salt synthesis reactions.
-
All chemical reagents used in this study were commercially obtained and used as received without additional purification. Reagents included 2-aminonaphthalene-1,5-disulfonic acid (2-ANDSA, 98%, Hubei Baidu Chemical Co., Ltd., China), hydrochloric acid solution (HCl, 36–38%, Shanghai Lingfeng Chemical Reagent Co., Ltd., China), sodium nitrite (NaNO2, 99%, Sinopharm Chemical Reagent Co., Ltd., China), sulfamic acid (NH2SO3H, 99%, Shanghai Macklin Biochemical Co., Ltd., China), and deionized water (Nanjing Wanqing Chemical Glass Instrument Co., Ltd., China). All reagents were stored under controlled laboratory conditions to maintain their chemical integrity and experimental reliability.
Analytical and testing methods
-
In this experiment, high-performance liquid chromatography (HPLC) and high-performance liquid chromatography-mass spectrometry (HPLC-MS) were employed for both qualitative and quantitative analysis of the reaction products. Thermal risk assessment was conducted using differential scanning calorimetry (DSC), accelerating rate calorimetry (ARC), and reaction calorimetry (RC), with the equipment shown in Fig. 1, measuring the exothermic behavior, thermal decomposition properties, self-accelerating decomposition characteristics, and reaction kinetics obtained from adiabatic experiments.
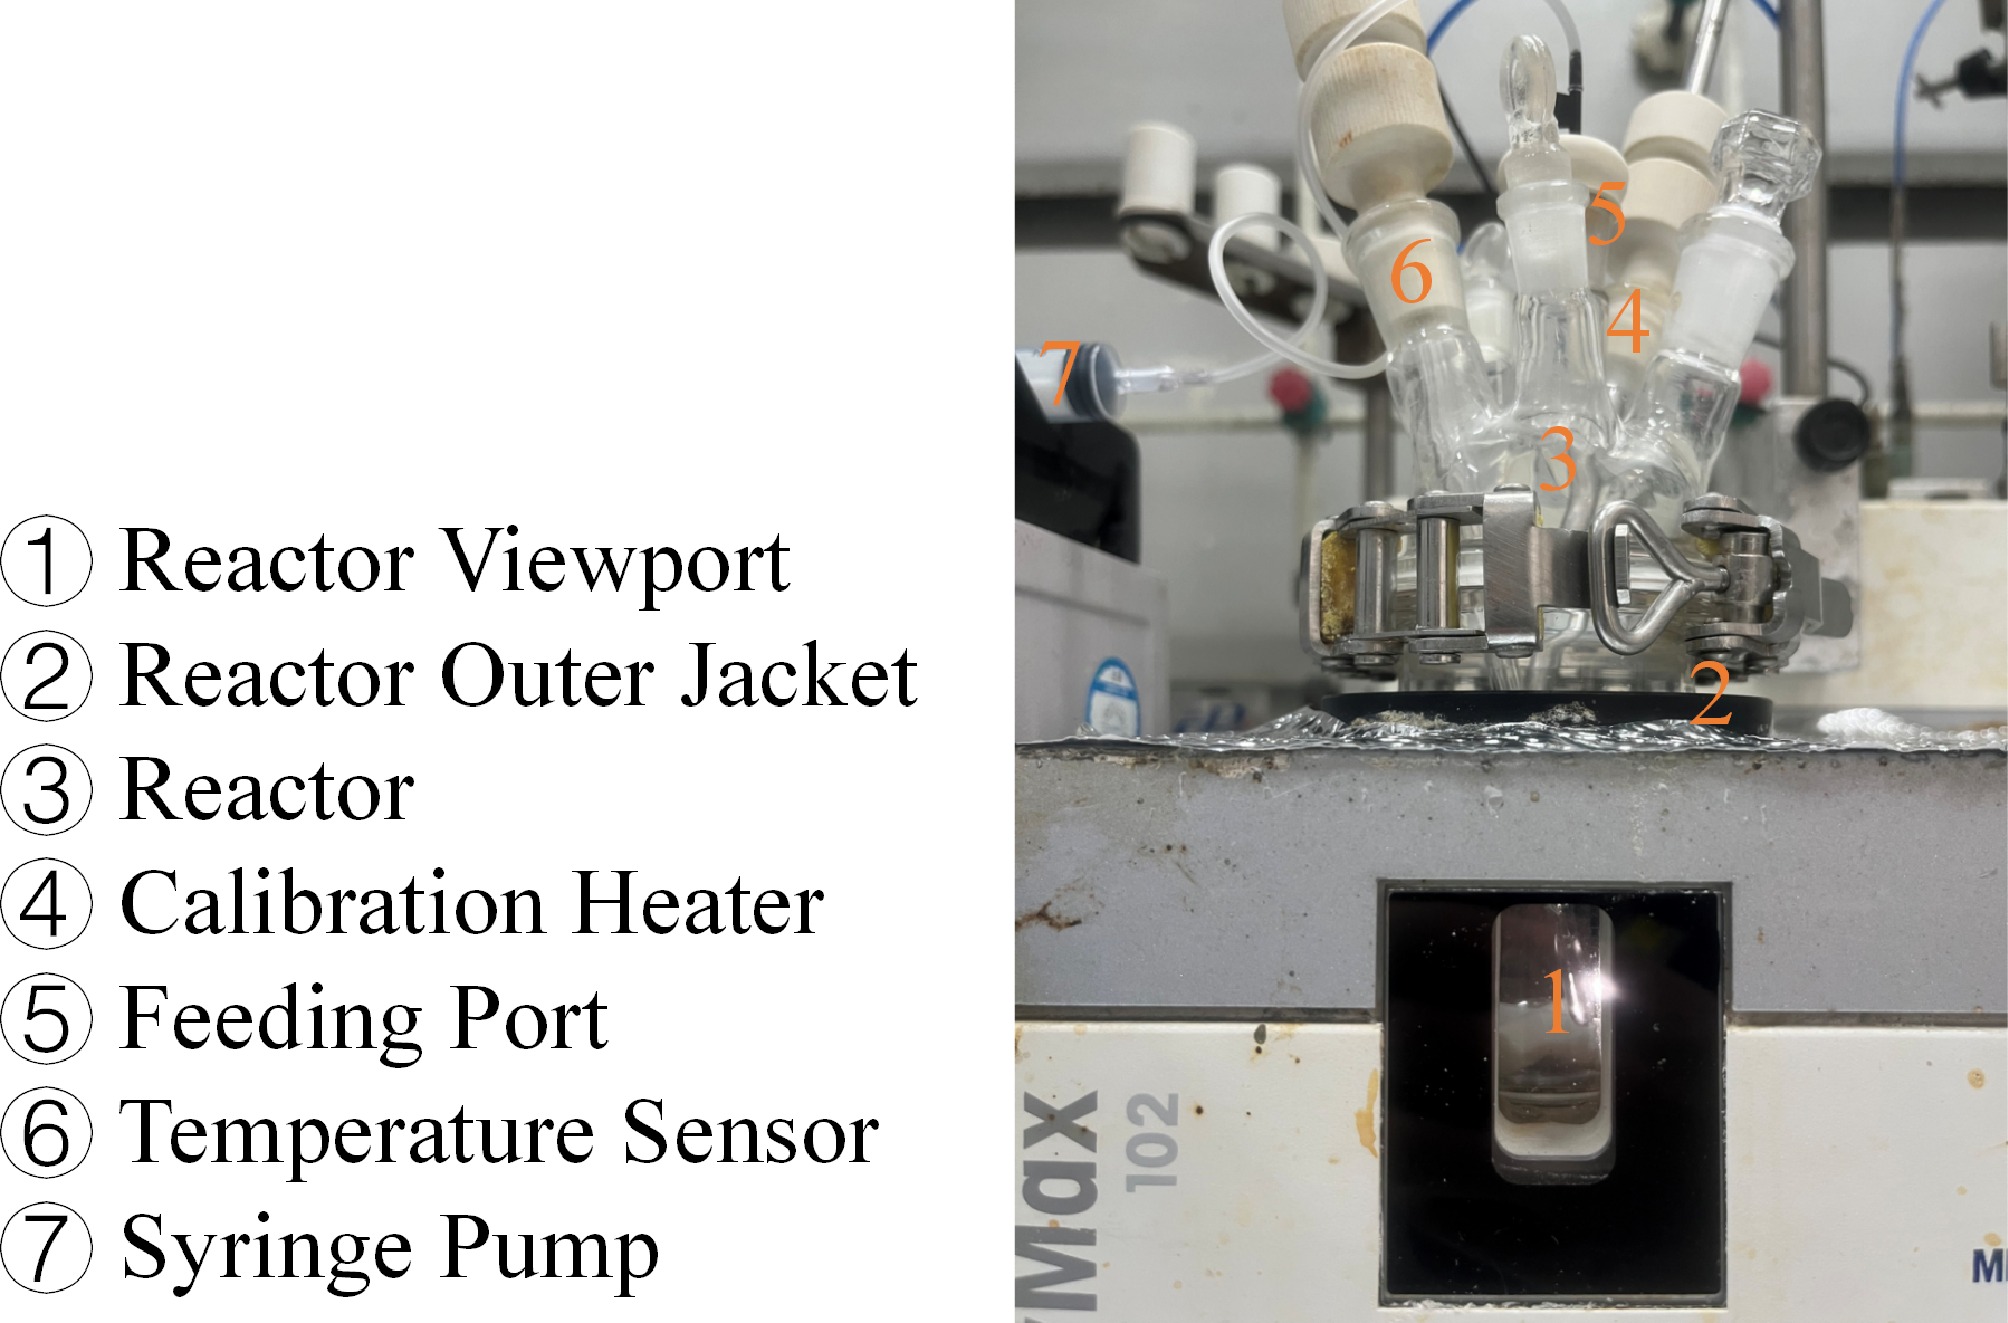
Figure 1.
Schematic diagram of the reaction calorimeter.
Furthermore, quantum chemical calculations were used to elucidate the reaction mechanism of the 2-ANDSA diazonium salt synthesis and pinpoint the electrophilic reaction sites. Specifically, Gaussian16 was employed for the quantum chemical calculations, Multiwfn was used for wavefunction analysis[17,18], and SHERMO was applied for thermodynamic analysis[19].
Theory and calculation
Calculation methods for thermodynamic parameters
-
The thermal risk evaluation of the reaction process is typically based on the energy balance obtained from calorimetric experiments. The energy balance equation for the reaction system in the calorimeter can be expressed as Eqn (1).
$ {\mathit{Q}}_{\mathit{r}}={\mathit{Q}}_{\mathit{a}\mathit{c}}+{\mathit{Q}}_{\mathit{f}\mathit{l}\mathit{o}\mathit{w}}+{\mathit{Q}}_{\mathit{d}\mathit{o}\mathit{s}}+{\mathit{Q}}_{\mathit{l}\mathit{o}\mathit{s}\mathit{s}}-{\mathit{Q}}_{\mathit{c}} $ (1) In this equation, Qr represents the reaction heat release rate (W); Qac is the accumulated heat rate of the reaction system (W); Qflow is the heat exchange power between the reaction system and the jacket (W); Qdos is the heat effect power during reagent addition (W); Qloss is the rate of heat loss from the reaction system to the external environment (W); and Qc is the calibration power of the calorimeter (W), used to determine the instrument's thermal transfer characteristics.
Based on the above energy balance calculations, key thermodynamic parameters in the reaction process can be further determined. These include the reaction enthalpy ΔHr (kJ/mol), the adiabatic temperature rise ΔTad ( °C), the heat conversion rate X (%), the heat accumulation rate Xac (%), the temperature Tcf ( °C) at which heat accumulation reaches after reaction runaway[20], and the maximum temperature MTSR ( °C) that can be reached during reaction runaway. The relevant formulas are given in Eqns (2)−(7).
$ {\Delta }{\mathit{H}}_{\mathit{r}}=\dfrac{{\int }_{{\mathit{t}}_{0}}^{{\mathit{t}}_{\mathit{e}\mathit{n}\mathit{d}}}{\mathit{Q}}_{\mathit{r}}\left(\mathit{t}\right)\mathit{d}\mathit{t}{\mathit{m}}_{\mathit{A}0}}{{\mathit{M}}_{\mathit{A}0}} $ (2) $ {\Delta }{\mathit{T}}_{\mathit{a}\mathit{d}}=\dfrac{{\Delta }{\mathit{H}}_{\mathit{r}}}{{{\mathit{M}}_{\mathit{t}}\mathit{C}}_{\mathit{P}}} $ (3) $ \mathbf{X}=\dfrac{{\int }_{{\mathbf{t}}_{0}}^{\mathbf{t}}{\mathbf{Q}}_{\mathbf{r}}\left(\mathbf{t}\right)\mathbf{d}\mathbf{t}}{{\Delta }{\mathit{H}}_{\mathit{r}}} $ (4) $ {\mathit{X}}_{\mathit{a}\mathit{c}}=\dfrac{{\mathit{m}}_{\mathit{t}}}{{\mathit{m}}_{\mathit{r}}}-\mathit{X} $ (5) $ {\mathit{T}}_{\mathit{c}\mathit{f}}={\mathit{T}}_{\mathit{p}}+{\mathit{X}}_{\mathit{a}\mathit{c}}{\Delta }{\mathit{T}}_{\mathit{a}\mathit{d}}\dfrac{{\mathit{M}}_{\mathit{t}}}{{\mathit{C}}_{\mathit{p}}{\mathit{M}}_{\mathit{r}}} $ (6) $ \mathit{M}\mathit{T}\mathit{S}\mathit{R}=\mathit{m}\mathit{a}\mathit{x}\left({\mathit{T}}_{\mathit{c}\mathit{f}}\right) $ (7) In these equations, t0 and tend represent the start and end times of the reaction (s), respectively; mA0 is the total mass of 2-ANDSA reactant added to the reaction (g); MA0 is the molar mass of 2-ANDSA added to the reaction (g/mol); Mt is the total mass of the reactants (g); CP is the specific heat capacity of the reactants [J/(g·K)]; mt is the mass of the reactant added to the reaction (g); mr is the total mass of the reactant added to the reaction (g); TP is the reaction starting temperature (°C); Mr is the mass of the reactants (g).
Kinetic calculation method
-
To determine the kinetic parameters of 2-ANDSA diazonium salt under adiabatic conditions, the classical rate constant method was used for analysis[21]. The reaction rate is dT/dt expressed as Eqn (8).
$ \dfrac{\mathit{d}\mathit{T}}{\mathit{d}\mathit{t}}=\mathit{k}{\Delta }{\mathit{T}}_{\mathit{a}\mathit{d}}{\left(\dfrac{{\mathit{T}}_{\mathit{e}\mathit{n}\mathit{d}}-\mathit{T}}{{\mathit{T}}_{\mathit{e}\mathit{n}\mathit{d}}-{\mathit{T}}_{\mathit{p}}}\right)}^{\mathit{n}} $ (8) In this equation, Tend is the termination temperature of the reaction (K); n is the order of the reaction; and k is the reaction rate constant. The reaction rate constant k can be expressed using the Arrhenius equation as Eqn (9)[22].
$ \mathit{K}\left(\mathit{T}\right)=\mathit{A}\mathit{e}\mathit{x}\mathit{p}\left(\dfrac{-{\mathit{E}}_{\mathit{a}}}{\mathit{R}\mathit{T}}\right) $ (9) In this equation, A is the pre-exponential factor; Ea is the activation energy (J/mol); R is the molar gas constant, R = 8.314 J/mol; and T is the reaction temperature (K).
Additionally, to gain a deeper understanding of the reaction's microscopic mechanism, transition state theory (TST) was employed to calculate the kinetic parameters of each elementary reaction, considering the effects of quantum tunnelin[23]. The calculation formula is shown in Eqn (10).
$ {\mathit{K}}^{\mathit{T}\mathit{S}\mathit{T}}\left(\mathit{T}\right)={\Gamma }\dfrac{{\mathit{k}}_{\mathit{B}}\mathit{T}}{\mathit{h}}\times \dfrac{{\mathit{Q}}^{\mathit{T}\mathit{S}}\left(\mathit{T}\right)}{{\mathit{Q}}^{\mathit{A}}\left(\mathit{T}\right){\mathit{Q}}^{\mathit{B}}\left(\mathit{T}\right)}\mathit{e}\mathit{x}\mathit{p}\left(\dfrac{-{\mathit{E}}_{\mathit{a}}}{\mathit{R}\mathit{T}}\right) $ (10) In this equation, kB is the Boltzmann constant (J/K); h is Planck's constant (J·s); QTS(T), QA(T) and QB(T) are the partition functions for the transition state and reactants, respectively; and Γ is the quantum tunneling correction factor.
-
In this study, a series of optimization experiments were designed and conducted based on the principle of single-factor variable control to systematically investigate the effects of the 2-ANDSA diazonium salt synthesis process and its potential thermal risks. During the experiments, two temperature control modes, Tr and Tj, were employed, and critical process parameters were strictly controlled, including reaction temperature, feed rate, molar ratio of raw materials, and stirring speed. These measures were taken to minimize experimental errors and enhance the reliability of the data. The parameter ranges are detailed in Table 1. The purity and key thermal safety parameters obtained from the experiments are summarized in Table 2.
Table 1. Single-factor optimization of 2-ANDSA diazotization.
Exp no. T (°C) Feed rate (mL/min) HCl/2-ANDSA NaNO2/
2-ANDSASR (rpm) Mode 1 0 0.1 2 1 300 Tr 2 10 0.1 2 1 300 Tr 3 20 0.1 2 1 300 Tr 4 30 0.1 2 1 300 Tr 5 10 0.15 2 1 300 Tr 6 10 0.2 2 1 300 Tr 7 10 0.25 2 1 300 Tr 8 10 0.15 2.2 1 300 Tr 9 10 0.15 2.4 1 300 Tr 10 10 0.15 2.6 1 300 Tr 11 10 0.15 2.4 1.1 300 Tr 12 10 0.15 2.4 1.2 300 Tr 13 10 0.15 2.4 1.3 300 Tr 14 10 0.15 2.4 1 200 Tr 15 10 0.15 2.4 1 400 Tr 16 10 0.15 2.4 1 500 Tr 17 10 0.15 2.4 1 400 Tj Table 2. Purity and key thermal risk parameters.
Exp no. Purity (%) Qrmax (W) MTSR (°C) ∆Hr (kJ/mol) 1 95.2 2.3 1.1 115.6 2 95.6 2.5 11.5 125.2 3 93.5 3.0 31.0 125.6 4 91.9 3.0 34.4 129.6 5 95.6 3.0 12.2 126.1 6 94.0 5.1 15.2 123.8 7 88.0 5.8 16.0 103.8 8 95.7 3.1 11.5 127.5 9 96.7 2.9 11.0 127.4 10 96.8 3.3 11.4 121.5 11 92.3 5.2 11.2 114.5 12 91.2 5.8 11.5 115.3 13 91.2 6.5 10.8 120.0 14 95.0 3.2 11.7 126.6 15 97.0 5.2 14.2 125.1 16 97.7 6.0 13.8 122.2 17 97.1 3.1 15.1 122.2 Effect of reaction temperature
-
The data presented in Fig. 2a and Table 2 (Exp nos 1–4) demonstrate that as the reaction temperature increases from 0 to 10 °C, the product purity exhibits a slight increase from 95.2% to 95.6%. This minimal variation lies within typical experimental error ranges (approximately ± 0.5%), indicating that within this lower temperature regime, temperature elevation exerts negligible effects on reaction selectivity or side reaction suppression.
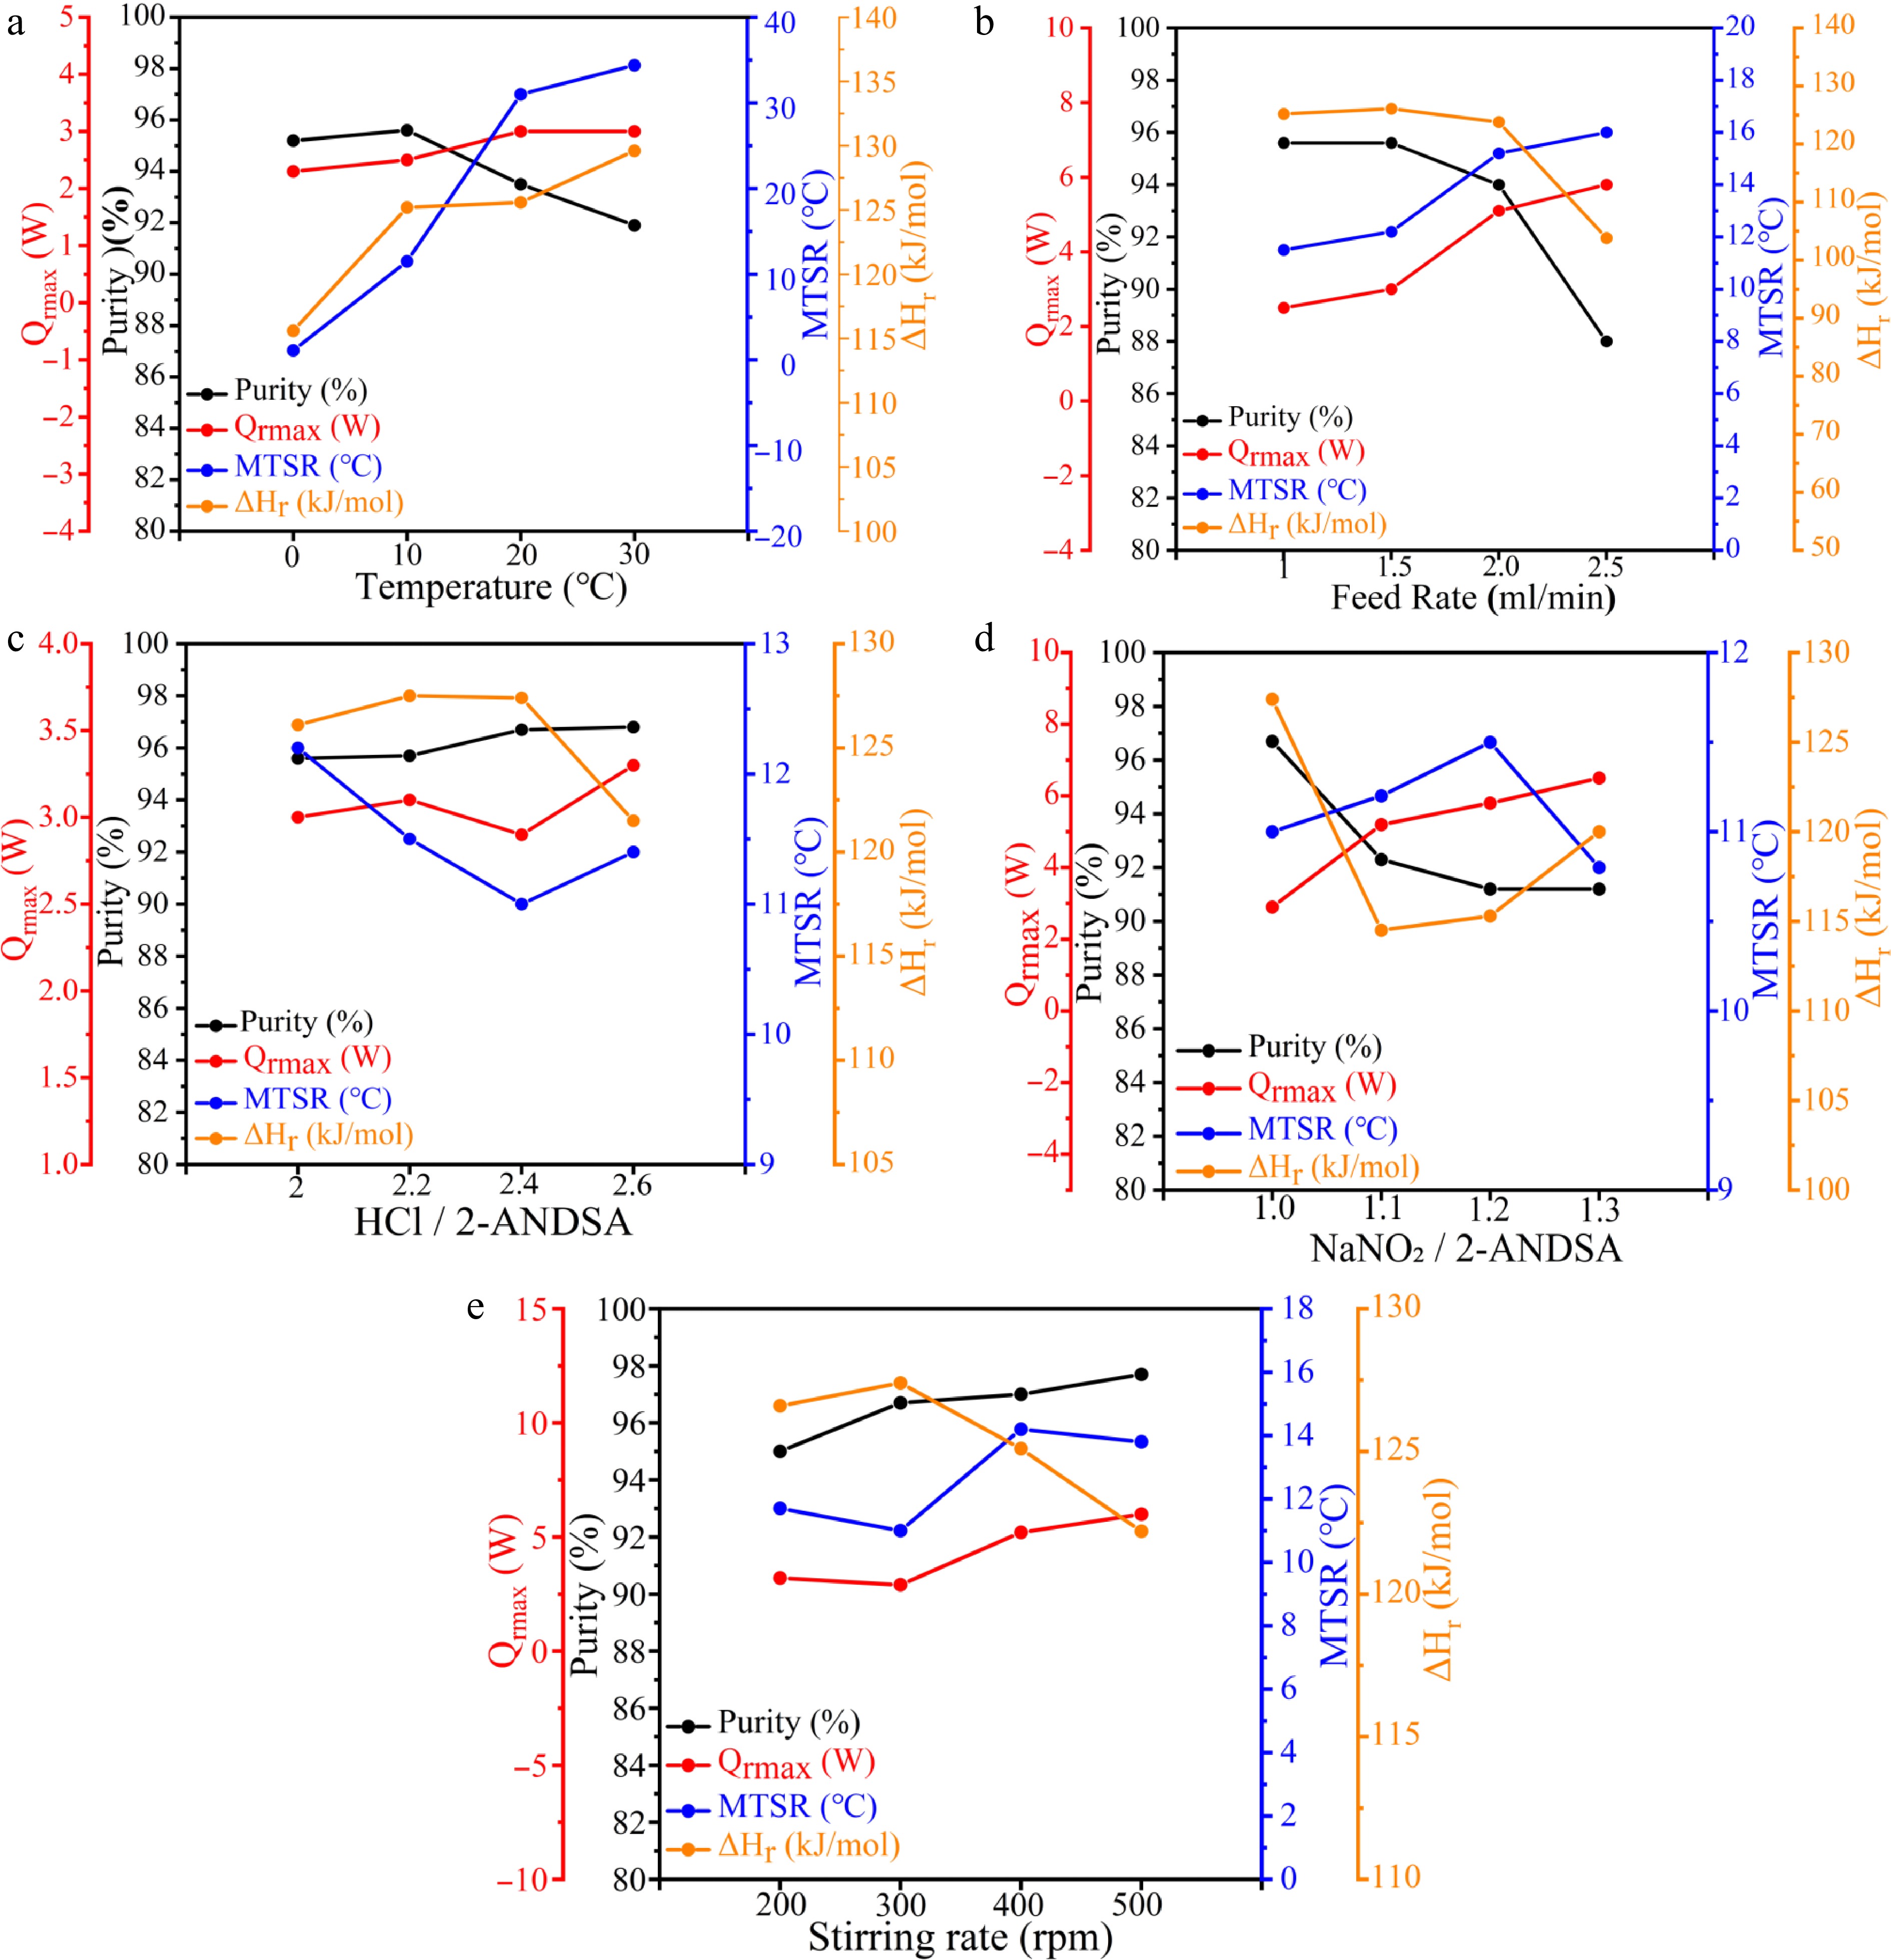
Figure 2.
Quantitative characterization of purity and thermal risk parameters for 2-ANDSA diazotization (a) Temperature, (b) feed rate, (c) HCl/2-ANDSA, (d) NaNO2/2-ANDSA, (e) stirring rate.
Upon further increasing the reaction temperature to 20 and 30 °C, the product purity shows a modest reduction from 93.5% to 91.9%, respectively, representing a slight decrease of 1.6%, which remains marginal within the experimental uncertainty range.
More importantly, at these elevated temperatures, the thermal effects become significantly pronounced. The temperature increment prominently affects the thermal risk profile of the reaction system. Specifically, the maximum heat release rate Qrmax escalates notably with rising temperature, from 2.3 W at 0 °C to 3.0 W at 30 °C, indicating a clear intensification of the reaction rate and heat generation. Correspondingly, the maximum temperature achievable in the event of thermal runaway MTSR dramatically increases from 1.1 °C at 0 °C to 34.4 °C at 30 °C. This considerable amplification highlights the significant impact of temperature elevation on heat accumulation and the potential for thermal runaway incidents.
Moreover, the molar reaction enthalpy ∆Hr also exhibits a marked increase, rising from 115.6 kJ/mol at 0 °C to 129.6 kJ/mol at 30 °C, underscoring that higher reaction temperatures not only enhance the rate of heat release but also substantially increase the total thermal energy released by the reaction. This escalation substantially elevates the thermal hazard potential of the diazonium salt synthesis process.
In summary, although product purity remains consistently high at lower temperatures (≤ 10 °C), temperature elevations to 20–30 °C introduce only slight purity reductions yet markedly intensify thermal effects and substantially elevate the risk of thermal runaway. Consequently, for process optimization, maintaining tight temperature control within the range of 0–10 °C is crucial to achieve an optimal balance between product purity and reaction safety.
Effect of feeding rate
-
The data presented inFig. 2b and Table 2 (Exp nos 2, 5–7) indicate that within the lower feeding rate range (0.10–0.15 mL/min), the purity of the target product remains consistently high and stable, showing minimal variations within the typical experimental error range (± 0.5%). This stability suggests that optimal mixing and near-maximum mass transfer efficiency are achieved under these conditions. Slight incremental increases in feeding rate within this optimal range do not significantly impact mass transfer or product purity.
However, when the feeding rate is further increased to 0.20 and 0.25 mL/min, product purity experiences noticeable declines to 94.0% and 88.0%, respectively. The decrease at 0.25 mL/min represents a substantial drop of 7.6% relative to the optimal condition at 0.15 mL/min, exceeding typical experimental uncertainty and indicating a significant change.
Increased feeding rates notably influence the thermal risk parameters of the reaction. The maximum heat release rate Qrmax rises significantly, from 2.5 W at 0.10 mL/min and 3.0 W at 0.15 mL/min to 5.1 and 5.8 W at feeding rates of 0.20 and 0.25 mL/min, respectively. Correspondingly, the maximum temperature attainable during thermal runaway MTSR also exhibits a marked increase from 11.5 °C at 0.10 mL/min to 16.0 °C at 0.25 mL/min. These pronounced thermal effects underscore the substantial escalation in heat accumulation and thermal runaway risk at elevated feeding rates.
Moreover, molar reaction enthalpy ΔHr decreases with increasing feeding rate, declining from 125.2 to 103.8 kJ/mol. This trend indicates reduced reaction conversion rates at higher feeding rates, resulting in a lower effective heat release consistent with the observed purity reductions.
In conclusion, maintaining strict feeding rate control between 0.10–0.15 mL/min, with an optimal setting at 0.15 mL/min, is recommended for industrial practice to effectively balance product purity and reaction safety. Under these conditions, not only is the highest product purity (95.6%) reliably achieved, but critical thermal safety parameters such as Qrmax and MTSR are maintained within acceptable limits, thus ensuring both reaction efficiency and operational safety.
Effect of HCl/2-ANDSA
-
The experimental data presented in Fig. 2c and Table 2 (Exp nos 5, 8–10) illustrate that increasing the HCl molar ratio from 2.0 to 2.6 results in a gradual improvement in product purity, peaking at 96.8% with a molar ratio of 2.6. At lower molar ratios (2.0–2.2), insufficient hydrochloric acid limits the conversion efficiency of sodium nitrite to nitrous acid, resulting in incomplete reactions and marginally lower purity levels.
As the molar ratio is raised from 2.2 to 2.4, the purity enhancement becomes relatively minor and remains within typical experimental uncertainty (± 0.5%), indicating limited additional improvement. At molar ratios exceeding 2.4, while purity continues to show slight incremental improvement, the rate of increase significantly diminishes.
Analysis of thermal risk parameters further emphasizes significant changes associated with increasing HCl molar ratios. The maximum heat release rate Qrmax remains relatively stable across molar ratios from 2.0 to 2.4, suggesting consistent heat release dynamics within this range. However, at a molar ratio of 2.6, Qrmax notably increases to 3.3 W. This pronounced rise indicates intensified exothermic reactions due to the rapid formation of high-concentration nitrous acid, substantially heightening heat generation rates and thermal risk.
The maximum temperature attainable during thermal runaway MTSR exhibits minor variations within a relatively narrow range (11.0–12.2 °C) across all tested molar ratios. Nevertheless, localized instantaneous heat release remains critical in industrial-scale reactions and must be carefully managed. Additionally, the molar reaction enthalpy ∆Hr slightly decreases from 126.1 to 121.5 kJ/mol with increasing HCl molar ratios, suggesting that increased solvation from higher acid concentrations may effectively suppress the release of reaction heat.
In summary, balancing optimal product purity and thermal safety necessitates carefully controlling the HCl molar ratio at approximately 2.4 for industrial applications. At this ratio, high product purity (approximately 96.7%) can be reliably achieved while keeping critical thermal risk parameters such as Qrmax (2.9 W) within acceptable safety limits, thus ensuring both process efficiency and safety.
Effect of the NaNO₂/2-ANDSA
-
The experimental data presented in Fig. 2d and Table 2 (Exp nos 5, 8–10) illustrate that as the molar ratio of sodium nitrite to 2-ANDSA increases from 1.0 to 1.1, there is a slight reduction in product purity from 96.7%, a variation that remains within the typical experimental uncertainty range (± 0.5%). Although this purity decrease is minor, the thermal risk parameters associated with this change become notably more pronounced, highlighting that thermal stability is significantly affected by even modest increases in the sodium-nitrite ratio. When the molar ratio further increases to 1.2 and 1.3, product purity continues to exhibit minor decreases.
More significantly, thermal risk parameters reveal considerable escalation at these higher molar ratios. Specifically, the maximum heat release rate Qrmax increases substantially, reaching 6.5 W at a molar ratio of 1.3, reflecting intensified heat generation and heightened thermal instability within the reaction system.
Although the maximum temperature attainable during thermal runaway MTSR remains relatively consistent across the molar ratios tested (ranging from 10.8 to 11.5 °C), the significant elevation of Qrmax underscores the enhanced thermal risks posed by higher reactant ratios. Moreover, the molar reaction enthalpy ΔHr notably decreases from 127.4 kJ/mol at a molar ratio of 1.0 to 114.5 kJ/mol at 1.3, indicating a consequent reduction in effective thermal output.
In conclusion, to effectively balance high product purity and manage thermal safety risks, it is recommended to strictly maintain the molar ratio of sodium nitrite to 2-ANDSA at approximately 1.0. This condition not only ensures optimal purity (around 96.7%) but also maintains critical thermal parameters, such as Qrmax (2.9 W), within safe operational limits, thus promoting reaction efficiency and minimizing the potential for thermal instability.
Effect of stirring rate
-
The experimental data depicted in Fig. 2e and Table 2 (Exp nos 5, 11–13) reveal that under lower stirring rates (200 rpm), the product purity is relatively lower (95.0%), reflecting insufficient mixing conditions. This inadequate stirring leads to limited mass transfer, and incomplete reactions. As stirring rates increase to 300 and 400 rpm, purity significantly improves, reaching 96.7% and 97.0%, respectively, indicating enhanced mixing and more effective mass transfer within the reaction system. Although a further slight increase in purity to 97.7% at 500 rpm is observed, it remains within the typical experimental uncertainty range (± 0.5%), suggesting no significant practical benefit in purity from higher stirring rates.
Of greater concern at higher stirring rates is the substantial escalation in thermal effects. The maximum heat release rate Qrmax notably increases from 3.2 W at 200 rpm to 6.0 W at 500 rpm, an 88% increment, underscoring the intensified heat generation caused by improved mixing conditions. Additionally, the maximum temperature attainable during thermal runaway (MTSR) rises from 11.7 °C at 300 rpm to 14.2 °C at 400 rpm, clearly demonstrating that elevated stirring rates substantially accelerate heat accumulation, elevating the risk of thermal instability.
The molar reaction enthalpy ∆Hr remains stable between stirring rates of 200 and 400 rpm. However, at 500 rpm, experimental observations note significant material splashing, potentially causing uneven distribution of reactants and localized temperature spikes. This non-uniform environment significantly reduces the effective reaction enthalpy from 125.1 kJ/mol at 400 rpm to 122.2 kJ/mol at 500 rpm.
In conclusion, maintaining a stirring rate of around 400 rpm is recommended for industrial processes. At this rate, optimal purity (approximately 97.0%) and controlled thermal risk (Qrmax = 5.2 W, MTSR = 14.2 °C) are achievable, effectively balancing product quality and reaction safety by mitigating the risks associated with lower mixing efficiency at 200–300 rpm and preventing adverse effects like material splashing and localized overheating at higher stirring rates (≥ 500 rpm).
Effect under distinct temperature control modes (Tr and Tj)
-
The process dynamics of the 2-ANDSA diazotization reaction under different temperature control modes (Tr and Tj) were analyzed in detail, as illustrated in Fig. 3a and b, showing variations in reaction temperature (Tr), jacket temperature (Tj), heat release rate (Qr), and cumulative dosage of 30% sodium nitrite solution. At the initial stage, the Tr mode demonstrates a rapid rise in reaction temperature and heat release rate, indicating significant exothermic behavior. Conversely, the Tj mode shows a gentler temperature increase and a lower, more sustained heat release rate. These observations highlight that the Tr mode results in more concentrated heat generation, potentially leading to rapid temperature escalation and elevated thermal risk. The Tj mode, by comparison, provides a more gradual and controlled temperature rise, contributing to enhanced process stability.
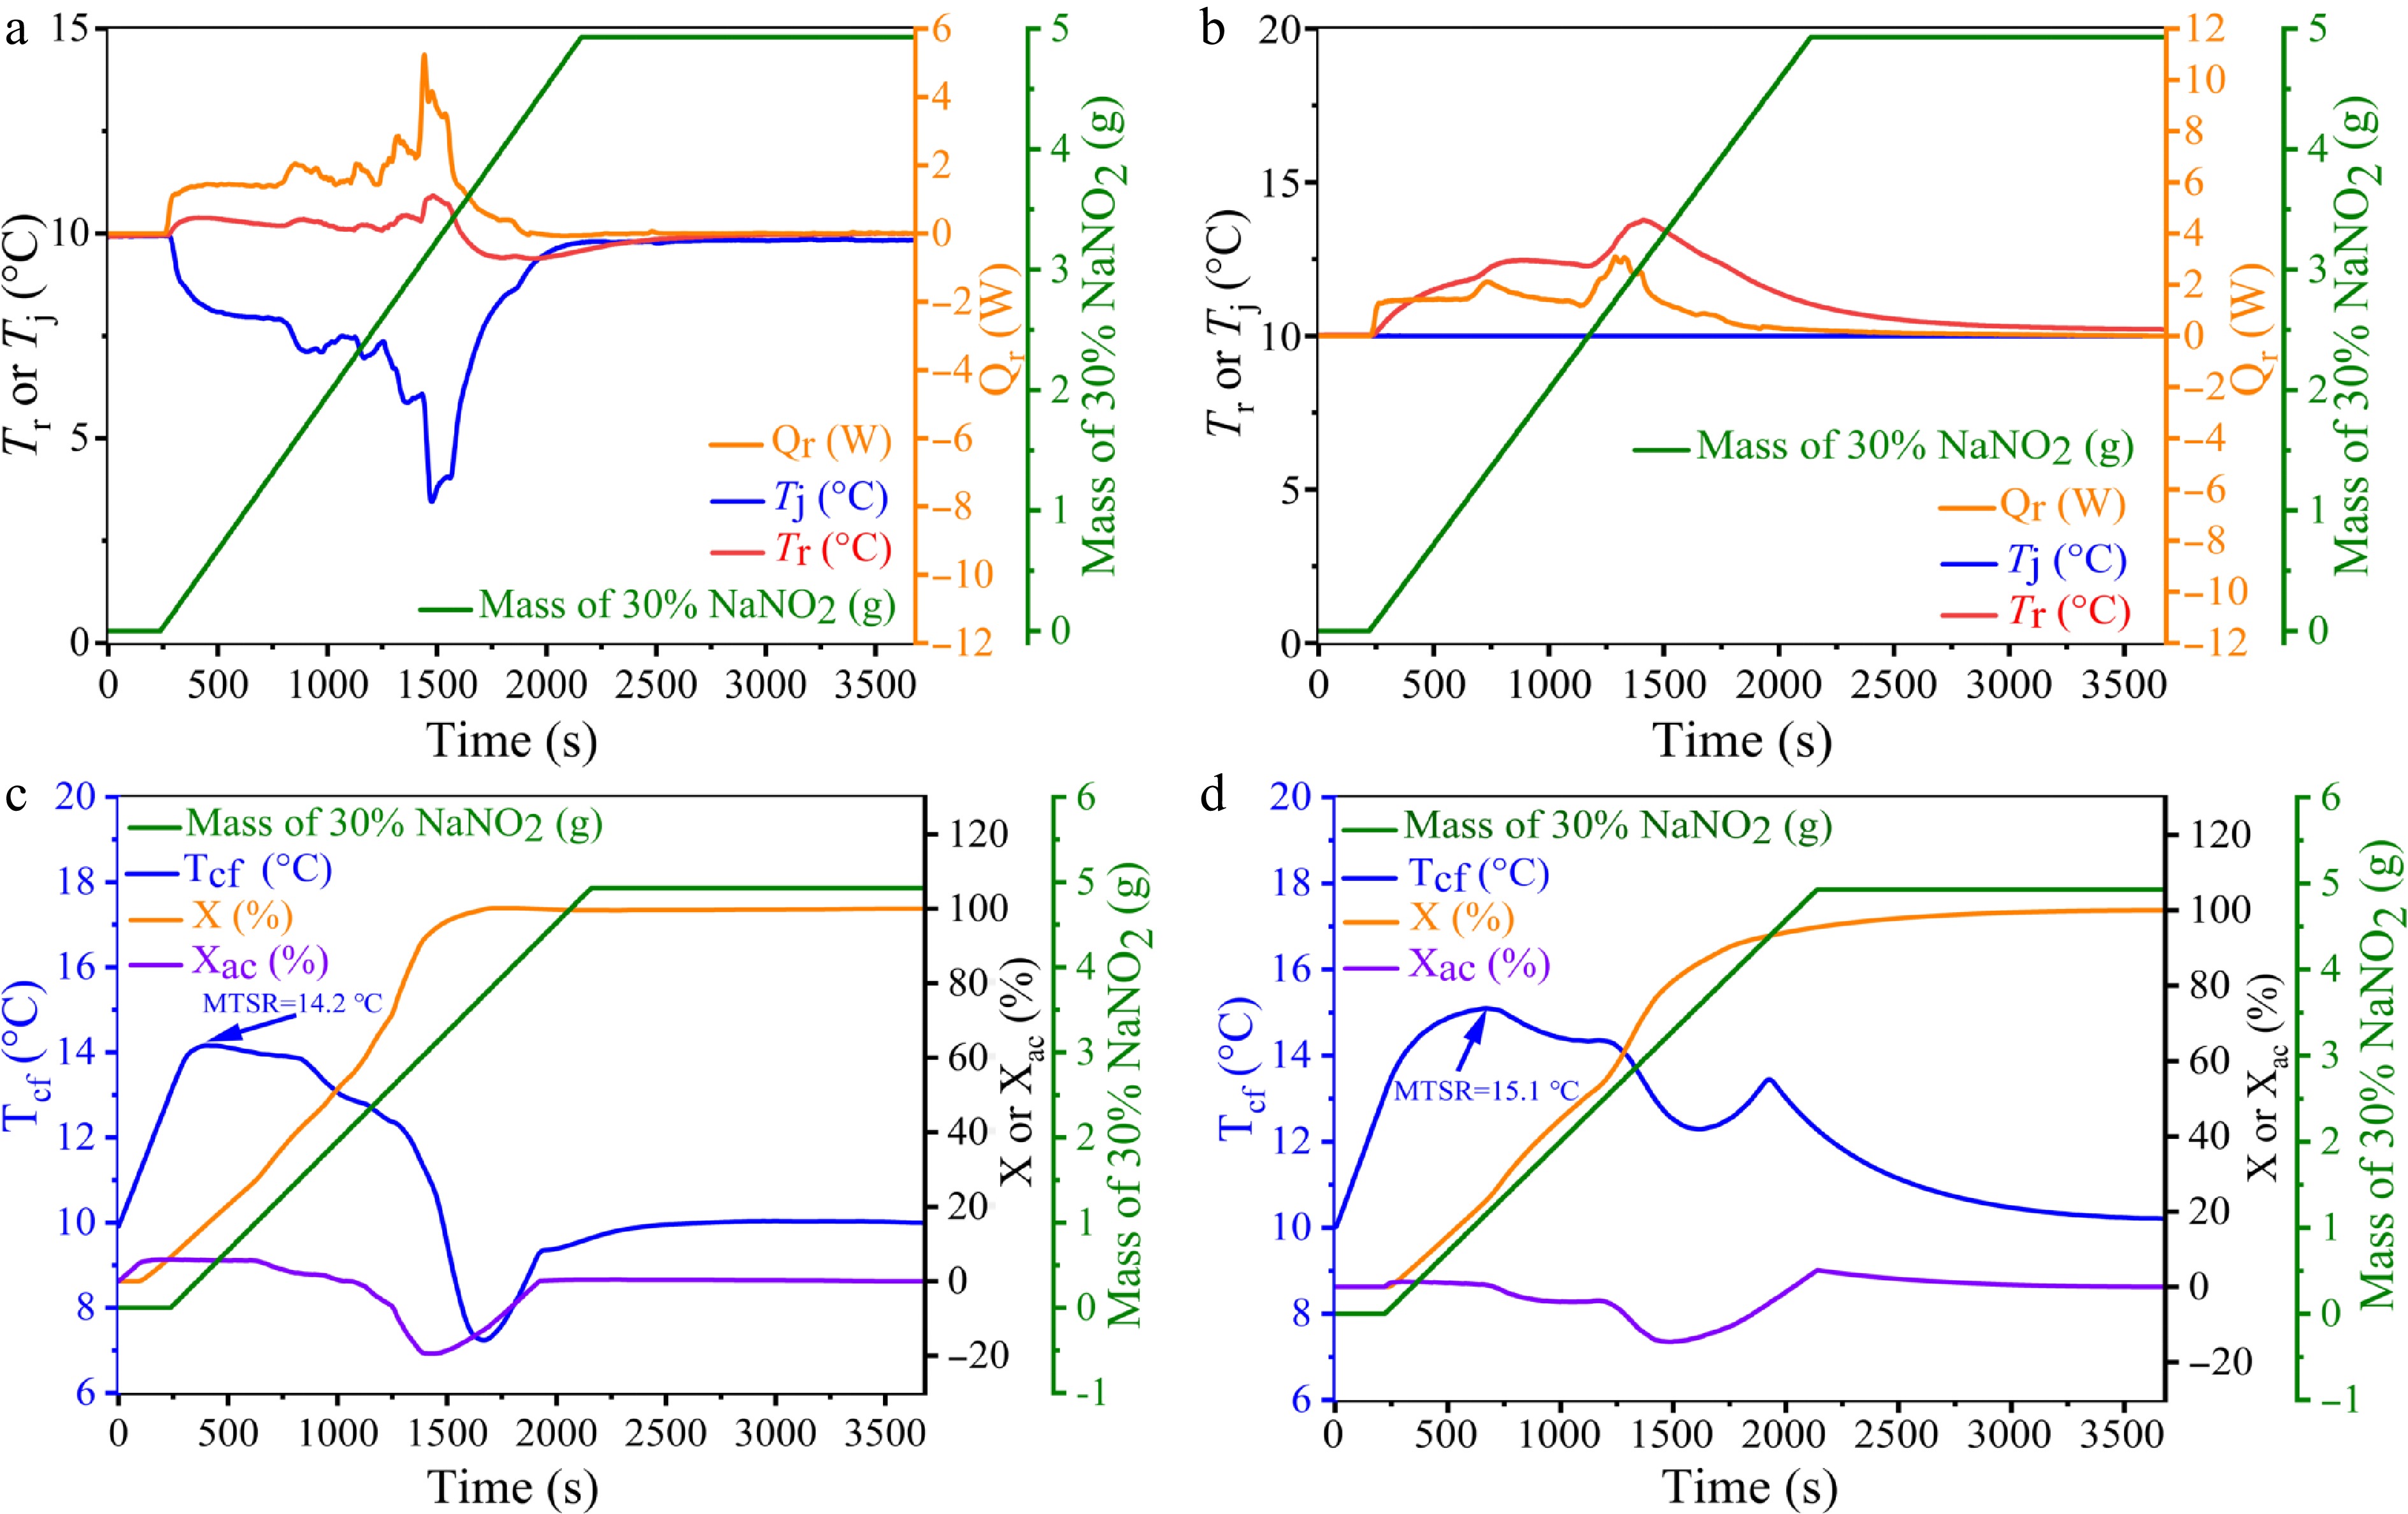
Figure 3.
Curves showing the changes in Tr, Tj, Qr, and the amount of 30% NaNO2 solution added under the Tr and Tj modes during the 2-ANDSA diazotization reaction. (c), (d) Trend graphs of Tcf, X, Xac, and the amount of 30% NaNO2 solution added under the Tr and Tj modes during the 2-ANDSA diazotization reaction.
During reagent dosing, the Tr mode shows a rapid temperature increase and reaches higher peak values faster compared to the Tj mode, reflecting differences in heat release dynamics and heat dissipation efficiency. Table 2 (Exp nos 15, 17) indicates similar molar reaction enthalpy ΔHr values under both control modes—123.76 and 122.21 kJ/mol, respectively—suggesting comparable total heat release.
Analysis of thermal accumulation temperature after reaction runaway Tcf in the Tr mode (Fig. 3c) demonstrates a rapid initial rise, reflecting intense initial heat generation. As the reaction progresses, Tcf stabilizes around the set temperature (approximately 10 °C). Concurrently, the heat conversion rate increases rapidly, aligning with decreasing heat accumulation, indicating effective initial heat management and subsequent stabilization. These characteristics underline the stringent temperature control provided by the Tr mode, which successfully mitigates overheating risks and reaction instability.
Under the Tj mode (Fig. 3d), Tcf also increases rapidly initially but continues to increase gradually over an extended dosing period, indicating persistent heat accumulation. The heat conversion rate rises more slowly, and heat accumulation remains elevated longer, gradually decreasing only toward reaction completion. This prolonged heat accumulation notably heightens thermal instability risks compared to the Tr mode.
Further analysis of the Maximum Temperature of Synthesis Reaction MTSR reveals a higher value under the Tj mode (15.13 °C) compared to the Tr mode (14.18 °C). This difference underscores the effective early-stage heat dissipation achieved in the Tr mode, which reduces overall thermal risk despite intense initial exothermic behavior. Conversely, sustained heat accumulation in the Tj mode contributes to a higher MTSR, indicative of greater overall thermal risk.
In conclusion, the Tr mode, characterized by effective temperature control and concentrated initial heat release, is preferable for safely managing the 2-ANDSA diazonium salt synthesis process. Precise monitoring of early-stage exothermic behavior and proactive risk management strategies are essential to further enhance process safety and reliability in industrial applications.
Assessment of thermal risks under deviant operational states
-
This paper adopts a single-factor variable control approach to systematically investigate the impact of critical process parameters, such as temperature, feeding rate, and solvent ratio, on both the purity of 2-ANDSA diazonium salt and thermal risks during its synthesis under abnormal operating conditions, with a particular focus on process safety performance. The specific experimental parameter ranges are provided in Table 3.
Table 3. Single-factor conditions for abnormal diazotization of 2-ANDSA.
Exp no. T (°C) Feed rate (mL/min) Solvent (H2O)/2-ANDSA 1 10 0.3 4 2 40 0.3 4 3 50 0.3 4 4 60 0.3 4 5 10 0.6 4 6 10 1.2 4 7 10 Single addition (—) 4 8 10 0.3 2.5 9 10 0.3 3.0 10 10 0.3 3.5 The experimental study utilizes the Tj model under the laboratory-optimized process conditions identified in Table 1 (Exp no. 17), scaled up by a factor of two, in order to assess the effects of process scale-up and variations in process parameters on thermal risk parameters and product purity under abnormal conditions.
During the experiment, strict control was applied to key parameters, including temperature, feeding rate, and solvent ratio, to ensure the accuracy, stability, and reproducibility of the results.
The purity and major thermal risk parameter results obtained from the experiments are summarized in Table 4.
Table 4. Key thermal risk parameters.
Exp no. Purity (%) Qrmax (W) MTSR ( °C) ΔHr (kJ/mol) 1 88.1 3.5 15.4 86.1 2 88.0 3.3 44.8 109.0 3 8.0 3.8 52.2 118.0 4 0 5.1 64.9 175.0 5 84.9 5.2 24.4 94.6 6 81.5 11.8 25.8 113.8 7 98.9 108.4 17.4 118.9 8 32.8 4.6 27.9 141.0 9 64.3 6.6 13.9 99.6 10 89.6 3.7 12.4 89.2 Effect of high temperature
-
The experimental data presented in Fig. 4a and Table 4 (Exp nos 1–4) indicate that at a lower reaction temperature of 10 °C, the purity of the target product reaches 88.1%, accompanied by a relatively low molar reaction enthalpy ΔHr of 86.1 kJ/mol, a maximum heat release rate Qrmax of 3.5 W, and a maximum temperature of synthesis reaction MTSR of 15.4 °C. Under these conditions, the formation of the diazonium salt proceeds at a moderate rate.
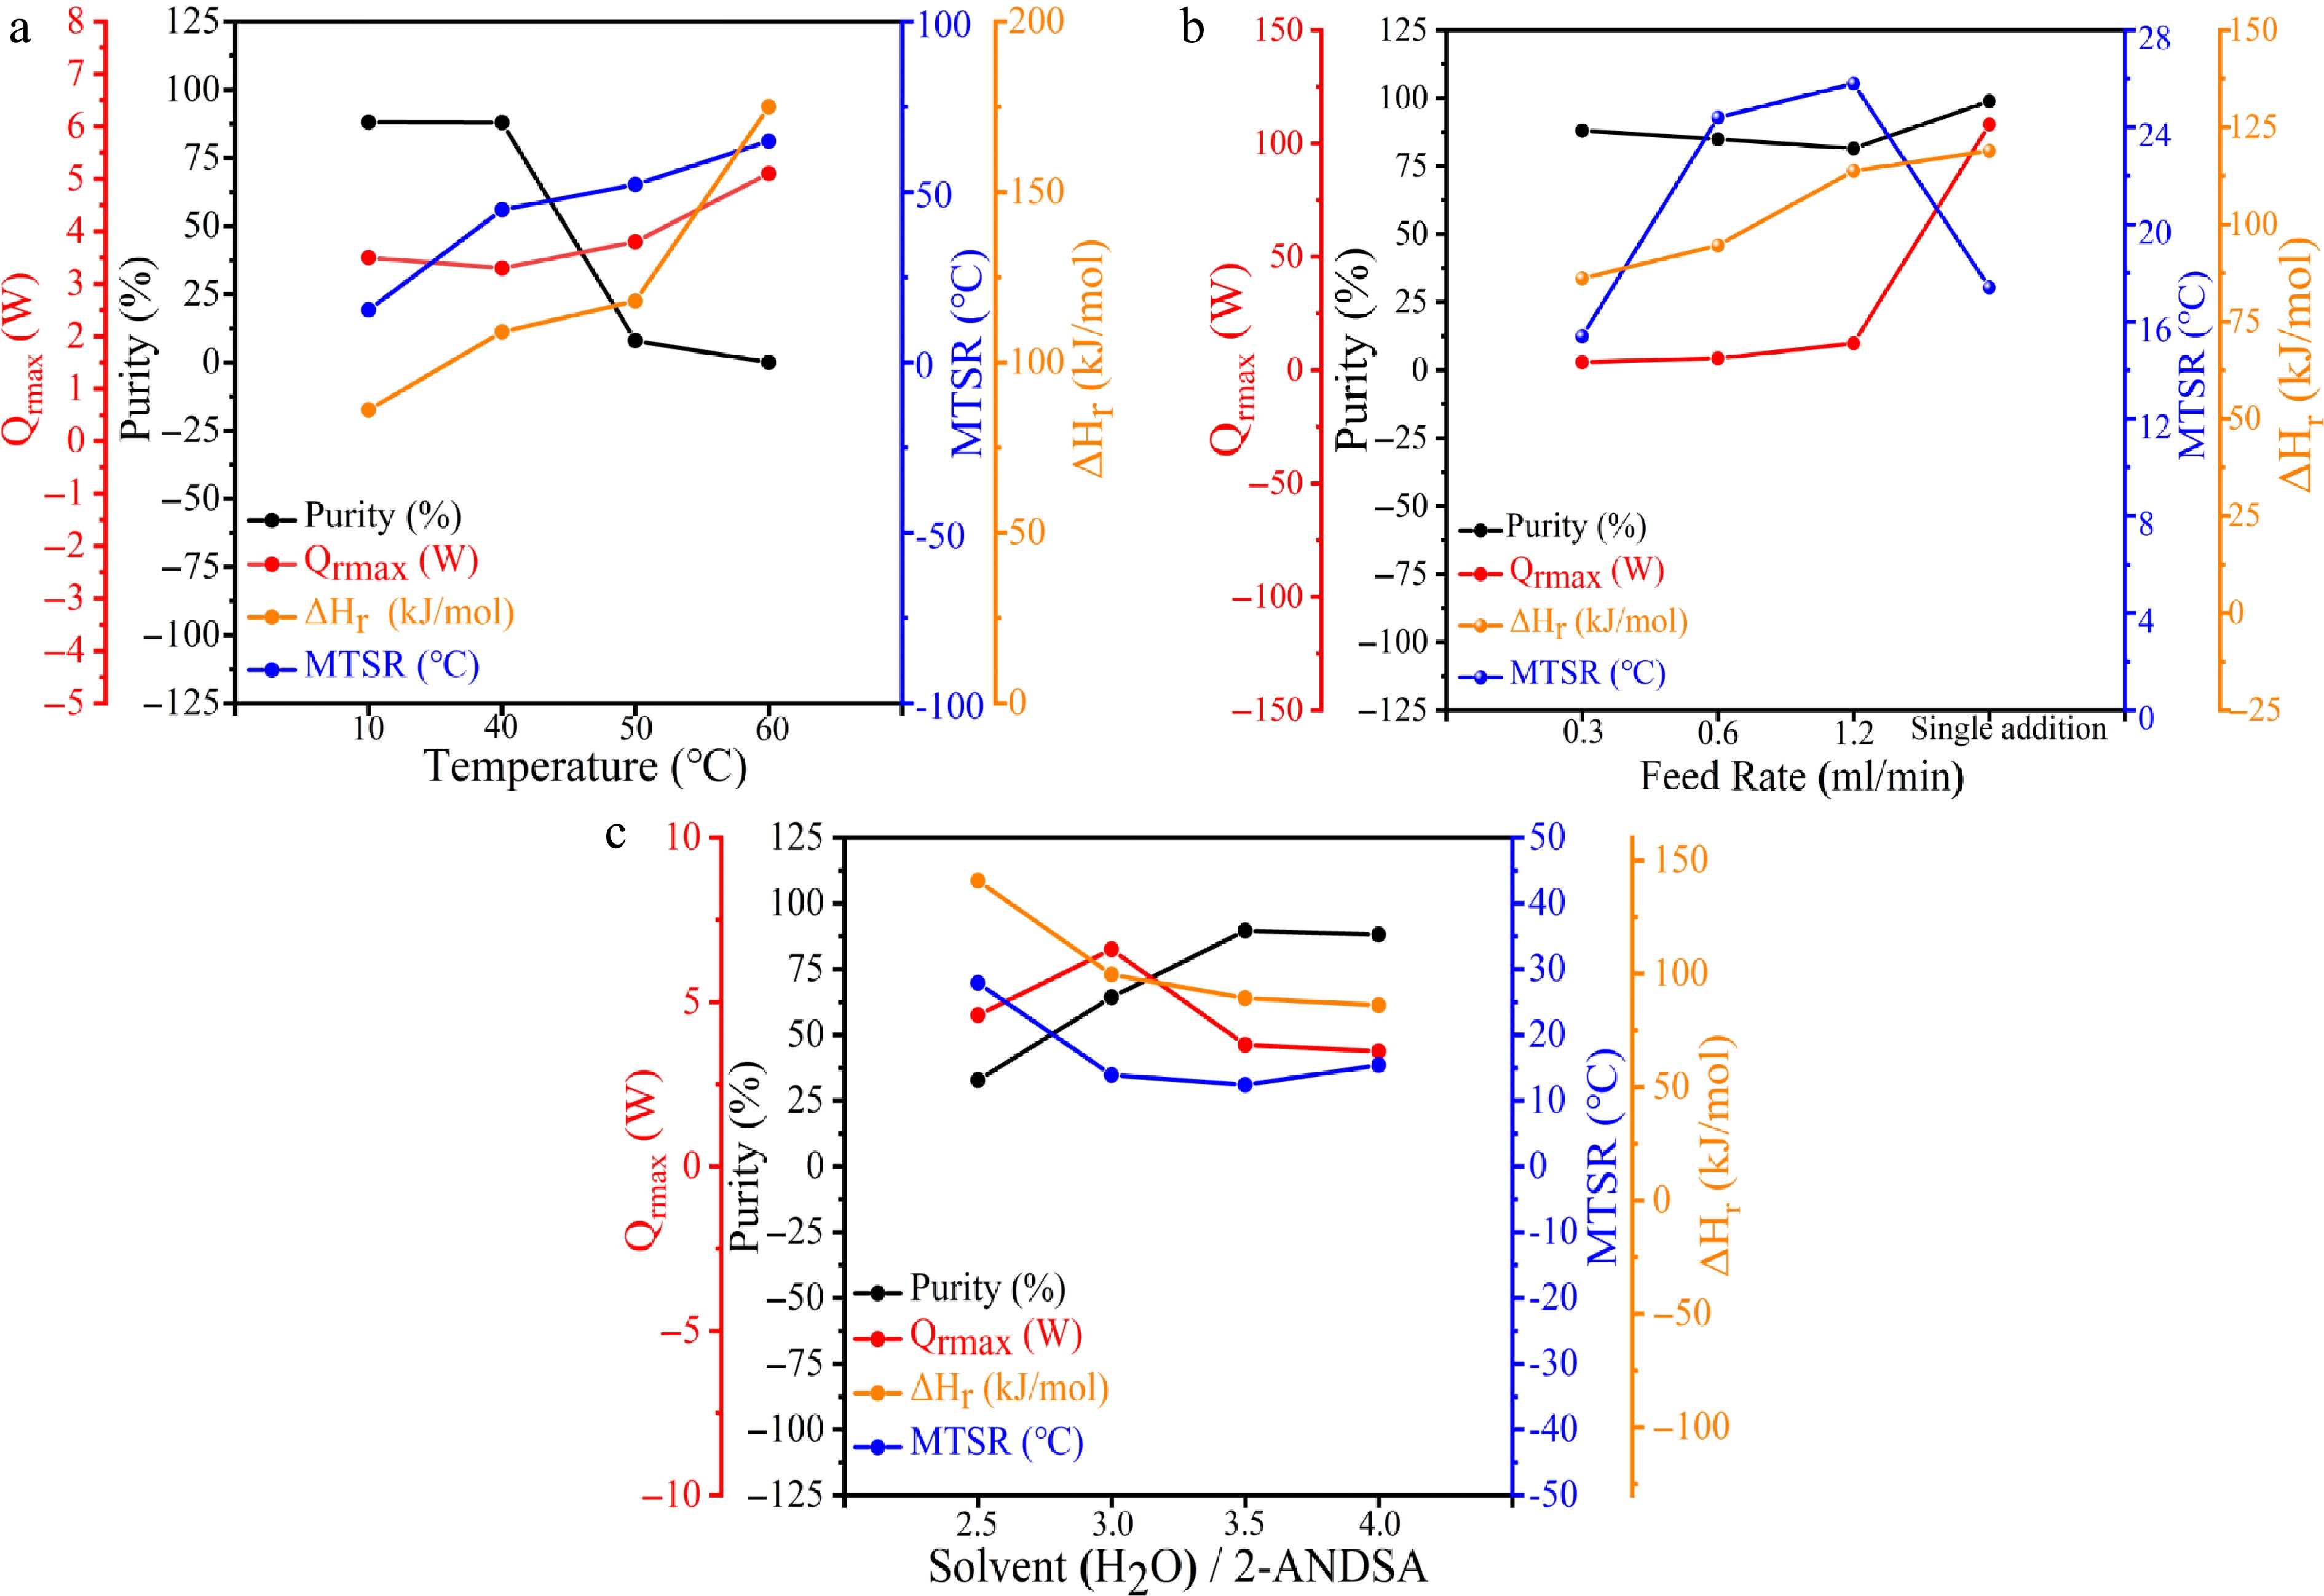
Figure 4.
Quantitative representation of purity and thermal risk parameters in the 2-ANDSA diazotization reaction under abnormal conditions. (a) High temperature, (b) high feeding rate, (c) low solvent (H2O)/2-ANDSA ratio.
As the reaction temperature increases to 40 °C, the purity of the target product remains stable at approximately 88.0%, indicating only slight changes within the typical experimental uncertainty range (± 0.5%). However, thermal effects become significantly more pronounced, with ΔHr increasing notably to 109.0 kJ/mol and the MTSR markedly rising to 44.8 °C. These substantial increases in thermal parameters highlight that elevated reaction temperatures significantly enhance thermal risks.
Further elevating the temperature to 50 °C results in a sharp decline in product purity to 8.0%, far exceeding typical experimental error margins, clearly signifying significant side reaction dominance and heightened thermal risk, as reflected by sustained increases in thermal parameters. At 60 °C, product formation becomes uncontrolled, with product purity dropping to 0%. Correspondingly, ΔHr significantly escalates to 175.0 kJ/mol, Qrmax reaches 5.1 W, and the MTSR peaks at 64.9 °C.
Additionally, in comparison with Table 1 (Exp. 17, without scale-up), the observed purity reduction under scaled-up conditions is primarily attributed to the increased volume of reaction mixtures, resulting in inadequate stirring capacity and significantly reduced mass transfer efficiency. Poor mixing results in uneven local concentration profiles, which in turn reduce product purity and increase thermal risks.
In conclusion, to effectively manage thermal safety risks and maintain high product purity in the 2-ANDSA diazonium salt synthesis, it is recommended to strictly control reaction temperatures below 40 °C. During process scale-up, enhancing mass transfer efficiency within the reactor is critically important to mitigate the risks associated with thermal runaway, thus ensuring process safety and product quality.
Effect of high feeding rate
-
The experimental results illustrated in Fig. 4b and Table 4 (Exp nos 1, 5–7) demonstrate that, under a constant reaction temperature of 10 °C, a feeding rate of 0.3 mL/min yields a product purity of approximately 88.1%, accompanied by a maximum heat release rate Qrmax of 3.5 W and a maximum temperature of synthesis reaction MTSR of 15.4 °C. These conditions suggest moderate thermal stability with minimal thermal risks.
Increasing the feeding rate to 1.2 mL/min results in a slight reduction in product purity to 81.5%, a decrease that exceeds typical experimental error margins (± 0.5%) and thus indicates a notable shift in reaction selectivity. More significantly, thermal risk parameters exhibit considerable escalation, with Qrmax rising sharply to 11.8 W, MTSR increasing to 25.8 °C, and molar reaction enthalpy ΔHr simultaneously elevating to 113.8 kJ/mol. This pronounced escalation in thermal parameters indicates intensified heat generation and significantly heightened thermal risk.
Remarkably, batch feeding conditions (single charge) yield a distinct outcome. Although Qrmax peaks dramatically at 108.4 W due to rapid, instantaneous heat release, the reaction completion occurs swiftly, resulting in minimal exposure to prolonged high-concentration and high-temperature conditions. Consequently, the MTSR remains relatively moderate (17.4 °C), and product purity notably reaches 98.9%. These findings suggest that batch feeding, under optimal mixing conditions, can effectively improve product purity and thermal safety.
Based on these analyses, it is recommended that industrial applications employ lower feeding rates (≤ 0.3 mL/min) to mitigate local concentration peaks, thereby enhancing thermal management and reducing the risk of temperature runaway. Such controlled conditions facilitate achieving both high product purity and improved process safety.
Effect of low solvent (H2O)/2-ANDSA ratio
-
The experimental results presented in Fig. 4c and Table 4 (Exp Nos 1, 8–10) demonstrate that under normal operating conditions with a solvent ratio of 4, the target product purity is approximately 88.1%, accompanied by a moderate molar reaction enthalpy ΔHr of 86.1 kJ/mol, a maximum heat release rate Qrmax of 3.5 W, and a maximum temperature of synthesis reaction MTSR of 15.4 °C. These parameters collectively indicate sufficient solvent content and adequate mass and heat transfer, ensuring reaction stability and maintaining low thermal risks, thereby highlighting satisfactory process safety.
When the solvent ratio is reduced to 2.5, the product purity notably decreases to 32.8%, a reduction clearly exceeding the typical experimental uncertainty range (± 0.5%) and signifying a significant decline in reaction selectivity. Concurrently, thermal parameters markedly increase, with ΔHr rising to 141.0 kJ/mol, Qrmax increasing to 4.6 W, and MTSR climbing to 27.9 °C. These pronounced changes in thermal behavior suggest severe restrictions in mass transfer due to increased viscosity.
Increasing the solvent ratio to 3 raises product purity to 64.3%. Although Qrmax slightly increases, both ΔHr and MTSR notably decrease, indicating enhanced fluid dynamics and mass transfer that improve overall reaction stability. Further increasing the solvent ratio to 3.5 achieves optimal purity at 89.6%, with ΔHr reduced to 89.2 kJ/mol, Qrmax decreased to 3.7 W, and MTSR significantly lowered to 12.4 °C. Improved solvent conditions markedly enhance system homogeneity and fluidity, thus substantially reducing thermal risks.
In conclusion, maintaining an appropriate solvent ratio is critical to ensuring both high product purity and process safety. Excessively low solvent ratios lead to intense local reactions, significantly heightened thermal risks, and reduced product quality. Thus, it is recommended for industrial practice to maintain a solvent ratio of no less than 3.5 to prevent high-viscosity issues, uneven mixing, reduced purity, and substantial increases in thermal risk. Adhering to this recommended solvent ratio ensures effective management of product quality and thermal safety, contributing to the economic and operational viability of the production process.
Thermal decomposition experiments
DSC thermal decomposition characterization
-
Figure 5a illustrates the DSC thermal decomposition characteristics of the key raw materials and the product from Table 1 (Exp no. 15) obtained after centrifugation, all of which are involved in the 2-ANDSA diazonium salt synthesis process. The DSC curve provides a clear indication of the thermal stability and potential thermal risks of the different substances.
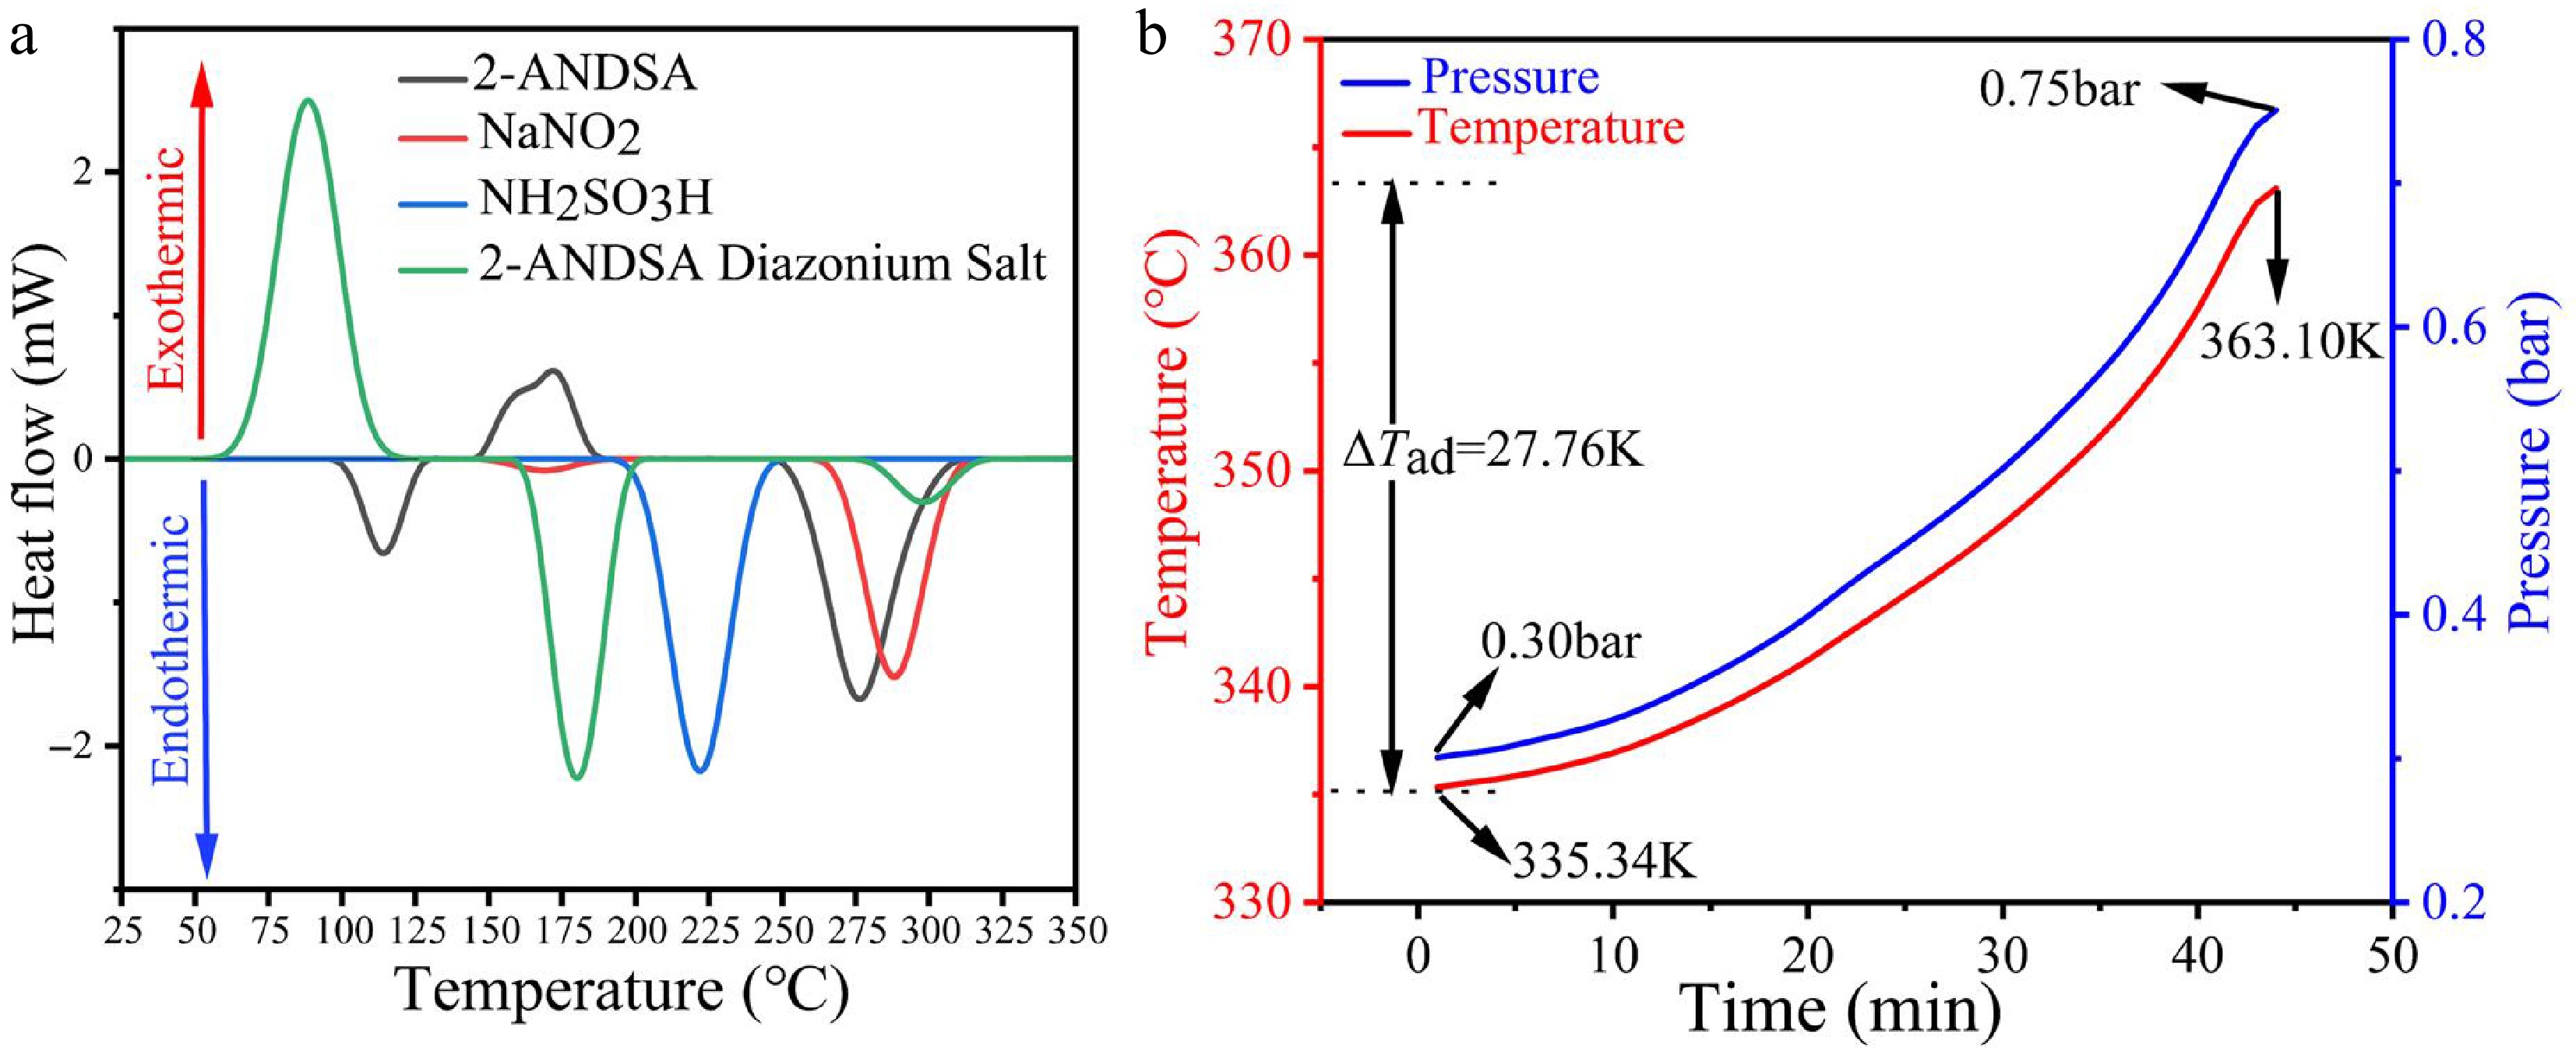
Figure 5.
Thermal behavior and hazard assessment of 2-ANDSA diazonium salt. (a) DSC thermograms of 2-ANDSA, NaNO2, NH2SO3H, and 2-ANDSA diazonium salt. (b) Adiabatic temperature and pressure profiles of 2-ANDSA diazonium salt in ARC.
The 2-ANDSA diazonium salt exhibits a sharp exothermic peak at approximately 72.95 °C, with a decomposition heat (∆Hd) of 136.81 J/g. This is directly related to the instability of the diazo group (-N = N-) in its molecular structure. The thermal decomposition of the diazo group generally involves the breaking of the diazo bond, releasing nitrogen gas and leading to a significant release of heat. While this ∆Hd value does not reach the high-risk threshold of 250−300 J/g, as defined by the AIChE Chemical Process Safety Center[24,25], the clear and sharp exothermic peak at such a low temperature (72.95 °C) still suggests that this substance presents a high thermal runaway risk.
At around 152.5 °C, 2-ANDSA exhibits a mild exothermic reaction, with a ∆Hd value of only 30.73 J/g. This lower value is associated with the relative stability of its molecular structure, where the thermal decomposition process mainly involves the removal of the sulfonic group or an intramolecular dehydration cyclization reaction, resulting in limited heat release and relatively low risk.
Sodium nitrite and aminobenzenesulfonic acid did not exhibit significant exothermic or endothermic effects between 20 and 350 °C, indicating that these substances have high thermal stability and are unlikely to undergo thermal decomposition under normal process conditions, thus posing no significant thermal risks.
Table 5 outlines the specific experimental conditions for each substance, including a consistent heating rate of 5 °C/min, sample masses of approximately 6 mg, and a temperature range from 20 to 350 °C. The consistency of these experimental conditions enhances the comparability and reliability of the data.
Table 5. DSC experimental conditions.
Chemical Mass (mg) β (°C/min) Range ( °C) 2-ANDSA 5.90 5 20−350 NaNO2 6.00 5 20−350 H3NO3S 5.93 5 20−350 2-ANDSA Diazonium Salt 6.10 5 20−350 In conclusion, the thermal stability of 2-ANDSA diazonium salt is poor and should be carefully monitored during the synthesis process. Given its thermal instability and the characteristics of its decomposition reaction, special attention should be paid to temperature control measures and safety protocols to effectively prevent thermal runaway risks and ensure the safe and stable operation of the chemical process.
Adiabatic thermal runaway characteristics of the reaction
Thermal runaway risk of the product
-
The experimental product from Table 1 (Exp no. 15) was subjected to centrifugation and placed under adiabatic conditions. Temperature and pressure changes were then monitored using an ARC calorimeter to simulate thermal runaway behavior during the reaction process. As shown in Fig. 5b, the reaction initiated at 335.34 K, and after approximately 40 min, the temperature increased to 363.10 K, resulting in an adiabatic temperature rise ΔTad) of 27.76 K. Concurrently, the pressure of the reaction system increased from 0.30 to 0.75 bar. This process suggests that the reaction was accompanied by significant gas generation and heat release, leading to a marked increase in system pressure.
Although the decomposition onset temperature recorded by DSC is approximately 346.10 K, ARC detects an earlier onset at 335.34 K. This discrepancy is attributed to the inherent differences in calorimetric principles and test conditions. DSC operates under linear heating with small sample masses (~6 mg), providing high resolution for detecting endo- and exothermic transitions under near-equilibrium conditions. In contrast, ARC employs a significantly larger sample (~1 to 2 g) under quasi-adiabatic conditions and utilizes the Heat-Wait-Search (HWS) algorithm, making it more sensitive to the earliest signs of self-heating and gas release. As such, ARC tends to identify the true self-accelerating decomposition temperature (SADT) under worst-case thermal confinement. The complementary nature of the two methods enables a more accurate and complete thermal hazard characterization.
Therefore, under high-temperature conditions, excessive heat and gas may accumulate, particularly if the temperature and pressure controls in the reaction equipment are insufficient, which could lead to safety concerns. As a result, it is crucial to account for these potential safety hazards when designing and operating process equipment. Appropriate safety control measures, including enhanced real-time monitoring of temperature and pressure and ensuring the effectiveness of cooling systems, should be adopted to ensure the stability and safety of the reaction process.
Adiabatic kinetic analysis
-
Figure 6a illustrates the relationship between lnk and 1/T derived from the rate constant method, with each curve corresponding to different reaction orders (n = 0.0, 0.5, 1.0, 1.5, 2.0, 2.5, 3.0). The inset summarizes the corresponding kinetic constants (Eₐ, ln A, n, R²). As the reaction order (n) increases, the activation energy (Ea) increases significantly, which is directly related to the complexity of the reaction mechanism.
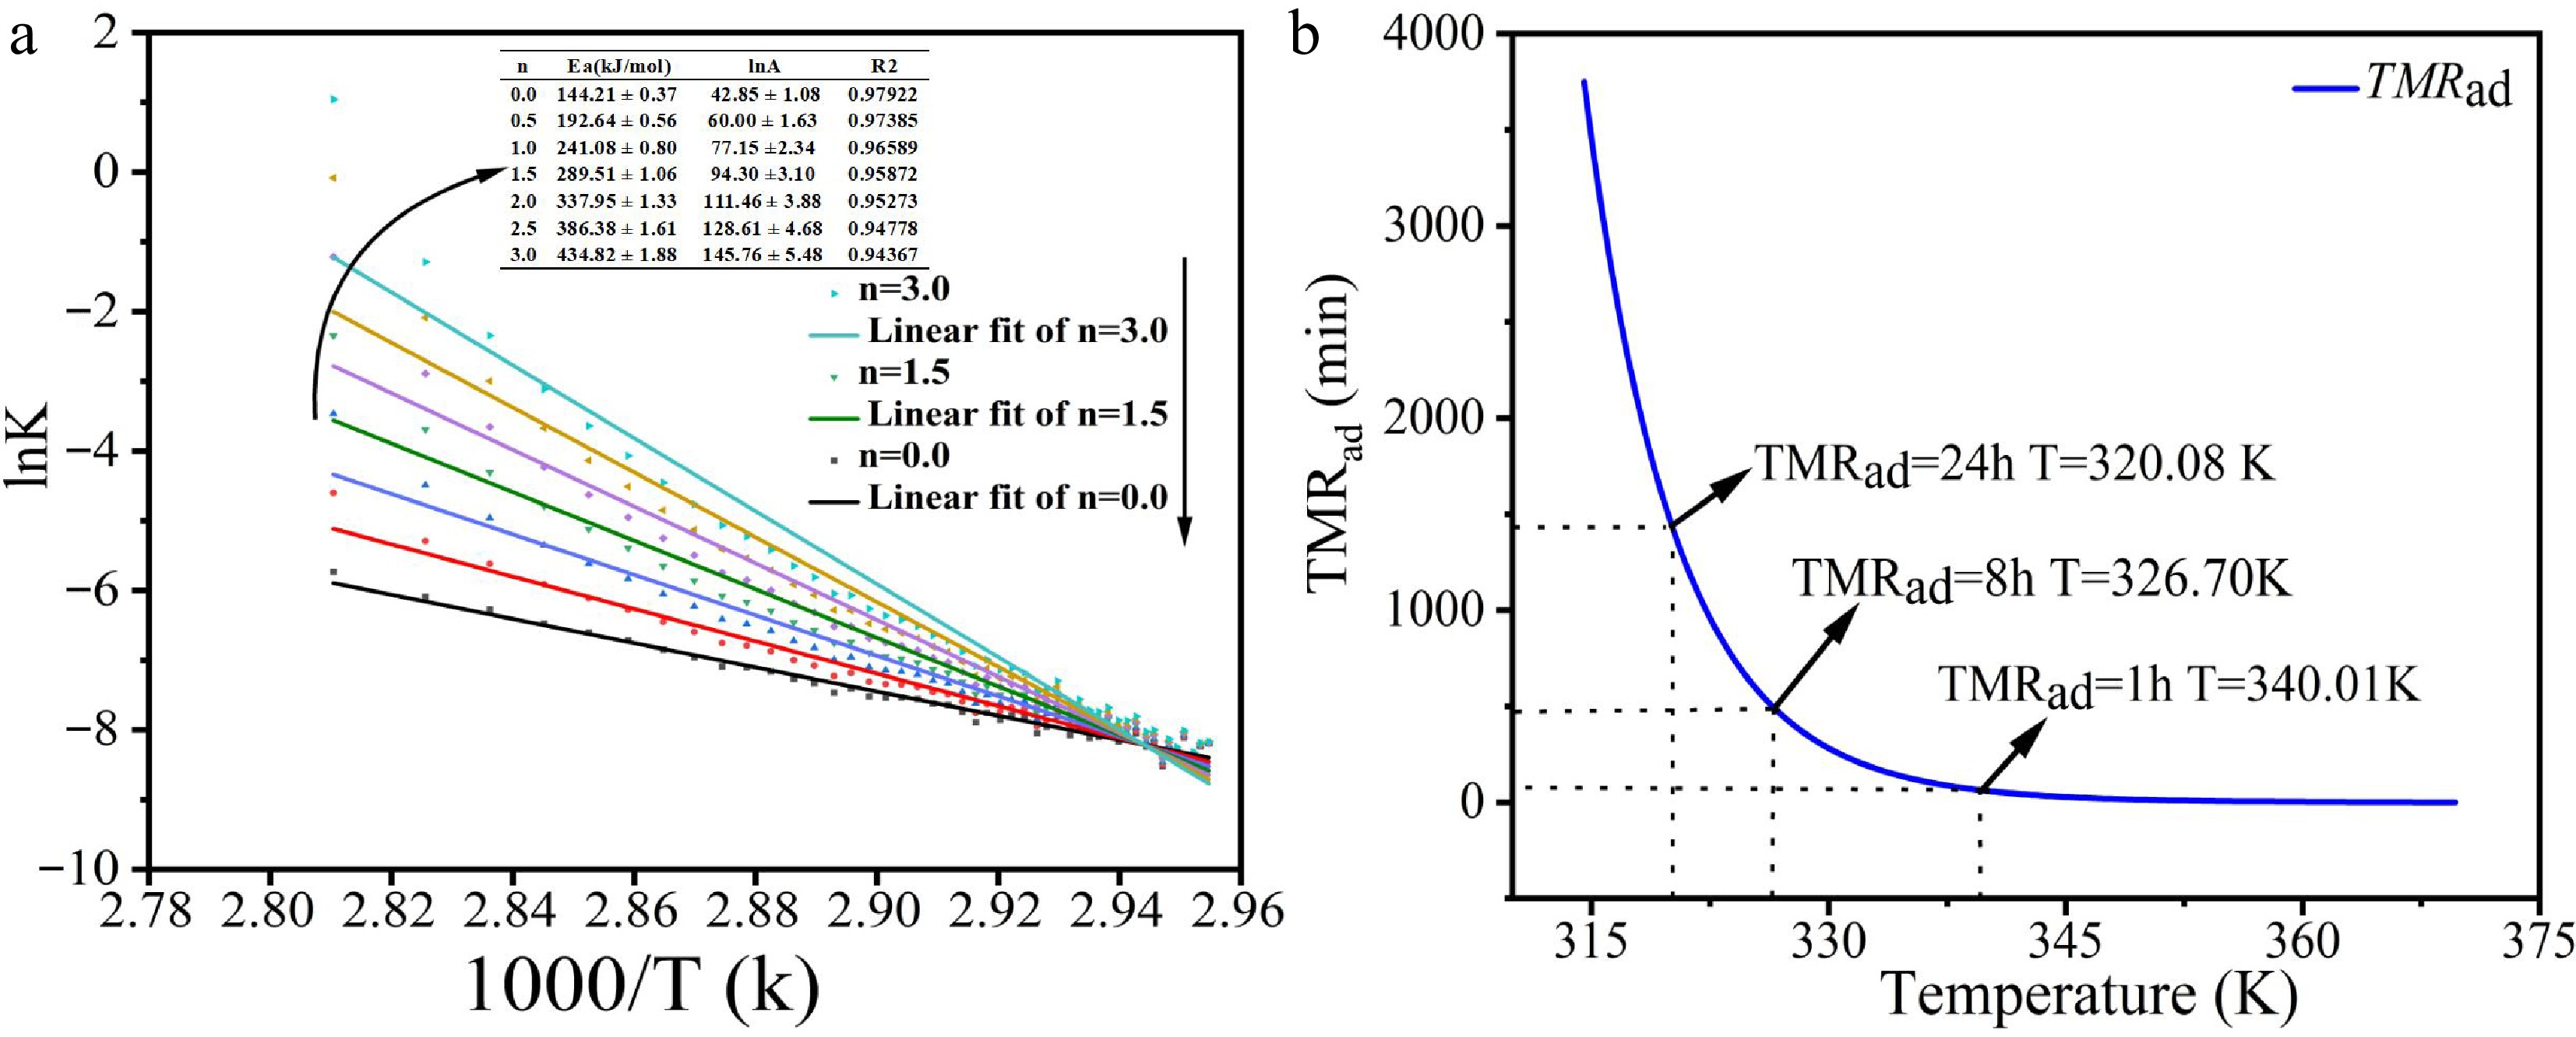
Figure 6.
(a) Arrhenius plots (lnk vs 1/T) for various reaction orders. (b) TMRad vs temperature curves under adiabatic conditions.
The experimental data reveal that when n = 0, the reaction mechanism is relatively simple, with an activation energy of 144.21 kJ/mol, a lnA of 42.85 s-1, and an R² value of 0.97922. This indicates a very high degree of fit for the kinetic model, which is suitable for describing the reaction rate behavior. However, when n increases to 3, the activation energy increases to 434.82 kJ/mol, lnA to 145.76, and the R² value decreases to 0.94367. While the reaction mechanism becomes more complex, the fit is slightly reduced, suggesting that more complex mechanisms may introduce additional uncertainties that lead to a decline in fit accuracy. The impact of this mechanistic change on thermodynamic behavior is significant. A higher reaction order increases the sensitivity of the reaction rate to temperature, potentially escalating the risk of thermal runaway. Thus, the complexity and potential thermal risks associated with higher n values must be carefully considered during the design and operational processes to ensure the reaction remains controllable.
Additionally, by analyzing the kinetic fitting results under adiabatic conditions and examining the relationship between the time required for the maximum reaction rate TMRad[26] and temperature under adiabatic conditions, the thermal runaway risk associated with the diazonium salt synthesis reaction was further evaluated. Figure 6b shows the relationship between TMRad and temperature. The results show that as the temperature increases, the reaction rate accelerates, and TMRad decreases exponentially. Between 320 and 340 K, TMRad drops from 24 to 1 h, indicating a pronounced accelerating effect of temperature on the reaction rate.
Based on this data, the worst-case scenario for the diazonium salt reaction was assessed, and the corresponding temperatures for TD8 and TD24 were found to be 320.08 and 326.70 K, respectively. This provides critical insight for temperature control in operational settings. To avoid potential thermal runaway during transportation and usage, the operating temperature of the diazonium salt should be kept below 320.0 K. This analysis underscores the crucial role temperature plays in the reaction rate and thermal runaway risk, offering important safety guidance for temperature control in industrial applications. The findings of this study provide theoretical support for thermal risk assessments in chemical reactions and can serve as a foundation for developing safety protocols in industrial operations.
HPLC-MS characterization of the product
-
To further elucidate the structure of the reaction product, the product from Table 1 (Exp no. 15) was analyzed by liquid chromatography-mass spectrometry (HPLC-MS) after centrifugation. The results, presented in Fig. 7a, show a distinct peak at 1.47 min with a purity of 98.97%. This represents an increase of 1.96% in purity relative to the product from Table 1 (Exp no. 15), suggesting that the product at this time point is the dominant component.
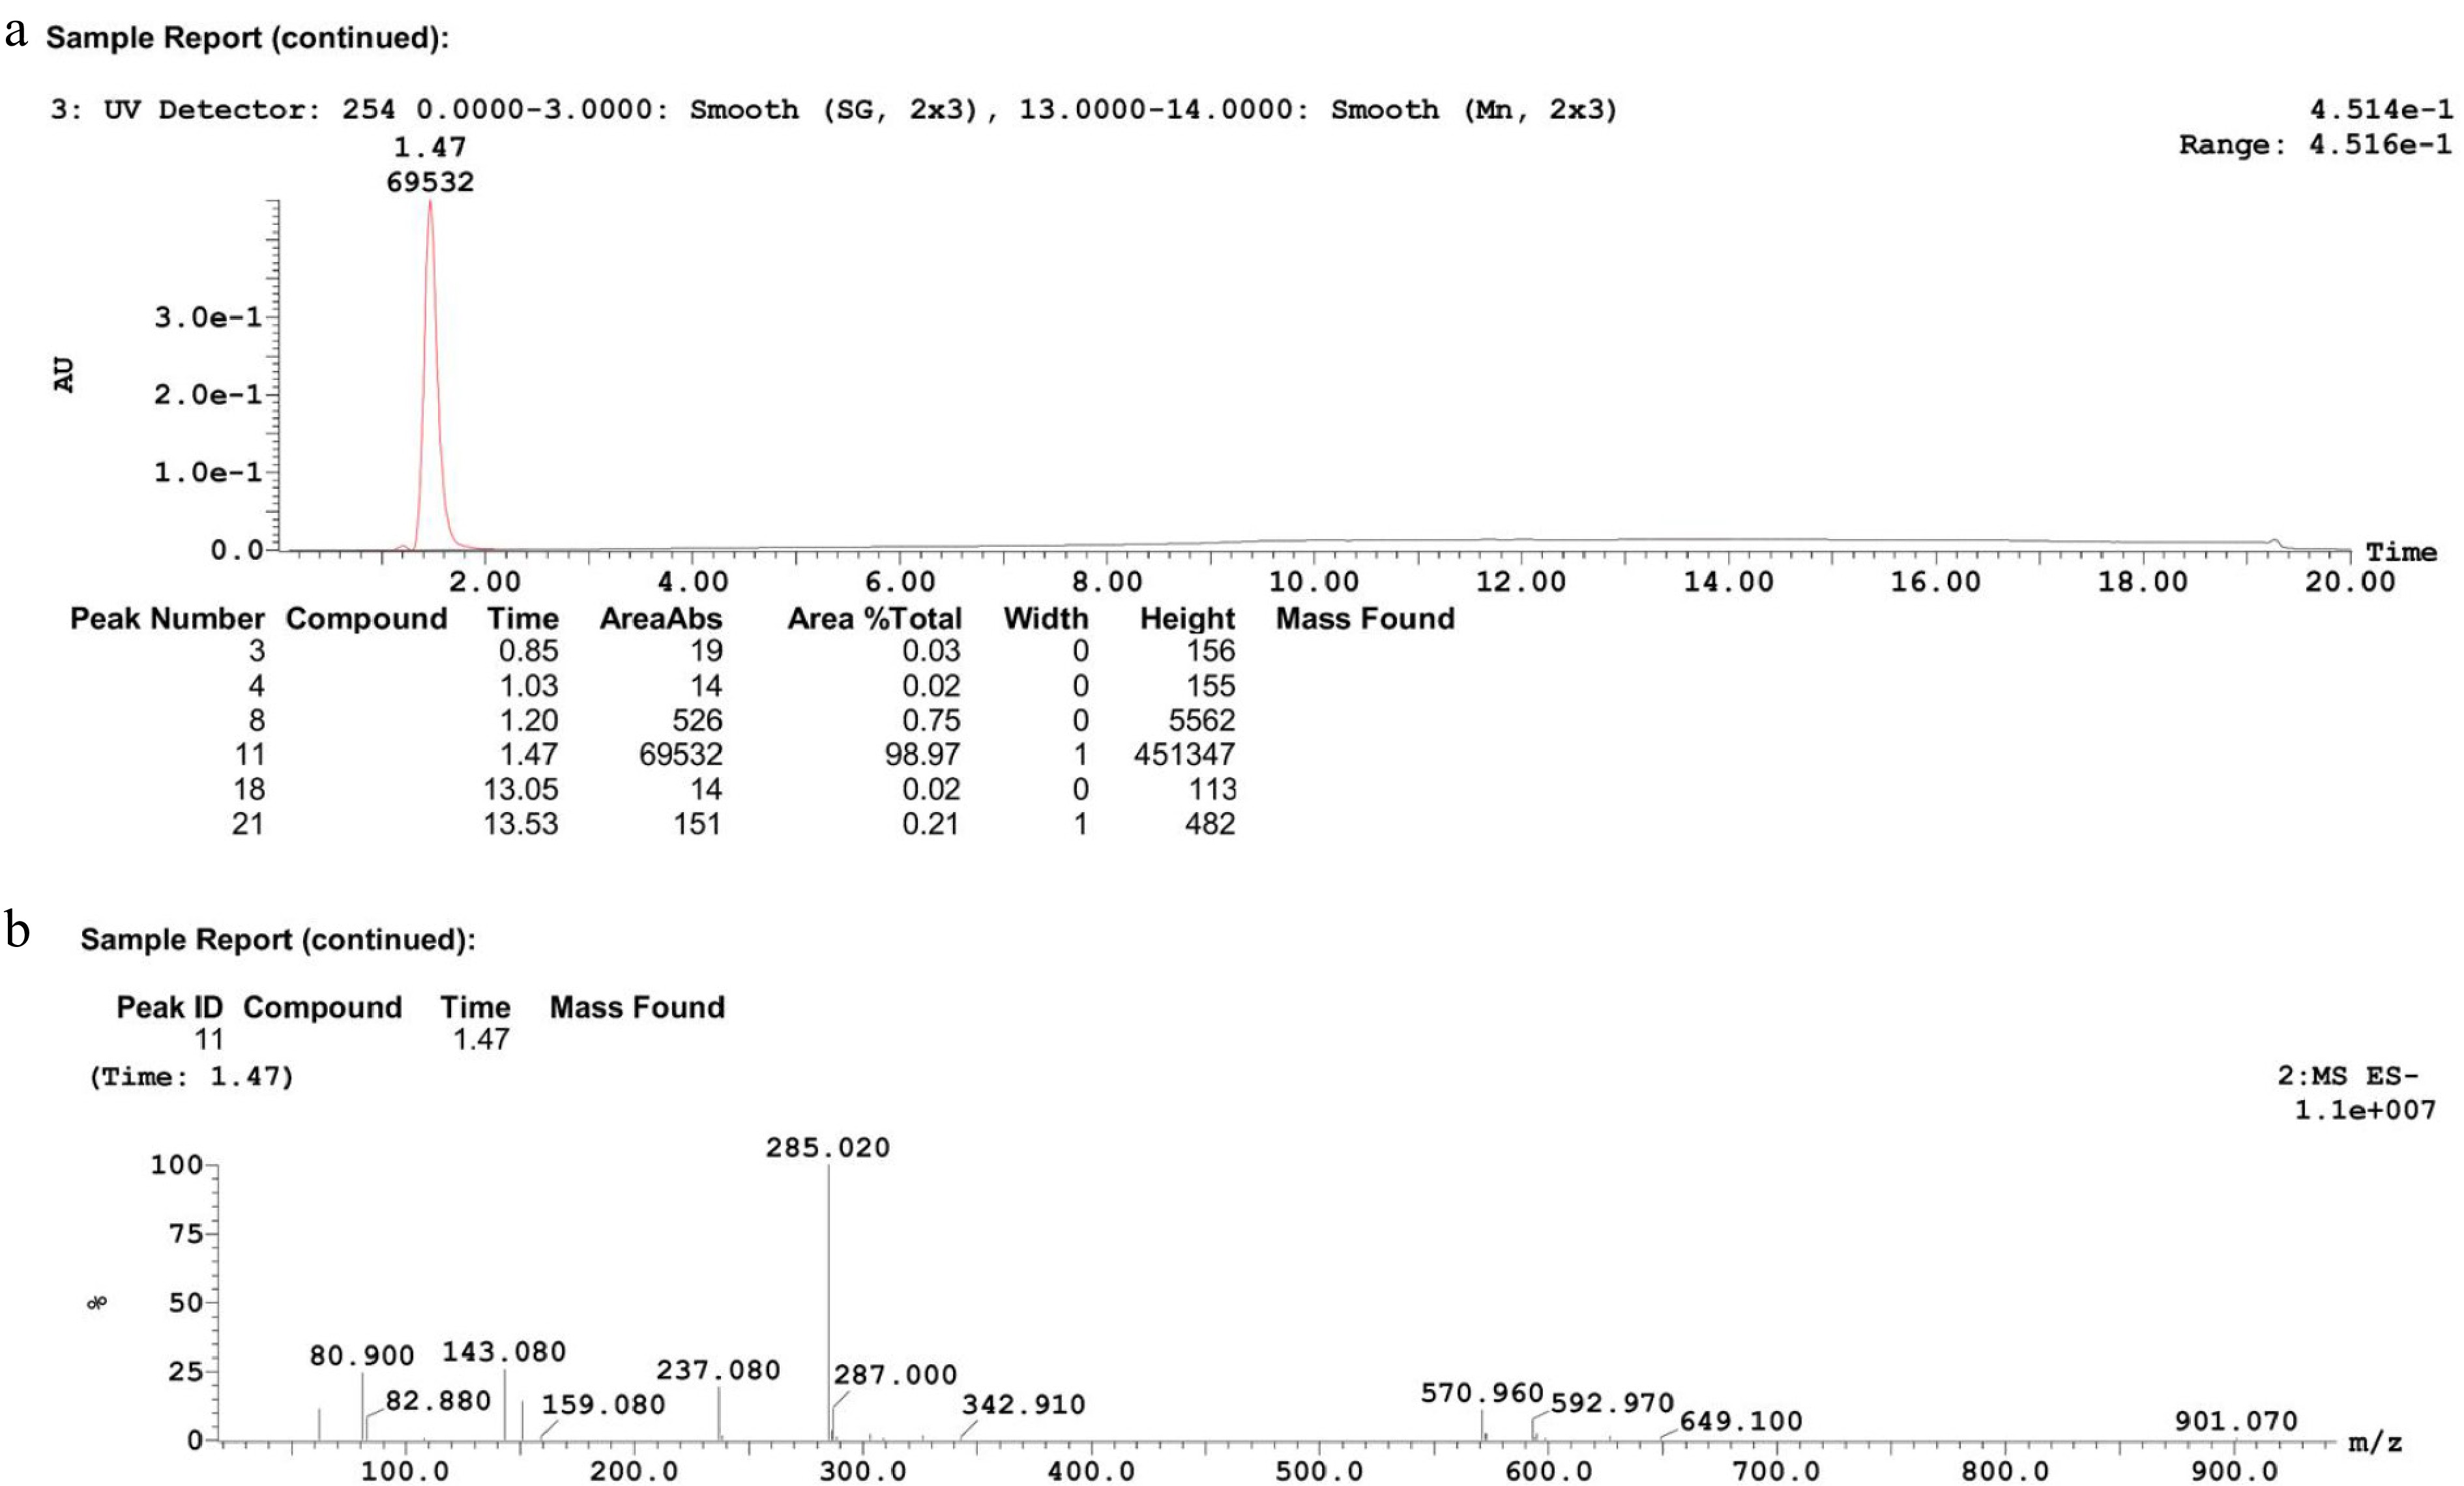
Figure 7.
Characterization of product after centrifugation. (a) HPLC chromatogram, (b) mass spectrum.
The mass spectrum (Fig. 7b) reveals a prominent peak at m/z = 285.02, which likely corresponds to the negatively charged ion peak (C10H7O6S2-) formed after the loss of two nitrogen atoms and one chlorine atom from the 2-ANDSA diazonium salt molecule during the ionization process. This data provides strong support for the identification of the target product.
Additional analysis of the mass spectrum's fragment ion peaks shows notable peaks at m/z = 80.900, 143.080, 237.080, and 287.000. These fragment ions correspond to the cleavage products of the reaction product, offering key insights into the molecular structure and reaction mechanism. The peak at m/z = 80.900 likely represents the elimination of the diazonium or sulfonic group, indicating the detachment of specific functional groups from the aromatic ring. The peak at m/z = 143.080 suggests cleavage of the aromatic ring structure, supporting the elimination of the diazonium group. The peak at m/z = 237.080 is associated with the fragmentation of the sulfonic group and the peak at m/z = 287.000 corresponds to the main ion peak of the target product, highlighting the stability of the sulfonic group and the aromatic ring.
Thus, it can be concluded that the primary product of the reaction is 2-ANDSA diazonium salt, with high purity.
Diazotization mechanism of 2-ANDSA
Reaction pathway analysis
-
In the diazotization reaction of 2-ANDSA, nitrous acid (HNO2) reacts with protons (H+) to generate the electrophilic species NO+. This reaction step is a critical initiation process in the reaction mechanism, and its reactivity is pivotal for the entire diazotization process.
In this section, the reaction mechanism between NO+ and 2-ANDSA will be primarily discussed, with Scheme 1 providing a clear illustration of each key step involved in this diazotization reaction. As with other aromatic diazotization pathways, the formation of NO+ and its influence on the electron cloud of the aromatic ring play a central role in this reaction.
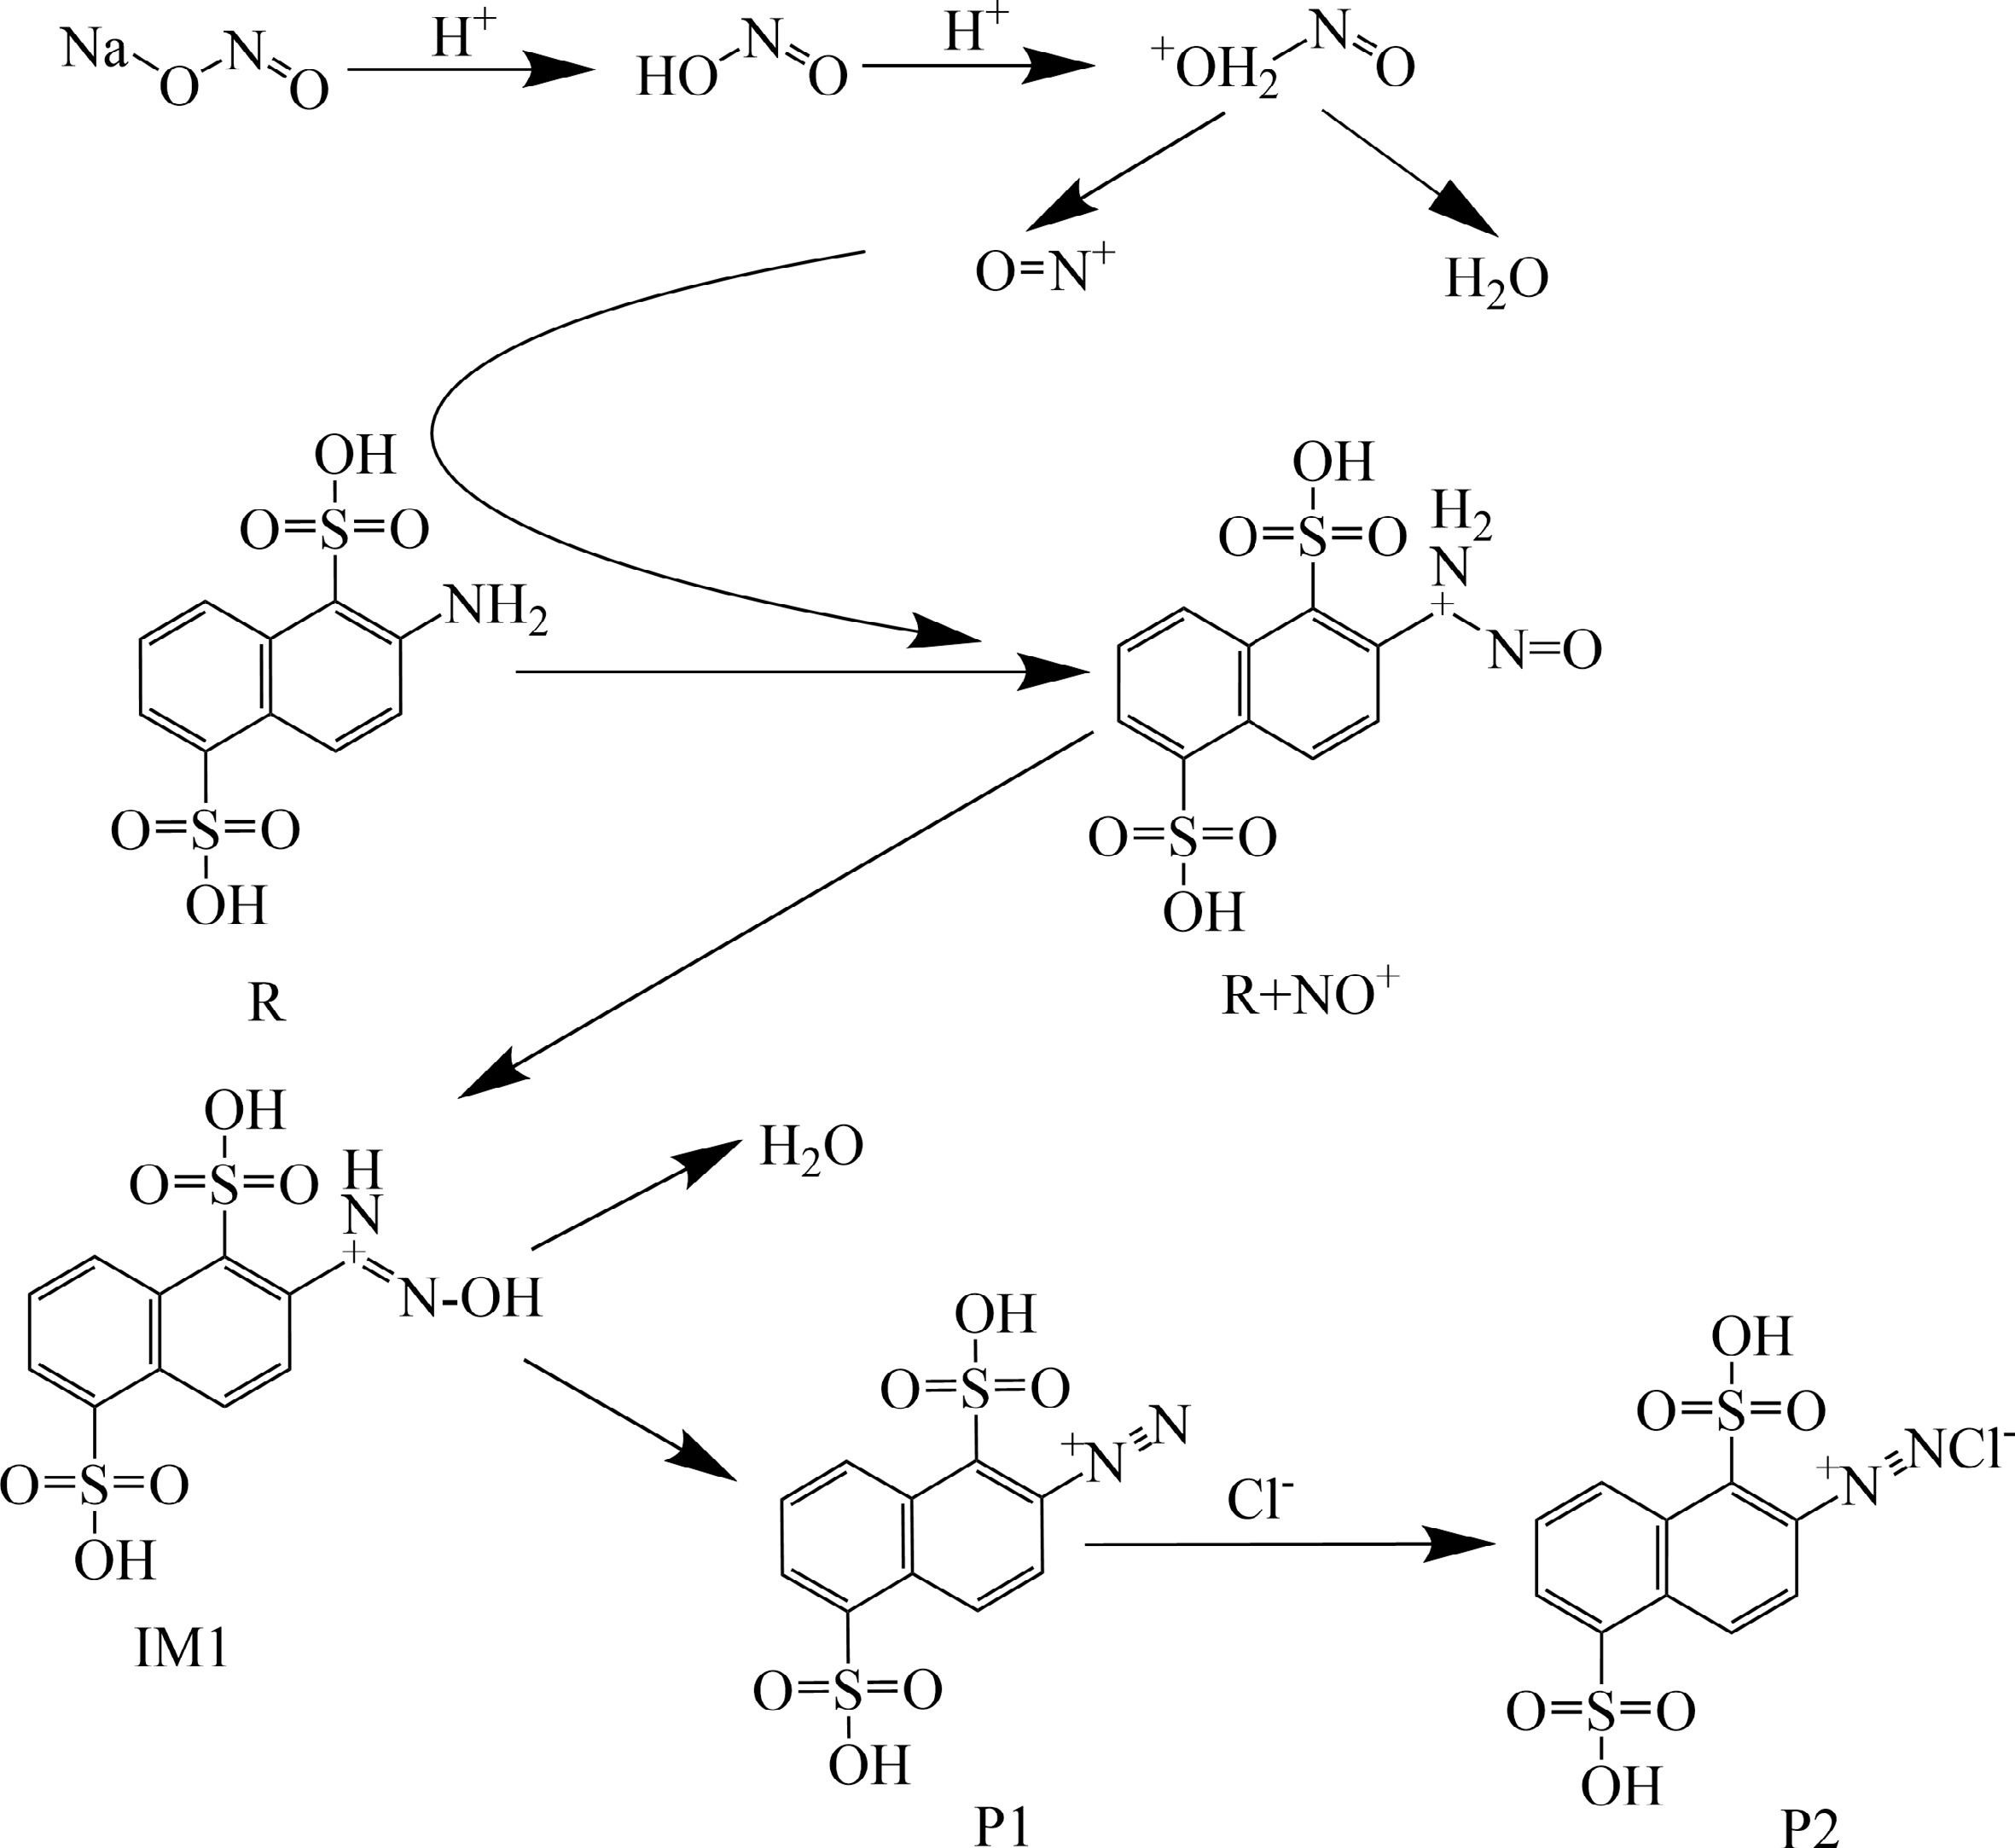
Figure 1.
Proposed reaction mechanism for the diazotization of 2-ANDSA.
In this process, NO+, as an electrophile, initially attacks the amino group (-NH2) of the 2-ANDSA molecule. The -NH2 group undergoes an electrophilic reaction with NO+, leading to the formation of a stable diazonium intermediate. This reaction is not only influenced by the electrophilic nature of NO+ but also by the significant impact of the acidic reaction medium. The acidic environment stabilizes the resulting diazonium intermediate and facilitates the formation of the aromatic diazonium salt.
The stability of the diazonium salt is crucial in this reaction system, and it is heavily influenced by the electronic effects of the sulfonic group (-SO3H). The -SO3H group exerts a strong electron-withdrawing effect, modifying the electron distribution in the aromatic ring and thereby preventing the premature decomposition of the diazonium salt.
This stabilization effect is essential not only for ensuring the smooth progression of the reaction at a controlled temperature but also for preventing thermal decomposition when the temperature is too high. By carefully managing the reaction temperature, thermal risks can be minimized, ensuring the stability of the diazonium salt and achieving a more efficient synthetic process.
Theoretical analysis of 2-ANDSA diazotization
-
The 2-ANDSA diazotization reaction pathway was examined in detail using Density Functional Theory (DFT)[27] within the Gaussian 16 quantum chemistry software. Calculations were carried out at the B3LYP/6-311 G (d, p) level of theory[28], with geometric optimizations and vibrational frequency analyses conducted for the reactants (R), transition states (TS), intermediates (IM), and products (P) involved in the reaction. The vibrational frequency analysis ensured that each transition state contained a single imaginary frequency, which was critical for confirming its validity. In addition, the Intrinsic Reaction Coordinate (IRC) method[29] was used to verify the minimum energy path for each reaction step and confirm the proper connection between the reactants, transition states, intermediates, and products.
For the calculation of thermodynamic parameters, single-point energy (SP) calculations were carried out at the M06-2X/def2-TZVPP level of theory[30], enhancing the accuracy of the computational results. Solvent effects were incorporated using the Self-consistent Reaction Field (SCRF) model, with the Solvation Model Based on Density (SMD)[31] applied to simulate the solvent's influence on the reaction.
Figure 8 demonstrates that the formation of the diazonium intermediate absorbs energy, transforming into transition state TS1. The conversion from the diazonium intermediate to TS1 requires the highest activation energy barrier (230.06 kJ/mol), making it the rate-determining step of the entire reaction. During this process, a hydrogen atom from the amino group dissociates, and the dissociated hydrogen atom bonds with the oxygen atom of the nitrosonium ion (NO+), forming intermediate IM1. IM1 then continues to absorb energy, transitioning into TS2. The transition from IM1 to TS2 involves bond formation and bond dissociation, requiring a high activation energy (248.0 kJ/mol). In this process, another hydrogen atom from the amino group and a hydroxyl group (-OH) dissociate, and the hydrogen atom forms a bond with the hydroxyl group (-OH), resulting in the diazonium salt cation (P1) and H2O. The diazonium salt cation (P1) then reacts with Cl− to form the final diazonium salt (P2).
Figure 8.
Energy profile for reaction steps 4–5.
The activation-free enthalpies and free energies for each step were computed using the Shermo program in combination with quantum chemistry calculations, and the results are presented in Table 6.
Table 6. Enthalpy and Gibbs free energy changes for each reaction step.
Reaction step ΔH (kJ/mol) ΔG (kJ/mol) (1) $ {\mathit{N}\mathit{a}\mathit{N}\mathit{O}}_{2}+\mathit{H}\mathit{C}\mathit{l}\to \mathit{N}\mathit{a}\mathit{C}\mathit{l}+{\mathit{H}\mathit{N}\mathit{O}}_{2} $ −35.74 −0.01 (2) $ {\mathit{H}\mathit{N}\mathit{O}}_{2}+\mathit{H}\mathit{C}\mathit{l}\to \mathit{N}\mathit{O}\mathit{C}\mathit{l}+{\mathit{H}}_{2}\mathit{O} $ −27.23 −32.55 (3) $ \mathit{N}\mathit{O}\mathit{C}\mathit{l}+{\mathit{C}}_{10}{\mathit{H}}_{9}\mathit{N}{\mathit{O}}_{6}{\mathit{S}}_{2}\to {\mathit{C}}_{10}{\mathit{H}}_{9}{\mathit{O}}_{7}{\mathit{S}}_{2}{\mathit{N}}_{2}^{+}+{\mathit{C}\mathit{l}}^{-} $ 147.79 154.82 (4) $ {\mathit{C}}_{10}{\mathit{H}}_{9}{\mathit{O}}_{7}{\mathit{S}}_{2}{\mathit{N}}_{2}^{+}\to {\mathit{C}}_{10}{\mathit{H}}_{9}{\mathit{O}}_{7}{\mathit{S}}_{2}{\mathit{N}}_{2}^{+} $
(structural rearrangement)79.28 88.78 (5) $ {\mathit{C}}_{10}{\mathit{H}}_{9}{\mathit{O}}_{7}{\mathit{S}}_{2}{\mathit{N}}_{2}^{+}\to {\mathit{C}}_{10}{\mathit{H}}_{7}{{\mathit{O}}_{6}\mathit{S}}_{2}{\mathit{N}}_{2}^{+}+{\mathit{H}}_{2}\mathit{O} $ −108.41 −152.66 (6) $ {\mathit{C}}_{10}{\mathit{H}}_{7}{\mathit{O}}_{6}{\mathit{S}}_{2}{\mathit{N}}_{2}^{+}+{\mathit{C}\mathit{l}}^{-}\to {\mathit{C}}_{10}{\mathit{H}}_{7}{\mathit{C}\mathit{l}\mathit{N}}_{2}{\mathit{O}}_{6}{\mathit{S}}_{2} $ −168.99 −137.27 According to the data presented in Table 6, by analyzing the enthalpy change ΔH and Gibbs free energy change ΔG of the reaction, it is concluded that the overall diazotization reaction is exothermic and generally thermodynamically spontaneous. Reactions 1 and 2 exhibit small enthalpy changes, and the heat released is insufficient to drive reactions 3 and 4. Although reactions 1 and 2 have negative ΔH values, indicating exothermic reactions, their ΔG values are near zero or slightly positive, indicating weak driving forces for subsequent reactions and suggesting the need for specific reaction conditions (such as temperature) to accelerate the reaction rate.
Reactions 3 and 4 show positive ΔH values, indicating endothermic reactions and the positive ΔG values suggest these reactions are non-spontaneous under normal conditions. Specifically, reaction 3 requires a high amount of energy, indicating it is the rate-determining step of the reaction process. This step typically necessitates additional energy input to overcome the energy barrier and, therefore, requires external conditions (e.g., high temperature or catalysts) to facilitate the reaction.
Further analysis reveals that reactions 5 and 6 are exothermic, with negative ΔH values, indicating heat release. Both reactions 5 and 6 have negative ΔG values, suggesting that they are spontaneous. The changes in Gibbs free energy indicate that reactions 5 and 6 provide a significant thermodynamic driving force in the diazotization process, offering the necessary heat to propel subsequent reactions.
The total enthalpy change for the entire diazotization reaction is calculated to be −113.29 kJ/mol by summing the ΔH values for all steps. When compared with the reaction heat enthalpies (ΔHr) for the Tr and Tj modes as described in Table 2 (Exp nos 15 and 17), which are 125.1 kJ/mol and 122.2 kJ/mol, respectively, the difference between the theoretical and experimental values is minimal, confirming the reliability of the theoretical data.
The residual discrepancy between the DFT-calculated and experimentally measured enthalpy changes may be attributed to several factors: the use of implicit solvation models (e.g., PCM or SMD), which fail to capture explicit solvent–solute interactions; limitations associated with the chosen basis set and exchange–correlation functional, potentially affecting the accuracy of thermochemical predictions; simplifications in thermodynamic corrections—such as zero-point energy and temperature-dependent heat capacity—which are inherently considered in experimental calorimetry but often approximated or omitted in quantum chemical calculations.
Despite these sources of uncertainty, the excellent agreement between the theoretical and calorimetric data highlights the robustness and reliability of the proposed reaction mechanism. This alignment further validates the integration of DFT modeling with experimental calorimetry as a predictive tool for thermal hazard assessment. The established 'Calorimetry–DFT–Risk Mapping' framework thereby offers a broadly applicable methodology for evaluating the criticality of high-risk aromatic diazotization systems under various process conditions.
Electrophilic site distribution of 2-ANDSA
-
Figure 9 presents the electrostatic potential (ESP) surface visualization for the optimized 2-ANDSA molecule. The blue regions in the image correspond to areas with negative electrostatic potential, reflecting a higher electron density and thus indicating electron-rich regions. Conversely, the red regions exhibit positive potential, indicating a lower electron density and representing electron-deficient areas. The white regions, where the potential is zero, reflect a relatively uniform electron density.
Figure 9.
ESP surface potential distribution of 2-ANDSA molecule.
In the 2-ANDSA molecule, the region containing the amino group (-NH2) shows a notably strong positive electrostatic potential, appearing in deep red, signifying an electron-deficient zone with substantial electrophilicity. On the other hand, the oxygen atom and neighboring carbon atoms of the sulfonic group display a notable negative potential. The steric hindrance from the hydroxyl group in the sulfonic moiety enhances the preferential electrophilic attack of reagents such as the nitrosonium ion (NO+) on the amino group of the aromatic ring.
A detailed analysis of the electrostatic potential map of the 2-ANDSA diazonium salt molecule identifies the extremum points, with the blue and orange spheres representing the local minima and maxima, respectively. These points and their precise values are highlighted for comparison.
It is clear that the maximum potential extremum is located near the amino group, suggesting a region with a significantly high positive charge density, which renders it a prime site for electrophilic attack. Moreover, the extremum points corresponding to the negative electrostatic potential are concentrated primarily on the nitrogen atom of the amino group, where the negative charge accumulation enhances the likelihood of electrophilic attack. Interestingly, the nitrogen atom located further behind the amino group exhibits a smaller negative potential, making it a highly reactive site for electrophilic reagents.
Kinetic calculations
-
Figure 10a presents the transition state structures for reaction steps 4 and 5, labeled as TS1 and TS2. Based on the TST (Transition State Theory) calculation results, the relationship between the reaction rate and temperature was further analyzed. Figure 10b displays the linear fitting results of the reaction rate constants as a function of 1/T under different temperature conditions. As illustrated, the reaction rate constants for reaction steps 4 and 5 exhibit different trends with increasing temperature. Specifically, in step 4, the reaction rate is more sensitive to temperature changes, suggesting that the activation energy for step 4 is relatively high (213.67 kJ/mol), and the rate increases significantly with temperature. This indicates that the reaction proceeds more slowly at higher temperatures but can be accelerated by increasing the temperature. In contrast, the activation energy for step 5 is relatively low (149.65 kJ/mol), and the reaction rate remains high even at lower temperatures. The rate change for step 5 is more stable, suggesting that this step can proceed effectively at low temperatures. This discrepancy reflects the varying temperature sensitivities of the different steps in the reaction mechanism. Specifically, the high activation energy for the formation of IM1 in step 4 is closely related to the high-energy transition state, which may contribute to the slower rate of this step in the reaction process. According to the kinetic constants summarized in the inset of Fig. 10b, the A factor in the Arrhenius equation for step 4 is 26.20 s−1, while for step 5, it is 29.40 s−1, indicating that step 5 has a higher reaction frequency and is more likely to occur. These results further support the trend that the reaction rate for step 4 increases significantly with temperature.
Figure 10.
(a) Transition states (TS1 and TS2) in diazotization. (b) Linear relationship of ink vs 1/T for each elementary reaction.
Process safety evaluation
-
In order to comprehensively evaluate the potential thermal risks in the synthesis of 2-ANDSA diazonium salt, a systematic analysis was performed using both the Risk Matrix Method and the Stoessel Criticality Diagram Method. These methods assessed the likelihood and consequences of thermal runaway during the reaction process. The optimal process from Table 1 (Exp no. 15) was selected as the basis for thermal risk analysis.
The thermal risk level of the reaction process was assessed using the Risk Matrix Method[32]. According to the data presented in Table 7, the adiabatic temperature rise ΔTad of the reaction is 25.22 K, which represents the change in temperature during the reaction. This temperature rise, in combination with the reaction severity (Severity) and the time to maximum adiabatic temperature rise TMRad, further determines the risk level. As shown in Table 7, the TMRad is greater than 24 h, and the occurrence frequency is categorized as 'Seldom', indicating that the thermal risk under normal operating conditions is within an acceptable range.
Table 7. Risk matrix for 2-ANDSA diazotization.
ΔTad (K) Severity TMRad (h) Possibility Class Thermal hazard
assessment25.22 1 > 24 Seldom 1 acceptable risk Based on these data, it can be concluded that both the heat release rate and the temperature increase during the reaction process remain controllable under normal operating conditions, making the risk of thermal runaway very low. Since the heat release during the reaction is well-controlled, the thermal hazard risk assessment is rated as level 1, which falls under the category of 'acceptable risk'. This suggests that operators have sufficient time to take emergency measures in case of abnormal conditions, effectively preventing thermal runaway incidents.
To further verify the thermal safety of the reaction process, the Stoessel Criticality Diagram Method was also used[33]. This method helps to assess the temperature behavior of the reaction system under extreme conditions. Based on the calculations shown in Table 8, the boiling point of water was chosen as the Maximum Temperature (MTT) for the reaction process. The results show that even under the most extreme conditions, the temperature of the reaction system will not exceed the MTT, thus avoiding potential severe thermal runaway.
Table 8. Stoessel diagram for 2-ANDSA diazotization.
Tp (°C) MTSR MTT (°C) TD24 (°C) Class 10 14.18 100 46.93 2 According to the Stoessel critical diagram, the temperature of the reaction system will fluctuate within the range of Tp < MTSR < TD24 < MTT, indicating that even in the event of thermal runaway, the system's temperature will remain within the MTT range and will not rise rapidly to levels that could lead to more dangerous situations, such as splashing. Therefore, the thermal runaway risk of the reaction process is classified as level 2, indicating that the process has a high degree of thermal safety. The minor discrepancy between the two risk classifications (level 1 vs level 2) originates from their distinct methodological emphases: the Risk Matrix method prioritizes operational hazard probability and consequence assessment under realistic process conditions, whereas the Stoessel Criticality Diagram focuses specifically on intrinsic thermal characteristics and clearly defined thermal runaway boundaries under adiabatic or near-adiabatic scenarios. Integrating these complementary approaches yields a more comprehensive, multi-dimensional assessment of thermal risk.
Through the combined evaluation using the Risk Matrix Method and Stoessel Criticality Diagram Method, the synthesis of the diazonium salt process was determined to have a low risk of thermal runaway and is controllable under the current operational conditions. However, to further ensure the stability and safety of the reaction process, the following improvements are recommended: first, the implementation of a more efficient temperature control system to ensure that the reaction temperature remains within a safe range; second, regular inspection and maintenance of the equipment to ensure its stable operation; and third, the installation of an efficient cooling system and emergency discharge devices to address safety risks under extreme conditions, further reducing the potential thermal hazard risk.
-
The reaction mechanism and thermal risk associated with synthesizing 2-aminonaphthalene-1,5-disulfonic acid (2-ANDSA) diazonium salt were systematically explored utilizing advanced thermal analytical techniques, including EasyMax 102, differential scanning calorimetry (DSC), and accelerating rate calorimetry (ARC), complemented by liquid chromatography analysis, mass spectrometry (MS) characterization, and theoretical computational modeling. The principal findings are summarized as follows: After thorough optimization of critical process parameters, the optimal synthesis conditions identified were: reaction temperature (Tr mode) of 10 °C, reagent addition rate of 0.15 mL/min, molar ratios of n(HCl) : n(2-ANDSA) = 2.4 and n(NaNO2) : n(2-ANDSA) = 1, and a stirring rate set at 400 rpm, yielding a diazonium salt purity of 97.02%. Thermal analysis demonstrated that the decomposition onset temperature of the synthesized 2-ANDSA diazonium salt was approximately 72.95 °C, accompanied by a decomposition enthalpy of 136.81 J/g, an adiabatic temperature rise reaching 27.76 K, and an activation energy determined to be 144.21 kJ/mol. It was further revealed that elevated reaction temperatures, increased reagent addition rates, and reduced solvent-to-2-ANDSA ratios notably enhanced the potential for thermal runaway scenarios. A comprehensive reaction mechanism for the diazotization of 2-ANDSA was proposed based on experimental and theoretical insights. Density functional theory (DFT) calculations revealed that the amino functionality of the 2-ANDSA molecule represents the most favorable site for electrophilic attack by nitrosonium ions (NO+). Subsequent kinetic simulations further verified the profound influence of temperature on the reaction kinetics. The thermal runaway risk was rigorously evaluated using both risk matrix analysis and Stoessel's criticality diagram approach, demonstrating that the associated process hazards are controllable under current optimized conditions. Specifically, maintaining the reaction temperature below 15 °C and controlling the NaNO2 feed rate below 0.20 mL/min are recommended to avoid exceeding the Maximum Temperature of the Synthesis Reaction (MTSR) and triggering secondary decomposition. Looking forward, the integrated 'Calorimetry–DFT–Risk Mapping' framework developed in this study holds significant potential for broader application. Specifically, it may serve as a transferable tool for the design and safety assessment of continuous flow diazotization processes, where enhanced heat and mass transfer could further mitigate thermal hazards. Additionally, this methodology can be extended to investigate other high-risk aryl diazonium systems, thereby facilitating predictive thermal hazard screening and intrinsic safety optimization across a wider range of industrial applications.
This work was supported by the National Natural Science Foundation of China (Grant Nos 52274209, 52334006), the Jiangsu Qing Lan Project, and the Jiangsu Association for Science and Technology Youth Talent Support Program.
-
The authors confirm their contribution to the paper as follows: study conception and design: Lu Z, Jiang J; data collection: Lu Z, Fang X; analysis and interpretation of results: Lu Z, Xu F; draft manuscript preparation: Lu Z, Yao H. All authors reviewed the results and approved the final version of the manuscript.
-
All data generated or analyzed during this study are included in this published article and its supplementary information files. Additional raw datasets supporting the findings of this study are available from the corresponding author upon reasonable request.
-
The authors declare that they have no conflict of interest.
- Copyright: © 2025 by the author(s). Published by Maximum Academic Press on behalf of Nanjing Tech University. This article is an open access article distributed under Creative Commons Attribution License (CC BY 4.0), visit https://creativecommons.org/licenses/by/4.0/.
-
About this article
Cite this article
Lu Z, Fang X, Xu F, Yao H, Jiang J. 2025. Reaction mechanism and thermal hazard assessment of diazotization for 2-aminonaphthalene-1,5-disulfonic acid (2-ANDSA). Emergency Management Science and Technology 5: e012 doi: 10.48130/emst-0025-0010 

Reaction mechanism and thermal hazard assessment of diazotization for 2-aminonaphthalene-1,5-disulfonic acid (2-ANDSA)
- Received: 07 May 2025
- Revised: 22 May 2025
- Accepted: 26 May 2025
- Published online: 30 June 2025
Abstract: This research comprehensively addresses the significant exothermic behavior and the associated thermal runaway risks in the semi-batch preparation of 2-aminonaphthalene-1,5-disulfonic acid (2-ANDSA) diazonium salt. By employing various thermal analysis techniques, including reaction calorimetry, differential scanning calorimetry (DSC), and accelerating rate calorimetry (ARC), the influences of reaction temperature and reagent feeding rates on product purity and thermal safety were systematically examined. The findings demonstrate that increased reaction temperatures accelerated reagent addition rates, and lowered solvent-to-reactant ratios markedly elevated the likelihood of thermal runaway incidents. Complementary density functional theory (DFT) calculations elucidated the detailed reaction mechanism, highlighted critical intermediate species, and clarified their thermodynamic profiles, thereby providing deeper insights into the thermal decomposition mechanism of the diazonium salt. Additionally, the combined application of the Risk Matrix and Stoessel Criticality Diagram methods facilitated a comprehensive thermal runaway risk assessment and identification of key operational safety parameters for process scale-up. These findings serve as a robust theoretical foundation and practical reference for effective thermal hazard management and safe production practices in processes involving high-risk aromatic diazonium salts.