


-
Apple puree accounts for the second largest market of fruit puree, with a global market value of about 2,000 million USD annually[1]. It is used as the basic ingredient of jams, preserves or compotes, which are popular among people of all ages, especially for babies and elders[2]. According to previous work, a large diversity of apple cultivars[3] and processing conditions (cooking parameters, grinding intensity and refining levels, etc.)[4−6] can introduce strong chemical, textural and rheological variations on processed purees. However, the current puree processing systems are not always adapted and optimized to the raw apples but meet the required constant quality standards of final products. Further, the increasing demands of various anticipated products for current consumers have put much stress on the development of personalized puree products from industrial manufacturers. Therefore, it would be highly beneficial to develop innovative puree production strategies, that can consider a large variability of raw materials and provide new solutions to reach the anticipated and constant taste and texture of purees.
Puree formulation is one of the most economical and efficient strategies for manufacturers to adjust the texture and taste of final puree products depending on a mixture of different proportions of single apple varieties[7]. However, fruit manufacturers do not often have the access to good choices to determine how to formulate puree products with large variability of raw materials. The challenge is therefore to develop innovative strategies to provide specific guidance for the formulation of final puree products based on the information of single cultivar puree, to reach their anticipated and constant taste and texture.
Visible and near-infrared (Vis-NIR) spectroscopy has been applied as a simple and rapid technique to give considerable predictions of chemical, physical and textural properties of raw apples[8−10] and processed puree[5,11−13]. In our previous work, a spectral reconstruction strategy based on the concentration profile of multivariate curve resolution-alternative least squares (MCR-ALS) was first developed[13]. Based on that, the mid-infrared (MIR) spectra of single-cultivar apple purees can be used to reconstruct the spectra of differently formulated purees, then the multivariate regression models using the reconstructed spectra of formulated purees can successfully predict their quality characteristics (soluble sugars, titratable acidity, pH and viscosity, etc.)[13]. However, this strategy was not available to reconstruct the Vis-NIR spectra of formulated purees from their corresponding spectra of single-cultivar purees, because of the unacceptable concertation profiles of MCR-ALS. One possible reason could be the large sets of spectral variables that were strongly collinear and noisy, which may affect the success of spectral reconstruction.
To partly compensate for these effects, spectral variable selection is an important approach, as it tends to parsimonious data representation and can result in multivariate models with greater predictive ability[14]. Particularly, several spectral variable selection methods, such as competitive adaptive reweighted sampling (CARS)[15], successive projections algorithm (SPA)[16], and uninformative variable elimination (UVE)[17], can significantly improve the Vis-NIR prediction accuracy. The challenging work here was to reconstruct the spectra of final formulated purees according to the most relative Vis-NIR spectral variables of single cultivar apple purees by MCR-ALS. Then, the predictive models of formulated puree quality traits (physical and chemical) using the reconstructed spectra dataset could predict the properties of formulated puree products based on the relative Vis-NIR spectra of composed single-cultivar purees. If so, this new strategy opens a new possibility to provide practical and suitable strategies for the multicriteria optimization of puree formulation with anticipated and constant quality.
This study intended to develop a smart food formulation model based on the rapid and high-throughput spectral information of their individual composed components, which could provide various formulation guidance and monitor their quality parameters of final products. To reach this objective, Vis-NIR technique coupled with spectral variable selection methods (CARS, SPA, UVE) were applied both on the different formulated purees and their corresponding single-cultivar purees to highlight their featured spectral variables; then the selected spectra variables of single-cultivar purees to reconstruct spectra of formulated purees; and finally investigated the possibility to develop regression models to evaluate the quality parameters of final formulated purees.
-
The experiment was conducted on four apple varieties: 'Golden Delicious'(GD), 'Granny Smith'(GS), 'Braeburn'(BR), and 'Royal Gala'(GA). They were harvested at commercial maturity from La Pugère experimental orchard (Mallemort, Bouches du Rhône, France) in 2019, and stored at 4 °C and around 90% relative humidity for up to 2 months to ensure starch regression. A multi-functional processing system (Roboqbo, Qb8-3, Bentivoglio, Italy) was used to process apple purees following a Hot Break recipe: cooked at 95 °C for 5 min at a 1,500 rpm grinding speed, then cooled down to 65 °C while maintaining the grinding speed. During three successive weeks, around 2 kg of each apple cultivar was processed into single-cultivar purees, then conditioned in two hermetically sealed cans: one was cooled in a cold room (4 °C) before formulation, while the other was stored at –20 °C for biochemical measurement of individual sugars (fructose, sucrose, and glucose) and malic acid.
Puree formulation
-
After puree processing, the four single cultivar purees were formulated by two of each of them, into six different experimental groups named 'A' (GS × GS), 'B' (GD × BR), 'C' (GD × GA), 'D' (GS × BR), 'E' (GS × GA) and 'F' (BR × GA), respectively (Fig. 1). Each experimental group (A−F) included nine samples with different formulated proportions of weight, which were divided into two subsets: the first included six proportions (10%:90%, 25%:75%, 50%:50%, 75%:25%, 90%:10%, 95%:5%) for the modeling set, while the second included three proportions (80%:20%, 33%:67%, 14%:86%) for the external prediction set. Finally, all the single and formulated purees were prepared for both the Vis-NIR spectral measurements and quality characterizations.
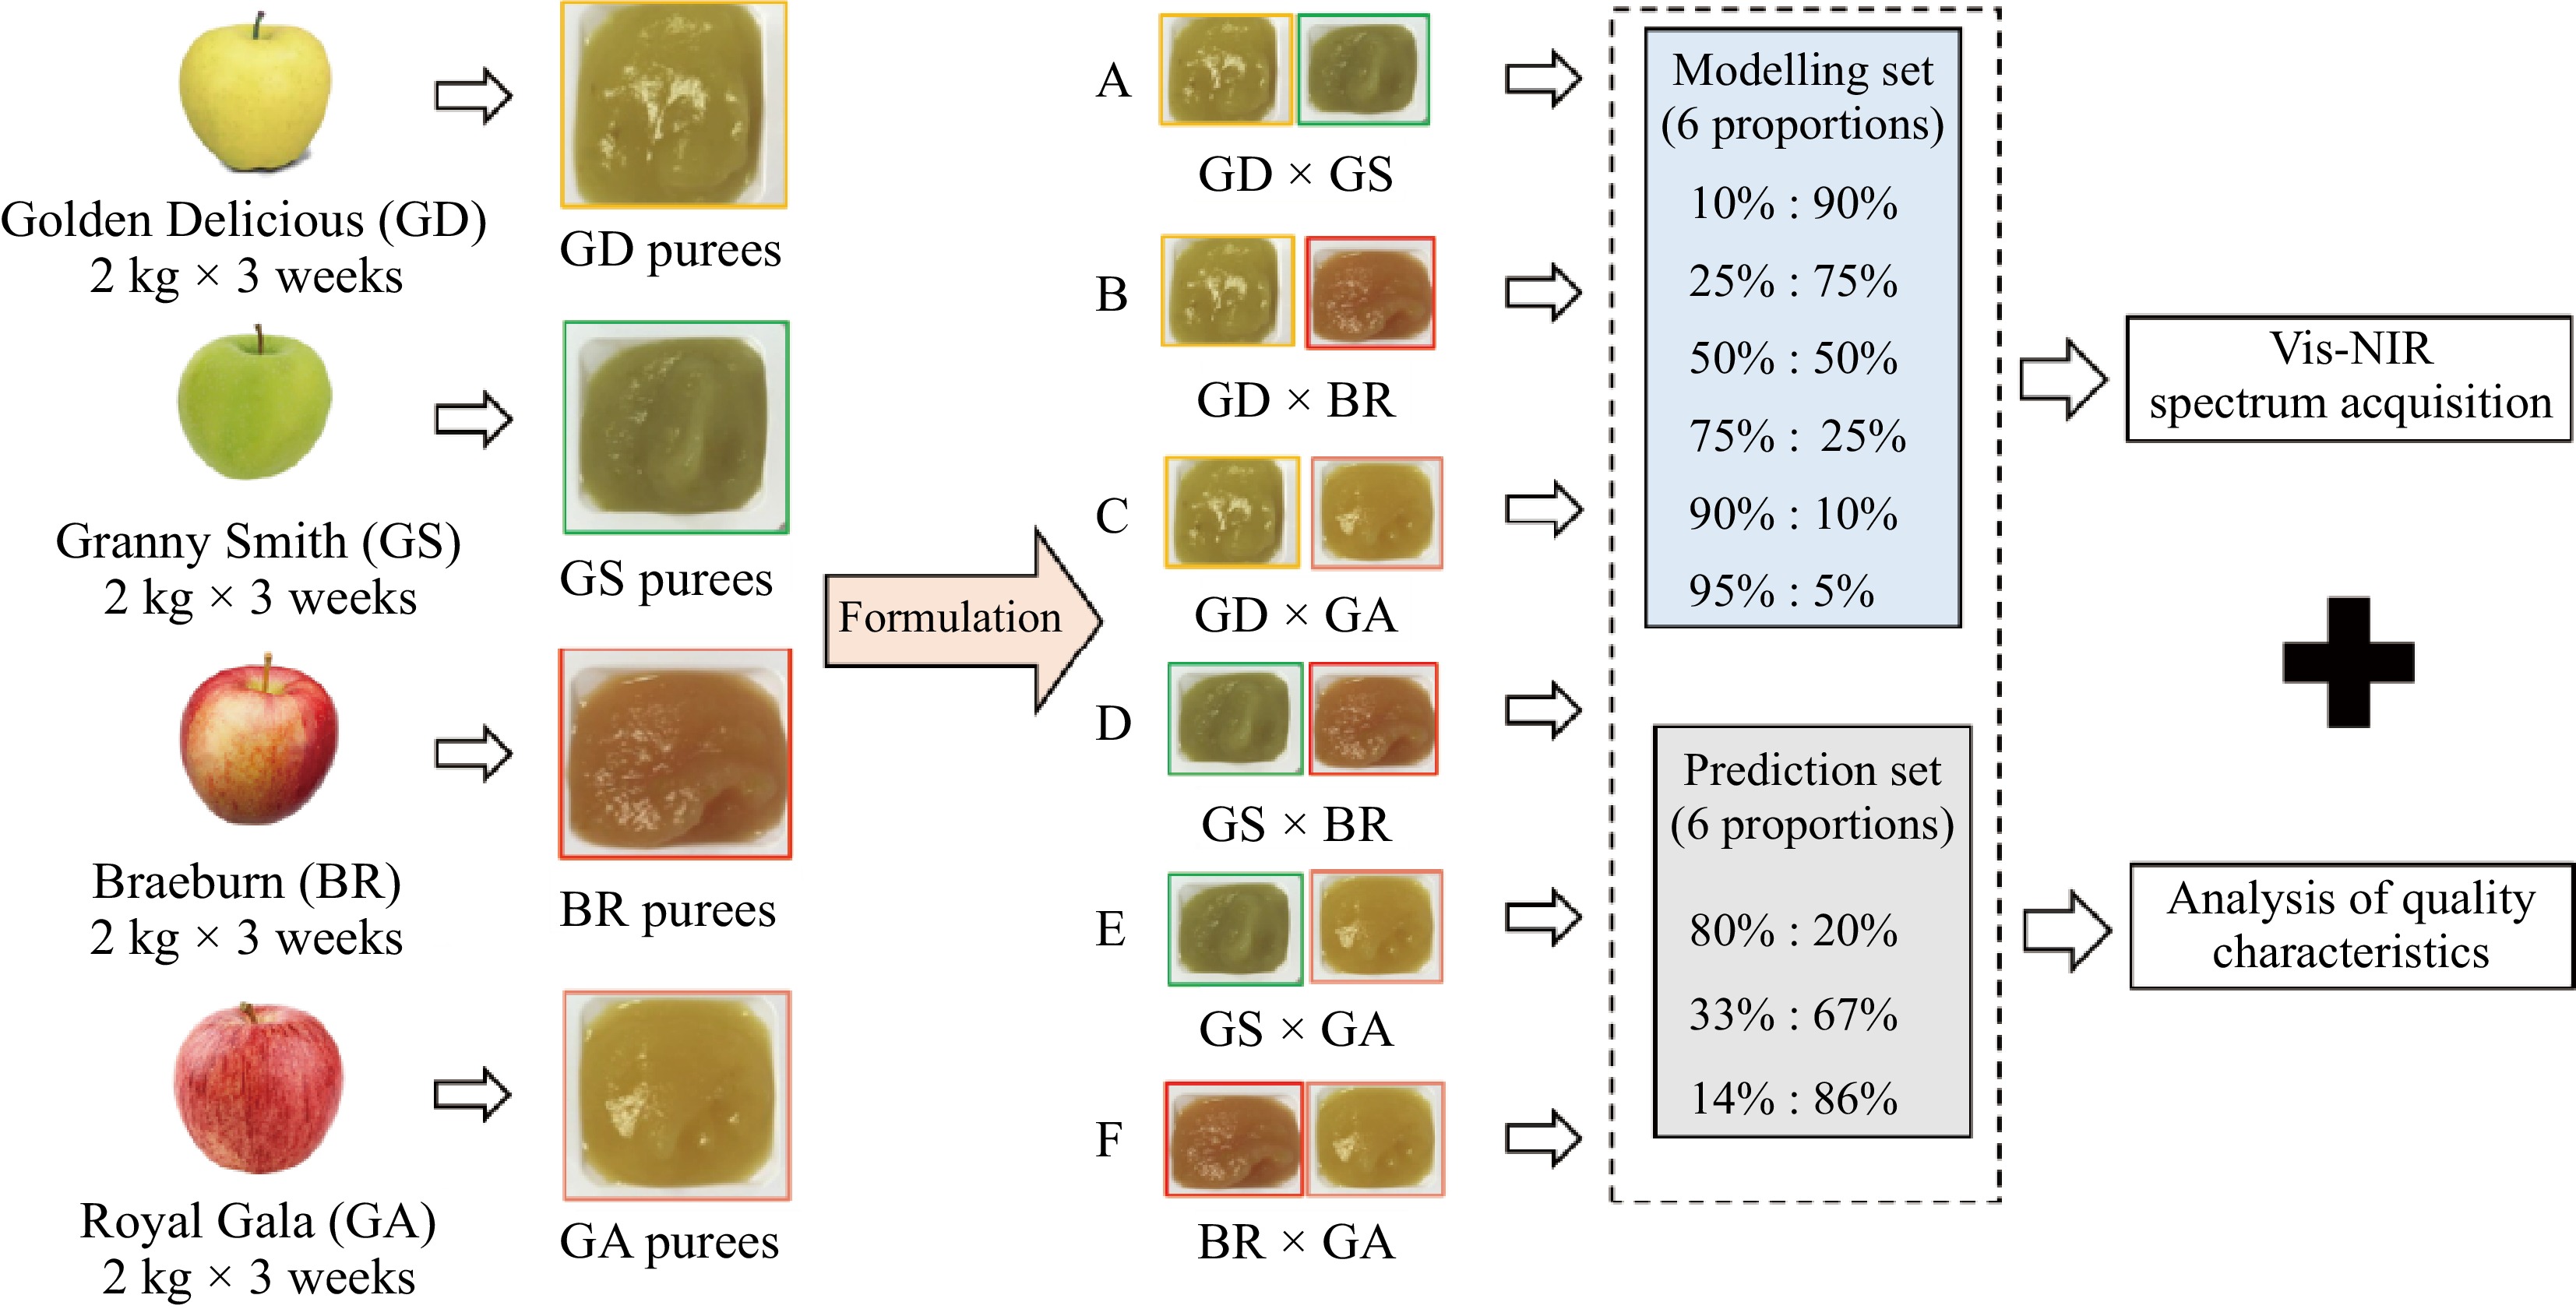
Figure 1.
Experimental scheme of puree reformation, quality characterizations, and spectral acquisition.
Determination of puree quality traits
Physical characterizations
-
The puree color was determined three times using a CR-400 chromameter (Minolta, Osaka, Japan) and expressed in the CIE 1976 L*a*b* color space (illuminant D65, 0° view angle, illumination area diameter 8 mm). Puree rheological measurements were carried out using a Physica MCR-301 controlled stress rheometer (Anton Paar, Graz, Austria) and a 6-vane geometry (FL100/6W) with a gap of 3.46 mm, at 22.5 °C. The flow curves were performed after a pre-shearing period of 1 min at a shear rate of 50 s−1, followed by 5 min at rest. The viscosity was then measured at a controlled shear rate range of [10; 250] s−1 on a logarithmic ramp. The values of viscosity at 50 and 100 s−1 (η50 and η100 respectively) were kept as final indicators of the puree viscosity linked to sensory characteristics during consumption[18].
Biochemical characterizations
-
The dry matter content (DMC) was estimated from the weight of freeze-dried samples upon reaching a constant weight (freeze-drier, 5 d). Titratable acidity (TA) was determined by titration up to pH 8.1 with 0.1 mol/L NaOH and expressed in mmol H+ kg−1 of fresh weight (FW) using an autotitrator (Methrom, Herisau, Switzerland). Individual sugars and malic acid were quantified using colorimetric enzymatic kits (R-biopharm, Darmstadt, Germany), respectively. The contents of glucose, fructose, sucrose, and malic acid were expressed in g kg−1 FW. The total sugar content (TSC) of each puree sample was presented as the sum of characterized glucose, sucrose and fructose. The individual sugars (fructose, glucose, sucrose) and malic acid contents of formulated puree samples were calculated based on the measured values of processed single cultivar purees.
Spectrum acquisition
-
A multi-purpose analyzer spectrometer (Bruker Optics®, Wissembourg, France) with OPUS software Version 5.0 (Bruker Optics®) was used to acquire the Vis-NIR spectral data of purees at 23 °C, which can provide diffuse reflectance measurements with a spectral resolution of 8 cm-1 from 500 to 2,500 nm. Totally 32 scans were recorded and averaged for each spectrum of purees. Purees were transferred into 10 mL glass vials (5 cm height × 18 mm diameter) which were placed on the automated sample wheel of the spectrophotometer. A reference background measurement was automatically activated before each data set acquisition using an internal Spectral on reference. Each puree sample was measured three times on different aliquots. Totally, 36 spectra of single-cultivar purees (4 cultivars × 3 testing weeks × 3 replicates) and 486 spectra of their formulated purees (6 experimental groups × 9 formulated proportions × 3 testing weeks × 3 replicates) (Fig. 1).
Statistical analyses and chemometrics
Statistical analyses of reference data
-
After checking the normal distribution with a Shapiro-Wilk test (α = 0.05), the reference data of processed purees were presented as mean values and standard deviation values (SD) in Tables 1 & 2. Analysis of variance (ANOVA) and Pearson correlation analysis were carried out to determine the significant differences and internal correlations of puree quality traits of the different single apple cultivars and formulated puree groups using XLSTAT (version 2018.5.52037, Addinsoft SARL, Paris, France) data analysis toolbox, which was described in our previous work[13]. The physical (a* and b* values), rheological (viscosity η50), and biochemical (SSC, TA, and fructose) parameters of formulated purees were displayed in the boxplots using R software (version 2.6.2)[19] (Fig. 2).
Table 1. PLS prediction of physical, chemical and rheological parameters of all formulated purees using Vis-NIR (500–2,500 nm) spectra or their selected spectral variables based on SPA, CARS and UVE methods.
Parameters Range SD Methods Variables PLSR $\rm R_c^2 $ RMSEC $\rm R_p^2 $ RMSEP RPD L* 41.6−48.9 1.5 FULL 2,722 0.87 0.6 0.73 0.7 1.76 SPA 6 0.83 0.6 0.81 0.6 2.13 CARS 51 0.87 0.6 0.81 0.6 2.14 UVE 1,259 0.88 0.5 0.80 0.6 2.06 a* (−4.8)−2.4 2.0 FULL 2,722 0.98 0.3 0.96 0.4 5.17 SPA 6 0.98 0.3 0.96 0.4 5.24 CARS 33 0.98 0.3 0.97 0.3 5.56 UVE 1,596 0.98 0.3 0.97 0.4 5.38 b* 9.6−18.4 1.7 FULL 2,722 0.71 0.9 0.54 1.2 1.48 SPA 7 0.73 0.9 0.58 1.2 1.54 CARS 143 0.75 0.8 0.57 1.2 1.53 UVE 997 0.75 0.8 0.59 1.2 1.55 Viscosity η100 834−1,721 210 FULL 2,722 0.83 84.6 0.79 98.2 2.17 SPA 9 0.79 95.5 0.82 92.4 2.30 CARS 44 0.84 83.3 0.82 91.2 2.33 UVE 1,193 0.87 76.0 0.85 85.4 2.49 Viscosity η50 526−1,029 119 FULL 2,722 0.88 40.2 0.83 50.8 2.38 SPA 11 0.82 49.0 0.82 51.5 2.35 CARS 166 0.86 43.6 0.85 47.1 2.57 UVE 1,133 0.88 40.9 0.87 44.5 2.73 DMC (g/g FW) 0.14−0.17 0.01 FULL 2,722 0.74 0.004 0.49 0.006 1.39 SPA 9 0.56 0.006 0.50 0.006 1.42 CARS 92 0.75 0.004 0.58 0.005 1.56 UVE 1,497 0.80 0.004 0.63 0.005 1.66 TSC (g/kg FW) 93.2−145.4 12.6 FULL 2,722 0.96 2.7 0.90 3.6 3.57 SPA 9 0.96 2.8 0.92 3.6 3.53 CARS 101 0.97 2.7 0.92 3.5 3.66 UVE 1,531 0.96 2.7 0.92 3.6 3.63 TA (meq/kg FW) 28.0−94.8 16.2 FULL 2,722 0.96 0.3 0.91 0.5 3.31 SPA 10 0.94 0.4 0.90 0.5 3.12 CARS 92 0.96 0.3 0.91 0.5 3.37 UVE 1061 0.96 0.3 0.91 0.5 3.34 pH 3.39−4.47 0.23 FULL 2722 0.90 0.07 0.86 0.09 2.57 SPA 8 0.69 0.13 0.69 0.14 1.76 CARS 51 0.88 0.08 0.88 0.09 2.69 UVE 1,385 0.88 0.08 0.87 0.09 2.73 Glucose (g/kg FW) 13.2−28.3 3.7 FULL 2,722 0.86 1.2 0.85 1.3 2.42 SPA 5 0.85 1.3 0.84 1.4 2.51 CARS 38 0.87 1.1 0.86 1.3 2.58 UVE 1,181 0.86 1.2 0.85 1.3 2.54 Fructose (g/kg FW) 40.2−80.3 9.1 FULL 2,722 0.71 4.9 0.54 6.0 1.46 SPA 12 0.59 5.8 0.57 6.2 1.42 CARS 92 0.64 5.5 0.61 5.5 1.61 UVE 1,235 0.63 5.6 0.61 5.5 1.61 Sucrose (g/kg FW) 33.2−57.3 5.5 FULL 2,722 0.74 2.8 0.66 3.1 1.72 SPA 16 0.67 3.2 0.64 3.2 1.65 CARS 92 0.73 2.9 0.63 3.3 1.61 UVE 1,279 0.67 3.2 0.64 3.4 1.60 Malic acid (g/kg FW) 3.0−8.8 1.3 FULL 2,722 0.93 0.3 0.91 0.4 3.33 SPA 20 0.91 0.4 0.90 0.4 3.16 CARS 92 0.92 0.4 0.91 0.4 3.34 UVE 952 0.92 0.4 0.92 0.4 3.36 $\rm R_c^2 $: determination coefficient of the calibration test; $\rm R_p^2 $: determination coefficient of the external prediction test; RMSEP: root mean square error of prediction test; RPD: the residual predictive deviation of the prediction test. Table 2. Prediction results of chemical and rheological parameters of all formulated purees from the reconstructed spectra computed by the concentration of MCR-ALS and the selected spectral variables of single-cultivar purees.
Parameters Range SD LVs PLSR $\rm R_c^2 $ RMSEC $\rm R_p^2 $ RMSEP RPD L* 41.6−48.9 1.5 10 0.77 0.7 0.62 0.8 1.57 a* (−4.8)−2.4 2.0 8 0.91 0.6 0.92 0.6 3.30 b* 9.6−18.4 1.7 9 0.58 1.0 0.42 1.4 1.31 Viscosity η100 834−1721 210 10 0.81 87 0.81 96 2.22 Viscosity η50 526−1029 119 10 0.82 48 0.82 54 2.26 DMC (g/g FW) 0.14−0.17 0.01 10 0.57 0.005 0.43 0.006 1.38 TSC (g/kg FW) 93.2−145.4 12.6 10 0.91 3.6 0.86 4.8 2.64 TA (meq/kg FW) 28.0−94.8 16.2 8 0.92 0.4 0.85 0.6 2.55 pH 3.39−4.47 0.23 10 0.84 0.09 0.85 0.10 2.47 Glucose (g/kg FW) 13.2−28.3 3.7 10 0.85 1.3 0.82 1.5 2.25 Fructose (g/kg FW) 40.2−80.3 9.1 10 0.68 5.0 0.60 5.6 1.58 Sucrose (g/kg FW) 33.2−57.3 5.5 13 0.82 2.3 0.77 2.6 2.08 Malic acid (g/kg FW) 3.0−8.8 1.3 8 0.93 0.3 0.86 0.5 2.67 $\rm R_c^2 $: determination coefficient of the calibration test; $\rm R_p^2 $: determination coefficient of the external prediction test; RMSEP: root mean square error of prediction test; RPD: the residual predictive deviation of prediction. 
Figure 2.
Boxplot of colors (a* and b*), rheological parameters (η50), total sugars (TSC), titratable acidity (TA) and fructose of different formulated puree groups.
Spectral analyses
-
Spectral discrimination and multivariate analyses were performed with MATLAB 7.5 (Mathworks Inc. Natick, MA, USA) software using the SAISIR package[20]. Principal component analysis (PCA) was carried out on the single-cultivar puree spectra to evaluate their variability and point out the contributed wavelengths. ANOVA was performed on the Vis-NIR spectra of all formulated purees to analyze their variations during puree formulation.
Spectra variable selection
-
Three spectral variable selection methods, including competitive adaptive reweighted sampling (CARS), successive projections algorithm (SPA) and uninformative variable elimination (UVE) have been applied respectively on the formulated puree spectra matrix D (n × λ), which was made up with the number of samples (n) and the intensity at each wavelength (λ with 2722 spectral variables from 400 to 2,500 nm) (Fig. 3), to extract the most informative wavelengths for prediction models of each puree quality traits. After comparison, the specific spectral variables related to all puree quality traits were extracted by CARS and composed as the matrix D' (n × λ′) of all formulated purees, consisting of the same number of samples (n) and the intensity at selected variables (λ′ with 671 spectral variables from 400 to 2,500 nm).

Figure 3.
Process of Vis-NIR spectral data by multivariate resolution alternative least square (MCR-ALS) and spectral reconstruction of formulated purees.
Spectra reconstruction
-
Multivariate curve resolution-alternative least square (MCR-ALS) is an effective multivariate self-modeling curve resolution method, which can simultaneously elucidate the pure spectra of different species present in processed products and their concentration profiles[21]. As displayed in Fig. 3, the Vis-NIR spectra of formulated purees were reconstructed from their composed single-cultivar purees based on our previously developed method[13]. The ST matrix (s × λ′) is the spectroscopic matrix describing the selected spectral variables (λ′) of all single-cultivar purees (s). The matrix D′ can be mathematically decomposed into the individual contributions related to the spectral information of matrix ST according to Eqn (1) and is interactively transformed using an alternative least square (ALS) procedure as Eqn (2).
$ {D'=CS}^{T}+E $ (1) $ C={D'\left({S}^{T}\right)}^+ $ (2) Matrix C (n× q) is the concentration matrix describing the contribution of every single-cultivar puree (q) in reconstructed purees (n). E is the error matrix that provides the data variation not explained by their contributions. The matrix (ST)+ is the pseudo-inverse matrix of ST. A general constraint used in the curve resolution method is the non-negativity on the concentration profiles.
Once the concentration profiles (matrix C) for each single-cultivar spectrum of Golden Delicious (CGD), Granny Smith (CGS), Braeburn (CBR), and Royal Gala (CGA), were obtained, they were used to reconstruct a new spectroscopic matrix R (n × k) for monitoring all formulated purees. Each row Ri (i = 1,…n) was made up of a reconstructed spectrum. And each column Rj (j = 1,…λ′) gave the reconstructed spectral intensity at each selected Vis-NIR wavelength based on the corresponding pure puree spectra of Golden Delicious (λ′GD), Granny Smith (λ′GS), Braeburn (λ′BR) and Royal Gala (λ′GA), following Eqn (3).
$ R={C}_{GD}{\lambda '}_{GD}+{C}_{GS}{\lambda '}_{GS}+{C}_{BR}{\lambda '}_{BR}+{C}_{GA}{\lambda '}_{GA} $ (3) Spectral multivariate regression
-
Spectral pre-processing and multivariate regression were performed with MATLAB 7.5 (Mathworks Inc. Natick, MA, USA) software with the 'PLS' toolbox and displayed in Fig. 4. For all spectral datasets, standard normal variate (SNV) and derivative transform calculation (Savitzky–Golay method, window size = 11, 21, 31, 41) of the first or second order were compared before multivariate regression. SNV pre-processing applied on the Vis-NIR spectral data showed the best performances to predict puree quality and was then systematically used.
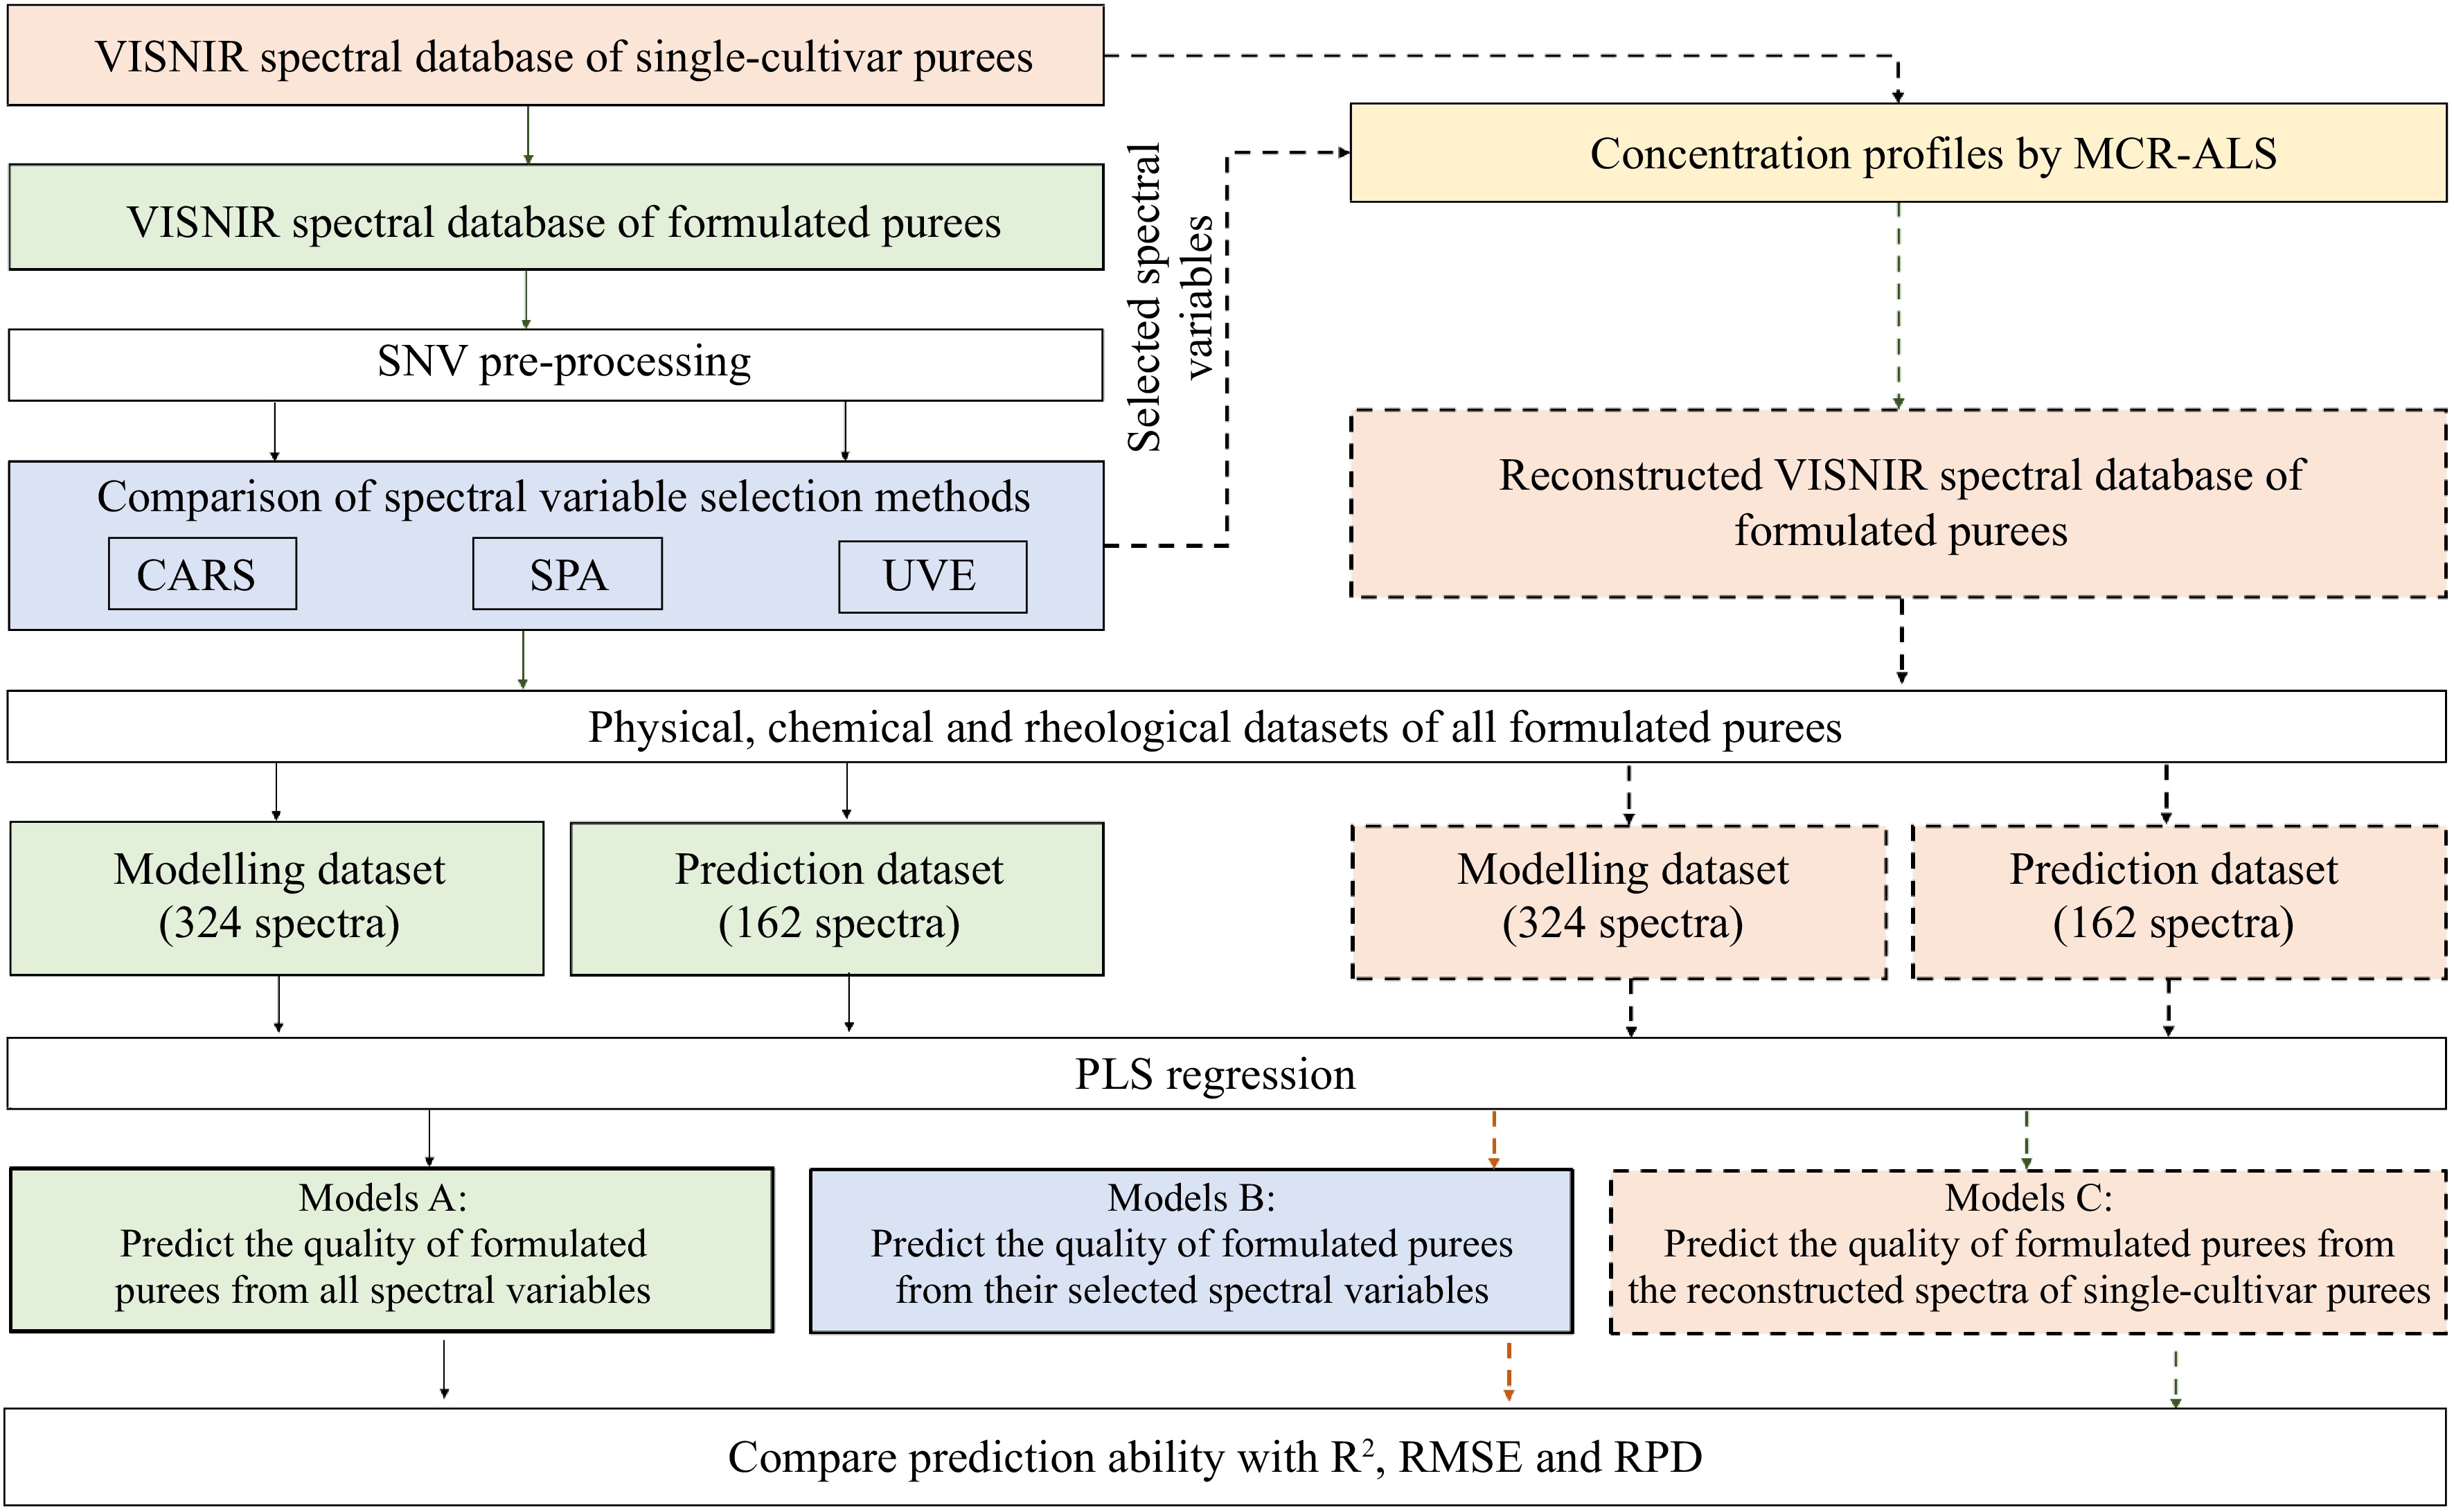
Figure 4.
Overview of the applied methodology of Vis-NIR spectra pre-processing, spectral variable selection, spectral reconstruction and multivariate regression.
The partial least square (PLS) regression models were developed to predict the quality characteristics of formulated purees based on: i) their full spectral variables (FULL) and the selected spectral matrices from CARS, UVE, and SPA, respectively (Table 1); and ii) the reconstructed Vis-NIR spectral matrix (Table 2). All aforementioned spectral matrices correspond to the same reference dataset. The 324 spectra of the formulated purees (6 groups × 6 proportions × 3 weeks × 3 replicates) were used for modeling calibration. Then, the calibrated models were further validated with the external prediction set of 162 puree spectra (6 groups × 3 proportions × 3 weeks × 3 replicates) (see Fig. 1). The optimal numbers of latent variables (LVs) for PLSR models were selected by the Venetian blinds cross-validation method. The prediction ability of developed models was described by the determination coefficients of calibration (
$\rm R_c^2 $ $\rm R_p^2 $ -
After processing, four different single cultivar purees presented significant (p < 0.05) differences in physical, chemical and rheological properties, which were in line with our previous results[23] (Fig. 2). Particularly, the BR purees had the highest redness (a* values = 1.76 ± 0.27) and lowest yellowness (b* values = 10.18 ± 0.45) among these four puree groups. Four apple cultivars presented a significant difference (p < 0.05) in puree viscosity (η50 and η100). Particularly, the GD, GS and BR presented a significantly higher (p < 0.0001) viscosity than GA purees, which were addressed as their bigger particle sizes and promoted cell adhesion with more branched pectin[24,25]. The TSC and DMC of GD purees were significant (p < 0.0001) higher than the other three groups, while the GS purees gave the highest acidic values (TA = 89.1 ± 1.3 meq/kg FW, and malic acid = 8.1 ± 0.5 g/kg FW). Besides, GD and GA purees presented the significant largest differences (p < 0.0001) in all individual sugar content (fructose, glucose and sucrose).
After puree formulation, three groups with the admixture of BR purees (B, D, F) can introduce a more intensive variation of color parameters (a* and b* values) than other groups (A, C, E) (Fig. 2a & b). Besides, the formulated purees prepared with GS purees (A, D, E) presented a relatively large variability of viscosity at a shear rate of 50 s−1 (η50) (Fig. 2c) than other groups (B, C, F), which is commonly used to describe the in-mouth texture perception of fluid foods[26]. The variability of TSC in different puree groups was ranked as C > E > F > A > B > D, and the addition of GA purees (C, E, F) resulted in a relatively large range of TSC (Fig. 2). However, the variability of fructose in formulated purees, which is the dominant individual sugar in purees[27], was different from the results of TSC and DMC. Three puree groups formulated with GS (C, E, F) gave a relatively larger variation of fructose than other groups (A, B, D) (Fig. 2f). The formulation of GS and BR purees (E) resulted in the largest variations of TA values among the six groups, but the limited changes of TA in GD and BR formulated purees (B) (Fig. 2e).
Consequently, the different formulation strategies based on these four different single cultivar purees can provide a large variability of appearance, and rheological and chemical properties.
Spectra analysis of formulated purees and their composed single cultivar purees
-
PCA was performed on the Vis-NIR spectra of four single cultivar purees to highlight their most variable wavelength regions (Fig. 5). The first principal component (PC1) discriminated against 'GD' and 'BR' purees and accounted for 54.2% of the total variation (Fig. 5a). The specific wavelengths at 524–528 nm, 672 nm in the Vis range and around 800–1,250 nm in the NIR range were the main contributors to the PC1 (Fig. 5b). The two bands at 528 and 672 nm are explained by the anthocyanin and chlorophyll contents of apples, respectively[28,29]. The NIR region at 800–1,250 nm is known as the absorption of apple carbohydrates and water content[8,10] and is already used for apple cultivar discrimination[30]. The 'GS' and 'GA' purees could be separated by the second principal component (PC2), with an explanation rate of 33.4%. The PC2 score was highly correlated to the visible spectra wavelengths at 612 and 672 nm, indicating the large differences in greenness between 'GS' and 'GA' purees[31].

Figure 5.
Principal component analysis (PCA) of the SNV pre-treated Vis-NIR spectra of four single cultivar purees. (a) Discrimination map of four apple cultivars. (b) Beta-coefficients of first principal component (PC1). (c) Beta-coefficients of second principal component (PC2).
ANOVA was performed on the Vis-NIR spectra of all formulated apple purees respectively (Fig. 6a & b), to point out the wavelength that varied at different formulation strategies. According to the F-values, the variability of formulation was much higher at the visible spectral region (F-values from 7.1 to 147.6) (Fig. 6a) than at the NIR region (F-values from 2.4 to 15.3) (Fig. 6b). This result demonstrated that the color varied more intensively than the chemical parameters among different formulated apple purees, from the spectroscopic point of view. Particularly, the most variable visible spectral wavelengths were located at 528, 614, and 672 nm, which is similar to the PCA results of four single-cultivar purees (Fig. 5). At the NIR region, the most informative wavelengths were located at 800−1,400 nm, in particular with 916, 1,070, and 1,270 nm, respectively. The NIR region at around 916 nm was related to the C-H and O-H bands of sucrose[32], and the typical peaks at 1,070 and 1,075 contributed to the soluble sugars of apples[33] and processed juices[34].

Figure 6.
ANOVA results of the SNV pre-treated (a) visible (500–780 nm) spectra and (b) NIR (780–2,500 nm) spectra of all formulated apple purees.
Accordingly, the specific Vis-NIR spectral wavelengths at 524−528 nm, 614, 672, 916, 1,070 and 1,270 nm were shown to be potentially linked to the different chemical and physical variations among different single-cultivar purees and their formulated products.
Predicting characteristics of formulated purees based on Vis-NIR spectra
-
In this part, PLS regression coupled with all the spectral variables (FULL) or the selected spectral variables based on SPA, CARS and UVE were applied to compare their ability to predict color, rheological and biochemical characteristics of formulated purees (Table 1). As expected, the decreases of determination coefficients between the calibration set (
$\rm R_c^2 $ $\rm R_p^2 $ For all the color parameters (L*, a* and b*), PLS models coupled with three different spectral variable selection methods gave better predictions than those with full spectral variables. The excellent predictions of a* values were obtained for all PLS models, with an RPD decreasing order based on CARS (RPD = 5.56), UVE (RPD = 5.38) and SPA (RPD = 5.24) methods, respectively. And the selected spectral variables for a* values of purees were mainly dominated in the visible spectral region at around 672 and 614 nm, which were described previously in this study.
Apparent puree viscosity at a share rate value of 50 s−1 (η50) can be considerably predicted by UVE-PLS models, with an
$\rm R_p^2 $ $\rm R_p^2 $ $\rm R_p^2 $ For biochemical characteristics, all the developed PLS models did not give satisfactory predictions for the DMC (
$\rm R_P^2 $ $\rm R_P^2 $ $\rm R_P^2 $ $\rm R_P^2 $ Concerning the different characteristics of puree acidity including pH, TA and malic acid, both CARS-PLS and UVE-PLS models provided considerable predictions with
$\rm R_p^2 $ Consequently, PLS models coupled with three spectral variable selection methods offered better predictions of puree physical, rheological and biochemical characteristics than using full Vis-NIR spectral variables alone. In comparison with three spectral variable selection methods, CARS always extracted the intermediate numbers of spectral variables (higher than SPA and much lower than UVE), but reached similar PLS prediction results as the UVE method with thousands of featured variables. In summary, PLS models coupled with selected VIS-NIR spectral variables have promising to well estimate the* color parameter, viscosity (η50), TSC, TA, pH, glucose and malic acids in formulated apple purees.
Predicting characteristics of formulated purees based on the reconstructed VIS-NIR spectra
-
Based on the CARS-PLS prediction results, a total 671 Vis-NIR spectral variables were extracted from the 2,722 spectral variables of full wavelengths. According to our method described, MCR-ALS was applied to the selected Vis-NIR spectral variables of all formulated purees and of the four single-cultivar purees, to compute the concentration profiles of relevant single-cultivar composition. In total, 486 spectra of formulated purees were reconstructed (including 324 spectra of the calibration set and 162 spectra of the validation set, respectively) based on their corresponding 36 spectra of single-cultivar purees.
PLS models were developed using these reconstructed Vis-NIR spectra and the reference data of all formulated purees. A good prediction of a* values of puree can be obtained with
$\rm R_p^2 $ $\rm R_p^2 $ $\rm R_p^2 $ $\rm R_p^2 $ $\rm R_p^2 $ $\rm R_p^2 $ $\rm R_p^2 $ -
The concentration profile of MCR-ALS opened a potential way to directly estimate the a* value, TA, pH, malic acid, and glucose for formulated purees based only on the CARS selected spectral variables of single-cultivar purees. Overall, the PLS results of these aforementioned quality parameters based on the reconstructed spectra of formulated purees presented a relatively lower prediction accuracy than directly on real puree spectra, because of the non-negativity of the concentration profiles which could constrain the spectral reconstruction[37]. Compared to our previous prediction models obtained on the mid-infrared spectra of purees[3], these results provided further evidence of our new chemometric strategy that using the concentration profile of MCR-ALS to reconstruct the Vis-NIR spectra of formulated purees from their corresponding spectra of single-cultivar purees. Besides, what stands out in this work is the necessity of spectral variable selection on the puree spectra to obtain considerable concentration profiles for the spectral reconstruction of formulated purees.
It's the first time to reconstruct the spectra of formulated products using the concentration profile of MCR-ALS from selected Vis-NIR spectral variables of composed raw materials. Innovatively, this strategy opens the possibility to guide the production of constant and anticipated purees by simply scanning the single-cultivar apple purees in the apple industry. For instance, after acquiring Vis-NIR spectra of the four single-cultivar purees, our developed PLS models could: i) provide several strategies to formulate purees with defined tastes (e.g. 127.3 ± 5.7 g/kg FW of TSC and 7.8 ± 0.2 meq/kg FW of TA, which might be reached with the formulate solutions as 80% GS–20% GA, 33.3% GD–66.6% GS and 80% GS–20% BR purees), depending the might be used in industry; or ii) simulate and optimize puree formulation for anticipated products development depending on the market, such as 20% GD−80% GS purees (low sweetness, high acidity), 33.3% GD–66.6% GA purees (high sweetness, low acidity) and GS 14%–GA 86% (low sweetness, low acidity).
-
This study firstly demonstrated a better ability of Vis-NIR spectroscopy coupled with advanced chemometric methods (CARS, UVE and SPA variable selection and PLS regression) to estimate the physical (a* value), rheological (η50 and η100) and chemical compositions of apple purees than the use of full wavelengths.
Further, an innovative spectral reconstruction strategy based on the MCR-ALS and spectral variable selection was developed to provide practical and suitable strategies for the multicriteria optimization of puree formulation with anticipated and constant quality (a* value, TSC, TA, glucose, malic acid) from their composed single-cultivar purees. As far as we know, this was the first report providing the potential formulation strategy to develop anticipated and constant final fruit products using the Vis-NIR spectral information of the initial purees based on the spectral reconstruction approach. Further this new chemometric strategy has the potential to provide production guidance for other food formulations, such as multifruit juices, blend oils, and even admixed flavoring agent etc, based on the Vis-NIR spectra acquired directly on their composed raw materials.
The authors thank Patrice Reling, Barbara Gouble, Marielle Boge, Caroline Garcia and Gisèle Riqueau (INRAE, SQPOV unit) for their technical help. This work was supported by the 'Interfaces' project, an Agropolis Foundation Flashship project publicly funded through the ANR (French Research Agency) under the 'Investissements d'Avenir' program (ANR-10-LABX-01-001 Labex Agro, coordinated by Agropolis Fondation), the National Natural Science Foundation of China (NSFC, 32302204), and Research Startup Foundation of Nanjing Agricultural University (No. 804120).
-
The authors confirm contribution to the paper as follows: investigation: Wang Z, Sun Y; resources: Renard C; Pan L; supervision: Renard C, Pan L, Lan W; conceptualization, funding acquisition: Lan W; data analysis: Wang Z; writing – original draft: Wang Z; writing – review & editing: Bureau S; Jaillais B; Chen X; Lv D, Lan W. All authors reviewed the results and approved the final version of the manuscript.
-
The datasets generated during and/or analyzed during the current study are available from the corresponding author upon reasonable request.
-
The authors declare that they have no conflict of interest. Catherine M.G.C. Renard is the Editorial Board member of Food Innovation and Advances who was blinded from reviewing or making decisions on the manuscript. The article was subject to the journal's standard procedures, with peer-review handled independently of this Editorial Board member and the research groups.
- Copyright: © 2024 by the author(s). Published by Maximum Academic Press on behalf of China Agricultural University, Zhejiang University and Shenyang Agricultural University. This article is an open access article distributed under Creative Commons Attribution License (CC BY 4.0), visit https://creativecommons.org/licenses/by/4.0/.
-
About this article
Cite this article
Wang Z, Bureau S, Jaillais B, Renard CMGC, Chen X, et al. 2024. Infrared guided smart food formulation: an innovative spectral reconstruction strategy to develop anticipated and constant apple puree products. Food Innovation and Advances 3(1): 20−30 doi: 10.48130/fia-0024-0003 

Infrared guided smart food formulation: an innovative spectral reconstruction strategy to develop anticipated and constant apple puree products
- Received: 04 January 2024
- Revised: 23 February 2024
- Accepted: 23 February 2024
- Published online: 08 March 2024
Abstract: An innovative chemometric method was developed to exploit visible and near-infrared (Vis-NIR) spectroscopy to guide food formulation to reach the anticipated and constant quality of final products. First, a total of 671 spectral variables related to the puree quality characteristics were identified by spectral variable selection methods. Second, the concentration profiles from multivariate curve resolution-alternative least squares (MCR-ALS) made it possible to reconstruct the identified spectral variables of formulated purees. Partial least square based on the reconstructed Vis-NIR spectral variables was evidenced to predict the final puree quality, such as a* values (RPD = 3.30), total sugars (RPD = 2.64), titratable acidity (RPD = 2.55) and malic acid (RPD = 2.67), based only on the spectral data of composed puree cultivars. These results open the possibility of controlling puree formulation: a multiparameter optimization of the color and taste of final puree products can be obtained using only the Vis-NIR spectral data of single-cultivar purees.