


-
3D food printing offers a novel approach to customizing the internal structure and texture of food products by controlling infill density[1,2]. Surimi, a protein-rich fish paste, is particularly well-suited for 3D printing due to its high content of salt-soluble myofibrillar proteins, providing the gel strength and viscoelasticity needed for extrusion-based printing[3]. The ability to personalize the shape and texture of surimi through 3D printing meets diverse consumer demands, while also providing a unique opportunity to investigate the impact of internal structures on heating processes[4]. However, the 3D-printed surimi products with designed structures are fragile and the subsequent hot-water cooking process might negatively affect the product structure. Heating is essential in the gelation of surimi, transforming its protein structure from a solid to a gel state with enhanced strength and stability[5]. Traditionally, thermal induction has been used to achieve this gelation in surimi products, but RF technology provides a promising non-contact alternative.
RF heating is commonly used in food processing because of its ability to heat solid food products uniformly and efficiently throughout their volume[6−8]. However, one of the major challenges is the non-uniform heating due to sample structure variation leading to uneven temperature distribution, which may compromise food quality and safety[9]. The distinct structures may allow electromagnetic waves to penetrate into the geometry, altering the electric field intensity (EFI) throughout the volume, and consequently affecting the heating uniformity during RF processing. To address this challenge, computer modeling has been increasingly employed to simulate the EFI and thermal effects of RF heating, allowing researchers to visualize and predict heating patterns instead of conducting costly experiments[10]. These simulations are valuable for optimizing RF treatment parameters and minimizing trial-and-error in experimental approaches[11]. While extensive research exists on RF heating in relation to the external dimensions of various food products[12−15], there is a noticeable gap in studies focusing on how internal structures—such as the infill density in 3D-printed foods—affect RF heating performance. Previous studies have explored the impact of porosity on RF heating in particle-packed systems, such as black pepper and peanuts, demonstrating that heating uniformity and rate varied significantly depending on particle size and porosity. Liu et al.[11] conducted a study on RF heating of stacked black pepper particles with different porosities using a finite element model. The results indicated that a reduction in porosity resulted in an increased heating rate and more non-uniform heating. The optimal heating effect was observed at a porosity of 0.3. Tasci et al.[16] investigated RF heating of peanuts with varying particle sizes. Their findings showed that both the heating rate and uniformity improved as particle size and porosity decreased. These studies have confirmed that the external dimensions of food materials or porosities and packing densities of bulk granular materials significantly influence RF heating performance. However research on the impact of internal structure changes within a single, continuous food sample—such as 3D-printed surimi—remains limited.
This study aims to address this knowledge gap by exploring how different infill densities in 3D-printed surimi affect RF heating rate and uniformity. By developing finite element models of surimi samples with varying infill densities, The EFI variation within the samples would be predicted during RF heating. The sample with 100% infill density was prepared and subjected to RF heating to obtain its temperature profile for validating the developed model. The validated RF heating models are employed to assess and compare the heating uniformity across these internal structures, offering valuable insights for optimizing the design of 3D-printed food products and their suitability for dielectric heating treatments.
-
The surimi used in the experiment was purchased from a supermarket (Shanghai Caixing Trading Company, Shanghai, China), stored at −18 °C during transport and storage. Its moisture content was 78.04% ± 0.36% (wet basis). The frozen surimi was thawed in ice water for 30 min with its packaging, then chopped in an electric grinder (TM-R18, TCL Group, Huizhou, China) for 1 min. After chopping, 2% NaCl and 0.2% microbial transglutaminase (MTGase) (Gaoxin Chemical Glass Instrument Co., Ltd., Shanghai, China) (weight basis) were added into chopped surimi, followed by 2 min of chopping for mixing. The enzyme activity of MTGase used in the experiment was 1,667 nKat/g. The mixed surimi was then shaped into cylindrical samples (d = 26 mm, h = 80 mm) using either a 3D printer (FDM PRE-300, Fuqifan, Shanghai, China) with infill densities of 30%, 50%, 60%, and 70% (Fig. 1). The sample with a 100% infill density was prepared using a traditional surimi-sausage making method using a hand-press enema machine (SG8, Xiaojin, Shijiazhuang, China) filling into polyethylene (PE) casing. This traditionally prepared surimi sample was subjected to an RF heating experiment to validate its temperature distribution predicted by the developed finite element model. The density of surimi was determined as 1,003 kg/m³ using the liquid displacement method.
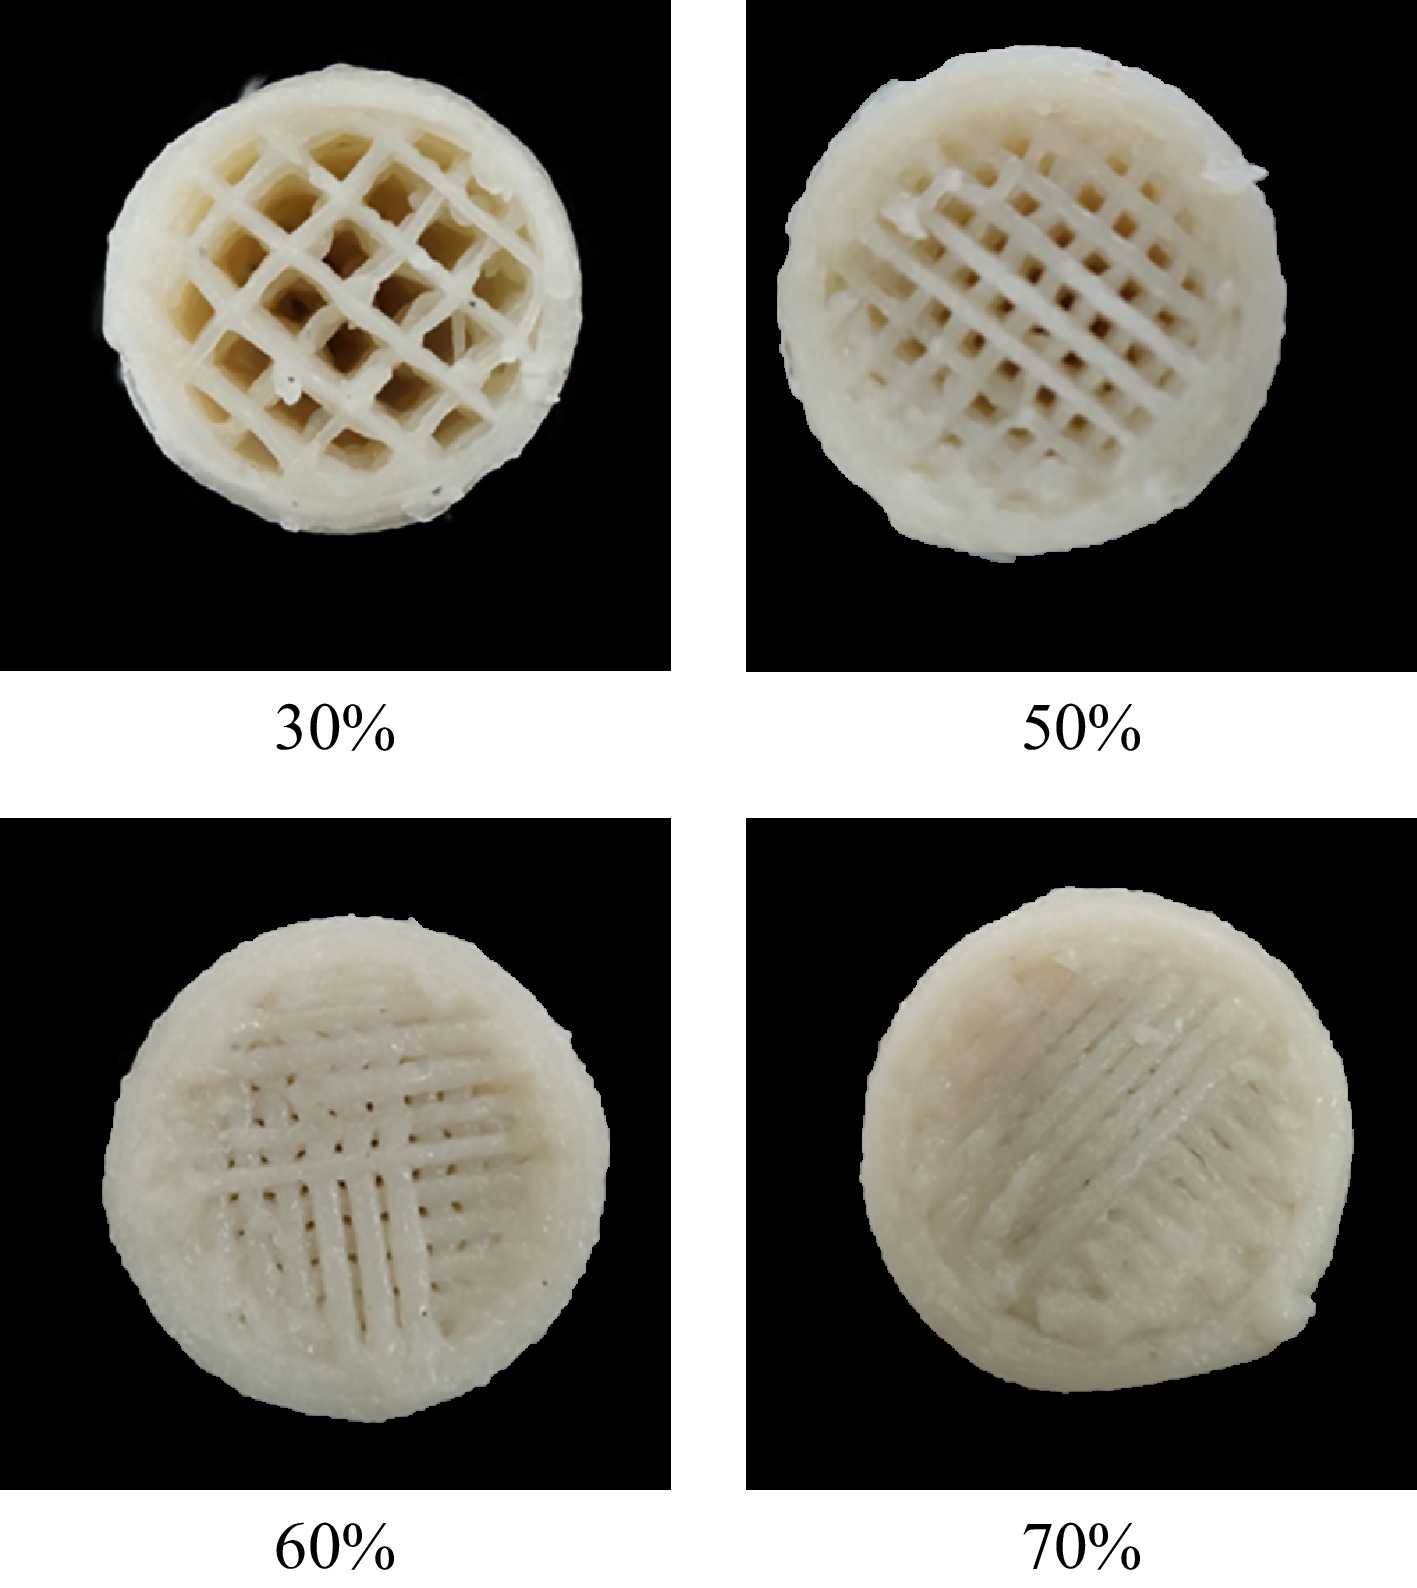
Figure 1.
3D printed surimi with different infill densities.
Measurement of physical properties
-
The surimi samples were made from the same raw material, which was surimi. When samples with different infill densities need to be depicted in the model, the thermal and dielectric properties of the surimi domain and the air domain were set separately and properties were set to each domain. The only difference in the geometries was the porosity of the samples. Therefore, we only measured and reported the thermal and dielectric properties of surimi in this study, which is independent of the infill densities. The measuring methods for the thermal and dielectric properties of surimi materials are as follows.
Measurement of dielectric properties
-
The dielectric properties of the surimi sample were determined using a vector network analyzer connected with a high-temperature open coaxial probe (Agilent N1501A, Agilent Technologies Inc., San Jose, USA) with 85070D test software, as described in a previously published study[10]. The surimi sample was carefully loaded into a custom cylindrical holder (d = 25 mm, h = 100 mm), ensuring that no air pockets were trapped. This allowed for complete contact between the coaxial probe and the surface of the sample, ensuring accurate measurements. A type-K thermocouple temperature sensor (OMEGA Engineering, Norwalk, CT, USA) was inserted through the bottom of the container, reaching the center of the sample for real-time temperature measurement. Dielectric properties measurements were taken between 20 and 90 °C at 10 °C increments. The measurement was conducted three times, and the parameter values used in the model were based on the average of the three measurements.
Measurement of thermophysical characteristic parameters
Measurement of specific heat capacity
-
The specific heat capacity (Cp) of the surimi sample was determined using a differential scanning calorimeter (DSC) (Q2000, TA Instruments, New Castle, USA). Initially, an empty aluminum disk was placed in the DSC unit to establish a baseline. The heat flow of a sapphire standard sample and the surimi samples were subsequently measured. The temperature program was as follows: (1) cool the sample to 20 °C and equilibrate for 10 min; (2) heat the sample to 90 °C at a constant rate of 1 °C/min; (3) maintain the temperature at 90 °C for 10 min. After subtracting the baseline heat values for both the sapphire and surimi samples, the Cp of surimi can be calculated using Eqn (1), incorporating the known specific heat capacity of sapphire[11]. Three separate experiments were conducted for the baseline, the standard sample, and the surimi sample, respectively. The parameter values used in the model were based on the average of the three measurements.
$ {C}_{p,sp}={C}_{p,cal}\times \dfrac{{m}_{cal}({P}_{sp}-{P}_{bla})}{{m}_{sp}({P}_{cal}-{P}_{bla})} $ (1) where, m is the sample mass (mg); P is the heat flow (m·W); The subscripts sp represents the food sample; cal represents the standard sample; bla represents an empty disk.
Measurement of thermal conductivity
-
The thermal conductivity (k) of the surimi sample was determined using an SH-1 line heat source probe connected to a thermal conductivity analyzer (SH-1 probe, KD2-pro Decagon, Pullman, USA). During the measurement, the prepared surimi material was placed in a beaker (d = 60 mm, h = 80 mm) and the opening of the beaker was sealed with plastic film to avoid moisture loss during measurement. The beaker containing the sample was then immersed in a thermostatic water bath for temperature control. The measurements of the k were taken between 20 and 90 °C in 5 °C increments. Once the center temperature of the sample reached and stabilized at the target temperature, the k was recorded[17]. The measurements were conducted three times, and the parameter values used in the model were based on the average of the three measurements.
Model establishment
Model hypothesis
-
(1) All gases are regarded as ideal gases;
(2) All gases have the same pressure;
(3) The initial moisture and temperature are uniformly distributed;
(4) Water evaporation during the induction of gel was ignored;
(5) Gravity of water vapor was ignored.
Geometrical mode
-
Preliminary studies have suggested that the vertical placement of cylindrical samples within the RF heating cavity enhances heating uniformity compared to horizontal placement[18]. Therefore, in this study, surimi samples were positioned vertically at the central position of the bottom plate in the RF heating cavity. Figure 2 illustrates the geometric dimensions of the RF heating cavity, as well as the location the surimi sample within the cavity. The RF generator, responsible for producing electromagnetic waves, transmits these waves to the RF cavity via an inductor. The top electrode of the RF heating cavity was connected to the inductor and the high-voltage power supply, while the bottom electrode was grounded, thereby generating an alternating electric field between the two electrodes. The gap between the electrodes of the RF heating cavity was fixed at 120 mm and non-adjustable.
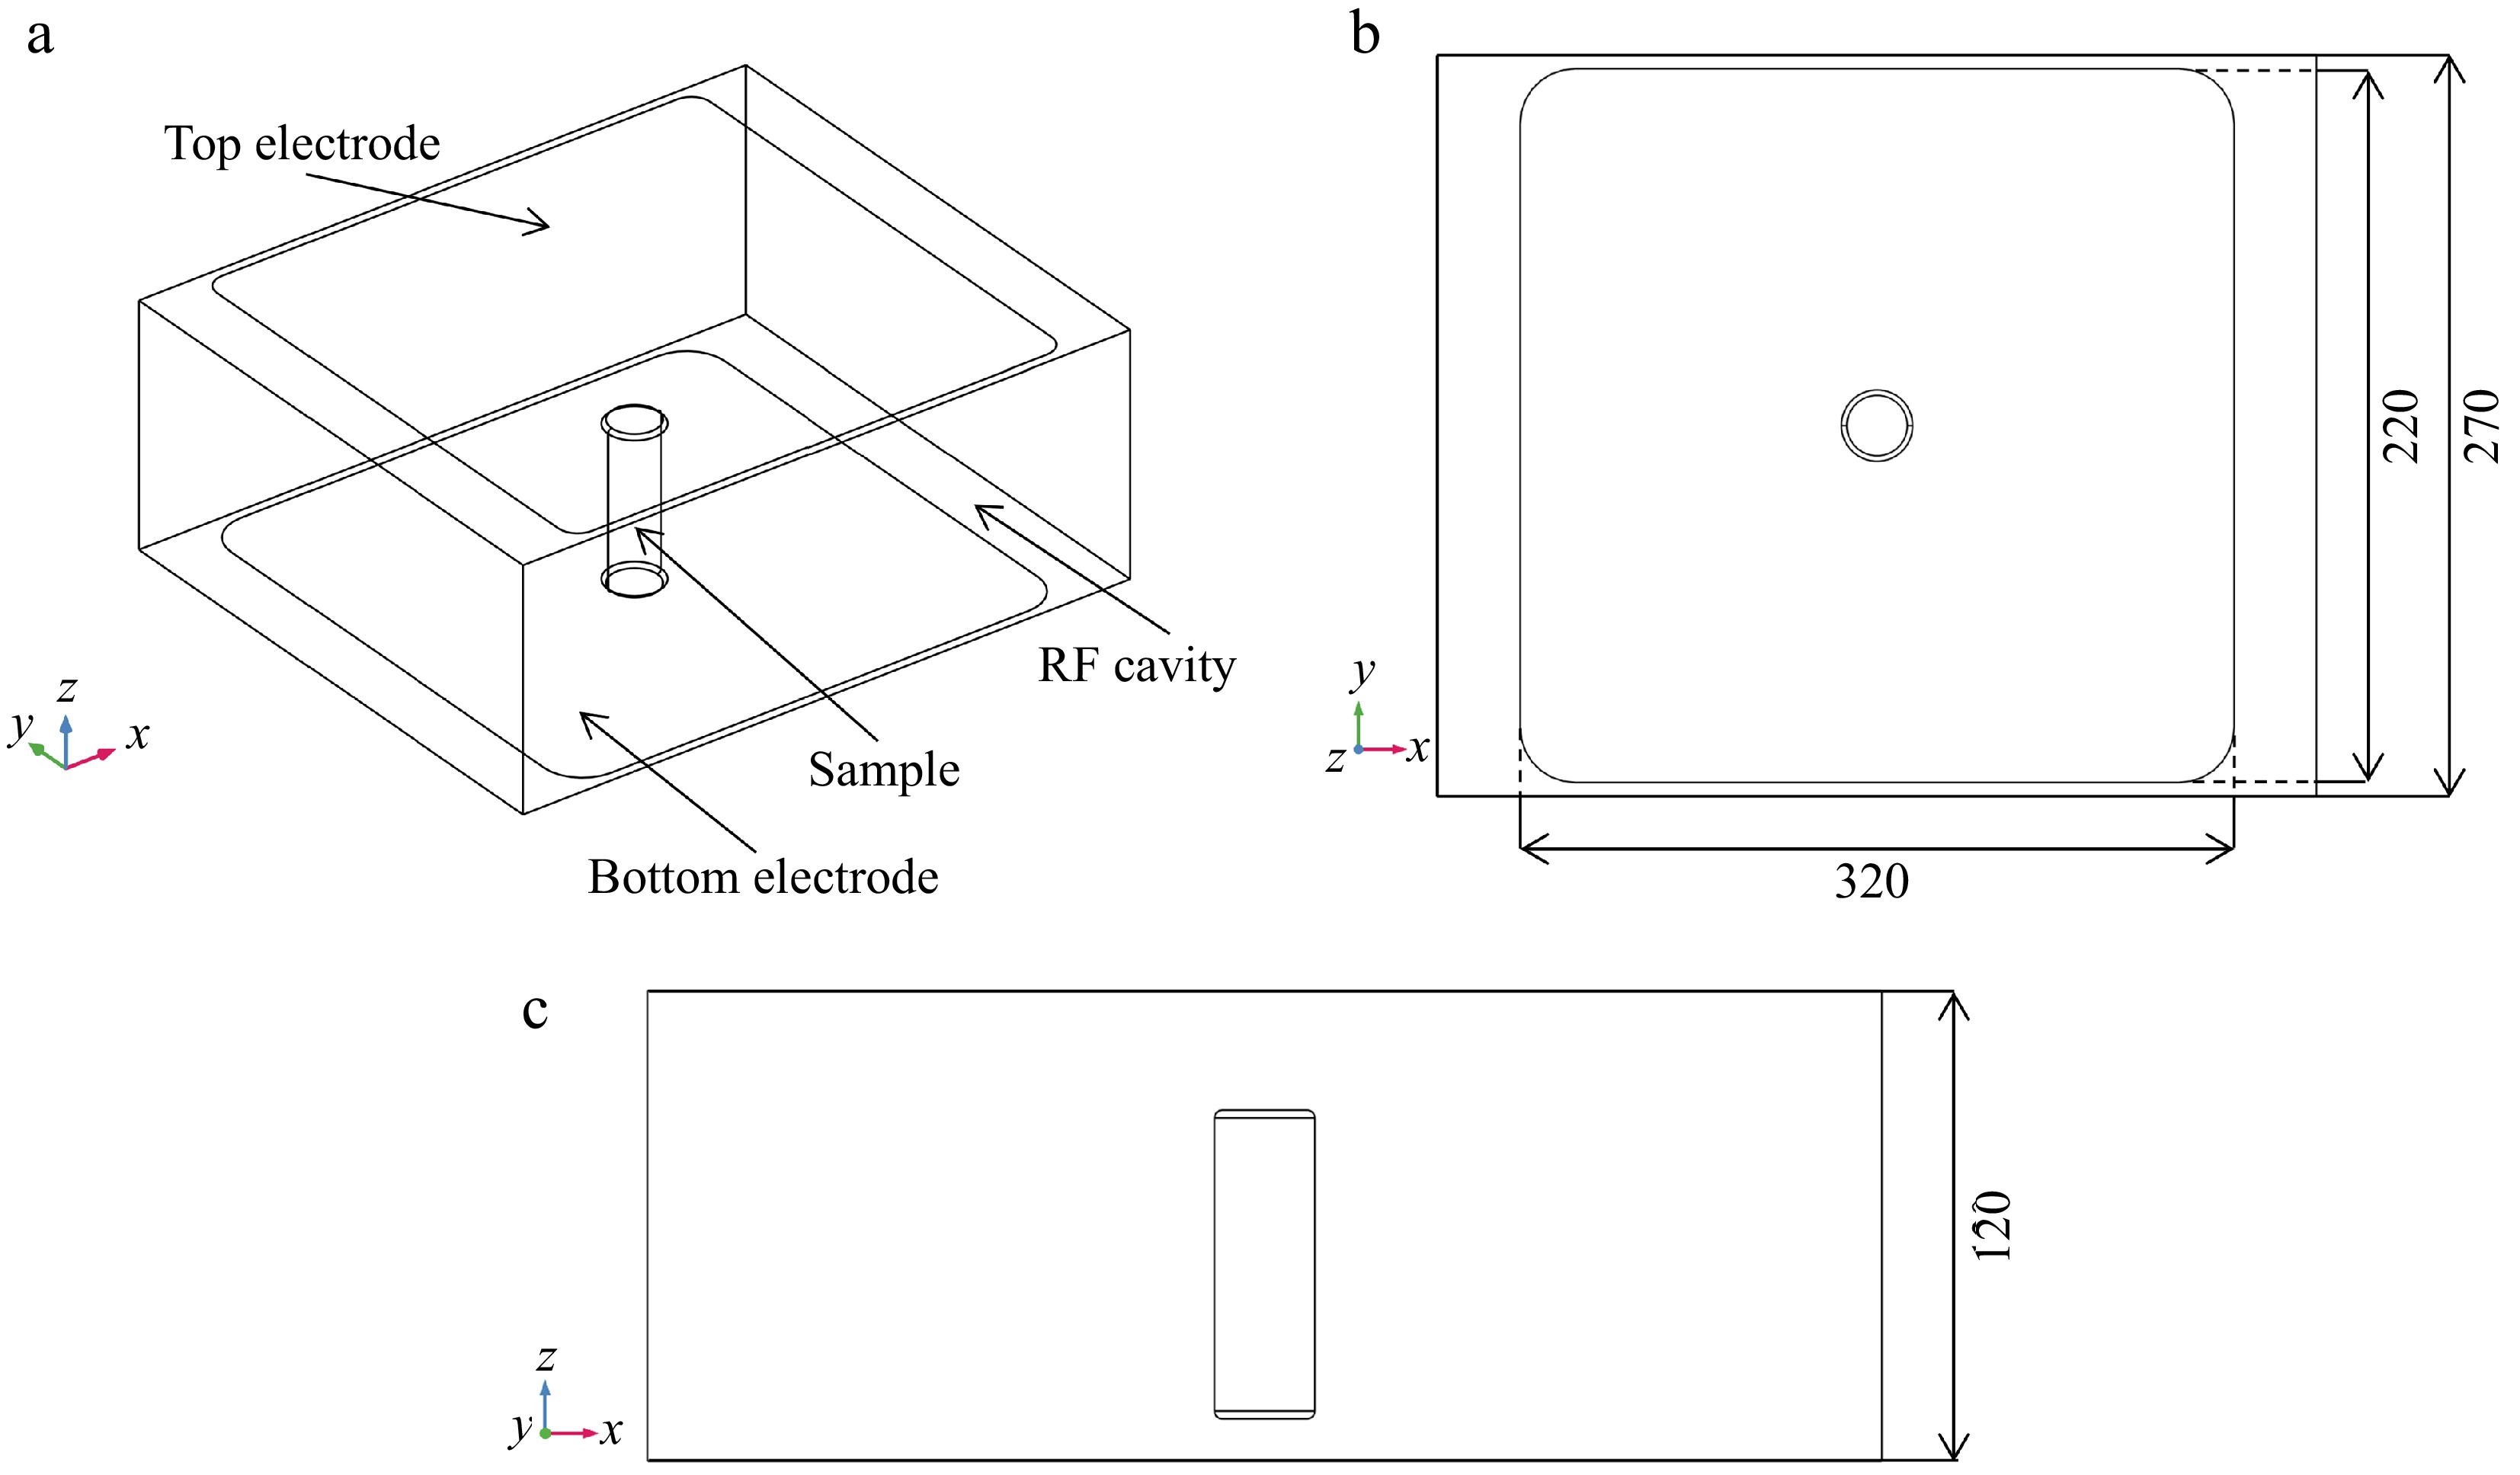
Figure 2.
Geometries of RF heating cavity and surimi sample: (a) 3-D view, (b) x-y plane, (c) x-z plane. (unit: mm).
The geometrical models of surimi samples with different infill densities were created using SolidWorks® software (SolidWorks 2023, Dassault Systèmes, Waltham, USA), with the top view and side view shown in Fig. 3. By exactly depicting the 3D printed geometries, the cylindrical sample was divided into 'air' zone and ‘surimi’ zone with different proportions and assigned with different material properties accordingly. The material properties of the 'surimi' zone were obtained through experimental measurements, while the material properties of the ‘air’ zone were sourced from the COMSOL material library. Additionally, to further enhance the accuracy of the model and better reflect the actual printed geometry, the edges of the cylindrical surimi sample were rounded with a corner radius of 2 mm[10].
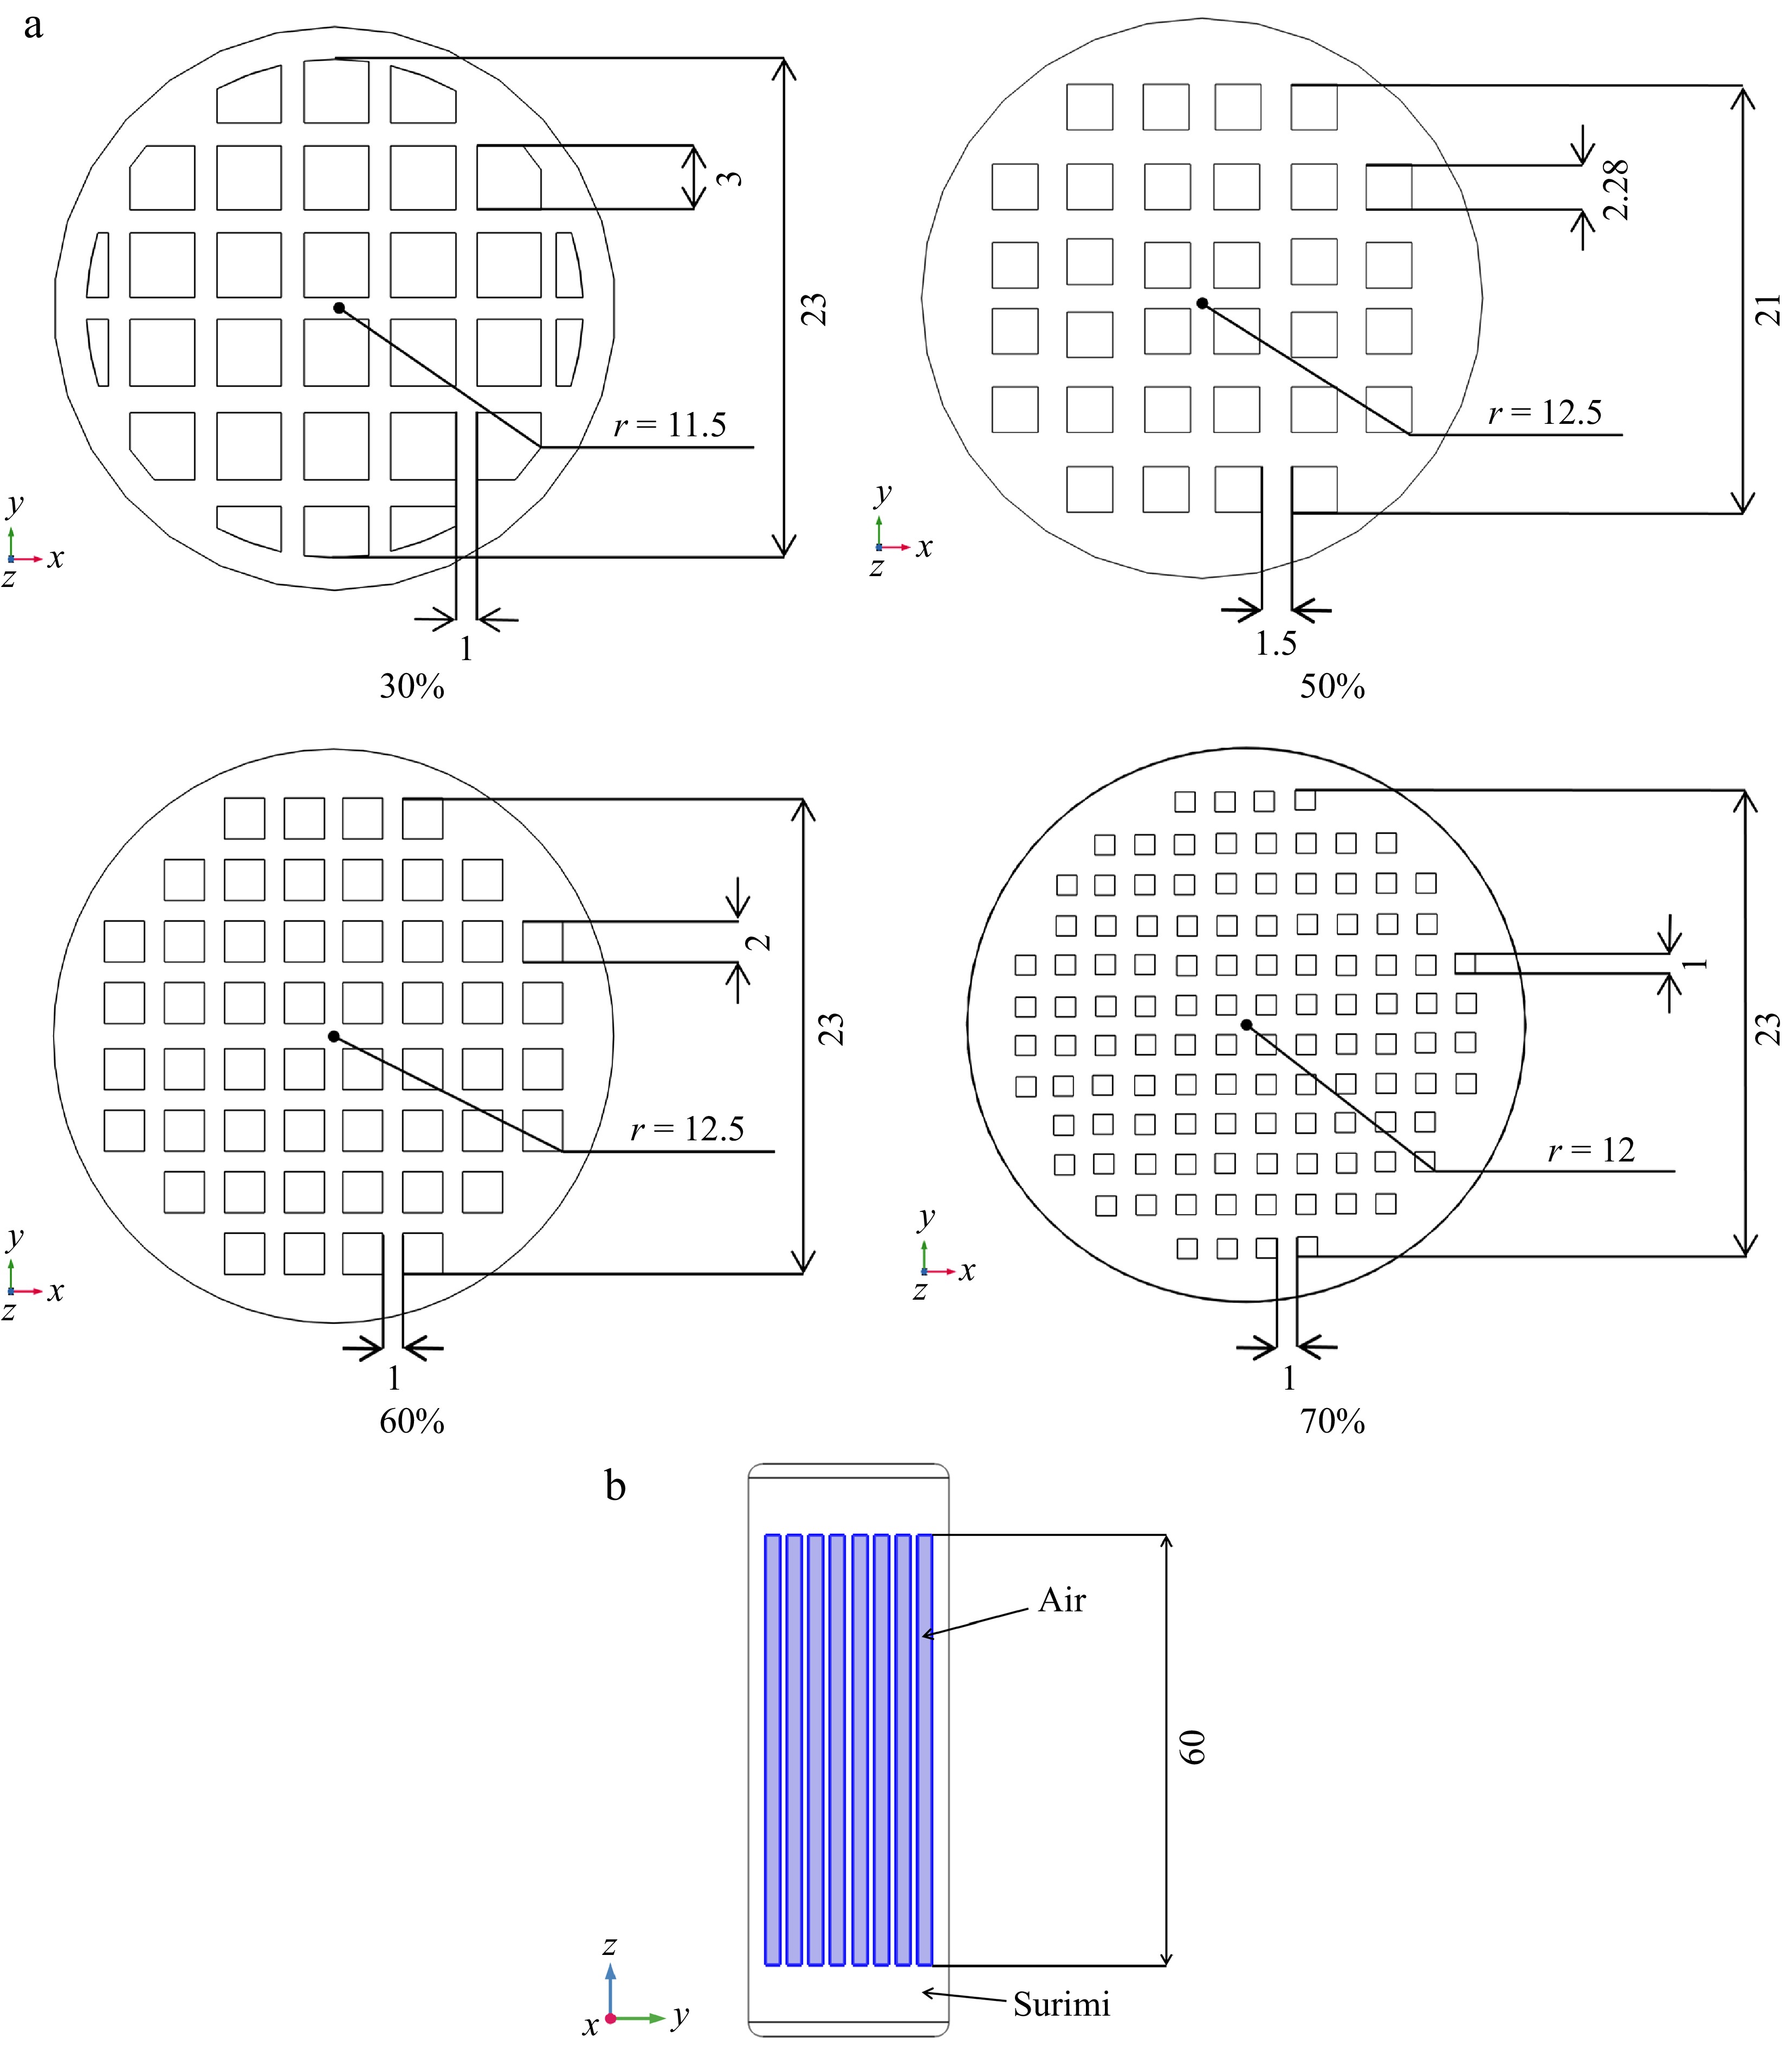
Figure 3.
Internal geometry of surimi samples with different infill densities: (a) x-y plane, (b) y-z plane (unit: mm).
Governing equation
-
The RF heating model was developed using COMSOL Multiphysics® software (COMSOL Multiphysics 5.2, Burlington, USA), employing the Joule heating module to model the temperature and electric field distribution within the surimi sample. The governing equation was Laplace equation, which was a simplified form of Maxwell's equations[19]:
$ -\nabla \left(\left({\sigma }+2{\text π}{f{\varepsilon }}_{0}\varepsilon 'j\right)\nabla V\right)=0$ (2) where, σ is the conductivity of the sample (S/m); f is the frequency of RF equipment (Hz);
$ {{ \varepsilon }}_{\text{0}} $ $ \sqrt{\text{-1}} $ The conversion between electromagnetic energy and thermal energy can be expressed by the formula as follows[20]:
$ P=2{\text π} f{\varepsilon }_{0}{\varepsilon }''{\left|\overrightarrow{E}\right|}^{2} $ (3) where, P is the electromagnetic energy absorption power per unit volume of the sample (W/m3); ε" is the dielectric loss of the sample;
$ \overrightarrow{E} $ The heat transfer control formula is described by the following formula[20]:
$ \rho {C}_{p}\dfrac{dT}{dt}=\nabla \left(k\nabla T\right)+P $ (4) where, ρ is the density of the sample (kg/m3); Cp is the specific heat capacity of the sample (J/(g·K)); dT/dt is the instantaneous heating rate of sample (°C/s); t is the heating time (s); k is the thermal conductivity of the sample (W/(m·K)); T is the temperature of the sample (K).
The heat transfer due to natural convection between the surrounding air and the sample surface can be expressed by the formula as follows[10]:
$ Q=Ah\left(T-{T}_{air}\right) $ (5) where, Q is the heat transfer amount between the sample and the surrounding air (W); A is the surface area of the sample in contact with the surrounding air (m2); h is the convective heat transfer coefficient of the sample surface (W/(m2·K)); T is the temperature of the sample surface; and Tair is the temperature of the surrounding air.
The voltage on the upper plate is the anode voltage supplied by the RF equipment, while the lower plate is grounded. The voltage across the sample is determined using the following formula[19]:
$ V=\left({d}_{air}\sqrt{{\left({\varepsilon }'\right)}^{2}+{\left({\varepsilon }''\right)}^{2}}+{d}_{m}\right)\sqrt{\dfrac{\rho {c}_{p}}{\pi f{\varepsilon }_{0}{\varepsilon }''}\dfrac{dT}{dt}} $ (6) where, dair is the distance between the top electrode of the RF cavity and the sample (m); dm is the thickness of the sample (m).
Initial conditions and boundary conditions
-
In this study, the heating rate of the sample central was predetermined to achieve an optimal heating rate and uniformity. Consequently, the simulation voltage was determined using Eqn (6). The final simulation voltage is set to 3,000 V based on the experimental results[11].
The convective heat transfer coefficient (h) of the sample surface is significantly correlated with the moisture evaporation rate. When the evaporation rate is low, the surface h also tends to decrease[21]. Moisture within the pores of the surimi sample is less likely to diffuse into the air, resulting in higher moisture content within the internal pore air, which in turn reduces the moisture evaporation rate on the internal surface and lowers its h. Additionally, the impact of the h on the heating process of the sample is minimal[22]. Therefore, the internal h of the surimi sample was set to 5 W/(m²·K), while the external surface was set to 15 W/(m²·K) in this study[23].
The initial and boundary conditions used in the simulation are presented in Table 1.
Table 1. Initial and boundary conditions of RF heating simulation with COMSOL Multiphysics®.
Initial and boundary conditions Value Initial temperature (°C) 20.0 Surrounding air temperature (°C) 20.0 Frequency (MHz) 40.68 Plate spacing (mm) 120 Outer surface convective heat transfer coefficient (W/(m2·K)) 15 Inner surface convective heat transfer coefficient (W/(m2·K)) 5 Simulation procedure
-
A bidirectional coupled model (electromagnetic-thermal) was developed in COMSOL Multiphysics® software. This coupling enables a more accurate representation of the heat generation due to electromagnetic energy conversion and the subsequent thermal diffusion within the surimi sample. The entire model was partitioned using 'free tetrahedral' mesh, and the mesh sizes of the cavity and the sample were set to 'finer' and 'ultra-fine' respectively. A Bi-Conjugate Gradient Stabilized (BiCGStab) iterative solver was used in this study to solve the built model. The time step was set as 10 s. The simulation was programmed to automatically stop once the central temperature of the surimi sample attained 90 °C, which corresponds to the desired endpoint for the heating process. The number of elements in each domain is shown in Table 2. The simulation was run on a workstation with a Dell processor, dual Intel Xeon CPUs (2.60 GHz), 128 GB of RAM, and a Windows Server 2012 R2 Standard 64-bit operating system. Each simulation took ~26 min to finish.
Table 2. The mesh numbers of the model with different infill densities.
Infill density (%) Number of mesh Tetrahedral Degrees of freedom 30 174,351 516,660 50 162,116 438,711 60 170,995 657,565 70 181,792 700,713 100 135,565 329,200 Experimental validation
-
Before the experiment, the initial temperature of the sample was controlled using a temperature and humidity chamber to ensure uniform temperature distribution throughout the sample. An RF oven (DOTWIL™ D20Plus, Shanghai Dotwill Intelligent Technology Co., Ltd., Shanghai, China), operating at 400 W and 40.68 MHz with a 50 Ω impedance, was used for the surimi heating experiments. To monitor the temperature evolution during the RF heating, an optical fiber sensor (HQ-FTS-D1F, Heqi Photoelectric Technology Co., LTD., Xi'an, China) was inserted into the sample at the designated location (Fig. 4). The heating process was aborted once the measurement point temperature reached 90 °C, which was the target endpoint for the study.
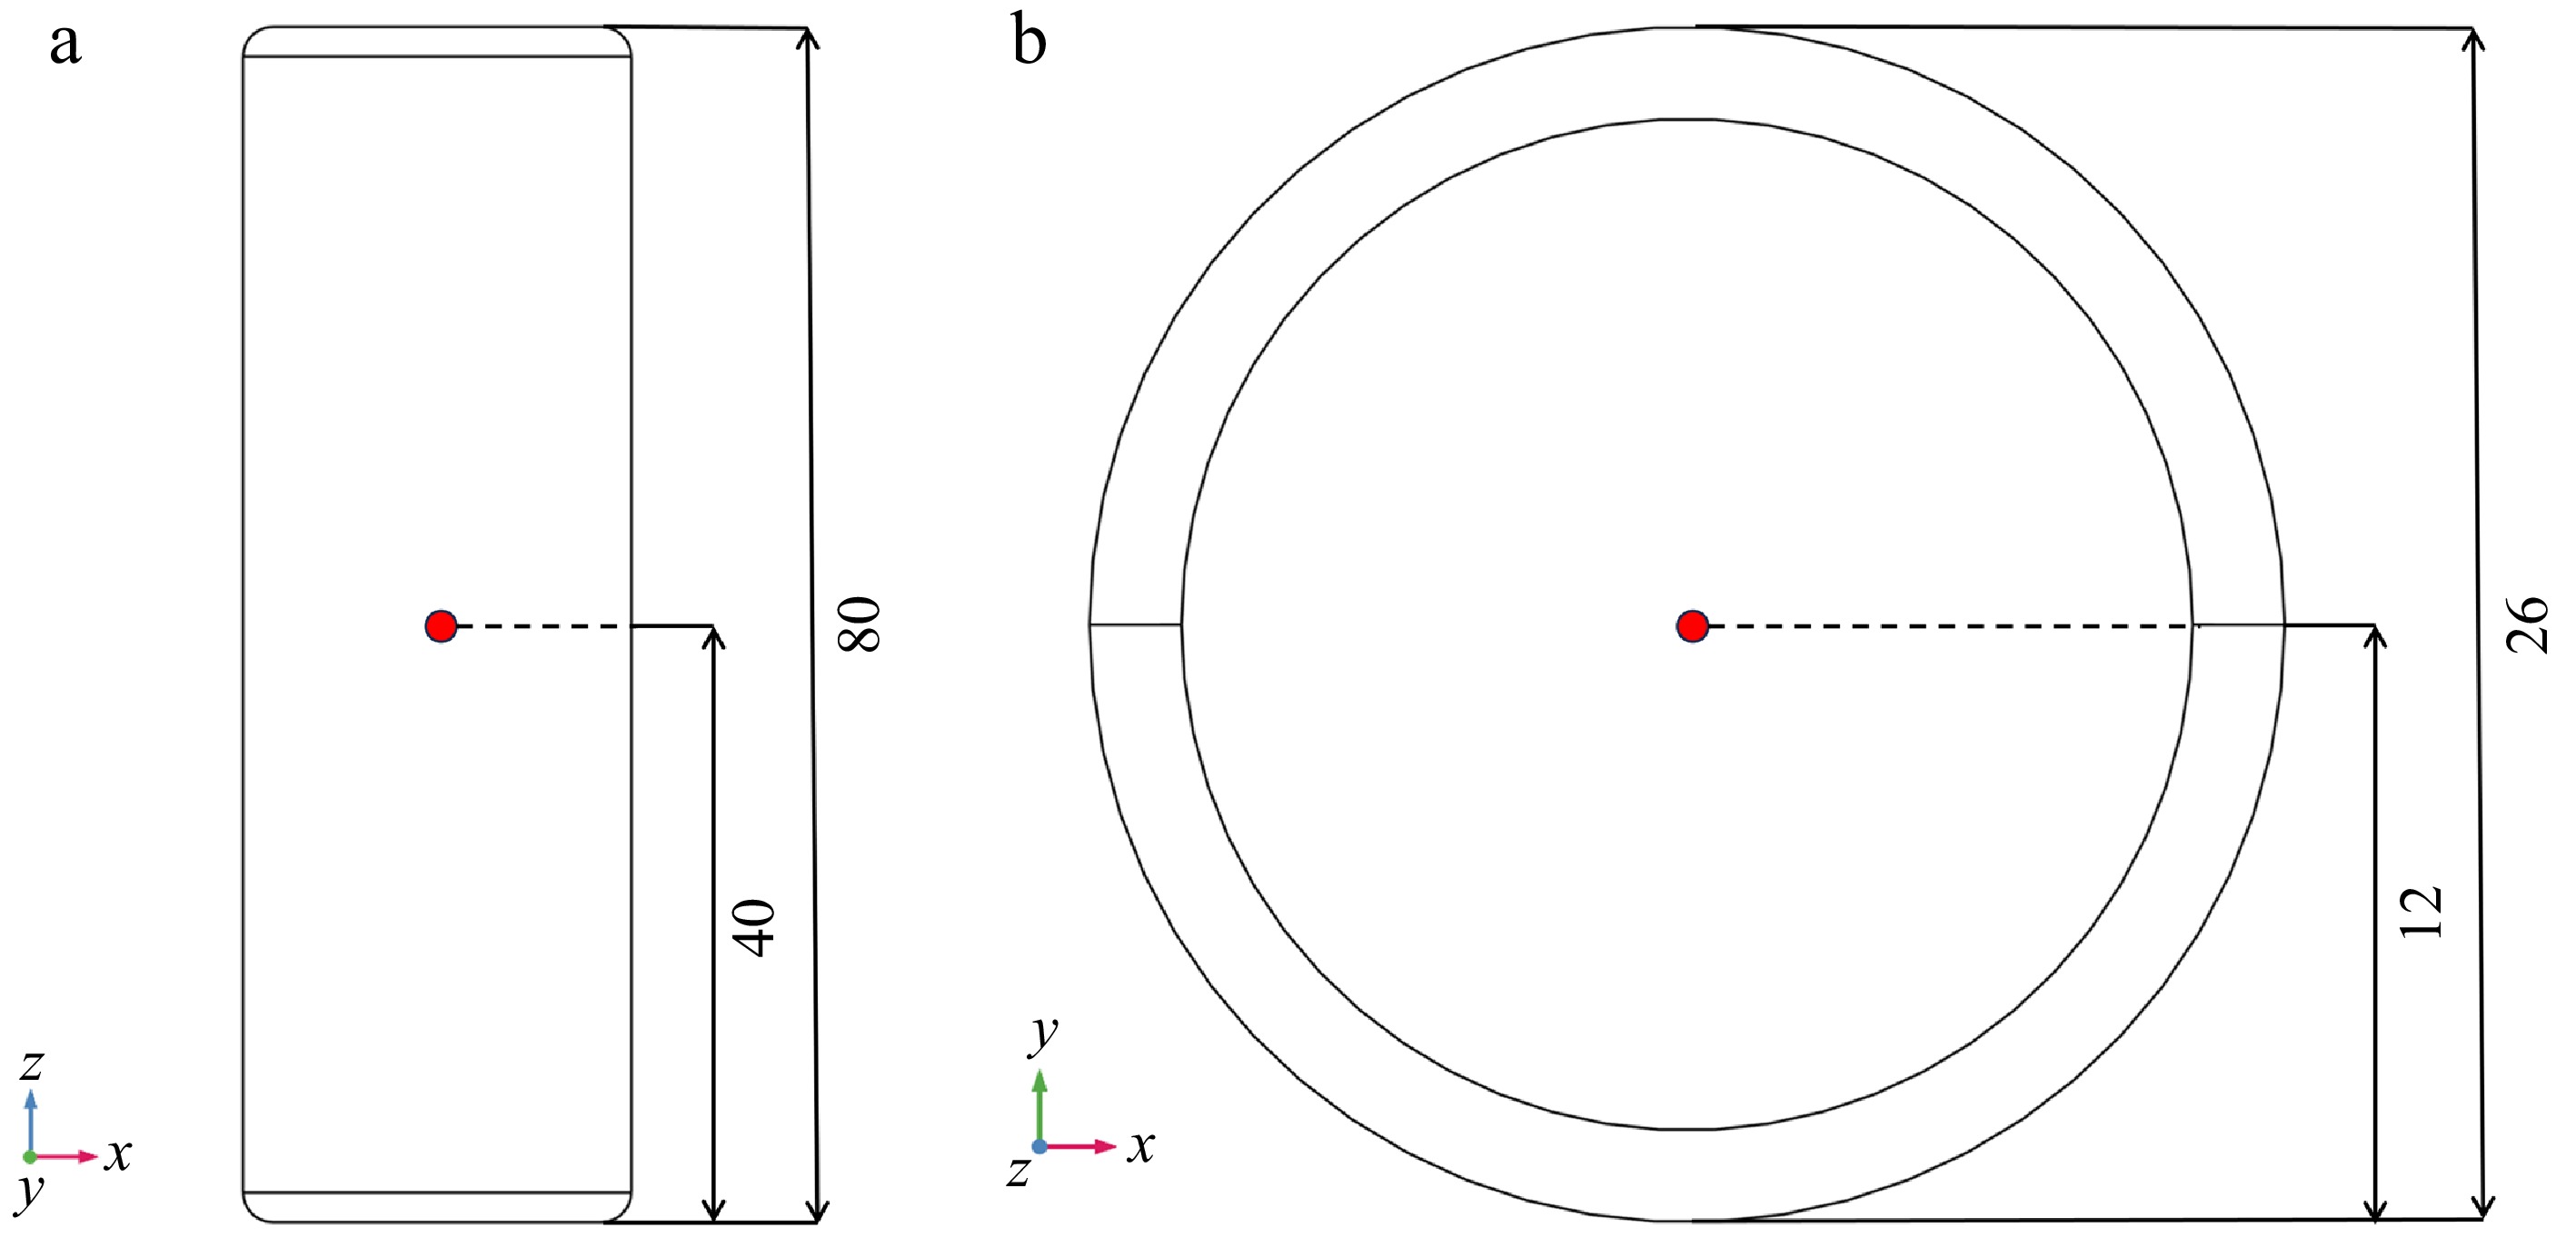
Figure 4.
Locations of the temperature measurement points in the sample (red dots indicate the measurement locations): (a) x-z plane, (b) x-y plane (unit: mm).
After heating, the optical fiber sensor was removed from the sample, and temperature distribution on both the side surface and the longitudinal section of the sample was subsequently measured using an infrared thermal imager (FLIR A655sc, Wilsonville, USA). To validate the accuracy of the developed computational model, the experimental temperature data—specifically the measured temperature distributions on the side and longitudinal sections of the sample, along with the temperature rise curve at the center—were compared against the simulation results[10].
Post-processing of the simulation results
-
The validated finite element model was employed to analyze the RF heating uniformity of surimi samples with four different infill densities. This model provided a detailed simulation of the electromagnetic and thermal interactions within the samples, allowing for an in-depth investigation of the heating process under various conditions. The heating uniformity of the sample was quantified using the temperature uniformity index (TUI), a measure frequently used to assess the heating uniformity of materials like millet[24] and green peas[25] in RF heating. The TUI reflects the extent to which the temperature distribution within the sample volume deviates from the desired target temperature. It was described by the following formula[26]:
$ TUI=\dfrac{{\displaystyle\int }_{0}^{{V}_{vol}}\sqrt{{\left(T-{T}_{tar}\right)}^{2}}\mathrm{d}{V}_{vol}}{{V}_{vol}\left({T}_{tar}-{T}_{0}\right)} $ (7) where, T is the temperature of the sample (°C), Ttar is the target temperature of the heating experiment (°C), T0 is the initial temperature of the sample (°C); Vvol is the volume of the sample (m3).
Statistical analysis
-
All experimental data were processed and analyzed using Origin® 2023 (Origin Lab Corp., Northampton, USA). The analysis of sample parameters was conducted using one-way analysis of variance (ANOVA) in SPSS 27.0 (SPSS 27.0, Chicago, IL, USA), with significance defined as p < 0.05. All experiments were repeated three times. The data are presented as mean ± standard deviation (SD).
-
Figure 5a reflects the dielectric properties of the surimi containing 2% NaCl and 0.2% MTGase with temperature at a frequency of 40.68 MHz. As observed, both the dielectric constant (ε') and dielectric loss factor (ε") of the surimi increase with the temperature from 20 to 90 °C. The value of ε' ranges from 72.3 to 106.4, while the ε" exhibits a more pronounced variation, ranging from 559.6 to 797.5. The rising trend of dielectric properties changes from slow to rapid around 60 °C and from rapid to slow around 70 °C, which is consistent with the change of thermal conductivity with temperature. This can be attributed to the fact that the variation in ε' with temperature is primarily influenced by the ratio of free water to bound water in the sample[27]. As the temperature increases, the free water content in the surimi decreases, leading to a reduction in the ε'. In contrast, a higher bound water content causes ε' to increase with temperature. The transition of surimi from a sol to a gel state around 40 °C plays a crucial role in this process. During this transition, protein molecules begin to unfold and cross-link, forming a more compact three-dimensional network structure[5]. This reduces the free water content in the surimi, contributing to a significant increase in the ε'. Moreover, the gel network formation reduces the viscosity of the surimi, contributing further to the increase in the ε'[28]. As the gel structure continues to form and stabilize, the mobility of water molecules becomes increasingly constrained. Consequently, the ε' stabilizes at higher temperatures. The trend in the ε'' may also be related to the internal structural changes in the surimi. The gel network formation results in a more tightly bound interaction between the water molecules and the surimi sample, reducing the ability of water molecules to rotate[29]. As a result, the rate of increase in the ε'' is relatively slow between 40 and 60 °C. However, as the temperature rises further, the increased molecular motion of the water molecules leads to a sharp increase in the ε'', reflecting the enhanced rotational dipole activity of the water molecules in the sample.
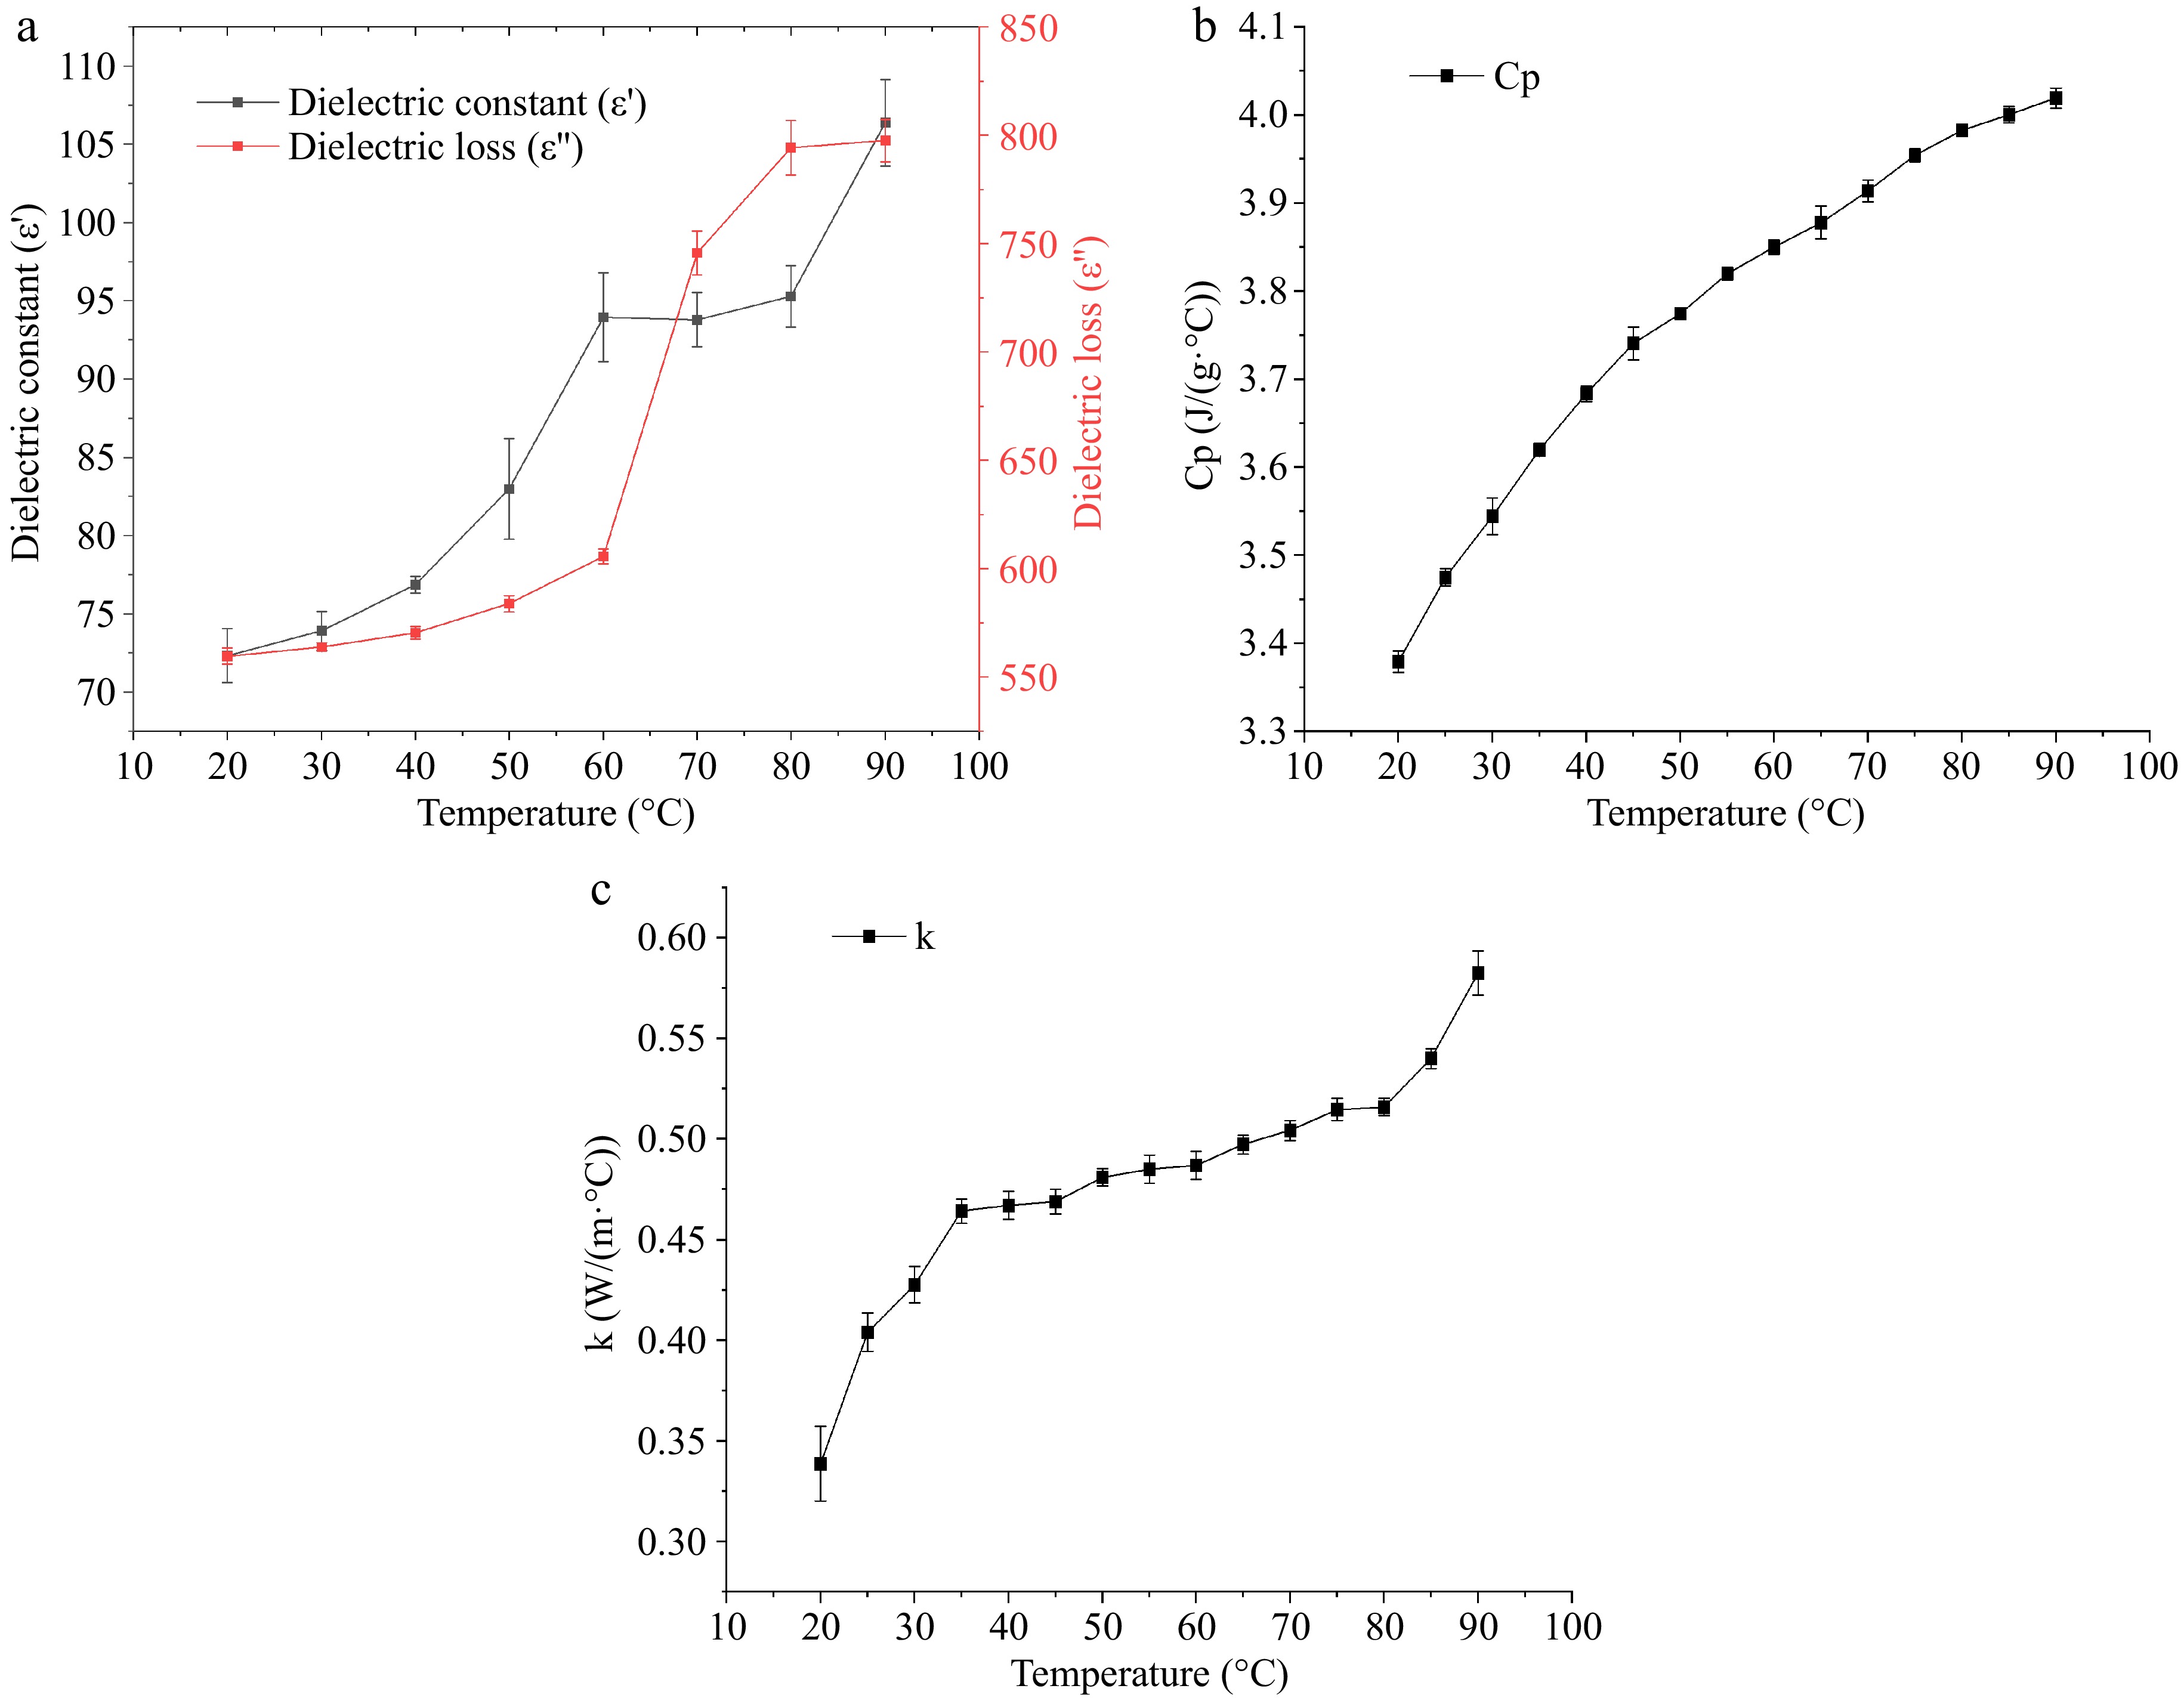
Figure 5.
The thermal and dielectric properties of surimi at 40.68 MHz within the temperature range of 20 to 90 °C: (a) dielectric constant (ε') and dielectric loss factor (ε"), (b) specific heat capacity, (c) thermal conductivity.
According to Fig. 5b, the Cp of the surimi increases steadily with the temperature between 20 and 90 °C. The maximum and minimum Cp values for the surimi are 3.38 and 4.01 J/(g·°C) respectively. This increasing trend in the Cp is similar to the values reported by Belibagli et al.[30]. The steady rise in the Cp with temperature can be attributed to the enhanced molecular motion within the surimi as the temperature increases, which requires more energy for the material to undergo a temperature change. This is typical for protein-based systems, where the Cp generally increases due to the increased thermal excitation of both the protein molecules and the water molecules at higher temperatures.
The k of surimi is shown in Fig. 5c. The k of surimi increases with temperature between 20 and 35 °C, rising rapidly in this range. It then stabilizes between 35 and 80 °C, before increasing again from 80 to 90 °C. The k values for the surimi range from 0.47 to 0.58 W/(m·°C). This behavior is likely attributed to the formation of a dense three-dimensional network structure within the surimi as the temperature increases. This network structure, which forms as proteins undergo thermal denaturation and cross-linking, fills some of the voids in the surimi, leading to a decrease in overall porosity[30]. During the initial stages of heating, the k of the sample increases rapidly with rising temperature because of its high water content. As the temperature rises and the surimi transitions into a gel state, the porosity inside the sample begins to decrease, which increases the contribution of gases to the k, thus slowing the rate of increase in k[31]. However, as the temperature continues to rise beyond 80 °C, the gel structure within the surimi gradually stabilizes, leading to more continuous heat transfer paths within the sample. Additionally, the enhanced molecular activity of water molecules in the higher temperature environment contributes to an acceleration of the increase in the k, as more energy is transferred through the water molecules.
Model validation
-
Table 3 compares the temperature distributions on the surface and cross-section obtained through experimental and simulation methods. The results demonstrate that the temperature distributions, as predicted by the COMSOL simulation, align closely with those observed using infrared thermal imaging. Both the simulated and experimental temperature profiles exhibit consistent patterns, with similar distributions of hot zones, hot spots, and cold points. In the experimental results, the temperature at the surface hot spot was measured at 83.0 °C, while the cold spot temperature was recorded at 50.1 °C. At this point, the simulated surface hotspot temperature was 88.6 °C, and the surface cold spot temperature was 48.9 °C. These measurements indicate that the simulation closely replicates the experimental data, with only slight differences in temperature.
Table 3. Comparison of experimental and simulated temperature distributions after RF heating.
Side surface Longitudinal cross-sectional surface Experiment 


Simulation 


It is manifested that the highest temperature is located at the point where the long axis of the cylindrical surimi sample is oriented towards the lower plate of the RF heating cavity. Conversely, the lowest temperature occurs at the top portion of the sample. This temperature gradient can be attributed to the placement of the surimi on the bottom electrode. This results in more efficient heating at the bottom of the sample, while the upper section receives less electromagnetic energy. This phenomenon is similar to the results of other studies[20,32,33]. In addition, during the heating process, the sample underwent deformation, with both ends bulging outward, which also resulted in a lower temperature at the upper part of the sample. The change in shape alters the surface area and geometry exposed to the RF field, which in turn affects the heating efficiency, particularly at the top portion of the sample.
Figure 6 shows the heating curves from both simulation and experiment. The results show that the central heating rate of the sample obtained from the experiment closely matches the trend of the simulation results. The minor discrepancies between the simulation and experimental results may be attributed to measurement errors in the dielectric and thermal properties. Additionally, it is possible that the optical fiber sensor was not in perfect contact with the sample at all times, leading to slight deviations in the recorded temperature readings. A similar observation was noted in the study by Chen et al.[10].
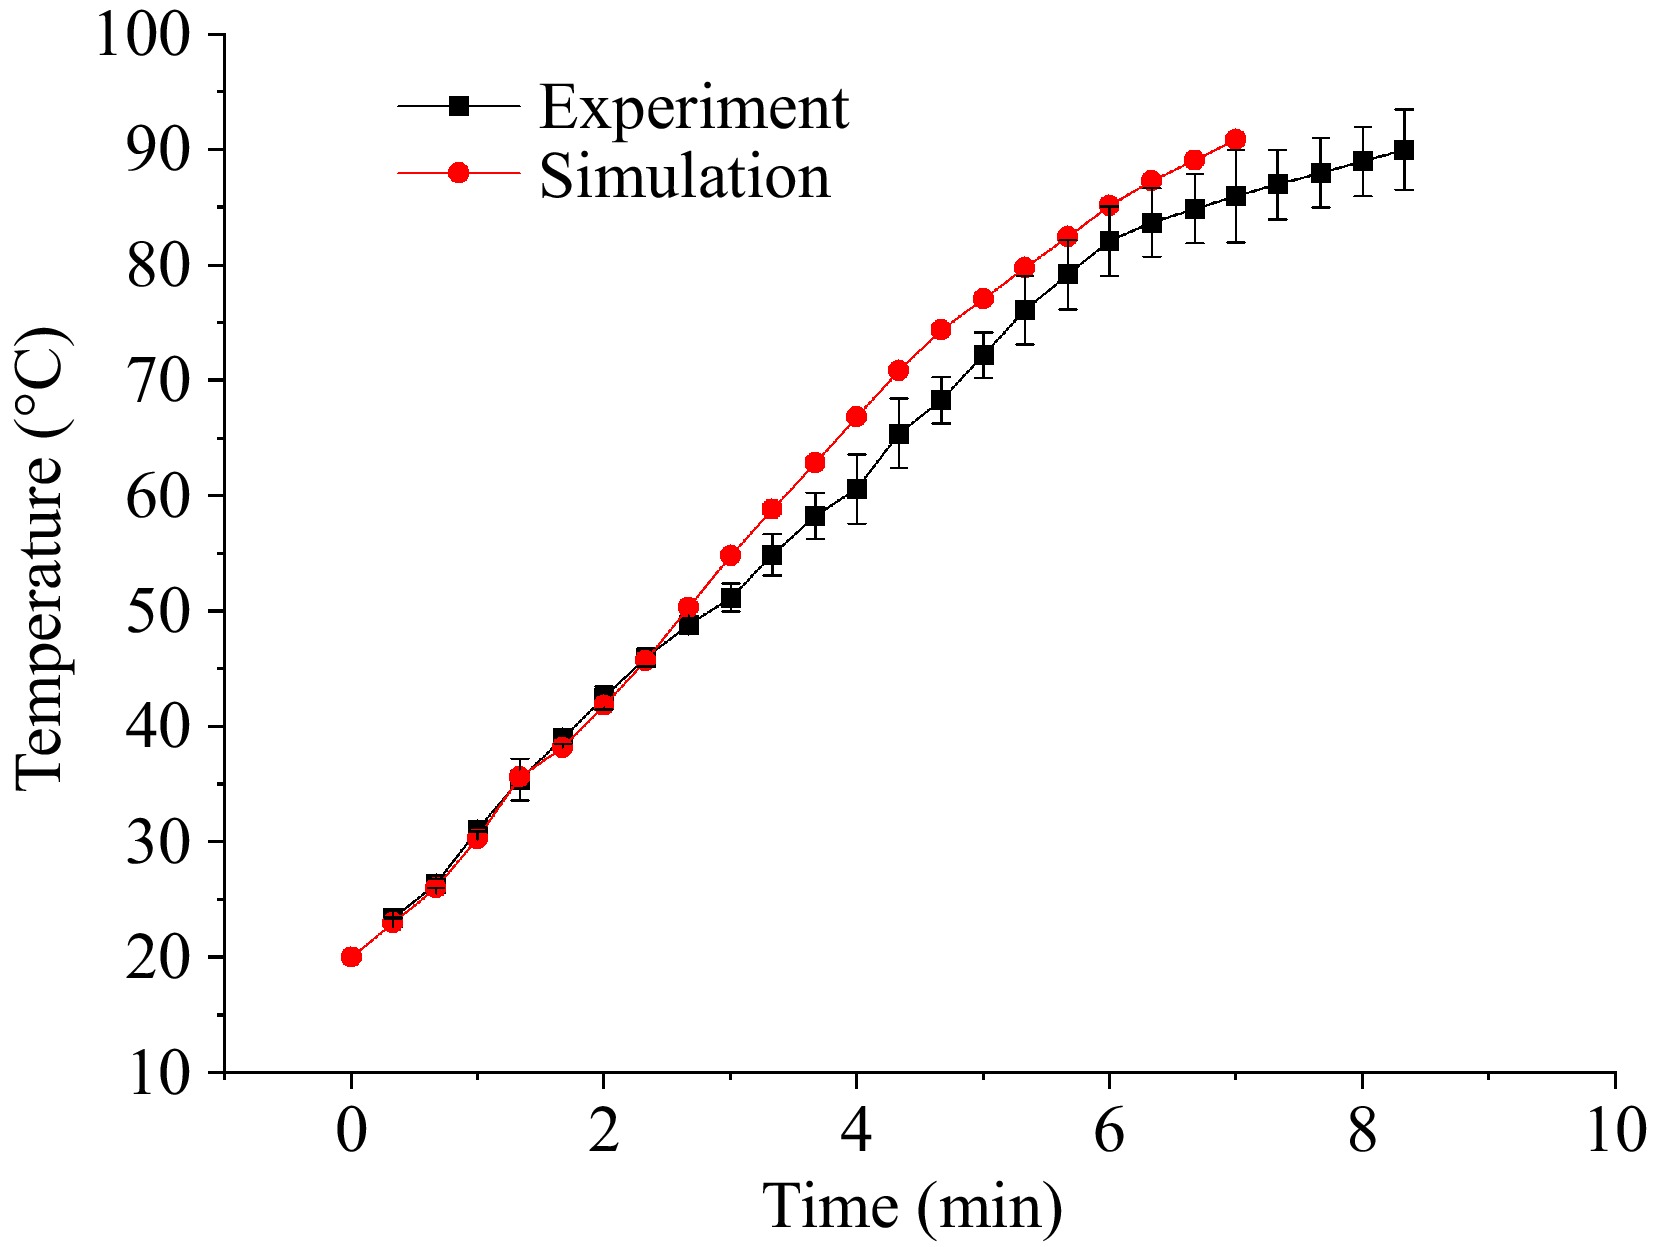
Figure 6.
Comparison of temperature curve from experiment and simulation under RF heating.
The overall trend of the simulation results closely matches the experimental data, with the temperature distributions from both methods showing strong agreement. The difference between the simulated and experimental values is consistently within 5.6 °C, indicating a high level of accuracy and reliability in the simulation model. The strong correlation between the simulated and experimental results supports the use of this model for predicting the RF heating behavior of surimi in future studies.
Analysis of uniformity of surimi with different internal densities heated by RF
Electric field distribution
-
Figure 7 presents the EFI within the RF cavity during the heating process of 3D-printed surimi samples. From the figure, the EFI at both ends of the sample is relatively high, with the intensity at the lower end exceeding that at the upper end. This behavior is typical in RF heating systems, where the EFI tends to be stronger near the electrodes[33]. Compared to the EFI in the surrounding environment, the intensity inside the sample is lower. For the surimi sample with a 60% infill density, the highest EFI is observed at the bottom end of the sample, reaching 1.24 × 10⁵ V/m, while the lowest intensity is found in the middle section, where it measures 799 V/m.
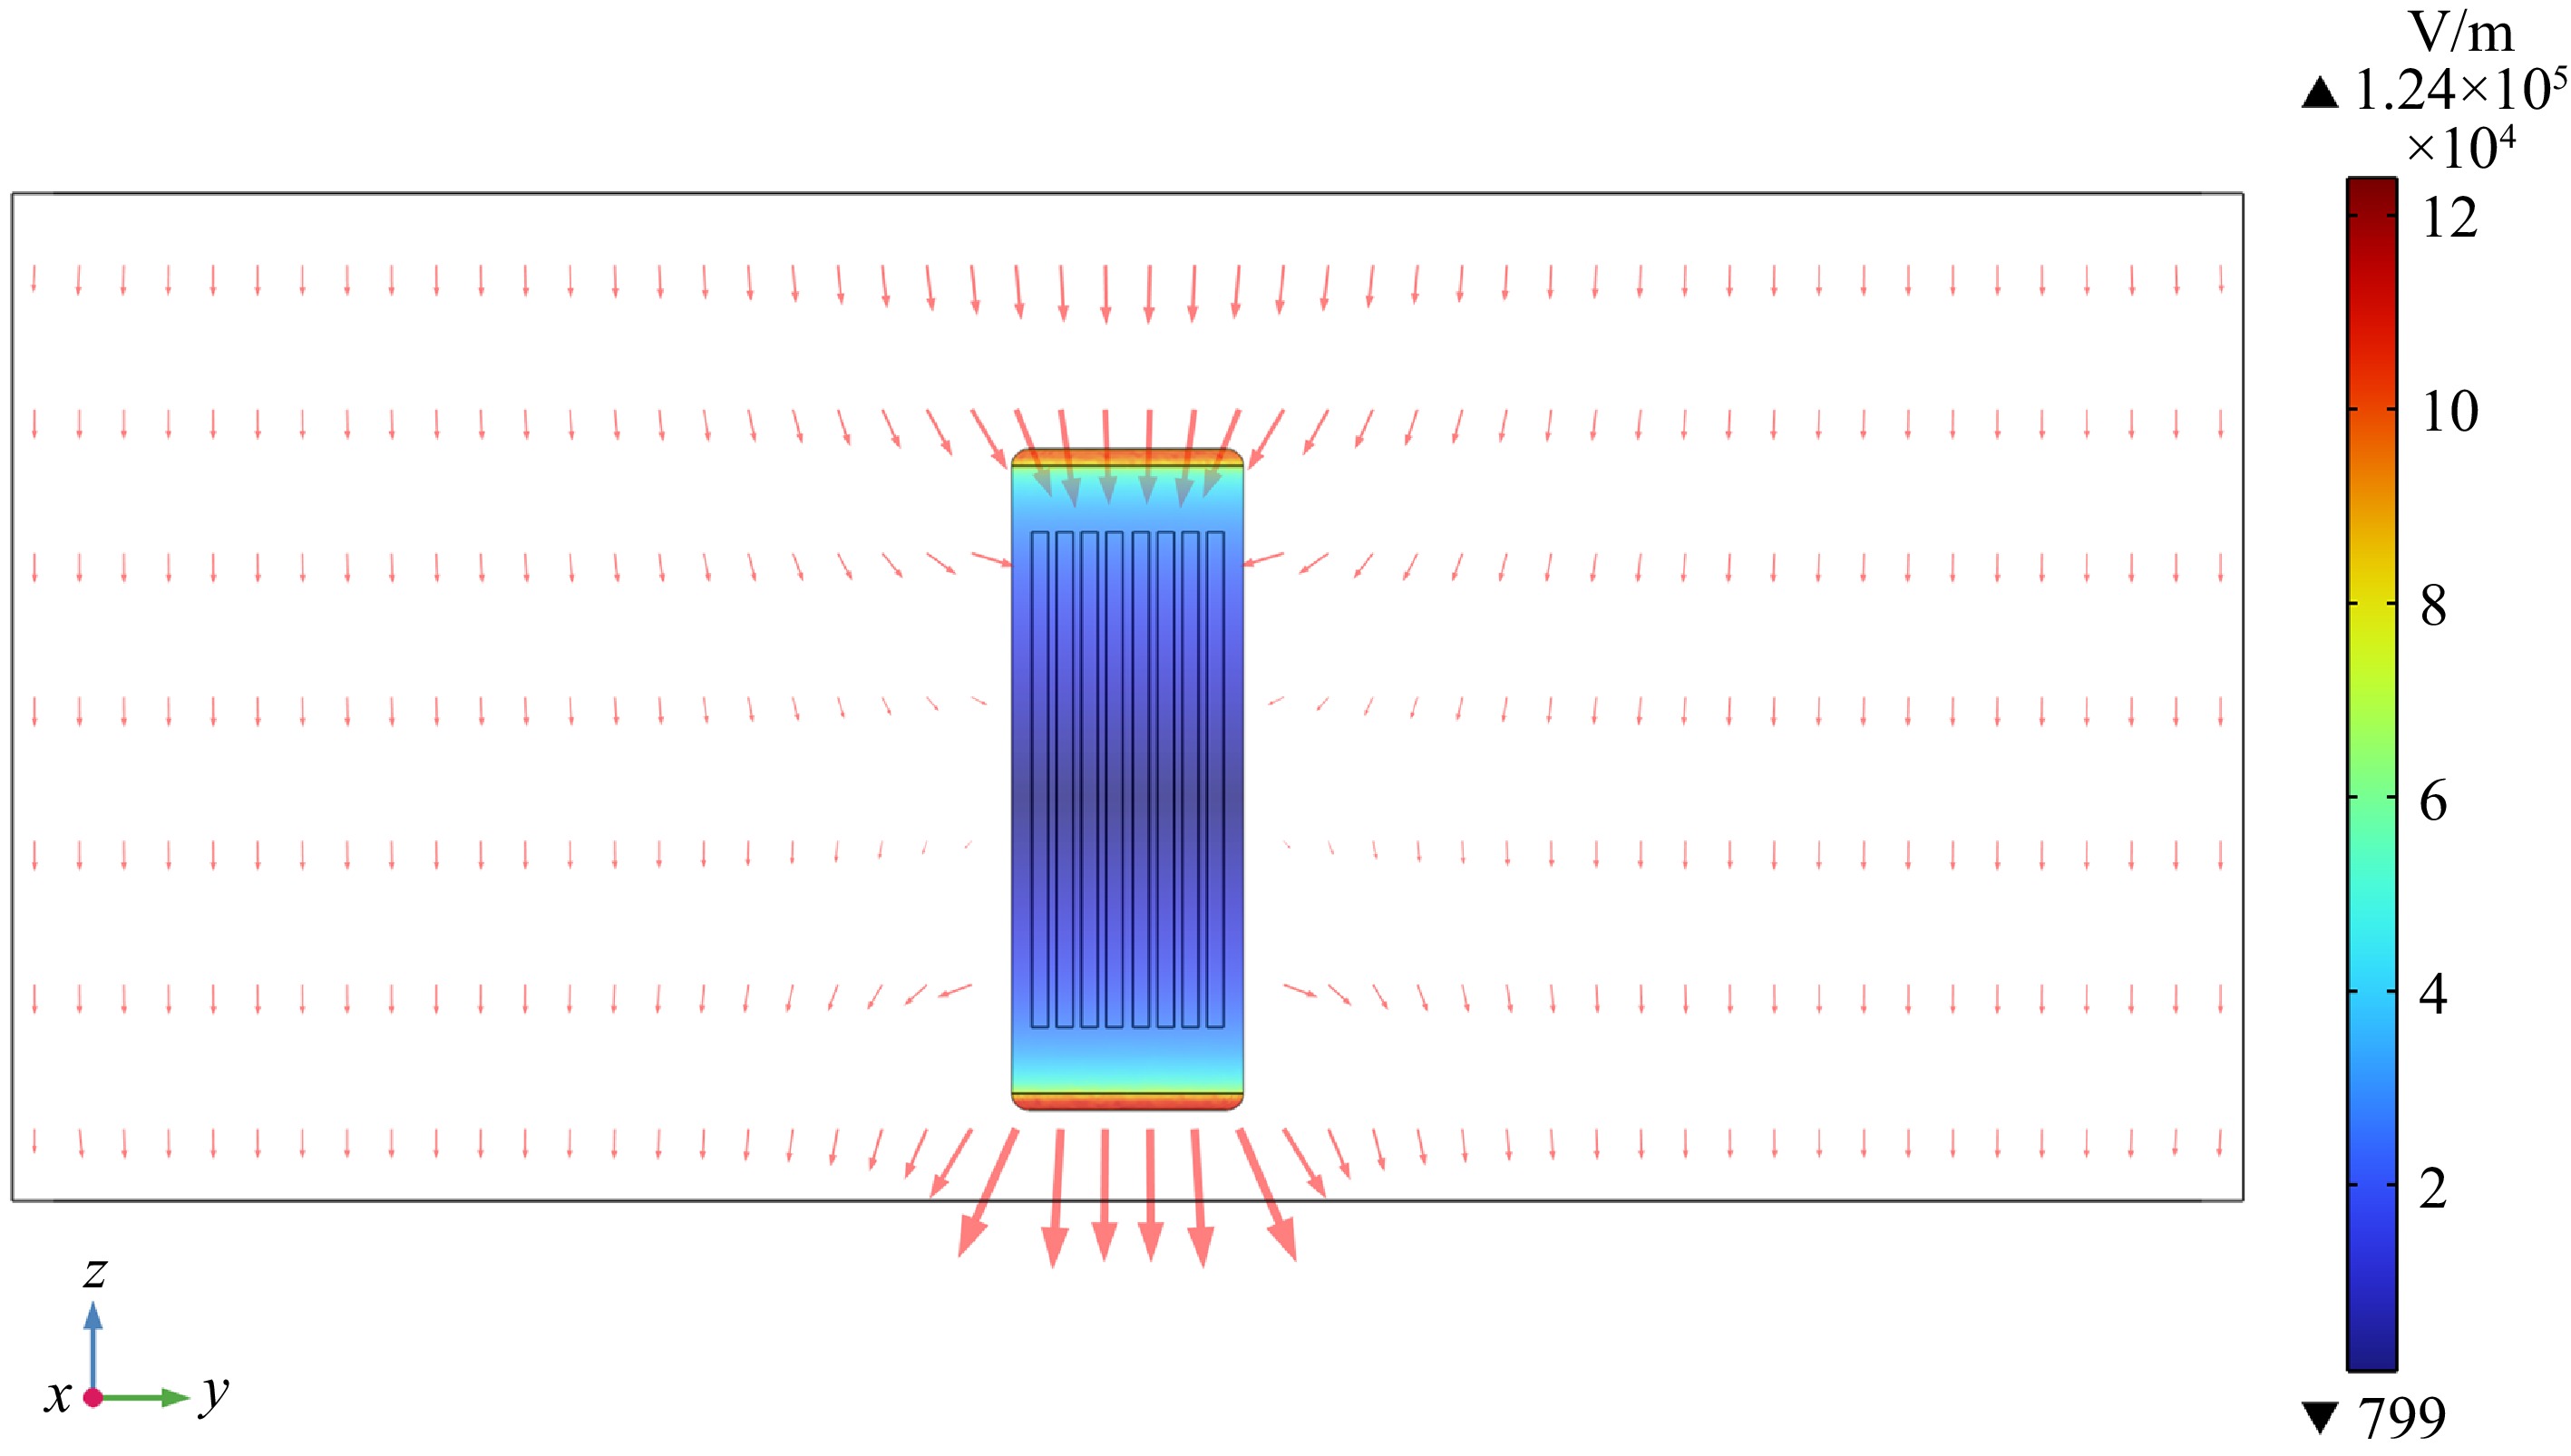
Figure 7.
The electric field intensity within the cavity during the RF heating process of the surimi samples.
Figure 8 shows the internal and surface EFI of the surimi samples with different filling densities during the RF heating process. All surimi samples displayed similar surface EFI, characterized by higher EFI at the edges and ends of the sample, and lower intensity in the middle. This phenomenon, where energy absorption at the edges and corners of the sample is greater than at the center, is referred to as the corner effect. Although the EFI varied across different infill densities, the overall differences were not significant, with the maximum value being 1.61
$ \times $ 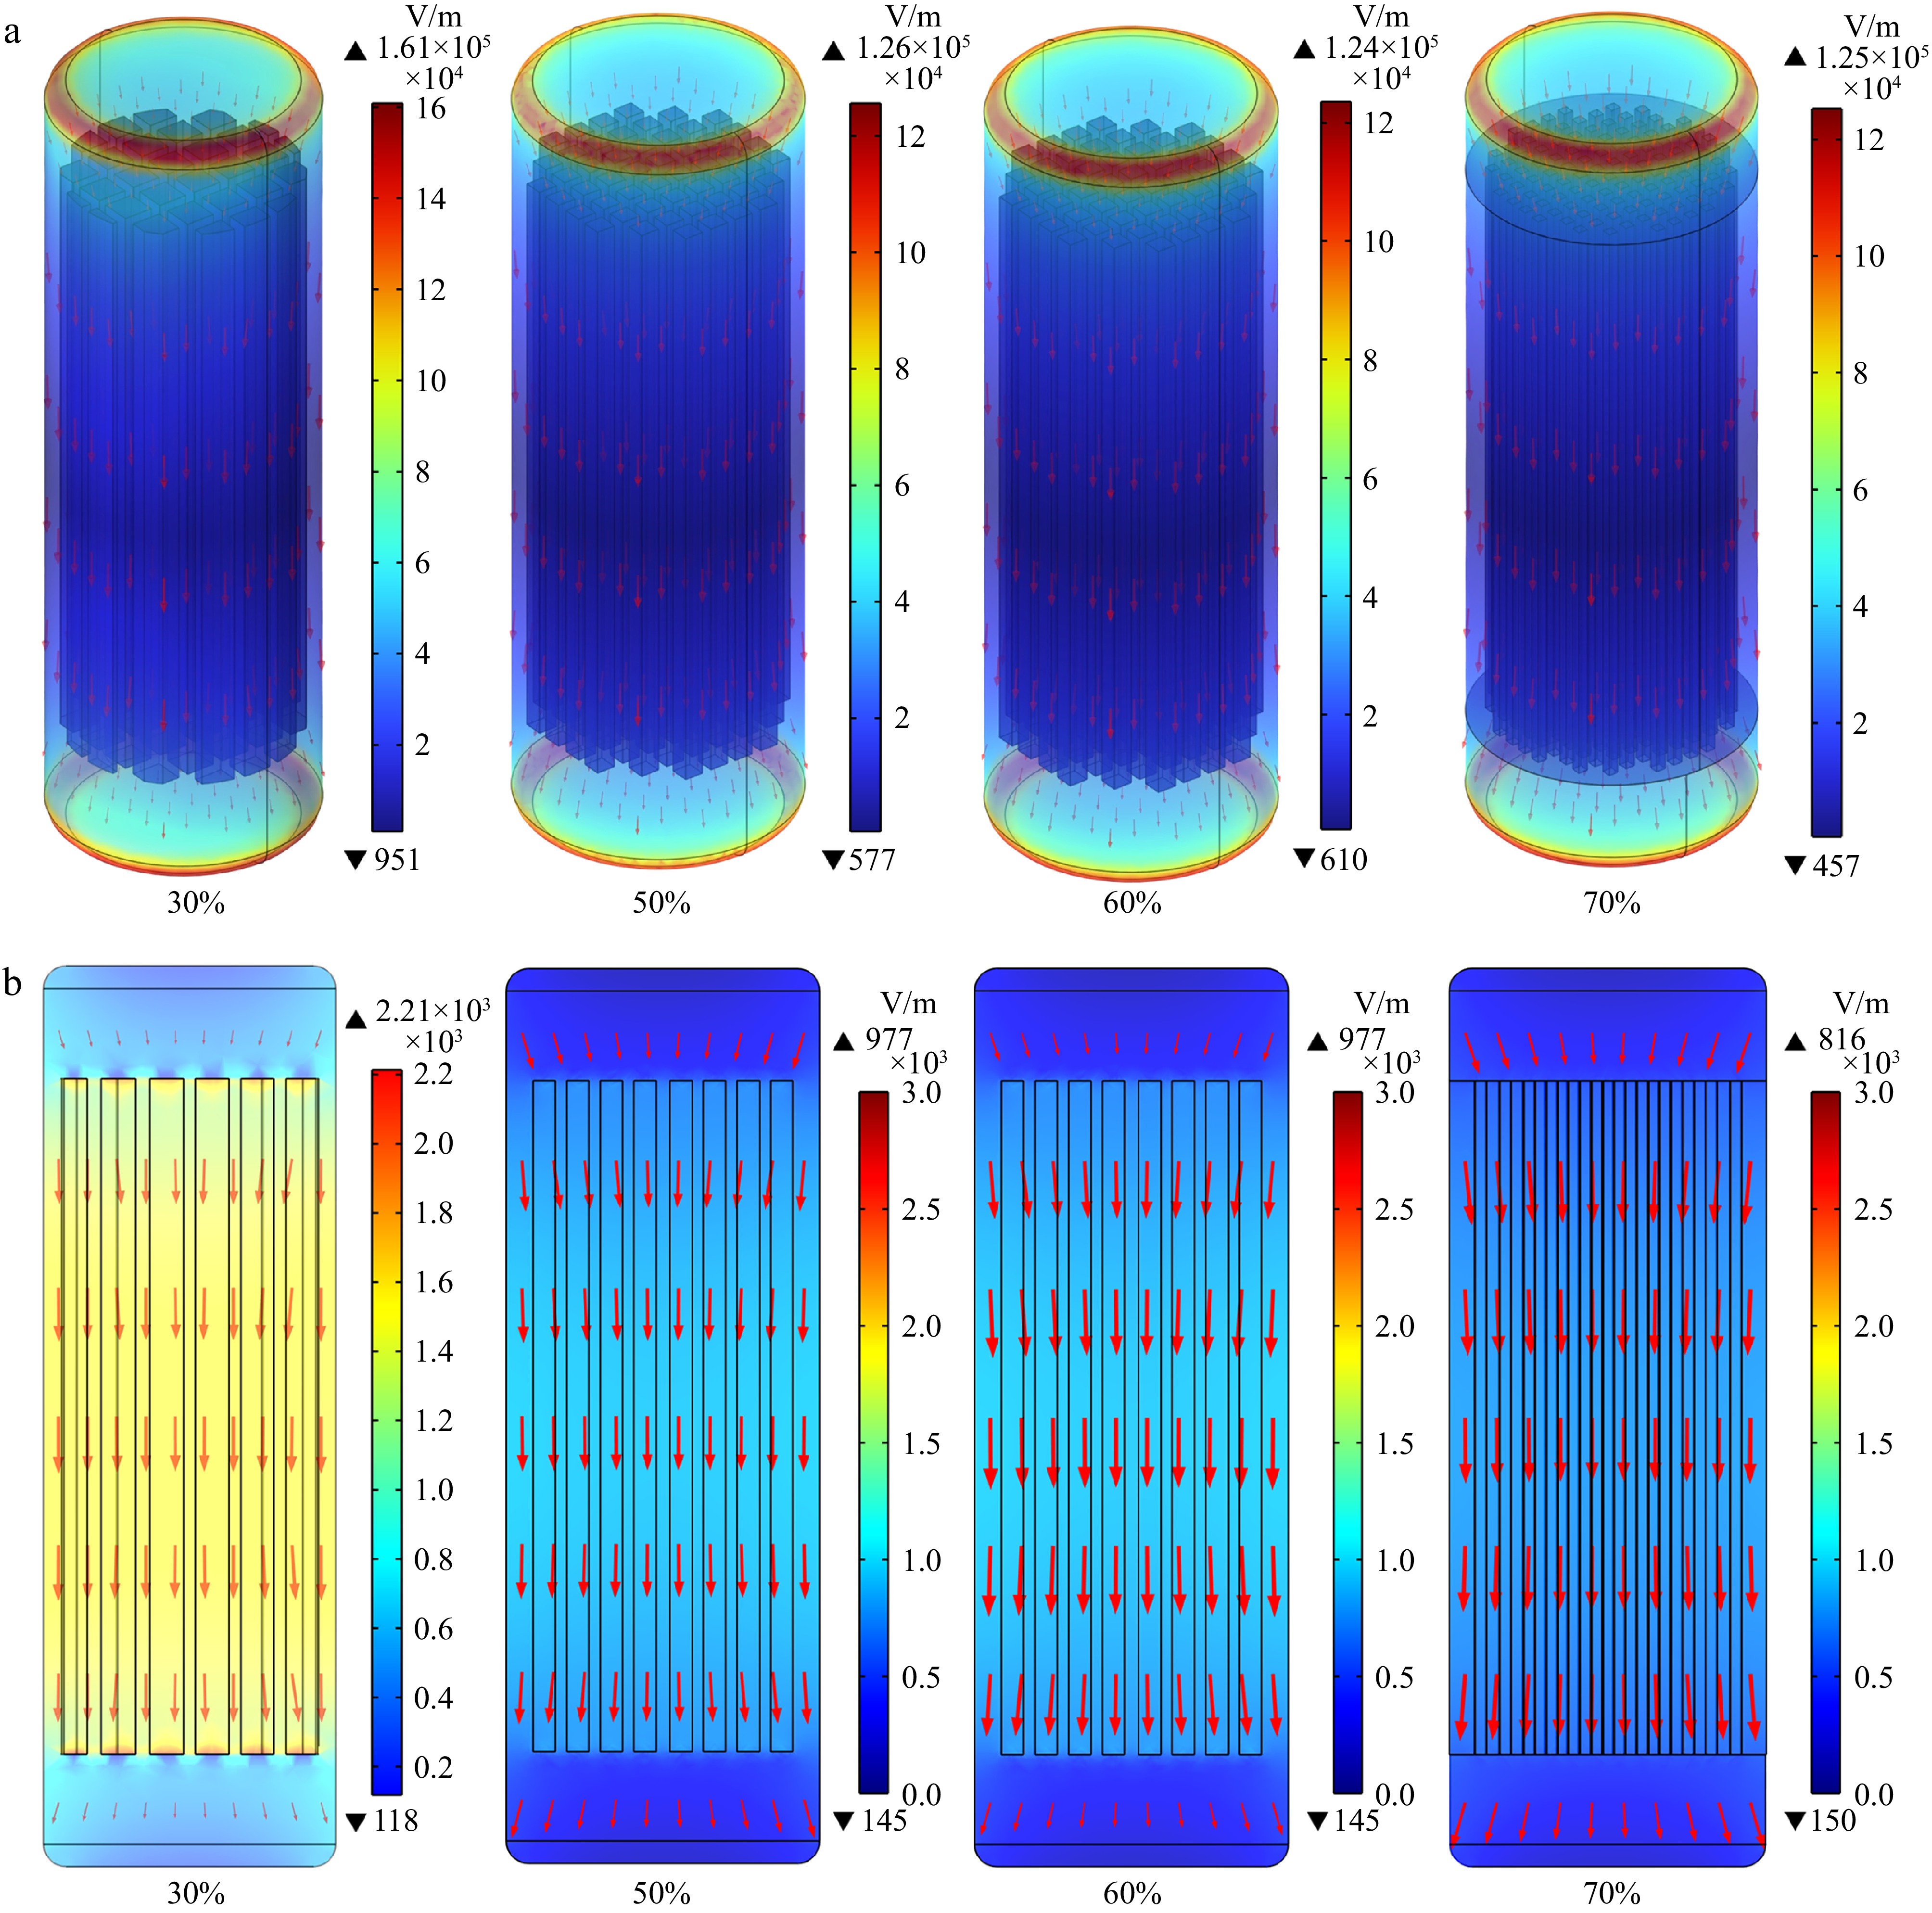
Figure 8.
The electric field distribution in the surimi with different infill density of RF heating: (a) surface, (b) cross-sectional.
However, the internal EFI varied considerably depending on the infill density. For surimi samples with different infill densities, the internal EFI showed considerable variation. This pattern is likely attributed to the presence of more air domain in the middle section, where the dielectric properties of air differ significantly from those of the sample, resulting in a higher EFI.
Among the four infill densities, the surimi sample with 30% infill density showed the most uneven electric field distribution, with a significant difference between the two ends and the middle section. Its maximum EFI was 2.21 × 10⁵ V/m, and the minimum value was 118 V/m. On the other hand, the surimi sample with a 70% infill density exhibited the most uniform EFI, with a maximum EFI of 816 V/m and a minimum EFI of 150 V/m. Additionally, at the edge positions where the top and bottom surfaces of the surimi sample meet the side surfaces, the deflection angle of the electric field was the largest. As the distance to the center axis decreased, the distribution of EFI became more evenly distributed, which aligns with the earlier observation that EFI is highest at the corners and edges of the sample.
Figure 9 shows the EFI inside the surimi sample at different times during the RF heating process. Taking the surimi sample with a 60% filling density as an example, the EFI inside the sample gradually decreases as heating progresses. The maximum EFI drops from 977 to 801 V/m, while the minimum intensity decreases slightly from 145 to 142 V/m. This change could be due to significant variations in the dielectric properties of the sample with increasing temperature, which reduces the sample's ability to attract the electromagnetic energy.
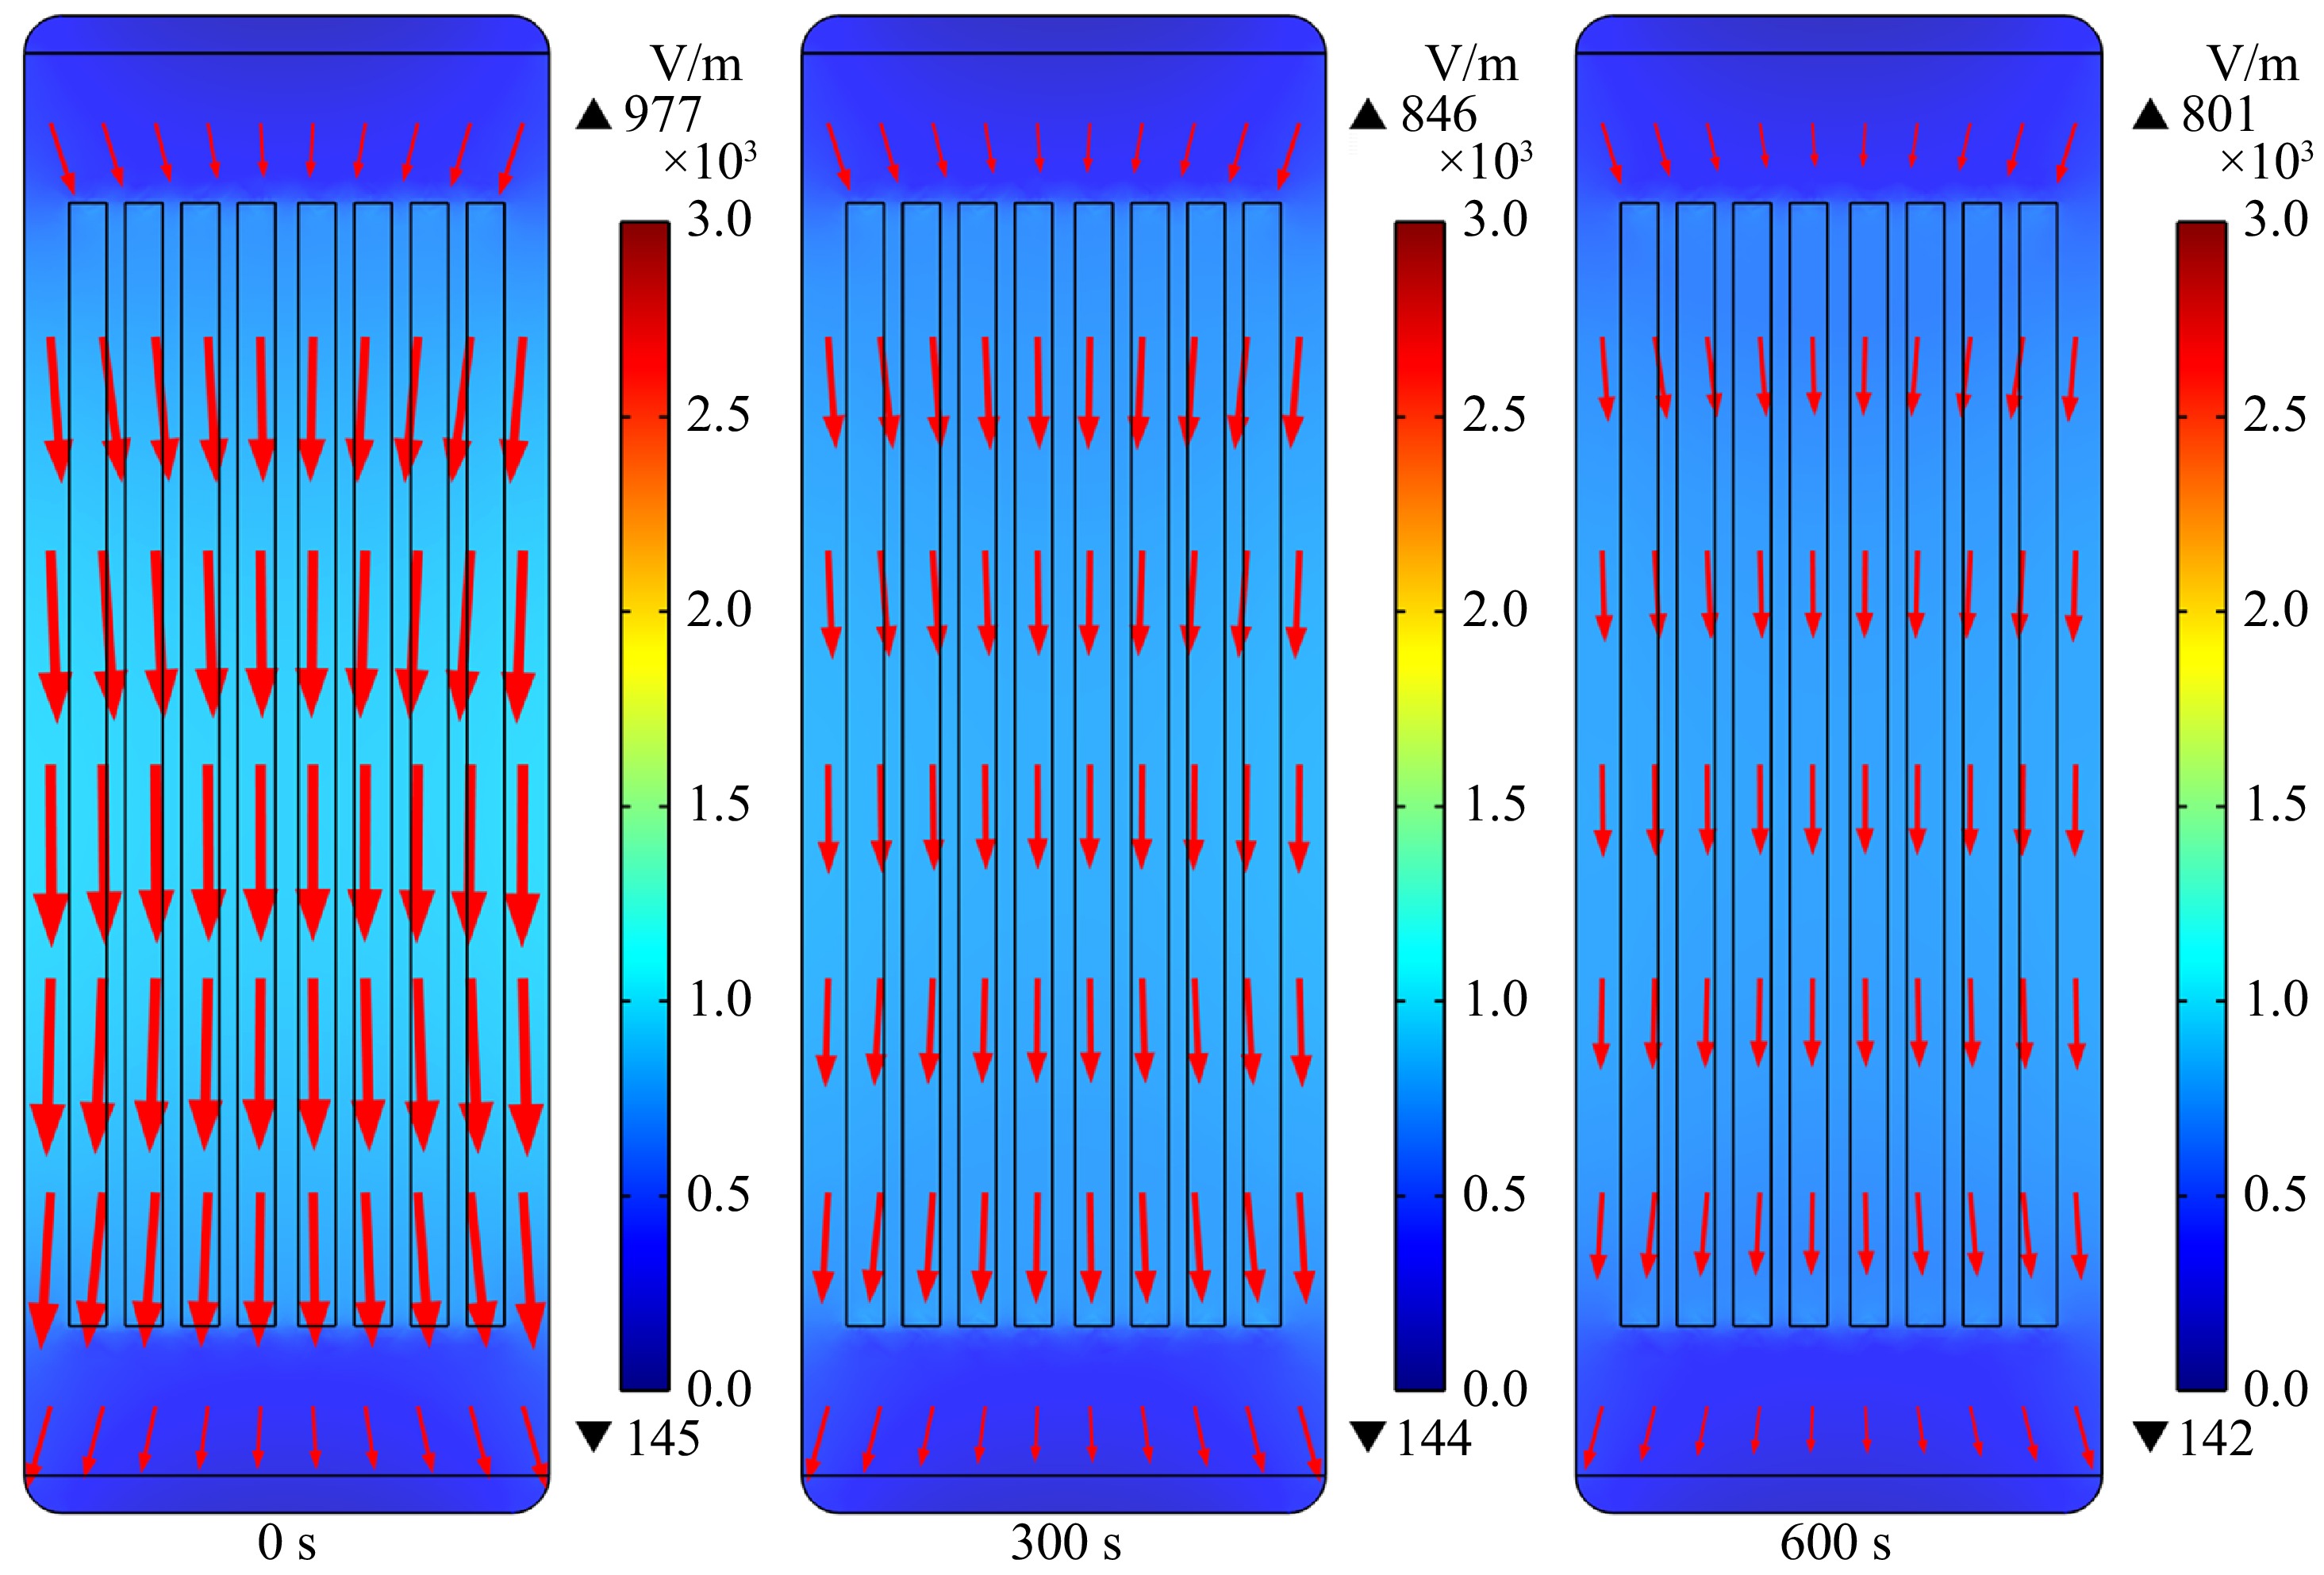
Figure 9.
The electric field intensity in the cavity and within the sample at different times during the RF heating of 3D printed surimi.
Temperature distribution
-
Table 4 shows the temperature distribution of cylindrical surimi samples with different filling densities after RF heating. In the infrared image, it can be seen that the temperature of the optical fiber insertion position is higher than that around. This is due to the different dielectric properties of the two materials, resulting in a phenomenon similar to the edge effect. The cold point temperatures of cylindrical surimi with a filling density of 30%, 50%, 60%, and 70% after RF heating are 42.5, 53.1, 60.7, and 61.0 °C, respectively.
Table 4. Comparison of experimental and simulated temperature distributions at different infill densities after RF heating.
Infill density Experimental temperature gradient Simulated temperature gradient Temperature Uniformity Index (TUI) 30% 


0.308 50% 

0.245 60% 

0.191 70% 

0.198 The TUI of the samples after RF heating is shown in Table 4. A lower TUI value indicates better temperature uniformity, as it reflects a smaller deviation from the target temperature within the sample. Overall, the RF heating uniformity for 60% and 70% infill densities is good, with TUI values of 0.191 and 0.198, respectively. In comparison, the TUI for the surimi sample with a 100% infill density is 0.239. Therefore, further increasing the infill density may not improve the heating uniformity. Additionally, it is observed that cylindrical surimi samples with higher infill densities require more time to reach the target temperature. The 60% and 70% infill density samples required 24.5 and 25.1 min, respectively, to achieve the target temperature.
-
This study uses COMSOL software to simulate the RF heating behavior of surimi samples with different infill densities, exploring the impact of the internal structure on the uniformity of RF heating. By substituting the thermal and dielectric properties of surimi, an RF heating model of cylindrical surimi gel was established. Experimental validation showed that the simulated results closely match the surface temperature distribution and infrared thermal images of the cylindrical surimi samples with 100% infill density subjected to RF heating.
The RF heating simulation results for surimi with varying infill densities show a distinct spatial variation in electric field intensity (EFI). For the same outer diameter, the EFI is higher at both ends and corners of the cylindrical sample, while it is lower in the middle. As the infill density of the sample increases, the EFI inside the sample decreases, while the EFI uniformity becomes more uniform. Additionally, as the RF heating process progresses, the EFI inside the sample also decreases. Correspondingly, the heating rate and temperature distribution varied as well. When the infill density of the cylindrical sample is 60% and 70%, the TUI index values are 0.191 and 0.198, respectively, indicating good heating uniformity, though the heating time is extended.
-
In this study, water content variation in the surimi samples and the shape deformation during the heating process were not investigated due to the short heating time. In future research, it may be necessary to incorporate relevant modules to improve the accuracy and applicability of the model, with updated physical properties linking both temperature and water content.
The author acknowledges the China National Science Foundation (31801613) for its financial support in this research.
-
The authors confirm contribution to the paper as follows: experiment: Ou Y, Cao F, Li F; analysis and interpretation of results: Ou Y, Cao F; experimental design: Jiao Y, Shi H, Tang J; draft manuscript preparation: Ou Y, Jiao Y; funding acquisition: Jiao Y. All authors reviewed the results and approved the final version of the manuscript.
-
All data generated or analyzed during this study are included in this published article.
-
The authors declare that they have no conflict of interest.
- Copyright: © 2025 by the author(s). Published by Maximum Academic Press on behalf of China Agricultural University, Zhejiang University and Shenyang Agricultural University. This article is an open access article distributed under Creative Commons Attribution License (CC BY 4.0), visit https://creativecommons.org/licenses/by/4.0/.
-
About this article
Cite this article
Ou YZ, Cao F, Li F, Shi H, Tang J, et al. 2025. Electric field and heating uniformity of radiofrequency-induced gelation of 3D-printed fish mince with different infill densities: a computational study with experimental validation. Food Innovation and Advances 4(2): 138−148 doi: 10.48130/fia-0025-0015 

Electric field and heating uniformity of radiofrequency-induced gelation of 3D-printed fish mince with different infill densities: a computational study with experimental validation
- Received: 16 November 2024
- Revised: 04 January 2025
- Accepted: 18 February 2025
- Published online: 25 April 2025
Abstract: Surimi is a fish-based paste that has been extensively utilized in food 3D printing. By altering the structure design, and the infill density of 3D-printed samples, the internal structure and texture can be customized to suit specific preferences. Radio frequency (RF) technology enables fast, volumetric heating, which accelerates surimi gel formation. However, varying infill densities in 3D-printed food can result in different electric field distributions, thereby affecting the heating uniformity. Therefore, this study links the infill density of 3D-printed food with the electric field distribution and examines the heating uniformity of surimi samples with four selected infill densities. COMSOL Multiphysics software was utilized to establish an RF heating model for surimi samples. Experiments of surimi with 100% infill density subjected to RF heating were conducted to validate the model on temperature distribution. Modelling results showed good agreement with the experimental results, with a surface temperature difference of < 5.6 °C. The model was then applied to 3D-printed surimi samples with varying infill densities (30%, 50%, 60%, 70%). The results indicated that the electric field intensity (EFI) was greater at both ends of the sample and weaker in the middle. As the infill density increased, the internal EFI decreased, and the heating uniformity initially increased before decreasing at higher densities. The optimal heating uniformity was found at 60% and 70% densities, with TUI values of 0.191 and 0.198, respectively. This study offers valuable insights into optimizing RF heating and 3D printing for surimi products.
-
Key words:
- 3D printing /
- Computer simulation /
- Radio frequency /
- Gel formation /
- Heating uniformity