


-
Untargeted metabolomics is a powerful tool for the comprehensive analysis of metabolites in biological samples. Mass spectrometry, the most widely used technique in untargeted metabolomics, utilizes high-resolution mass spectrometry (HRMS) platforms such as QTOF and Orbitrap to provide comprehensive compositional information. For fruit and vegetable samples, LC-HRMS serves as the analytical platform, offering high selectivity, sensitivity, and accuracy. This provides a robust foundation for exploring unique small-molecule compounds in food[1,2]. However, the ultimate goal of fully identifying and quantifying all metabolites in a single or a few analytical runs has yet to be achieved[3]. To improve the quantity and accuracy of metabolite analysis, researchers are increasingly focusing on optimized extraction methods, diverse chromatography-mass spectrometry techniques, and reliable, efficient analytical tools.
Fruits and vegetables are rich in various small molecules, including amino acids, peptides (oligopeptides, polypeptides), sugars (such as monosaccharides, disaccharides, and oligosaccharides), lipids, vitamins, phenolic compounds (such as phenolic acids, flavonoids, and isoflavones), and terpenes[4,5]. These compounds exhibit significant differences in polarity, making the polarity of the extraction solvent a critical factor in determining the extraction range. Common solvents include organic-aqueous mixtures containing methanol, acetonitrile, and/or formic acid, which offer good solubility for polar and semi-polar small molecules[6]. Recently, hydrophilic interaction chromatography (HILIC) has been employed to enhance the separation and retention of strongly polar compounds[7,8], but its analytical application for strongly polar small molecules from fruits and vegetables remains underutilized. Our research group has expanded on this by incorporating C18 and HILIC columns to enhance the separation efficiency of polar compounds[5]. Additionally, lipidomics research has become increasingly extensive, particularly in the investigation of human diseases and drug development[9,10], and it is equally important to explore plant-derived functional lipids. Certain fruits and vegetables are rich in lipids, some of which possess unique physiological functions[11,12]. Our group used lipidomics to identify beef from different origins, and explored the difference of DART-QTOF and LC-ESI-QTOF in searching for differential lipids[13]. It is worth noting that lipids in fruits, vegetables, and their products have not been studied in depth.
Effective analytical tools and databases are indispensable for compound annotation. MS-DIAL and MetaboAnalystR, two of the most widely used open-source tools in metabolomics, offer convenient and effective solutions for compound annotation. MS-DIAL is a versatile program designed for untargeted metabolomics, with a primary focus on raw spectral processing[14]. MetaboAnalyst, one of the most popular web-based metabolomics platforms, integrates raw spectral processing, statistical and functional analysis, and multi-omics integration to provide a highly automated workflow[15,16]. Their corresponding MetaboAnalystR packages can also be run locally for large-scale spectral processing[17]. With advancements in omics technology, large open-source databases such as HMDB, MassBank, and MoNA are continually improved. The inclusion of standard validation data from researchers worldwide, along with the rapid development of in silico prediction based on deep learning, has significantly increased the number of compounds in these databases as well as the accuracy of their spectra. In fact, different databases may hold unique information on specific substances, so integrating multiple databases for compound annotation can improve analytical efficiency[1]. However, using multiple databases sometimes complicates accurate annotation, potentially leading to an increase in false positive rates.
While finding some use in food analysis, these technologies are systematically applied mainly in biomedicine; their broader potential in the food sector has yet to be fully realized. The diversity in the classification and physicochemical properties of these compounds—such as polarity, solubility, and interaction with stationary and mobile phases—necessitates the use of multiple extraction and separation methods. Relying on a single method is insufficient to comprehensively cover the range of small molecules present in these matrices. In our strategy, we propose the use of different extraction methods targeting polar, semi-polar, and lipid fractions with solvents like water, methanol-water mixtures, and chloroform-methanol mixtures, respectively. These extracts are then subjected to chromatographic separation using both HILIC and C18 columns, tailored with specific mobile phases optimized for each extract of compounds. Finally, to enhance the annotation process, we integrate multiple databases such as MONA, MassBank, HMDB, and LipidBlast, employing various analytical tools to synergize the metabolomic data. This 'Divide, Conquer, and Integrate Strategy'—separating the complex mixture into more manageable fractions before comprehensive analysis—ensures a more complete and systematic annotation of small molecule compounds in fruits and vegetables. This protocol aims to provide a detailed description of this strategy, offering a robust framework for improving annotation coverage in untargeted metabolomics studies of fruit and vegetable matrices. Figure 1 shows an effective flowchart from sample preparation to annotation analysis in the protocol.
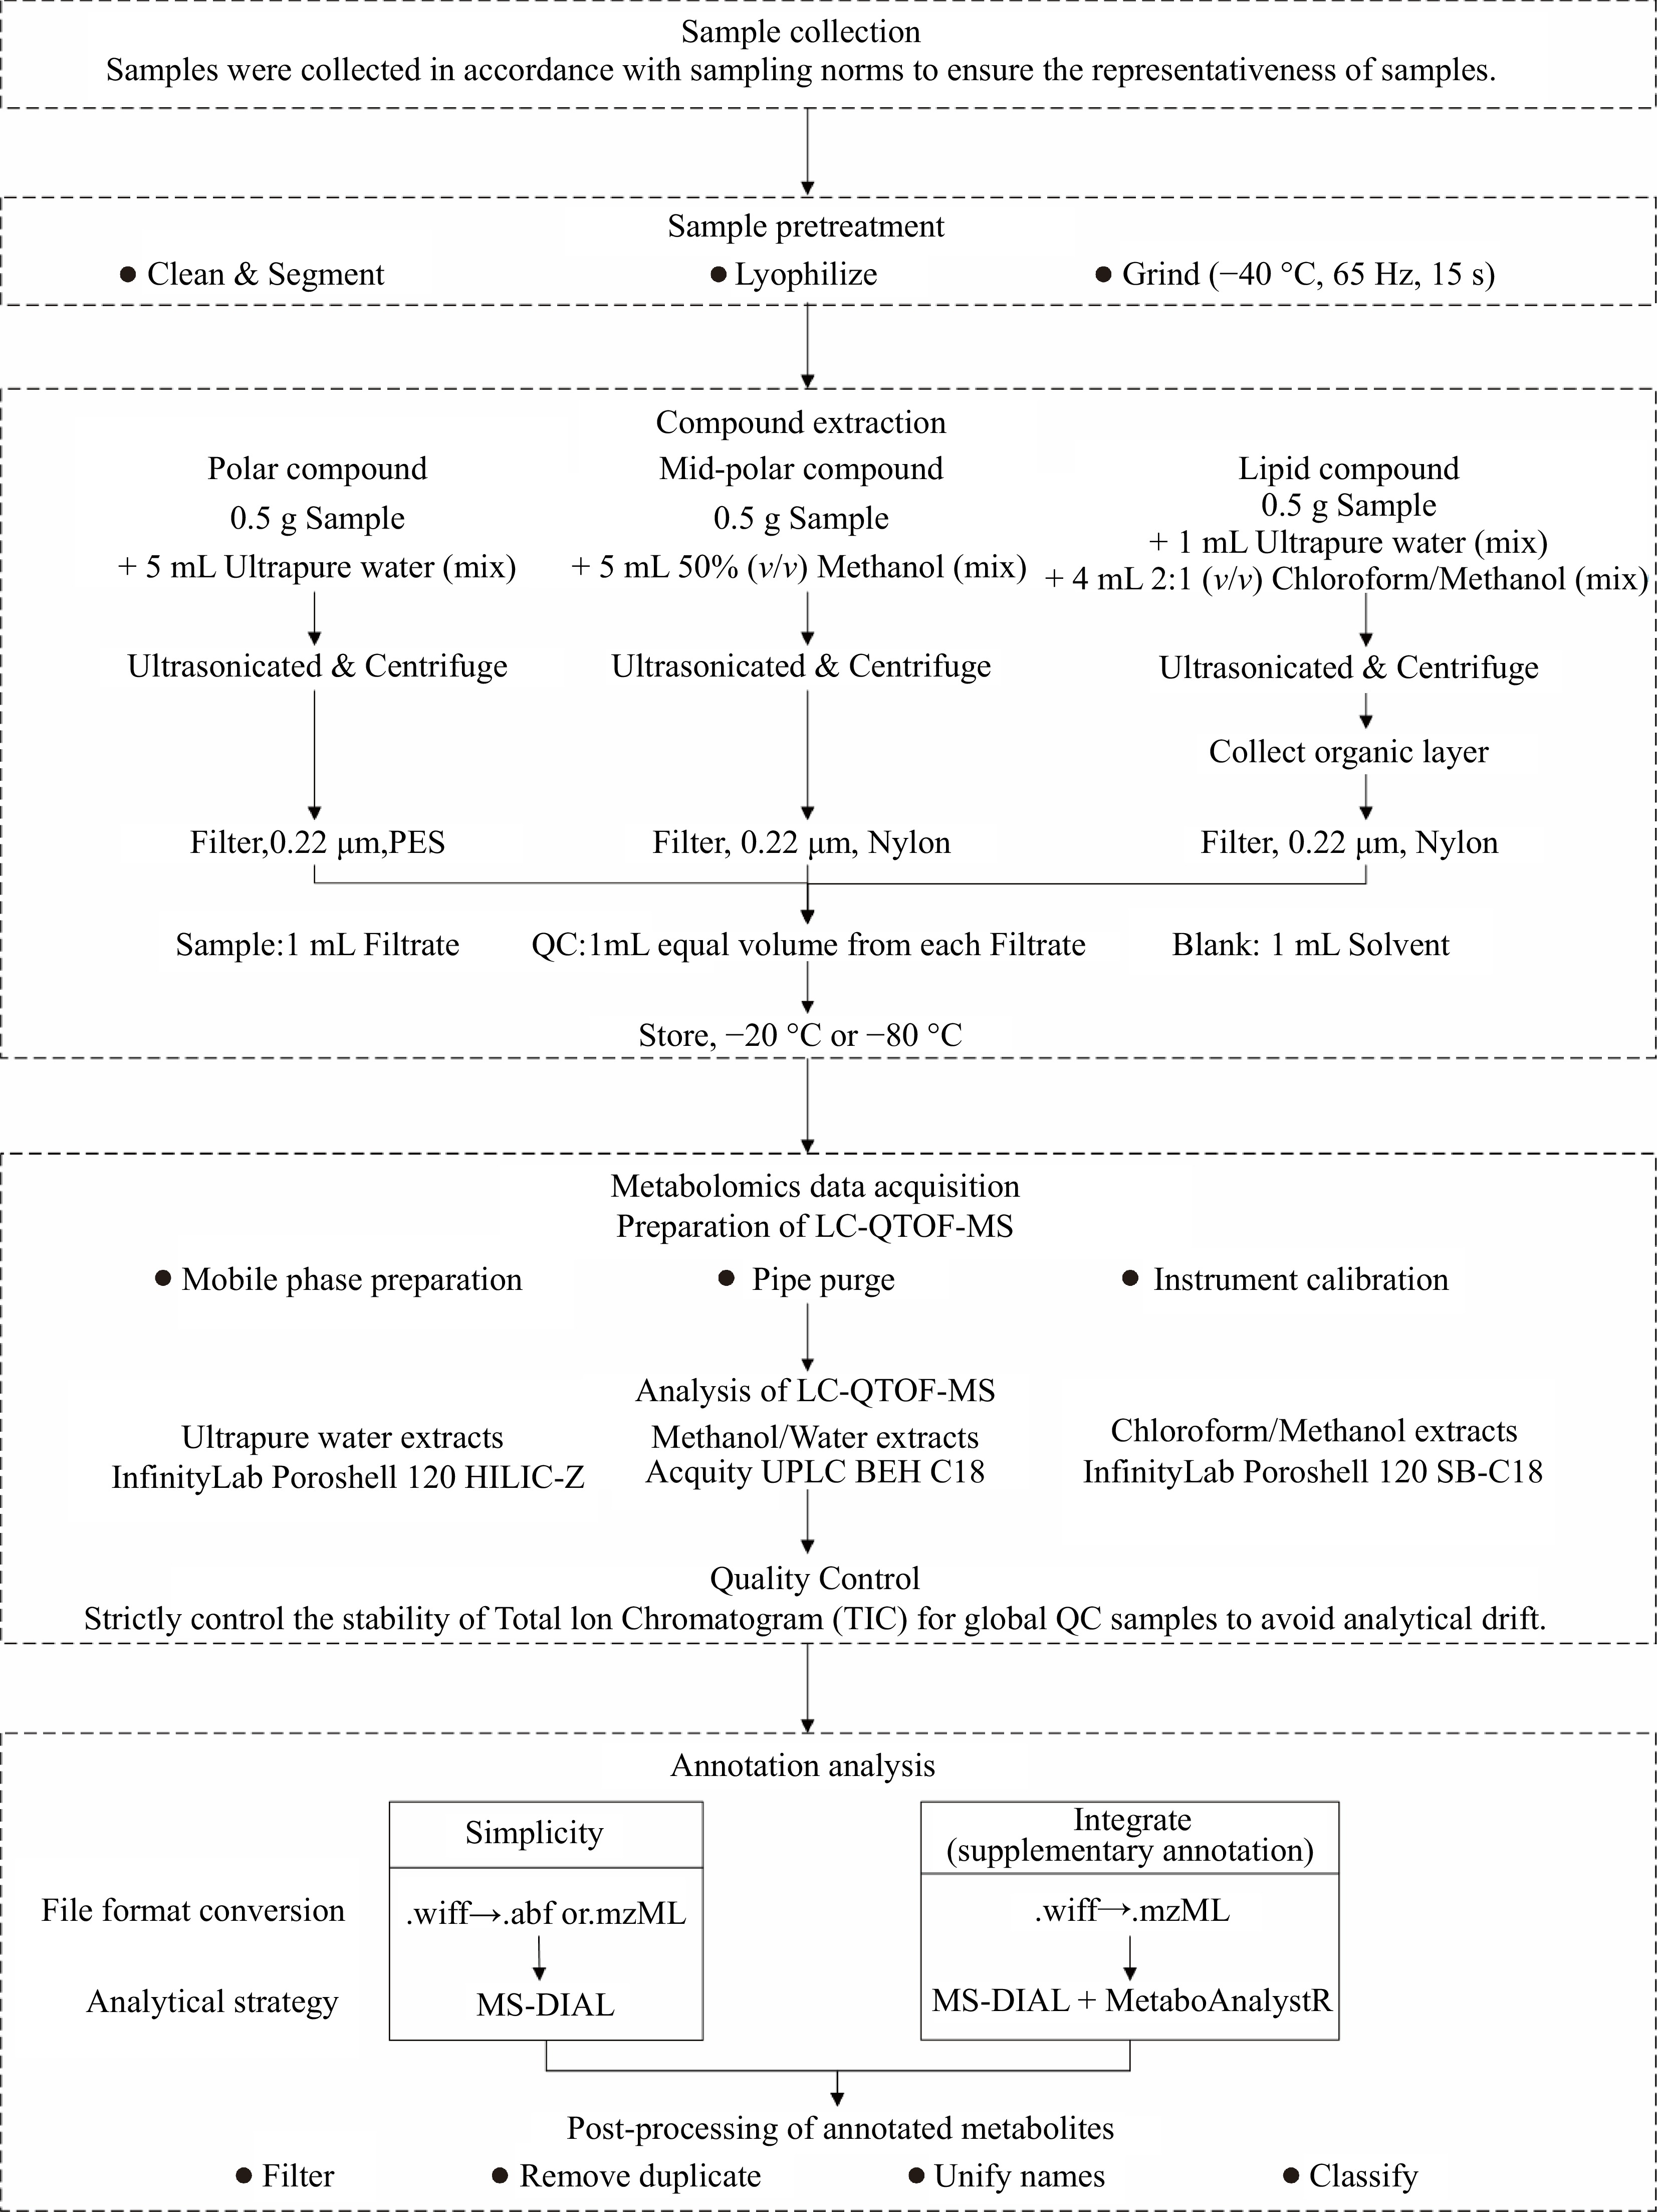
Figure 1.
Flowchart of metabolomics analysis for high annotation coverage of metabolites in fruits, vegetables, and their products.
-
● Ultrapure water, generated by a Milli-Q system (Millipore, Billerica, MA, USA) or similar
● LC/MS-grade methanol (Thermo Fisher Scientific, Waltham, MA, USA)
● LC/MS-grade acetonitrile (Thermo Fisher Scientific, Waltham, MA, USA)
● LC/MS-grade isopropanol (Thermo Fisher Scientific, Waltham, MA, USA)
● HPLC-grade formic acid (DIKMA, Beijing, China)
● AR-grade chloroform (Aladdin, Shanghai, China)
● AR-grade ammonium acetate (Aladdin, Shanghai, China)
Chromatographic materials and other consumables
-
● Acquity UPLC BEH C18 column (2.1 × 100 mm, 1.7 μm; Waters, Milford, MA, USA)
● InfinityLab Poroshell 120 HILIC-Z column (3.0 × 100 mm, 2.7 μm; Agilent, Santa Clara, CA, USA)
● InfinityLab Poroshell 120 SB-C18 column (2.1 × 100 mm, 2.7 μm; Agilent, Santa Clara, CA, USA)
● Pipettes (Eppendorf, Hamburg, Germany) and tips (Axygen, Silicon Valley, CA, USA)
● Centrifuge tubes (Axygen, Silicon Valley, CA, USA)
● Brown autosampler vials (Titan, Shanghai, China)
● 0.22 μm PES membrane filters (Jin Teng, Tianjin, China)
● 0.22 μm nylon membrane filters (Jin Teng, Tianjin, China)
Laboratory equipment
-
● −80 °C refrigerator (DW-86L 726G, Haier Biomedical, Qingdao, Shandong, China)
● Vacuum freeze dryer (LG-03, Song Yuan, Beijing, China)
● Freeze grinder (Xinyi-24N, Xinyi, Ningbo, China)
● Ultrasonic cleaner (KQ-500DE, Supmile, Kunshan, Jiangsu, China)
● Vortex mixer (SCI-VS, SCILOGEX, Rocky Hill, CT, USA)
● Electronic balances (0.1 mg, MA204E, Mettler toledo, Zurich, Switzerland)
● High speed microcentrifuge (L-CM-1524R, LABGIC, Beijing, China)
● LC (ExionLC AD) coupled with a Triple TOF 6600 mass spectrometer (AB SCIEX, Redwood City, CA, USA) or similar
Software
-
● MSConvert (
https://proteowizard.sourceforge.io/ )● MS-DIAL (version 4.9 or higher) (
https://systemsomicslab.github.io/compms/msdial/main.html )● R statistical scripting language (version 4.1.2) (
https://www.r-project.org/ )● MetaboAnalystR (
https://github.com/xia-lab/MetaboAnalystR )● OptiLCMS (
https://github.com/xia-lab/OptiLCMS )● Python 3 (
https://www.python.org/ ) -
Double extraction is typically employed to obtain both non-polar and polar compounds. The polar compounds were retained in methanol/water, while lipids were assessed after the chloroform phase (organic reagent commonly used for lipid extraction[18]), evaporation, and methanol reconstitution, which expands the scope of metabolomics analysis. However, these systems containing organic solvents exhibit low extraction efficiency for hydrophilic, strongly polar compounds, resulting in their low abundance in the extract and insufficient response in MS detection.
Therefore, in order to obtain comprehensive metabolites of the sample, solvents with different polarities were used to extract the compounds. Water and methanol-water mixtures are used to extract polar and semi-polar compounds, respectively. Chloroform-methanol-water mixtures are used to achieve the separation of lipids and polar compounds by referring to Bligh & Dyer's methods with slight adjustment[19,20]. Particularly, for clear juice samples, extraction is not necessary. These can be directly centrifuged and filtered through a 0.22 µm PES membrane before immediate analysis by LC-MS. If the intensity of the mass spectrum is low, solid phase extraction can also be carried out.
Quality control (QC) samples contain the most comprehensive set of metabolites, and can be used to monitor the stability and repeatability of the instrument and method. QC samples are prepared by mixing all extracts in equal volume. Since extracts of different polarities are extracted with different solvents in this protocol, QC samples need to be prepared separately.
The selection of the column is closely related to the polarity of the solvent. Strongly polar compounds exhibit poor retention in reversed-phase liquid chromatography (RPLC), which results in target omission and reduces annotation coverage. Therefore, normal phase liquid chromatography (NPLC), such as an HILIC column, is often used for their separation[21]. Semi-polar compounds are typically separated using RPLC, for example, with a C18 column[22]. For weakly polar or non-polar systems, where lipids are the dominant components, lipidomics is commonly employed to fill the gap left by metabolomics in this area[23].
Untargeted metabolic profile data collected by LC-QTOF-MS
-
The acquisition modes of QTOF-MS are divided into data-dependent acquisition (DDA) and data-independent acquisition (DIA). DDA selects several parent ions with the highest intensity for fragmentation; higher quality MS2 spectra can be obtained[24], which is conducive to the annotation. DIA fragments all precursor ions within a selected m/z range or within a selected sequential mass window (such as sequential window acquisition of all theoretical spectra, SWATH)[6]. This technique can obtain more comprehensive MS2 information and cover the DDA limitation on the MS2 acquisition of low-abundance ions. Different metabolites have different suitable collision energy (CE) due to their structure. In order to obtain better product ions for annotation, this protocol sets CE = ± 35 V, CES = 15 V in product ion scan, that is, three different CE voltages of ± 20, ± 35, and ± 50 V. The other main parameters of the QTOF-MS are set according to the instructions of the manufacturer and optimized according to the actual needs.
Metabolite annotation by multiple tools
-
To obtain as much credible metabolite annotation information as possible, the collaborative use of multiple analytical tools can mutually validate the annotation results and compensate for potential deficiencies that may exist in a single analytical tool during deconvolution or reference database searching. MS-DIAL can be utilized to rapidly acquire high-quality alignment tables and annotation results. By importing the m/z and retention time (RT) information obtained from MS-DIAL into MetaboAnalystR, the MS2 spectra undergo deconvolution, replicated spectrum consensus screening, and reference database searching, and the annotation results were obtained again[17]. Comprehensive analysis of the annotation results from both analytical tools allows for the verification of MS2 spectrum matching with the database under the same set of m/z and RT values, as well as the supplementation of metabolites that could not be annotated by a single analytical tool alone. In short, the annotation results of two analysis tools will be merged, and different annotations under the same feature will select the results with higher scores. This protocol applies this method to increase the quantity of annotation results while reducing the occurrence of false positives.
Safety rules
-
All experiments should be performed in accordance with relevant national and international guidelines and regulations. For safety, always wear appropriate personal protective equipment, including gloves, lab coats, masks, and safety goggles, when handling chemical reagents. Additionally, work with volatile reagents in a fume hood to ensure safe ventilation.
Sample collection and pretreatment
-
This protocol is applicable to fresh fruits and vegetables and their processed products. Samples were collected in accordance with sampling norms to ensure the representativeness of the samples. Sample pretreatment should be performed as soon as possible according to experimental requirements. The samples selected in this protocol include four sprout types (V1–V4), European plums (F1), passion fruit (F2), and mango pulp in two sterilization processes of UHT and HPP (P1, P2).
Clean the fruit and vegetable samples, and keep the edible part. After that, cut the solid samples into slices or small pieces. And the semi-solid samples are mixed and placed on the sterile plates. For fruits and vegetables with high water content or cloudy juice/pulp samples, priority can be given to lyophilization before compound extraction to improve the feature intensity of subsequent detection. The samples should be frozen with liquid nitrogen to make sure the moisture forms ice crystals, which can sublimate during the lyophilization process. Lyophilize the frozen samples to a crisp state with a vacuum freeze dryer. For the vacuum freeze dryer with heating function, the plate temperature should not be set too high to avoid thermal degradation of metabolites; generally, less than 10 °C is appropriate. Grind the lyophilized sample into a fine powder with a freeze grinder, then collect and store the powder at −80 °C. Specifically, juice samples are not allowed to be lyophilized.
Preparation of analytical reagents
Extraction solvents
-
All extraction solvents should be prepared fresh before use.
For extracting polar compounds, the preferred solvent is ultrapure water or ultrapure water containing a small amount of organic acid. Ultrapure water is generated by a Milli-Q system or similar. Organic acids are preferred, but not limited to, HPLC-grade formic acid, acetic acid, and trifluoroacetic acid are also applicable. The concentration of organic acid is recommended in 0.1%–0.5%.
For extracting semi-polar compounds, the preferred solvent is 50% (vol/vol) water/methanol solution or one containing a small amount of organic acid. The 50% (vol/vol) water/methanol solution is prepared by thoroughly mixing equal volumes of ultrapure water and LC/MS-grade methanol. Similarly, organic acids are preferred but not limited to HPLC-grade formic acid, acetic acid, and trifluoroacetic acid are also applicable. The concentration of organic acid is recommended in 0.1%–0.5%.
For extracting lipids, the preferred solvent is 2:1 (vol/vol) chloroform/methanol. To prepare the 2:1 (vol/vol) chloroform/methanol solution, LC/MS-grade methanol is thoroughly mixed with AR-grade chloroform at a 2:1 volume ratio.
Mobile phase and other reagents
-
The required mobile phase volume for the anticipated analysis time is determined by considering the number of samples, the run time per injection, and the mobile phase flow rate. It is assumed that 1,000 mL each of the aqueous and organic phases will be sufficient.
For the BEH C18 column, mobile phase A is prepared by adding 1.0 mL of HPLC-grade formic acid to 1,000 mL of ultrapure water and mixing thoroughly. Similarly, mobile phase B is prepared by adding 1.0 mL of HPLC-grade formic acid to 1,000 mL of LC/MS- grade acetonitrile and mixing thoroughly.
For the HILIC-Z column, prepare the 2 mol/L CH3COONH4 solution in advance and store it in the refrigerator at 4 °C. To create mobile phase A, add 5 mL of this 2 mol/L CH3COONH4 solution to 1,000 mL of a 5% (vol/vol) acetonitrile/water solution and mix thoroughly, achieving a final CH3COONH4 concentration of 10 mmol/L. For mobile phase B, prepare a 95% (vol/vol) acetonitrile/water solution containing 10 mmol/L CH3COONH4, ensuring mixing thoroughly, too.
For an optimal peak profile with the SB-C18 column, CH3COONH4 is also added to the mobile phase. To prepare mobile phase A, dissolve 2.5 mL of 2 mol/L CH3COONH4 in 1,000 mL of a 6:4 (vol/vol) acetonitrile/water mixture, ensuring mixing thoroughly to achieve a final CH3COONH4 concentration of 5 mmol/L. Similarly, mobile phase B is prepared by mixing CH3COONH4 in a 9:1 (vol/vol) isopropanol/acetonitrile mixture, also to a final concentration of 5 mmol/L CH3COONH4, ensuring complete mixing.
Other solutions needed for LC-QTOF-MS (like needle wash solution, calibration solution) are prepared according to the manufacturer's instructions.
Compound extraction
Polar compound extraction
-
For each sample, weigh 0.5 g of freeze-dried powder and add 5 mL of ultrapure water (or ultrapure water containing 0.1%–0.5% organic acid) into a centrifuge tube. Mix thoroughly using a vortex mixer for 10 s. The mixture was ultrasonicated at 40 kHz and 4 °C for 20 min, then centrifuged at 10,000 × g and 4 °C for 15 min. Transfer the supernatant to a new centrifuge tube, filter it through a 0.22 µm PES membrane, and transfer 1 mL of the filtrate into brown autosampler vials. Prepare a QC sample by combining equal volumes from each filtrate, and prepare a blank sample by adding 1 mL of the extraction solvent to a separate brown autosampler vial.
Notably, for the ultrapure water extracts, the filtrate should be analyzed as soon as possible to avoid long-term storage, as it may lead to precipitation or bacterial growth in the sample.
Semi-polar compound extraction
-
For each sample, weigh 0.5 g of freeze-dried powder and add 5 mL of a 50% (vol/vol) methanol/water solution (optionally containing 0.1%–0.5% organic acid) into a centrifuge tube. Mix thoroughly using a vortex mixer for 10 s. The mixture was ultrasonicated at 40 kHz and 4 °C for 20 min, then centrifuged at 10,000 × g and 4 °C for 15 min. Transfer the supernatant to a new centrifuge tube, filter it through a 0.22 µm nylon membrane, and transfer 1 mL of the filtrate into brown autosampler vials. Prepare a QC sample by combining equal volumes from each filtrate, and create a blank sample by adding 1 mL of extraction solvent into a separate brown autosampler vial. Store all samples at −20 °C or −80 °C until analysis.
Lipid compound extraction
-
For lipid extraction, use 0.5 g of freeze-dried powder as a sample. First, add 1 mL ultrapure water and thoroughly mix on a vortex mixer for 10 s. Then, add 4 mL of 2:1 (vol/vol) chloroform/methanol and mix thoroughly again. The mixture was ultrasonicated at 40 kHz and 4 °C for 20 min, then centrifuged at 10,000 × g and 4 °C for 15 min, then the lower organic layer was carefully collected. For secondary extraction, add 4 mL of the extraction solution to the supernatant, mixing thoroughly. Next, merge the two extracts. In the following step, evaporate the solution to nearly dry by nitrogen gas and reconstitute the sample in 2 mL of 2:1 (vol/vol) chloroform/methanol. Filter the solution through a 0.22 µm nylon membrane and transfer 1 mL of the filtrate into brown autosampler vials. Combine equal volumes of each filtrate to create a QC sample, and prepare a blank sample by adding 1 mL of extraction solvent into a separate brown autosampler vial. Store all samples at −20 °C or −80 °C until analysis.
Metabolomics data acquisition
Preparation of the analytical system
-
Metabolomics data were acquired using LC-QTOF-MS (ExionLC-TripleTOF6600, AB SCIEX). Other HRMS instruments with DDA/IDA are also suitable.
First, replace the mobile phases and the chromatographic column. For AB SCIEX instruments, open the purge valve to prevent the expelled liquid from entering the mass spectrometer before purging. For other manufacturers' instruments, operate according to the instrument manufacturer's specifications if the instrument does not have a purge valve.
Second, calibrate the QTOF-MS and Product Ion. Set appropriate scanning ranges and ion source parameters according to the experiment needs. Injecting the calibration solution, then the acquisition begins. After the acquisition signal is stable, stop the acquisition, tune, and calibrate according to the instrument requirements to ensure that the average error is < 2 ppm. Then, the calibration of Product Ion is similar; the following is an example: DP: 80 V/−80 V; CE: 45/−23 V, Product Of: 609/403 Da, respectively. The MS2 scan range was m/z 50–1,500 Da (can be adjusted according to the experiment needs).
Construction of analysis method and sample sequence
-
For the polar compound extract solution, chromatographic separation was performed using an InfinityLab Poroshell 120 HILIC-Z column (3.0 × 100 mm, 2.7 µm, Agilent, USA) (Water-HILIC). The flow rate was set at 0.4 mL/min, with the following gradient program: 5% A (0–2.00 min), 5%–20% A (2.00–7.00 min), 20%–32% A (7.00–13.00 min), 32%–35% A (13.00–16.00 min), 35%–5% A (16.00–16.01 min), and 5% A (16.01–18.00 min). The autosampler and column temperatures were maintained at 4 and 40 °C, respectively, with an injection volume of 2 µL.
For the semi-polar compound extract solution, chromatographic separation was carried out using an Acquity UPLC BEH C18 column (2.1 × 100 mm, 1.7 µm, Waters) (Methanol-C18). The flow rate was set at 0.3 mL/min, with the gradient program: 5%–40% B (0–10.00 min), 40%–100% B (10.00–13.00 min), 100% B (13.00–15.00 min), 100%–5% B (15.00–15.01 min), and 5% B (15.01–18.00 min). The autosampler and column temperatures were also maintained at 4 and 40 °C, respectively, with an injection volume of 2 µL.
For the lipid compound extract solution, chromatographic separation was performed using Poroshell 120, SB-C18 (3.0 × 100 mm, 2.7 μm, Agilent, USA) (Lipid-C18). The flow rate was set at 0.4 mL/min, with the following gradient program: 60%–0% A (0.00–12.00 min), 0% A (12.00–14.00 min), 0%–60% A (14.00–14.10 min), and 60% A (14.10–18.00 min). The autosampler and column temperatures were maintained at 4 °C and 40 °C, respectively, with an injection volume of 2 µL.
For all samples, the experimental parameters for TOF-MS scanning in both positive and negative ion modes were set as follows: Curtain Gas, 25 psi; Ion Source Gas 1, 50 psi; Ion Source Gas 2, 50 psi; Source Temperature, 500 °C; IonSpray Voltage Floating, 5,500/−4,500 V; Declustering Potential (DP), 60/−60 V; Collision Energy (CE), 10/−10 V, respectively. Metabolomics data were acquired using Information Dependent Acquisition (IDA) mass spectrometry mode (DDA mode in AB SCIEX). This mode provided data on TOF-MS primary parent ions (MS1) and high-sensitivity secondary product ions (MS2) for each sample. The IDA (cycle time 545 ms) was composed of a TOF-MS scan (accumulation time, 50 ms; CE, 10/−10 V) and 15 dependent product ion scans (accumulation time, 30 ms each; CE, 35/−35 V; CES, 15/–15 V) in the high-sensitivity mode with dynamic background subtraction. The MS1 scan range was m/z 100–1,500 Da, and the MS2 scan range was m/z 50–1,500 Da.
Establish the sequence of samples to be analyzed. Inserting five QC injections at the beginning to equilibrate the instrument. Then, blank and QC samples were inserted every five injections. Ensure that all sample names are unique and set it to calibrate every five injections.
Data acquisition
-
Equilibrate the instrument until the pressure stabilizes and begin the queue. Keep attention on system pressure and operating status during data acquisition. Strictly control the stability of Total Ion Chromatogram (TIC) for global QC samples to avoid analytical drift. If significant deviations in retention times or peak responses are observed, the data need to be re-acquired to ensure quality criteria. Clean the LC-QTOF-MS following the manufacturer's instructions after acquisition. Archive the data, making sure to copy the wiff file and wiff.scan file and place them in the same path.
Annotation analysis
File format conversion
-
ABFConverter and MSConvert are stand-alone, open-source software tools that support raw MS data conversion from various vendors, including Agilent, Bruker, SCIEX, and Thermo, thereby facilitating analysis in free software such as MS-DIAL. For AB SCIEX instruments, convert wiff files to ABF format using ABFConverter, or convert to mzML format using MSConvert. In MSConvert, the Peak Picking based on the Vendor algorithm is used for filtering, and other parameters remain default.
Metabolite annotation based on MS-DIAL (version 4.9 or higher)
-
Step 1: Start up a project. Set Ionization type, Separation type, MS method (Collision) type, Ion mode, and Target omics according to the specific experimental scheme. For ABF format Data, select MS1 and MS/MS Data type as profile data, while mzML format data, select as centroid data.
Step 2: Import the analysis files. The sample type is divided into sample, QC, and blank, and the sample class is marked according to the experimental design.
Step 3: Analysis parameter setting in MS-DIAL. Especially for the Identification module, one parameter group recommendation is to select MS1 tolerance of 0.01 Da, MS2 tolerance of 0.05 Da, and a cut-off score of 70% (in MS-DIAL version 4.9). For MS-DIAL version 5 or higher, the more detailed identification parameter can be set. Relative spectrum amplitude cutoff is suggested to be 1% to reduce the effect of noise peaks on matching scores. Dot product, weight dot product, and reverse dot product scores are recommended to be set to 700, matched spectrum percentage is set to 15%, and the minimum number of match spectra is 3, so as to obtain better annotated metabolites.
Other parameter groups that meet the actual experimental requirements are also perfectly appropriate. The remaining parameters can be adjusted by referring to the MS-DIAL website (
https://systemsomicslab.github.io/compms/msdial/main.html ) or maintaining the default. In addition to lipidomics, which was conducted using the lipid database that was integrated within MS-DIAL, reference databases can use a variety of open-source resources such as MS-DIAL metabolomics MSP spectral kit, HMDB, MassBank, MoNA, RIKEN, or the spliced database. Note that the database needs to be converted to MSP format, and distinguish between positive and negative ion modes before importing.Step 4: Remove features based on blank information (if such samples are present), and the alignment results are derived from the peak area.
Metabolite supplementary annotation based on MetaboAnalystR
-
Notably, the following methods can be used only if MS-DIAL is used for mzML format analysis.
Step 1: Import raw data files in mzML format. Sample and QC need to be placed in different folder paths.
Step 2: Convert the alignment results obtained from MS-DIAL to make it compatible with MetaboAnalystR (OptiLCMS). Specifically, change the column names 'Average Rt (min)' and 'Average Mz' to 'rt' and 'mz', and swap the two column orders in Excel. Then, convert the unit of retention time from minutes to seconds. Finally, ensure the column names are in the first row position.
Step 3: MetaboAnalystR (OptiLCMS) analysis. Skip the peak picking and alignment steps, and directly import the alignment results derived from MS-DIAL to perform MS/MS deconvolution and annotation analysis on the raw data. The file format of the reference database needs to be converted from MSP to SQLite. Parameter setting and adjustment refer to the MetaboAnalyst website (
www.metaboanalyst.ca ). Annotation results are automatically saved in CSV format. A supplementary script can be added to the original script to generate dot similarity in the result, which is used for the credible filtering of annotated metabolites.Post-processing of annotated metabolites
-
Step 1: The annotation results were filtered according to the following recommended conditions. For annotation results in MS-DIAL version 4.9, total score ≥ 70, dot product score ≥ 70, and reverse dot product score ≥ 70 were selected. However, since the detailed identification parameters have been defined when setting parameters in version 5 or higher, they do not need to be filtered again. For MetaboAnalystR annotation results, total score ≥ 60 and dot similarity ≥ 0.7 were selected (MetaboAnalystR did not use reverse dot product to calculate spectral similarity). In particular, the annotation results of lipidomics in MS-DIAL selected dot product score ≥ 55, which is different from metabolomics because the MS2 of lipids is more complex. Notably, the score range is not mandatory and can be adjusted according to actual research needs. Retain results where the relative standard deviation (RSD) value of the QC samples is less than 30%. In this way, compounds with high qualitative confidence and stable detection in samples can be obtained.
Step 2: Unify compound names to facilitate the annotation of natural metabolites. Using Python to access the PubChem (
https://pubchem.ncbi.nlm.nih.gov/ ) and LOTUS[25] (https://lotus.naturalproducts.net/ ) APIs to implement batch processing. The script is shown in Algorithm 1. When there is a compound that cannot be found in LOTUS but can be found in PubChem, it is necessary to carefully check whether the compound is a natural product.Table 1. The script for the unification of compound names.
import pandas as pd import requests import time lotus_cache = {} pubchem_cache = {} def process_inchikey(inchikey): if inchikey[-4] == 'N': return inchikey[:-4] + 'S' + inchikey[-3:] return inchikey def get_lotus_name(inchikey): inchikey = process_inchikey(inchikey) if inchikey in lotus_cache: return lotus_cache[inchikey] url = f" https://lotus.naturalproducts.net/api/search/simple?query={inchikey} "max_retries = 3 for attempt in range(max_retries): try: response = requests.get(url) if response.status_code == 200: data = response.json() if 'naturalProducts' in data and len(data['naturalProducts']) > 0: product = data['naturalProducts'][0] if 'traditional_name' in product: lotus_cache[inchikey] = product['traditional_name'] return product['traditional_name'] except requests.exceptions.RequestException as e: print(f"Request error for {inchikey}: {e}") time.sleep(3) lotus_cache[inchikey] = "Not Found" return "Not Found" def get_pubchem_name(inchikey): inchikey = process_inchikey(inchikey) if inchikey in pubchem_cache: return pubchem_cache[inchikey] url = f" https://pubchem.ncbi.nlm.nih.gov/rest/pug/compound/inchikey/{inchikey}/synonyms/JSON "max_retries = 3 for attempt in range(max_retries): try: response = requests.get(url) if response.status_code == 200: data = response.json() if 'InformationList' in data and 'Information' in data['InformationList'] and len(data['InformationList']['Information']) > 0: info = data['InformationList']['Information'][0] if 'Synonym' in info and len(info['Synonym']) > 0: pubchem_cache[inchikey] = info['Synonym'][0] return info['Synonym'][0] except requests.exceptions.RequestException as e: print(f"Request error for {inchikey}: {e}") time.sleep(3) pubchem_cache[inchikey] = "Not Found" return "Not Found" xls = pd.ExcelFile("your input path") with pd.ExcelWriter("your output path") as writer: for sheet_name in xls.sheet_names: df = pd.read_excel(xls, sheet_name=sheet_name) if 'InchiKey' in df.columns: df['Lotus Name'] = df['InChiKey'].apply(get_lotus_name) df['Pubchem Name'] = df['InChiKey'].apply(get_pubchem_name) time.sleep(1) df.to_excel(writer, sheet_name=sheet_name, index=False) Step 3 (Optional): Using Classyfire API (
http://classyfire.wishartlab.com ) to classify metabolites[26]. The script is shown in Algorithm 2. Classification is helpful to further summarize the functional properties of the compounds. In particular, the classification dimensions (subclass, class, and superclass) can be freely selected to make the expression clearer.Table 2. The script for the classification of metabolites.
import pandas as pd import requests import time def process_inchikey(inchikey): if inchikey[-4] == 'N': return inchikey[:-4] + 'S' + inchikey[-3:] return inchikey def get_classification_info(inchikey): inchikey = process_inchikey(inchikey) url = f" http://classyfire.wishartlab.com/entities/{inchikey}.json "max_retries = 5 for attempt in range(max_retries): try: response = requests.get(url) if response.status_code == 200: classification = response.json() subclass = (classification.get('subclass') or {}).get('name', 'Not available') class_ = (classification.get('class') or {}).get('name', 'Not available') superclass = (classification.get('superclass') or {}).get('name', 'Not available') return subclass, class_, superclass except requests.exceptions.RequestException as e: print(f"Request error for {inchikey}: {e}") time.sleep(3) return "Error", "Error", "Error" xls_named = pd.ExcelFile("your input path") with pd.ExcelWriter("your output path") as writer: for sheet_name in xls_named.sheet_names: df = pd.read_excel(xls_named, sheet_name=sheet_name) if ' InChiKey ' in df.columns: df[['Subclass', 'Class', 'Superclass']] = df['InChiKey'].apply(lambda x: pd.Series(get_classification_info(x))) time.sleep(1) df.to_excel(writer, sheet_name=sheet_name, index=False) Step 4: Filter out potential synthetic compounds and environmental contaminants, as these may result from mismatches in the annotation process. Their presence can impact the analysis of small-molecule compounds in fruits, vegetables, and related products, where the focus is primarily on natural food ingredients.
-
In actual operation, various potential problems may occur, especially for compound annotation. Table 1 lists some possible problems and gives the possible causes and solutions of the problems, aiming at more smoothly implementing the operation of this protocol.
Table 1. Troubleshooting table.
Problem Possible reason Solution The compounds have the wrong adduction. Database may contain non-standard adduct ion forms, leading to adduct misassignment in the annotation information of MS-DIAL. The exact mass is calculated from the molecular formula and compared to the average m/z detected, and the correct adduct ion is modified to match the difference between the exact mass and the average m/z. The script for batch calculation of exact mass is given in Algorithm 3. Compounds are annotated repeatedly. Deconvolution algorithms may not be able to accurately separate the signals of complex mixtures, resulting in the signal of one compound being separated into multiple features and annotated by the database. Select the perfect one with the highest matching score (refer to total score, dot product score, etc.) and response intensity for comprehensive judgment. The searched compound names show 'Not Found', or don't correspond to the name given by the analysis tools (not the same substance). The InChiKey or compound name of the compounds recorded in the database is incorrect. For compounds that could not be matched or matched incorrectly, manually search on PubChem and modify the InChiKey or metabolite names. Common error in Python script. The column name does not contain a character matching 'InChiKey' (for Algorithm 1 and 2) or 'Formula' (for Algorithm 3).
The file path is incorrect.
The corresponding package is not installed.Check the correctness of column names and file paths, and install the corresponding packages. Table 3. The script for the calculation of exact mass.
import pandas as pd import re from pyteomics import mass def calculate_monoisotopic_mass(chemical_formula): if not isinstance(chemical_formula, str): return None pattern = r'([A-Z][a-z]*)(\d*)' monoisotopic_mass = 0 for symbol, count in re.findall(pattern, chemical_formula): count = int(count) if count else 1 monoisotopic_mass += count * mass.nist_mass[symbol][0][0] return monoisotopic_mass file_path = ' your path' sheets = pd.ExcelFile(file_path) sheet_names = sheets.sheet_names writer = pd.ExcelWriter(file_path, mode='a', engine='openpyxl', if_sheet_exists='replace') for sheet_name in sheet_names: sheet_df = pd.read_excel(file_path, sheet_name=sheet_name) formula_columns = [col for col in sheet_df.columns if 'Formula' in col] for formula_col in formula_columns: exact_mass_col = f'Exact Mass ({formula_col})' sheet_df[exact_mass_col] = sheet_df[formula_col].apply(calculate_monoisotopic_mass) sheet_df.to_excel(writer, sheet_name=sheet_name, index=False) writer.close() -
As an application of the established method and to validate its effectiveness, a comparative analysis of mass spectrometry results was performed on four types of vegetables, two types of fruits, and two types of fruit-processed products using three different extraction and separation groups: Methanol-C18, Water-HILIC, and Lipid-C18. Figure 2 shows the TIC plot of QC samples with different extraction and separation groups in both positive and negative ion modes. The stability of the instrumental system, including retention time reproducibility and signal response stability, was monitored throughout the sequence by interspersed QC samples, ensuring the high quality and reliability of the data acquisition[27].
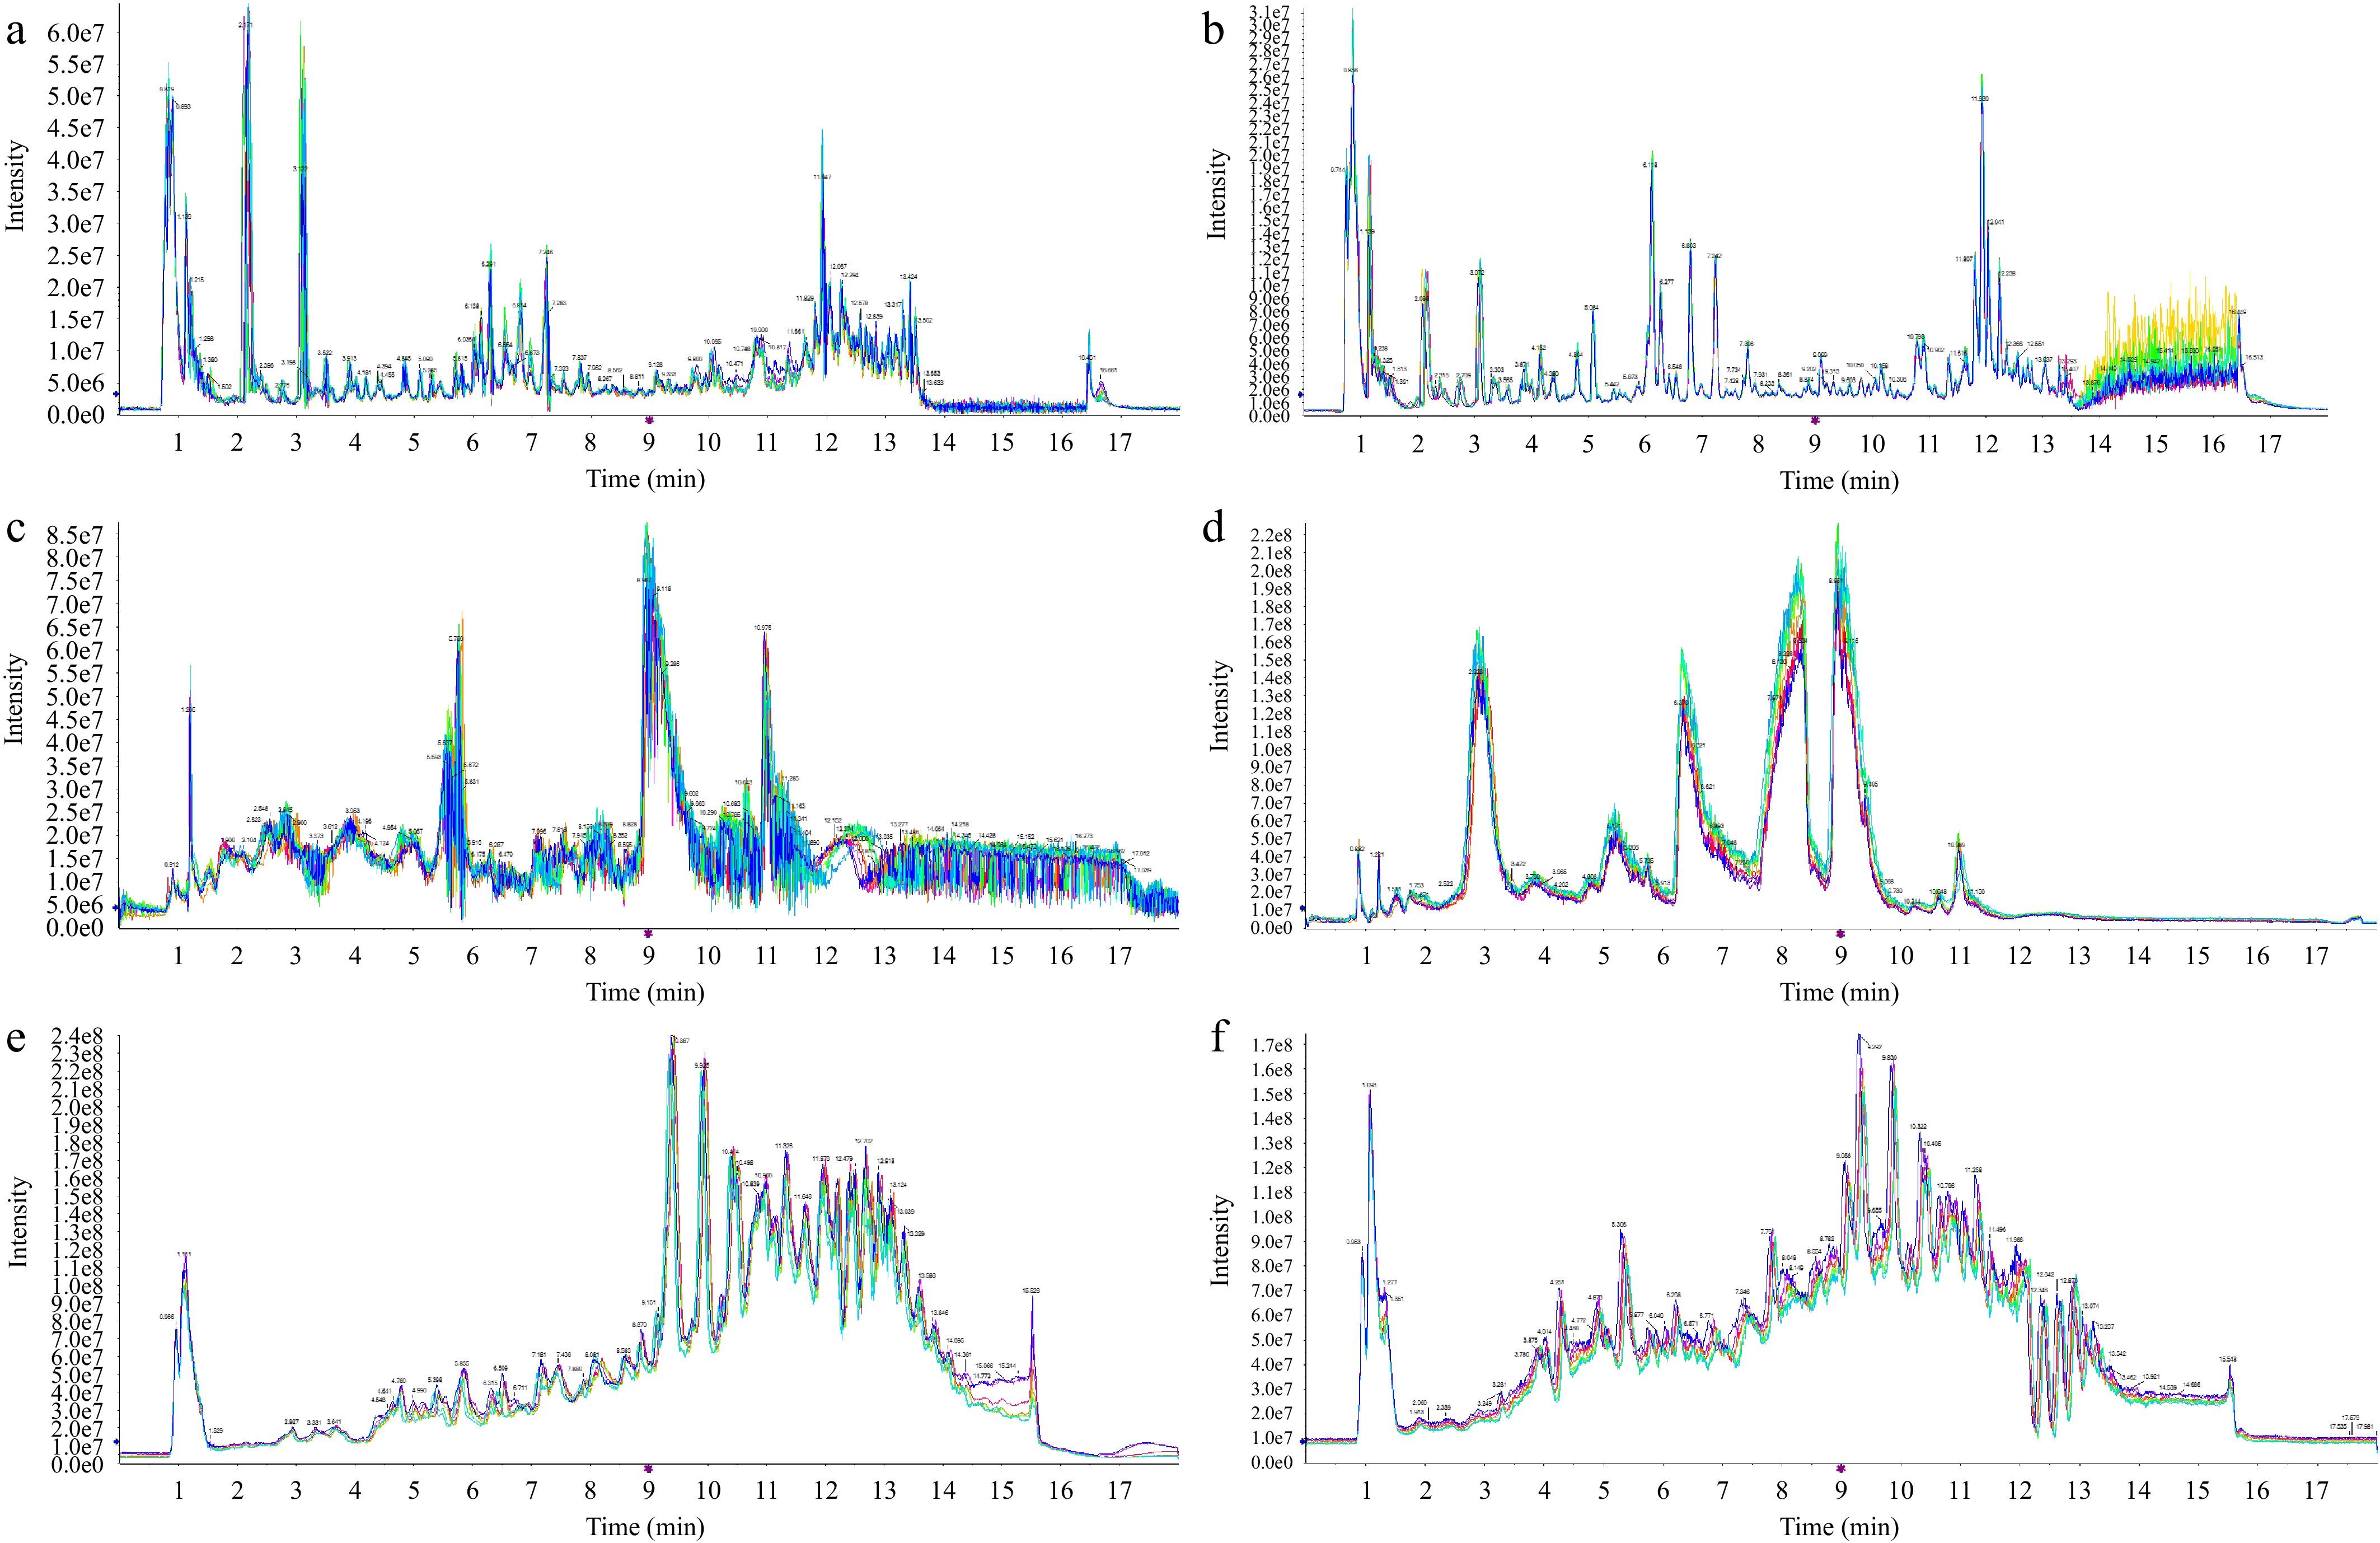
Figure 2.
TIC plot of QC samples. (a) Methanol-C18 group, acquired in positive ion mode. (b) Methanol-C18 group, acquired in negative ion mode. (c) Water-HILIC group, acquired in positive ion mode. (d) Water-HILIC group, acquired in negative ion mode. (e) Lipid-C18 group, acquired in positive ion mode. (f) Lipid-C18 group, acquired in negative ion mode.
In all methods, thousands of MS1 features were detected for each sample. Except for the Lipid-C18 group, more than 70% of the MS1 features in positive and negative ion modes of almost all samples corresponded to MS2 features after deconvolution (Fig. 3a, c). A higher proportion of MS2 features contributes to an increased number of metabolite annotations. For the four types of vegetable samples, integrating analysis and annotation was performed using MS-DIAL and MetaboAnalystR. Figure 3d, e displays the number of metabolites annotated by the two analytical tools after integrating positive and negative ion modes in the Methanol-C18 and Water-HILIC groups, respectively. There were significant differences in the number of matching metabolites between the two analytical tools. The overlapping metabolites only accounted for approximately 30% of the total annotated metabolites. The combination of the two analytical tools greatly improved the annotation coverage of metabolites. Additionally, the lipidomics module of MS-DIAL was employed to annotate additional lipid metabolites (Fig. 3f). The annotated metabolites are those matched against authoritative public spectral libraries, applying the same stringent MS/MS matching score as the filtering criterion. However, due to the lack of direct validation with authentic chemical standards, they are classified as 'putative identifications' (MSI Level 2) results[28].
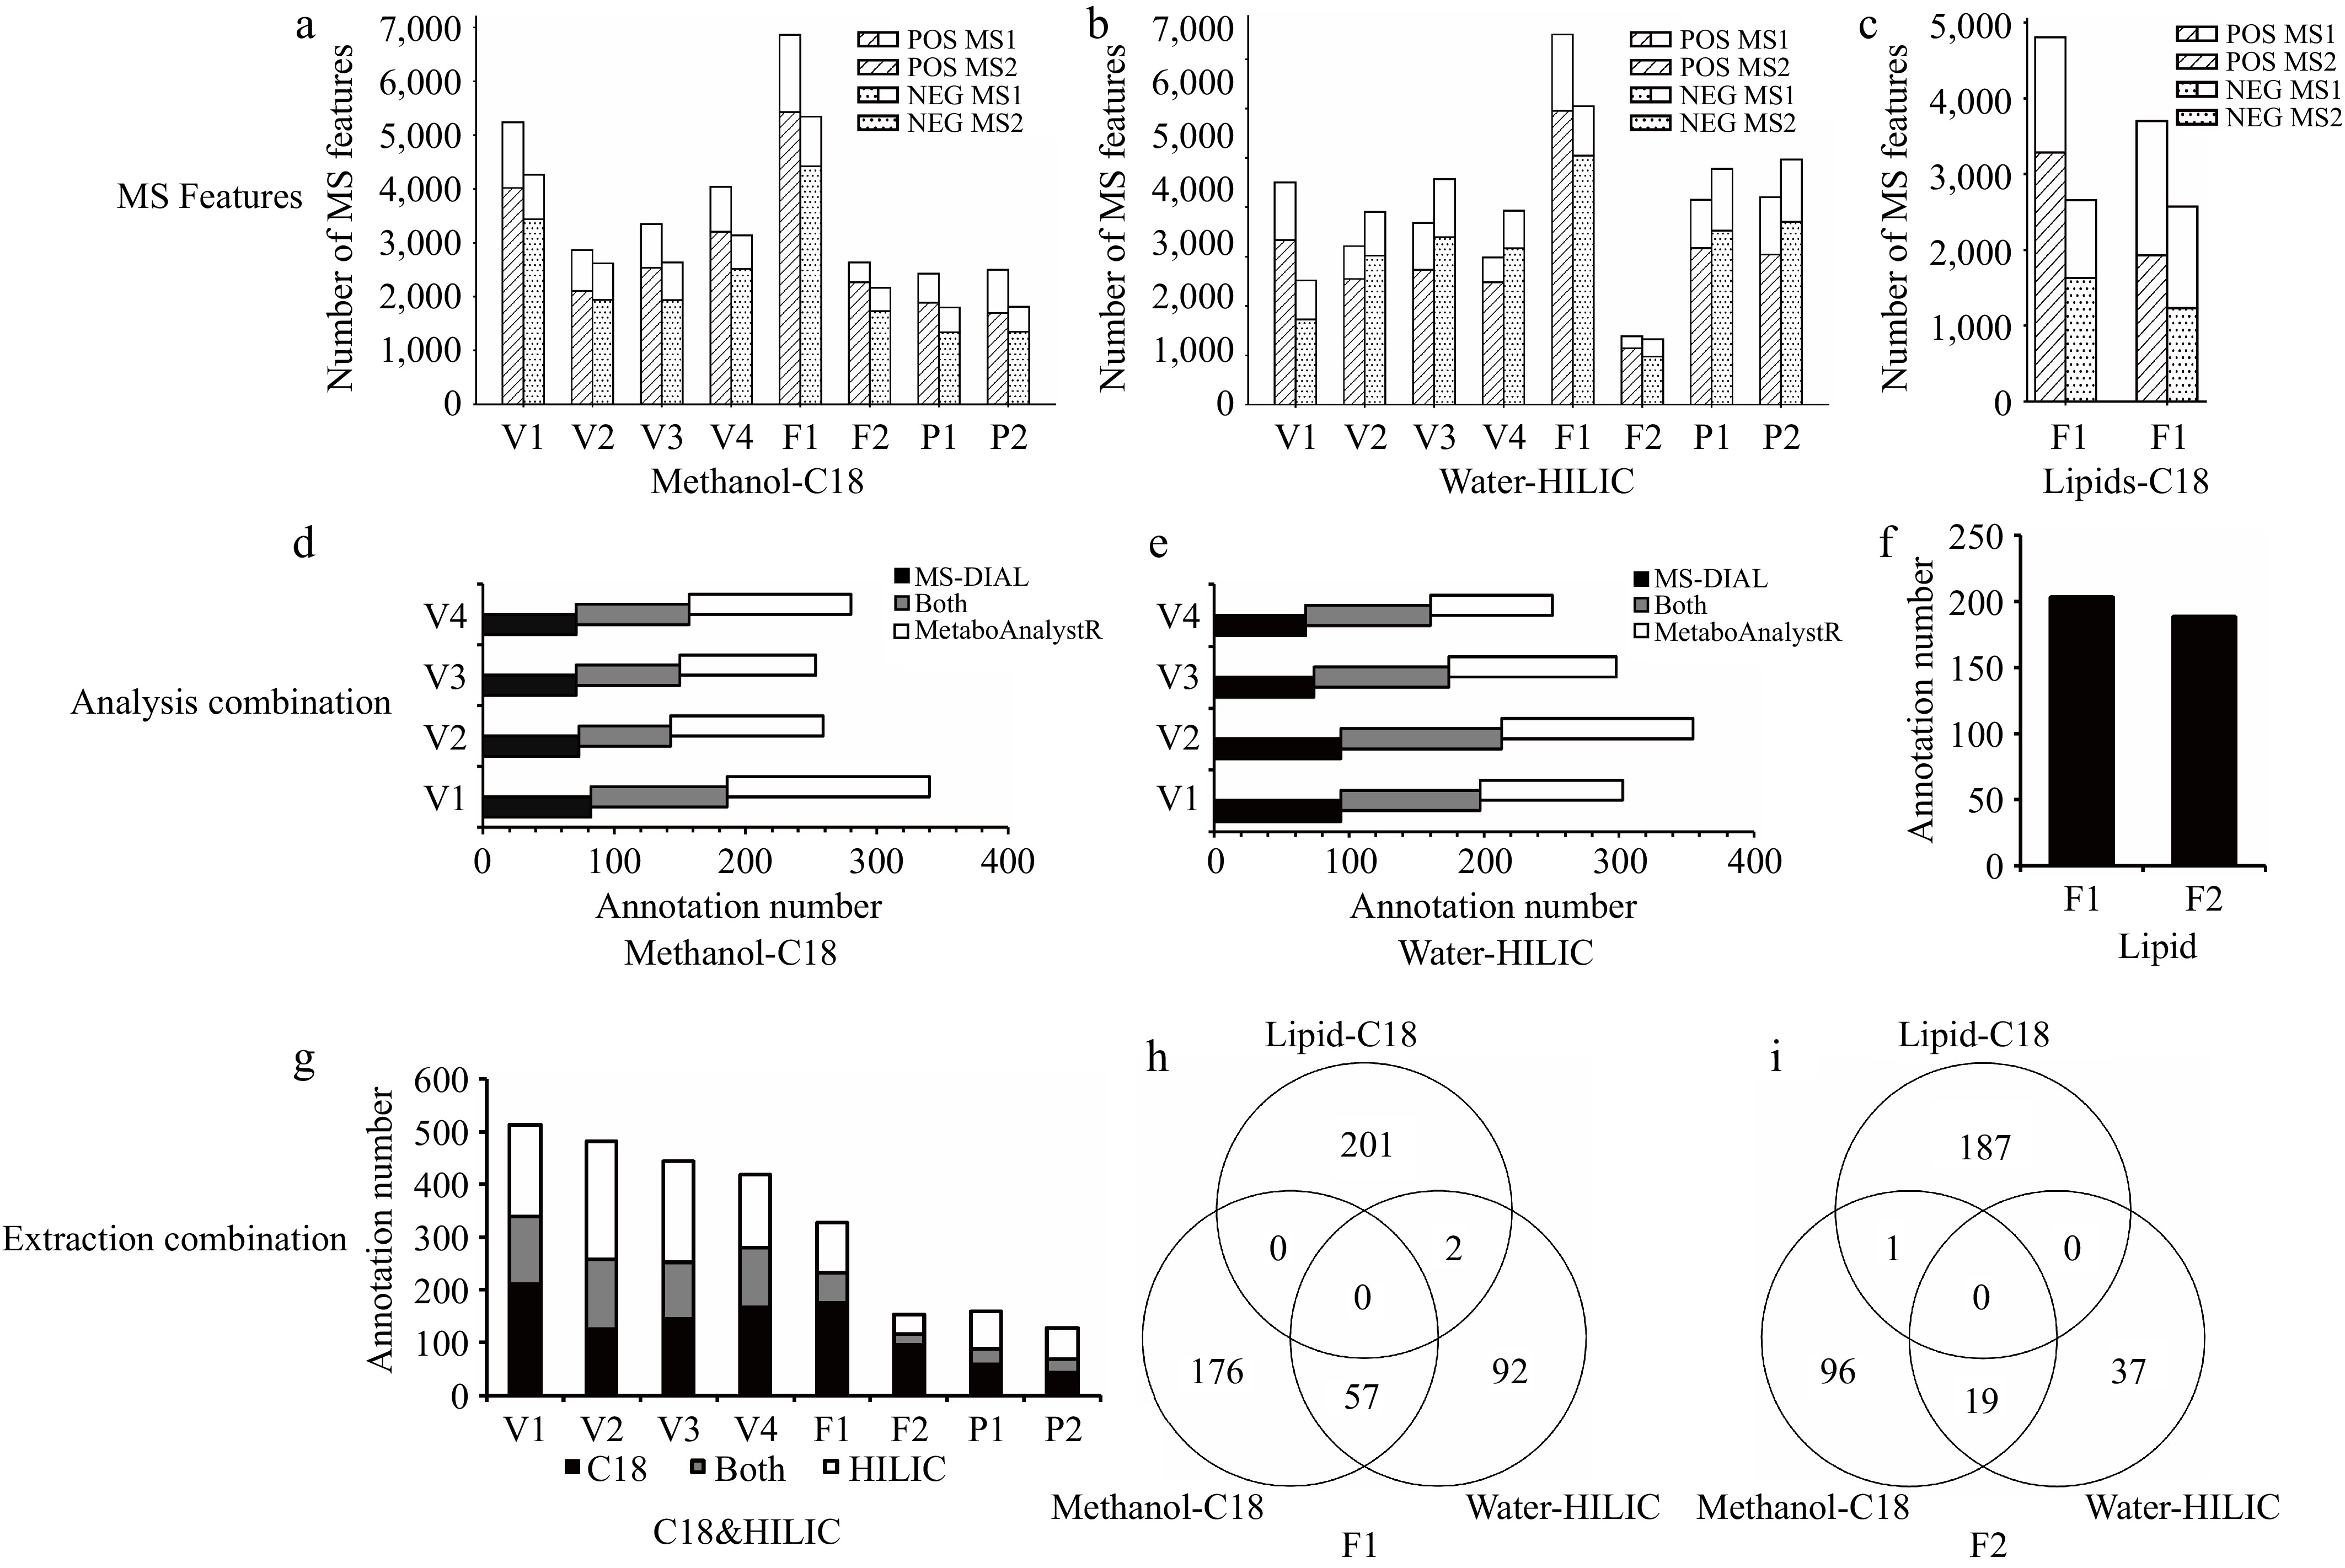
Figure 3.
Strategy evaluation results. MS features of all samples in positive (POS) and negative (NEG) ion modes: (a) Methanol-C18 group, (b) Water-HILIC group, and (c) Lipid-C18 group. Combination of annotation results from different analysis tools (merge positive and negative ion modes) (d) Combination of annotation results from MS-DIAL and MetaboAnalystR in the Methanol-C18 group, (e) combination of annotation results from MS-DIAL and MetaboAnalystR in the Water-HILIC group, and (f) annotation results from MS-DIAL (lipidomics module) in the Lipid-C18 group. Combination of annotation results from different extraction groups: (g) combination of annotation results from Methanol-C18 group and Water-HILIC group, (h), (i) Venn plots of annotated metabolites extracted by three methods for two types of fruit.
Finally, the annotated metabolites obtained from different extraction methods were integrated to achieve a comprehensive assessment of the metabolites. Figure 3g shows the overall number of metabolites after integrating the Methanol-C18 and Water-HILIC groups. Among the eight types of samples, the number of overlapping annotated metabolites accounted for only 12.42%–27.65% of the total annotated metabolites. The combination of these two techniques significantly expanded the upper limit of annotated metabolites that could be obtained by a single extraction method. Additionally, for the two types of fruits, the Lipid-C18 method was employed for lipid extraction and separation, identifying lipids that were almost entirely distinct from those detected by the other two methods (Fig. 3h, i). Notably, the spliced database used in the Methanol-C18 and Water-HILIC groups included the lipidome database. This indicates that the Lipid-C18 method compensated for the deficiencies of the other two methods in lipid detection. The combined use of Water-HILIC, Methanol-C18, and Lipid-C18 not only effectively increased the annotation coverage of polar and semi-polar metabolites, but also supplemented the information of weakly polar and non-polar compounds. The findings of this study demonstrate that the strategy employed resulted in a significant increase in the number of annotations for small molecule metabolites. The complete list of annotated metabolites with systematic classification can be found in the Supplementary Data 1.
Due to the inherent complexity of food matrices, it is challenging to capture compounds comprehensively with a single strategy. This necessitates the adaptive integration of omics technologies tailored to experimental objectives. The use of methanol-water mixtures or other non-polar organic solvents for extraction, in conjunction with analysis by RPLC (e.g., C18), constitutes a standard and indispensable technical combination for handling non-volatile components in biological matrices. This approach plays an irreplaceable role in elucidating the nutritional composition of plant-derived food. Khan et al. identified 92 flavonoids across seven pak choi cultivars, achieving the comprehensive analysis of flavonoid detection in pak choi cultivars[29]. As a complementary technique to RPLC, HILIC has been demonstrated to address the retention issues of highly polar compounds under RPLC conditions. This technology enables high-throughput coverage and analysis of key polar metabolites such as amino acids, organic acids, and sugars in plant samples[30]. It should be clarified that the primary objective of the presented strategy is not a significant conceptual breakthrough at the knowledge level. The central contribution of this work lies in the systematic integration of these established technical modules to create a unified workflow designed to maximize the coverage of metabolite detection and annotation. The integrated analytical strategy proposed in this study is a detailed, standardized protocol for routine laboratory analysis of fruits, vegetables, and their products. Such a strategy has not been systematically reported in prior studies. It is hoped that the detailed experimental procedure provided will serve as a practical reference and benchmark for laboratories dedicated to research on the chemical constituents of plant foods.
-
By extracting and analyzing different fractions separately using specific LC modes (e.g., HILIC for polar compounds, C18 for semi/non-polar compounds), our Divide, Conquer, and Integrate Strategy could capture a broader range of metabolites. In summary, the number of overlapping annotated metabolites between the Methanol-C18 group and the Water-HILIC group accounted for only 12.42%–27.65% of the total annotated metabolites. The Lipid-C18 group further compensated for the limitation of the other two methods in lipid detection. Furthermore, the combination of both analytical tools resulted in a substantial increase in the number of annotated metabolites, with overlapping metabolites accounting for only about 30% of the total annotated metabolites. This comprehensive approach ensures that polar to non-polar compounds are effectively separated and analyzed. It also allows for the optimization of extraction and analysis conditions for different types of metabolites, leading to better separation and detection. The integration of multiple databases, along with the integrated application of analytical software, can enhance the prospects for annotating a wider variety of metabolites. It will lead to a more thorough, reliable, and accurate metabolomic profile.
However, this strategy introduces greater complexity, requiring multiple extraction steps, chromatographic runs, and sophisticated data integration. The increased demand for resources—both in terms of laboratory work and data processing—along with the need for multiple reagents and extended instrument time, makes this approach more resource-intensive and expensive compared to traditional methods. Another limitation is that the use of multiple and complex combined databases may sometimes obscure correct annotations, as overlapping or conflicting database entries could lead to potential misidentifications or missed detections. Additionally, integrating data from different chromatographic methods and databases poses challenges, necessitating advanced bioinformatics tools and expertise to ensure accurate and meaningful interpretation of the results.
-
The authors confirm contribution to the paper as follows: study conception and design: Yu J, Xu L, Wang K, Xu Z; data collection: Yu J, Zhang N, Zhu X, Mi L, Wang X; analysis and interpretation of results: Yu J, Zhang N, Tang L, Zhu X, Mi L; draft manuscript preparation: Yu J, Xu L, Zhang N, Tang L, Zhu X, Xu Q, Viau C, Xu Z. All authors reviewed the results and approved the final version of the manuscript.
-
The datasets generated during and/or analyzed during the current study are available from the corresponding author on reasonable request.
-
This research was funded by National Key R&D Program of China (Grant No. 2022YFD2100805).
-
The authors declare that they have no known competing financial interests or personal relationships that could have appeared to influence the work reported in this paper.
-
accompanies this paper online at: https://doi.org/10.48130/fia-0026-0009.
- Supplementary Date S1 All annotated metabolites in samples.
- Copyright: © 2026 by the author(s). Published by Maximum Academic Press on behalf of China Agricultural University, Zhejiang University and Shenyang Agricultural University. This article is an open access article distributed under Creative Commons Attribution License (CC BY 4.0), visit https://creativecommons.org/licenses/by/4.0/.
-
About this article
Cite this article
Yu J, Xu L, Zhang N, Tang L, Zhu X, et al. 2026. A strategy to improve the annotation coverage of small molecule compounds in fruits, vegetables and their products by untargeted metabolomics. Food Innovation and Advances 5: 112−122 doi: 10.48130/fia-0026-0009 

A strategy to improve the annotation coverage of small molecule compounds in fruits, vegetables and their products by untargeted metabolomics
- Received: 02 November 2025
- Revised: 27 January 2026
- Accepted: 28 January 2026
- Published online: 26 March 2026
Abstract: Metabolomics is essential for analyzing small molecules in food. Effective extraction and separation technology, along with reliable and efficient analytical tools, are essential for enhancing both the quantity and accuracy of compound analysis. Traditional methods relying on single-solvent extraction and single-column separation often result in target omission and reduced annotation coverage. This study presents a 'Divide, Conquer, and Integrate Strategy' for comprehensive untargeted metabolomics in fruits, vegetables, and their products. The method uses three extraction techniques to capture metabolites across a broad polarity range. Each extract is separated using specific chromatographic columns and mobile phases to ensure high annotation coverage. Data are collected via high-resolution mass spectrometry in both positive and negative ion modes, and analyzed using MS-DIAL and MetaboAnalystR. This integrated approach enhances metabolite discovery and annotation accuracy, with low overlap of metabolites annotated by different extraction methods.
-
Key words:
- Untargeted metabolomics /
- Food /
- Compound extraction /
- Annotation analysis /
- Protocol