













-
Global warming has been driven by human activities and fossil fuel combustion and is intensifying at an unprecedented rate[1]. The mean global temperature during 2011–2020 was 1.09 °C above the 1850–1900 baseline and is projected to reach 1.5–2.0 °C by the late 21st century[2]. This warming profoundly affects ecosystem carbon and water processes[3,4], directly impacting plant growth, survival, and physiological functions through influencing photosynthetic efficiency and water loss[5,6]. Although plants fix atmospheric CO2 via photosynthesis, warming-induced droughts are expected to increase plant community mortality[7]. Water use efficiency (WUE), defined as the amount of biomass produced per unit of water consumed[8,9], is a key functional trait linking ecosystem carbon and water cycles. At the leaf level, WUE includes intrinsic WUE (the ratio of photosynthetic rate [Pn] to stomatal conductance [Gs]) and instantaneous WUE (the ratio of Pn to transpiration rate [T])[10,11], which all show the trade-off between carbon and water utilization. High WUE enables plants to fix more carbon under water-limited conditions, making it a critical parameter for predicting vegetation responses to climate change[12,13].
However, due to differential thermal sensitivities and tolerance thresholds of plant physiological processes, the WUE responses to climate warming are often heterogeneous and variable. Within the optimal temperature range, rising temperatures concurrently stimulate Pn and T[14,15]. However, the sensitivity of Pn and Gs or T to temperature is inconsistent, which can lead to the change of WUE through photosynthetic capacity[16]. Importantly, this relationship is highly non-linear. Below species-specific thermal thresholds, moderate stomatal opening balances CO2 uptake and water loss, resulting in a positive correlation between WUE and temperature[17]. In contrast, excessive stomatal opening may increase the transpiration rate to reduce the temperature at high temperatures, thus reducing WUE and making the temperature-WUE relationship highly uncertain[18].
Beyond direct physiological regulation, warming also influences WUE indirectly by altering soil water availability. Soil moisture (SM) regulates both carbon assimilation and evapotranspiration and is therefore a critical determinant of ecosystem WUE[19], which may buffer thermal stress and sustain carbon gain, ultimately reshaping plant carbon–water trade-offs. Notably, SM negatively affects WUE in terrestrial ecosystems and indirectly influences WUE across > 60% of the global land surface by regulating evapotranspiration and ecosystem carbon uptake, as represented by GPP[20,21]. In addition to hydrological controls, WUE is shaped by complementary plant traits that regulate carbon–water coupling. Maximum quantum efficiency of photosystem II (FV/FM) reflects photochemical efficiency and plant stress status, chlorophyll content (Chl) indicates photosynthetic capacity[22], and specific leaf area (SLA) captures leaf structural investment and carbon–water trade-offs. Together, these traits integrate photosynthetic physiology and leaf economic strategy, mediating ecosystem WUE responses to environmental change. Increases in WUE are also primarily driven by rising leaf area index, which is positively related to SLA, followed by meteorological factors[23−25]. Importantly, the impact of warming on WUE exhibits strong scale dependence, reducing ecosystem-scale WUE while often leaving leaf-level WUE unaffected[10], underscoring the need to consider scale when interpreting WUE responses.
WUE is regulated by a complex combination of macroscopic environmental gradients and microscopic biological traits, such that single-factor studies are insufficient to capture its full response to climate change. Additionally, WUE exhibits significant spatial variability driven by climate factors and elevation at the ecosystem scale[17,26]. In particular, annual precipitation strongly regulates ecosystem water availability and thereby influences plant carbon gain relative to water loss[27]. Physiologically, plant types dictate the baseline of carbon–water coupling. Woody forest plants possess higher WUE than herbaceous plants due to deeper root systems, longer lifespan, and stable physiological regulation, which help plants in the forest better to adjust to the fluctuating environment[28,29]. However, anthropogenic warming fundamentally disrupts the environmental and physiological controls over WUE. Warming alters plant functional traits, such as increasing SLA, and reduces surface soil moisture, forcing plants to exploit deeper and often nutrient-poor soil layers. These above- and belowground adjustments do not directly determine WUE, whereas they constrain photosynthetic carbon assimilation and modify stomatal behaviour, ultimately reducing the efficiency of carbon gain relative to water loss and leading to lower WUE[30,31].
Despite substantial progress, quantitative syntheses of warming effects on plant WUE remain limited. Most studies focus on individual sites or single plant functional type, lacking systematic comparisons between forests and grasslands across gradients of warming levels and duration. Meanwhile, few studies have examined how warming alters the relationships between WUE and key parameters (e.g., SLA, leaf nitrogen content), or identified the primary drivers of WUE change and the corresponding plant response strategies. To address these knowledge gaps, we conducted a meta-analysis of 52 articles comprising 258 paired observations from forest and grassland ecosystems worldwide (Supplementary Fig. S1). This study aimed to address following: (1) quantify the overall effect of climate warming on plant WUE and determine whether this effect varies with warming intensity, warming duration, or plant functional type in forest and grassland ecosystems; (2) assess how the relationships between WUE and photosynthetic parameters change under warming; and (3) identify the main drivers of warming-induced changes in plant WUE and elucidate plant response strategies.
-
In our study, the data for meta-analysis employed two databases, Web of Science (
https://apps.webofknowledge.com ) and China National Knowledge Infrastructure (CNKI), to search for peer-reviewed publications from October 2010 to October 2025. The key phrases were as follows: 'WUE' OR 'water use efficiency' AND plant OR vegetable AND 'global warming' OR 'climate warming' OR 'CO2 fertilization effect' AND forest OR grassland ecosystem. To get the papers we wanted and lessen bias in the outcomes of the meta-analysis, we chose the following criteria to eliminate the unrelated documents: (1) all experiments conducted were from warming treatment trials or potted temperature/CO2 enrichment experiments; (2) the warming treatment and control groups were exposed to identical abiotic and biotic conditions, and the duration, intensity, and method of warming were clearly stated; (3) each selected variables (i.e., plant WUE) were reported in experimental and control groups; (4) only if the experiment contained additional treatments were data from the blank and warming treatment groups included (e.g., nitrogen addition); (5) it could be extracted from the text or calculated from the paper to get the sample size, average value, and standard error (SE) of all variables; (6) data pertinent to our research was chosen from among the reviewed papers in the same place and year. Data were collected in two ways: (a) directly from the tables in the articles; and (b) using the GetData Graph Digitizer 2.24 program to get the data from the graphs in the papers. In this study, if the SE was not shown, it was calculated by the formula: SE = SD/√N. In addition, the SE was estimated as 10% of the mean[32] if the literature only reports the mean of WUE.A total of 52 publications (Supplementary Text 1), study sites (Supplementary Fig. S1), and datasets were chosen based on these selection criteria. To investigate how warming forms affect the plant WUE of the forest and grassland systems, we categorized the data related to warming intensity (eT: < 2 °C, 2–4 °C, > 4 °C; eCO2: < 420, 420–700, > 700 ppm, respectively, 1 ppm = 1 μmol/mol), warming method (eT, eCO2, and eT + eCO2), and experiment length (< 1, 1–5, 5–10, and > 10 months). Abiotic and biotic parameters, including MAP, MAT, latitude and longitude, elevation, soil texture, and plant types, were displayed in the chosen papers. Using Google Maps (
www.google.com/maps ) and the names of the research locations, we were able to find latitude and longitude information if it was not provided. We gathered pertinent information through the WorldClim database (www.worldclim.org ) in cases where MAP and MAT were off the record.Meta-analysis
-
A meta-analysis was conducted to research the effect of climate warming on plant WUE. We chose the natural log-transformed response ratio (RR) to calculate the effect size, as described by Hedges et al.[33]:
$ \mathrm{In}RR=\ln\left(\dfrac{m_w}{m_c}\right) $ (1) where, mw and mc are the means of the associated variable in the warming experiment and control groups, respectively. The variance (v) of the effect size of the individual was determined as follows:
$ {V}_{RR}=\dfrac{SE_{w}^{2}}{m_{w}^{2}}+\dfrac{SE_{c}^{2}}{m_{c}^{2}} $ (2) where, SEw and SEc are the standard errors of the relevant variables in the warming experiments and control groups, respectively.
The weighted mean response ratio (L*) and its standard error were calculated using Eqs (3) and (4), respectively:
$ {L}^{*}=\dfrac{\sum\nolimits_{i=1}^{k}{w}_{i}{\rm{In}} RR}{\sum\nolimits_{i=1}^{k}{w}_{i}} $ (3) $ SE\left({L}^{*}\right)=\sqrt{\dfrac{1}{{\Sigma }_{i =1}^{k}{w}_{i}}} $ (4) where, k and w indicate the number of studies and the weight of each response ratio, respectively. Eq. (5) was used to calculate the percentage change in forest WUE under elevated warming:
$ ({e}^{{{L}^{*}}-1})\times 100{\text{%}} $ (5) wi is calculated using the following equation:
$ {w}_{i}=\dfrac{1}{{v}_{RR}+{t}^{2}} $ (6) where, t represents the variance between studies in the REML (restricted estimation maximum likelihood) approach[34]. Utilizing a random-effects model, we determined the average effect sizes (L*) and produced confidence intervals (CIs) in R 4.5.3[35] (metafor package).
We employed several methods to assess publication bias in this research, including funnel plots, Egger regression[36], and the safety factor (as outlined in Supplementary Table S1). Meta-analytic analyses were performed using R software with the 'metafor' package, and significance was determined based on whether the 95% confidence interval excluded zero[37]. To systematically evaluate the impacts of global warming on plant WUE, a random-effects model was employed to calculate the overall effect sizes and compare the between-group heterogeneity. We detected the influence of categorical grouping variables—including ecosystem types (forest and grassland), warming magnitude, warming duration, climate zones, and soil texture—on the response ratio (lnRR) of each individual observation. The differences among subgroups were comprehensively evaluated using the between-group heterogeneity statistic (QM). Meta-regression analyses were performed to determine the relationships between the lnRR of variables and warming levels, MAT, MAP, and elevation. Furthermore, Pearson correlation analyses were conducted to examine the relationships among WUE, photosynthetic parameters, and plant traits. Finally, a random forest (RF) model was utilized to evaluate the relative variable importance, thereby identifying the primary driving factors governing the WUE responses. All statistical analyses were executed using R 4.5.3.
-
Overall, warming significantly increased plant WUE by 7.73% (Figs 1, 2; Supplementary Table S2), while plant WUE varied notably across categories (Fig. 3). Specifically, WUE declined by 30% when elevated temperature (eT) exceeded 4 °C. Conversely, elevated CO2 (eCO2) increased WUE by 43.91% at 420–700 ppm and by 101.38% above 700 ppm. The synergistic effect of eT (≤ 4 °C) and eCO2 (> 420 ppm) significantly promoted WUE (Supplementary Tables S3–S5). Warming duration also influenced the response, and WUE was inhibited under durations shorter than 1 month, whereas the strongest promotion occurred at 5–10 months (45.94%; Fig. 1; Supplementary Table S6). Additionally, WUE rose by 44.05% and 37.44% under plateau and tropical climates, respectively (Supplementary Table S7). Forests showed greater variation than grasslands, with WUE increasing by 10.3% (Fig. 1; Supplementary Table S8). Soil texture effects were contrasting: Anthrosols reduced WUE by 32.23%, whereas Alfisols markedly increased it by 67.87% (Supplementary Table S9). Among plant types, shrubs induced the largest change (46.8%), whereas forbs reduced WUE by 20.15% (Supplementary Table S10).
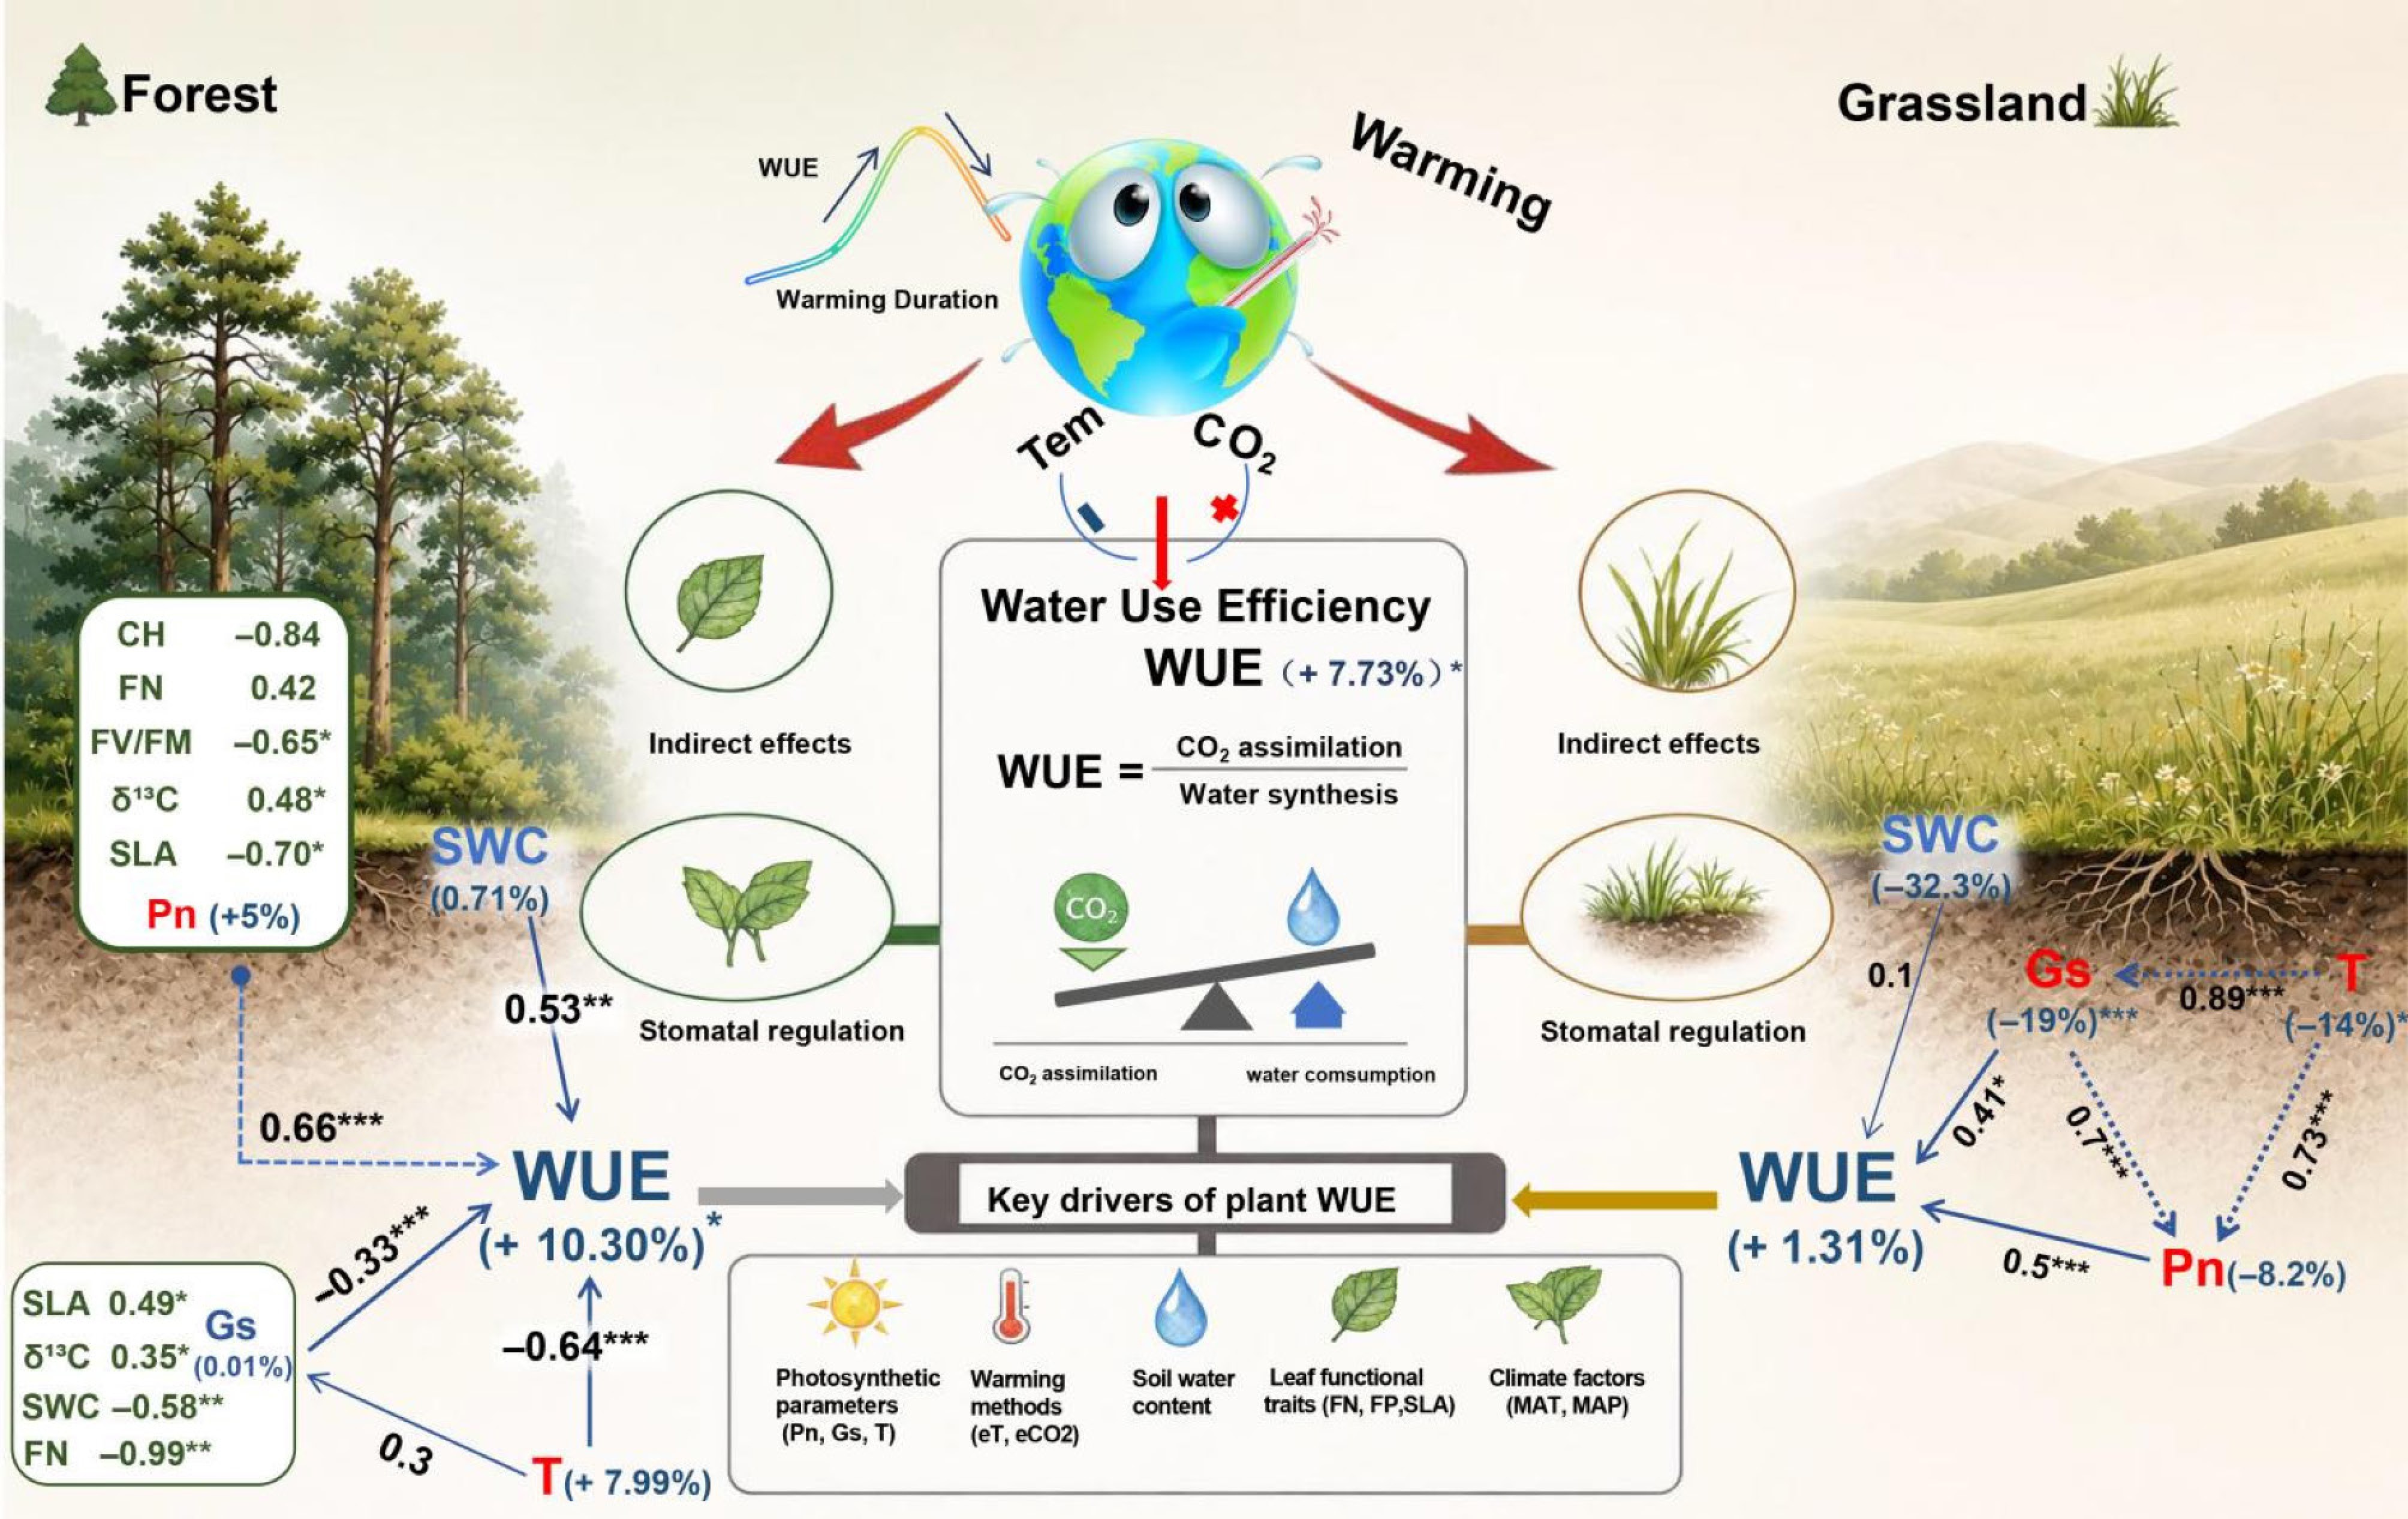
Figure 1.
Conceptual diagram showing warming effects on the processes affecting plant WUE in forest and grassland ecosystems. * Indicates a significant correlation at the p < 0.05 level, ** indicates an extremely significant correlation at the p < 0.01 level, and *** indicates an extremely significant correlation at the p < 0.001 level. '+' and '−' indicate expected positive and negative effects, respectively. WUE, water use efficiency; δ13 C, carbon stable isotope composition; Pn, net photosynthetic rate; Gs, stomatal conductance; T, transpiration rate; FV/FM, maximum quantum yield of PSII; CH, chlorophyll; SWC, soil water content; FN, foliar nitrogen; FP, foliar phosphorus; SLA, specific leaf area; eT, elevated temperature; eCO2, elevated CO2 concentration; MAT, mean annual temperature; MAP, mean annual precipitation.
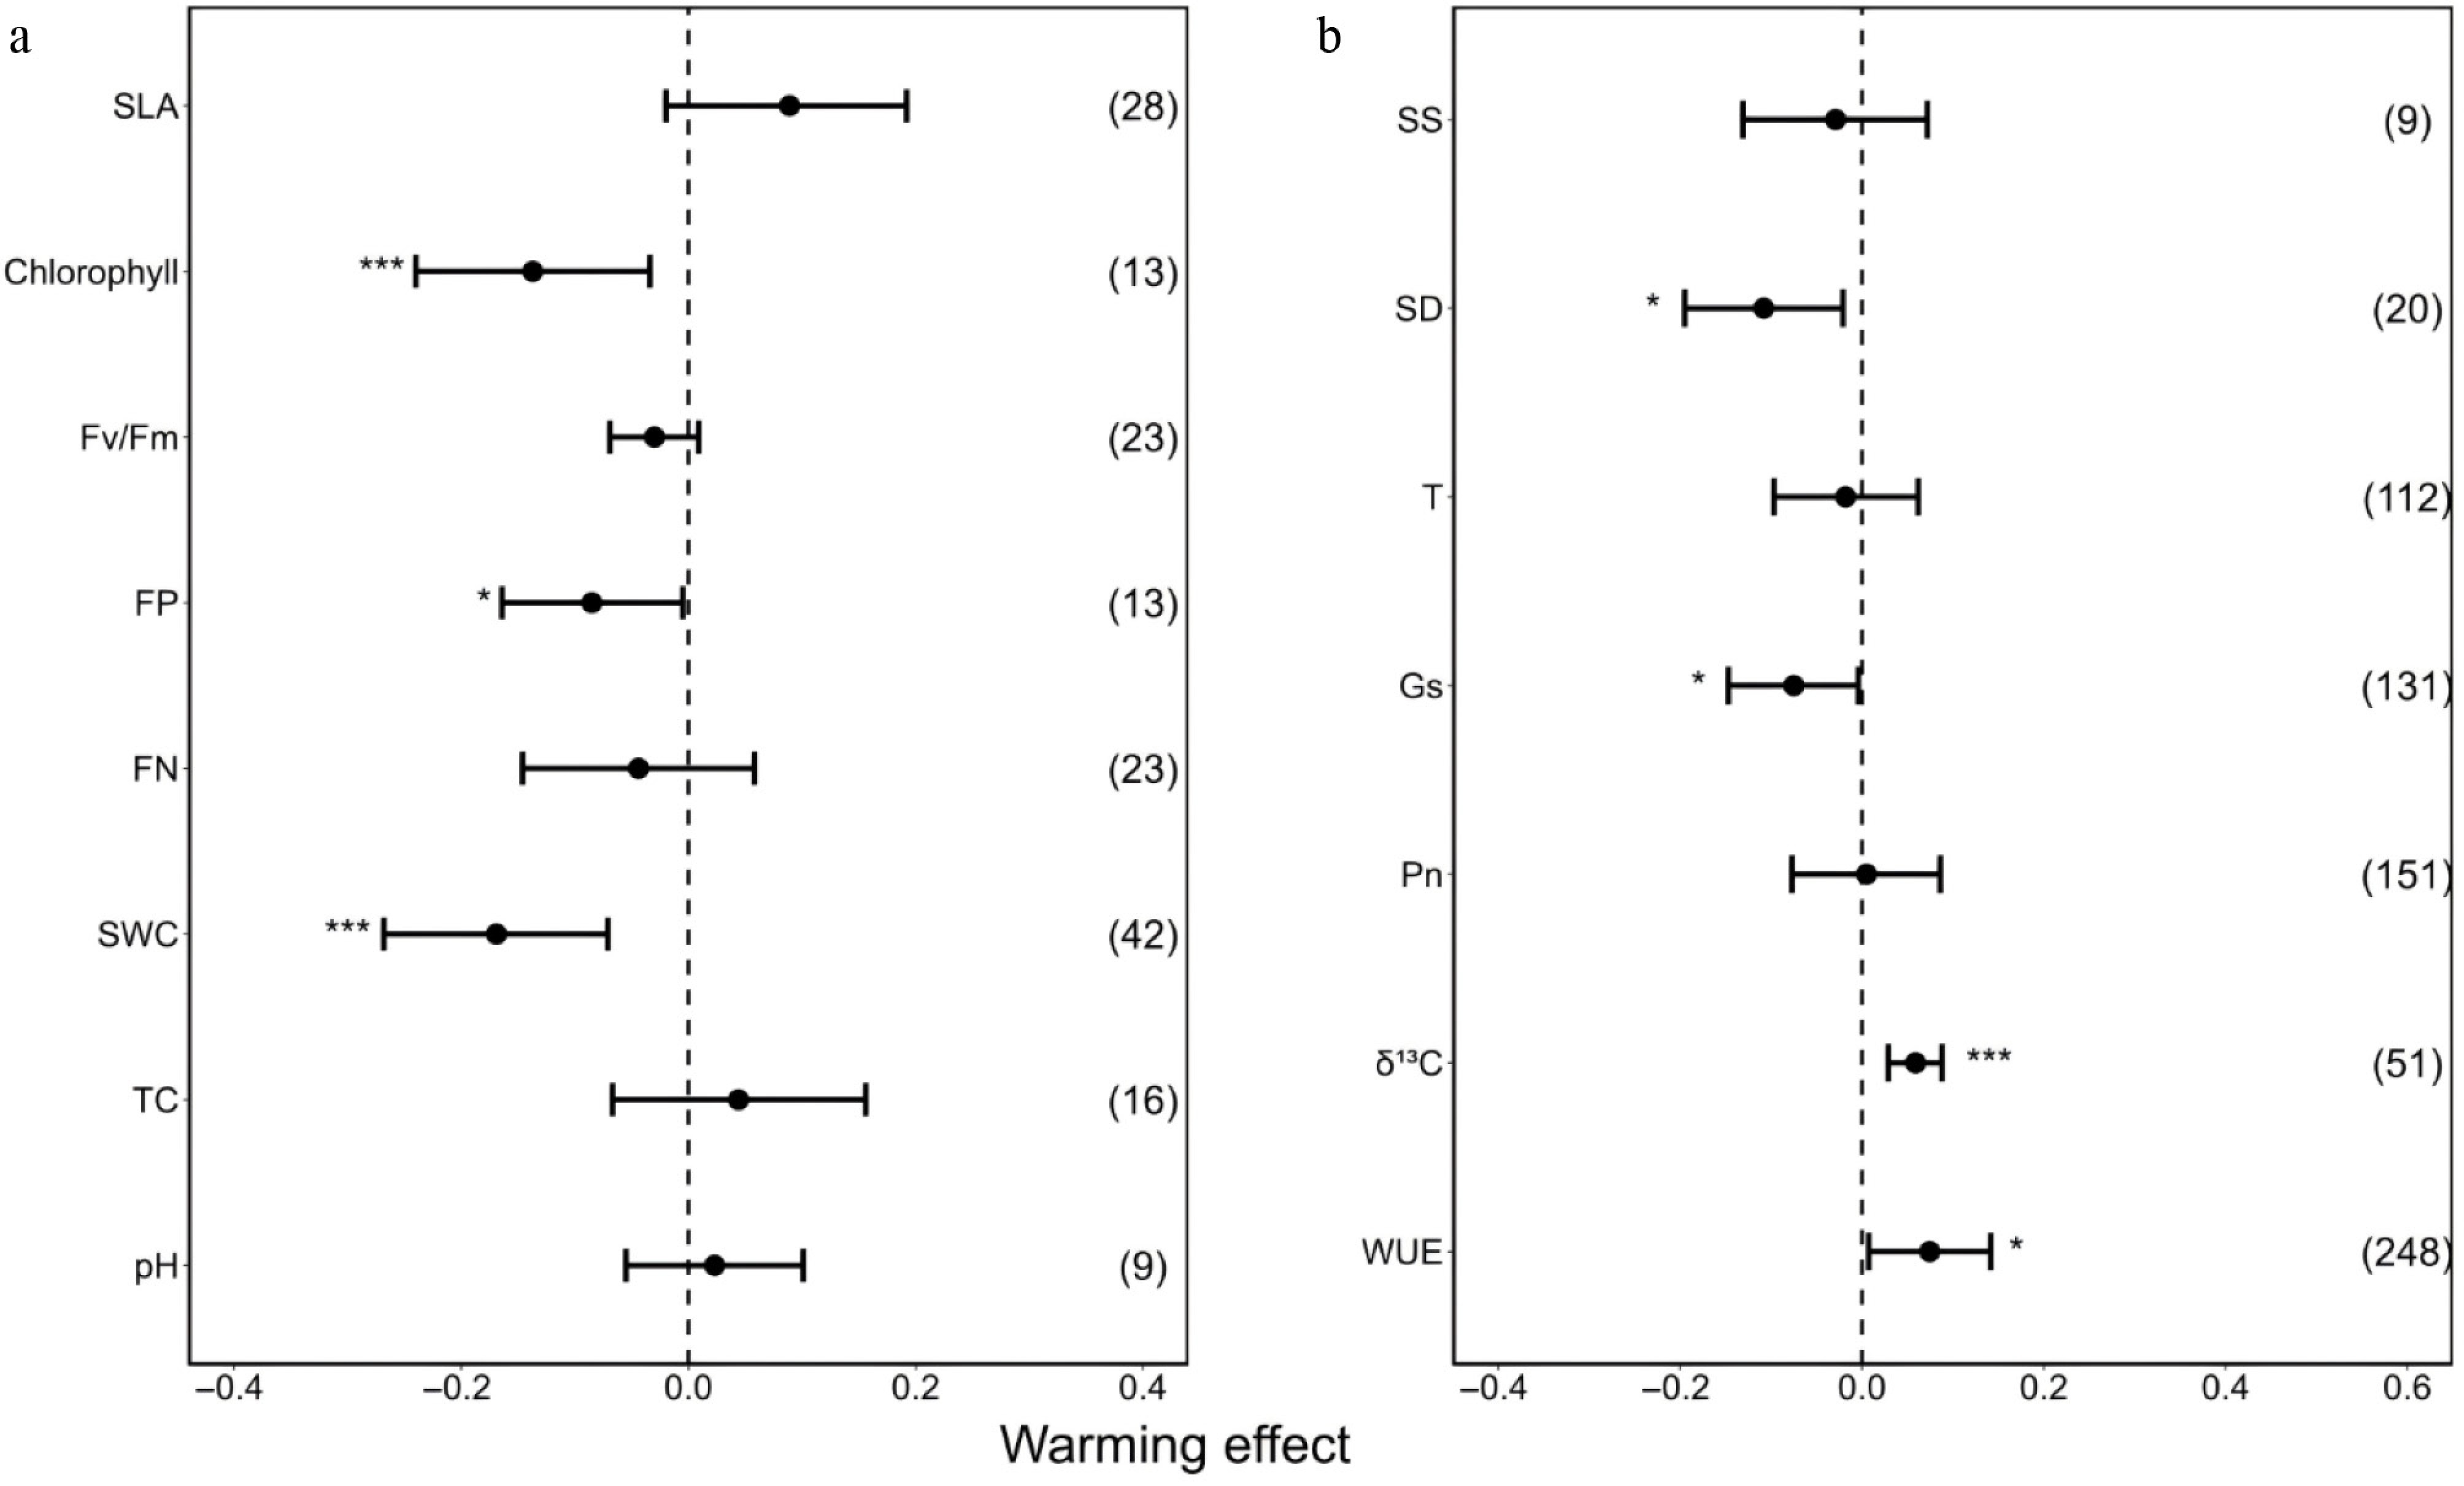
Figure 2.
Overall effect size of warming on plant WUE and related factors in (a) forests and (b) grasslands. Values represent means and 95% CIs. Numbers inside parentheses indicate observation numbers. * Indicates a significant correlation at the p < 0.05 level, ** indicates an extremely significant correlation at the p < 0.01 level, and *** indicates an extremely significant correlation at the p < 0.001 level. WUE, water use efficiency; δ13 C, carbon stable isotope composition; Pn, net photosynthetic rate; Gs, stomatal conductance; T, transpiration rate; SD, stomatal density; SS, stomatal size; TC, total carbon; SWC, soil water content; FN, foliar nitrogen; FP, foliar phosphorus; FV/FM, Maximum quantum yield of PSII; SLA, specific leaf area.
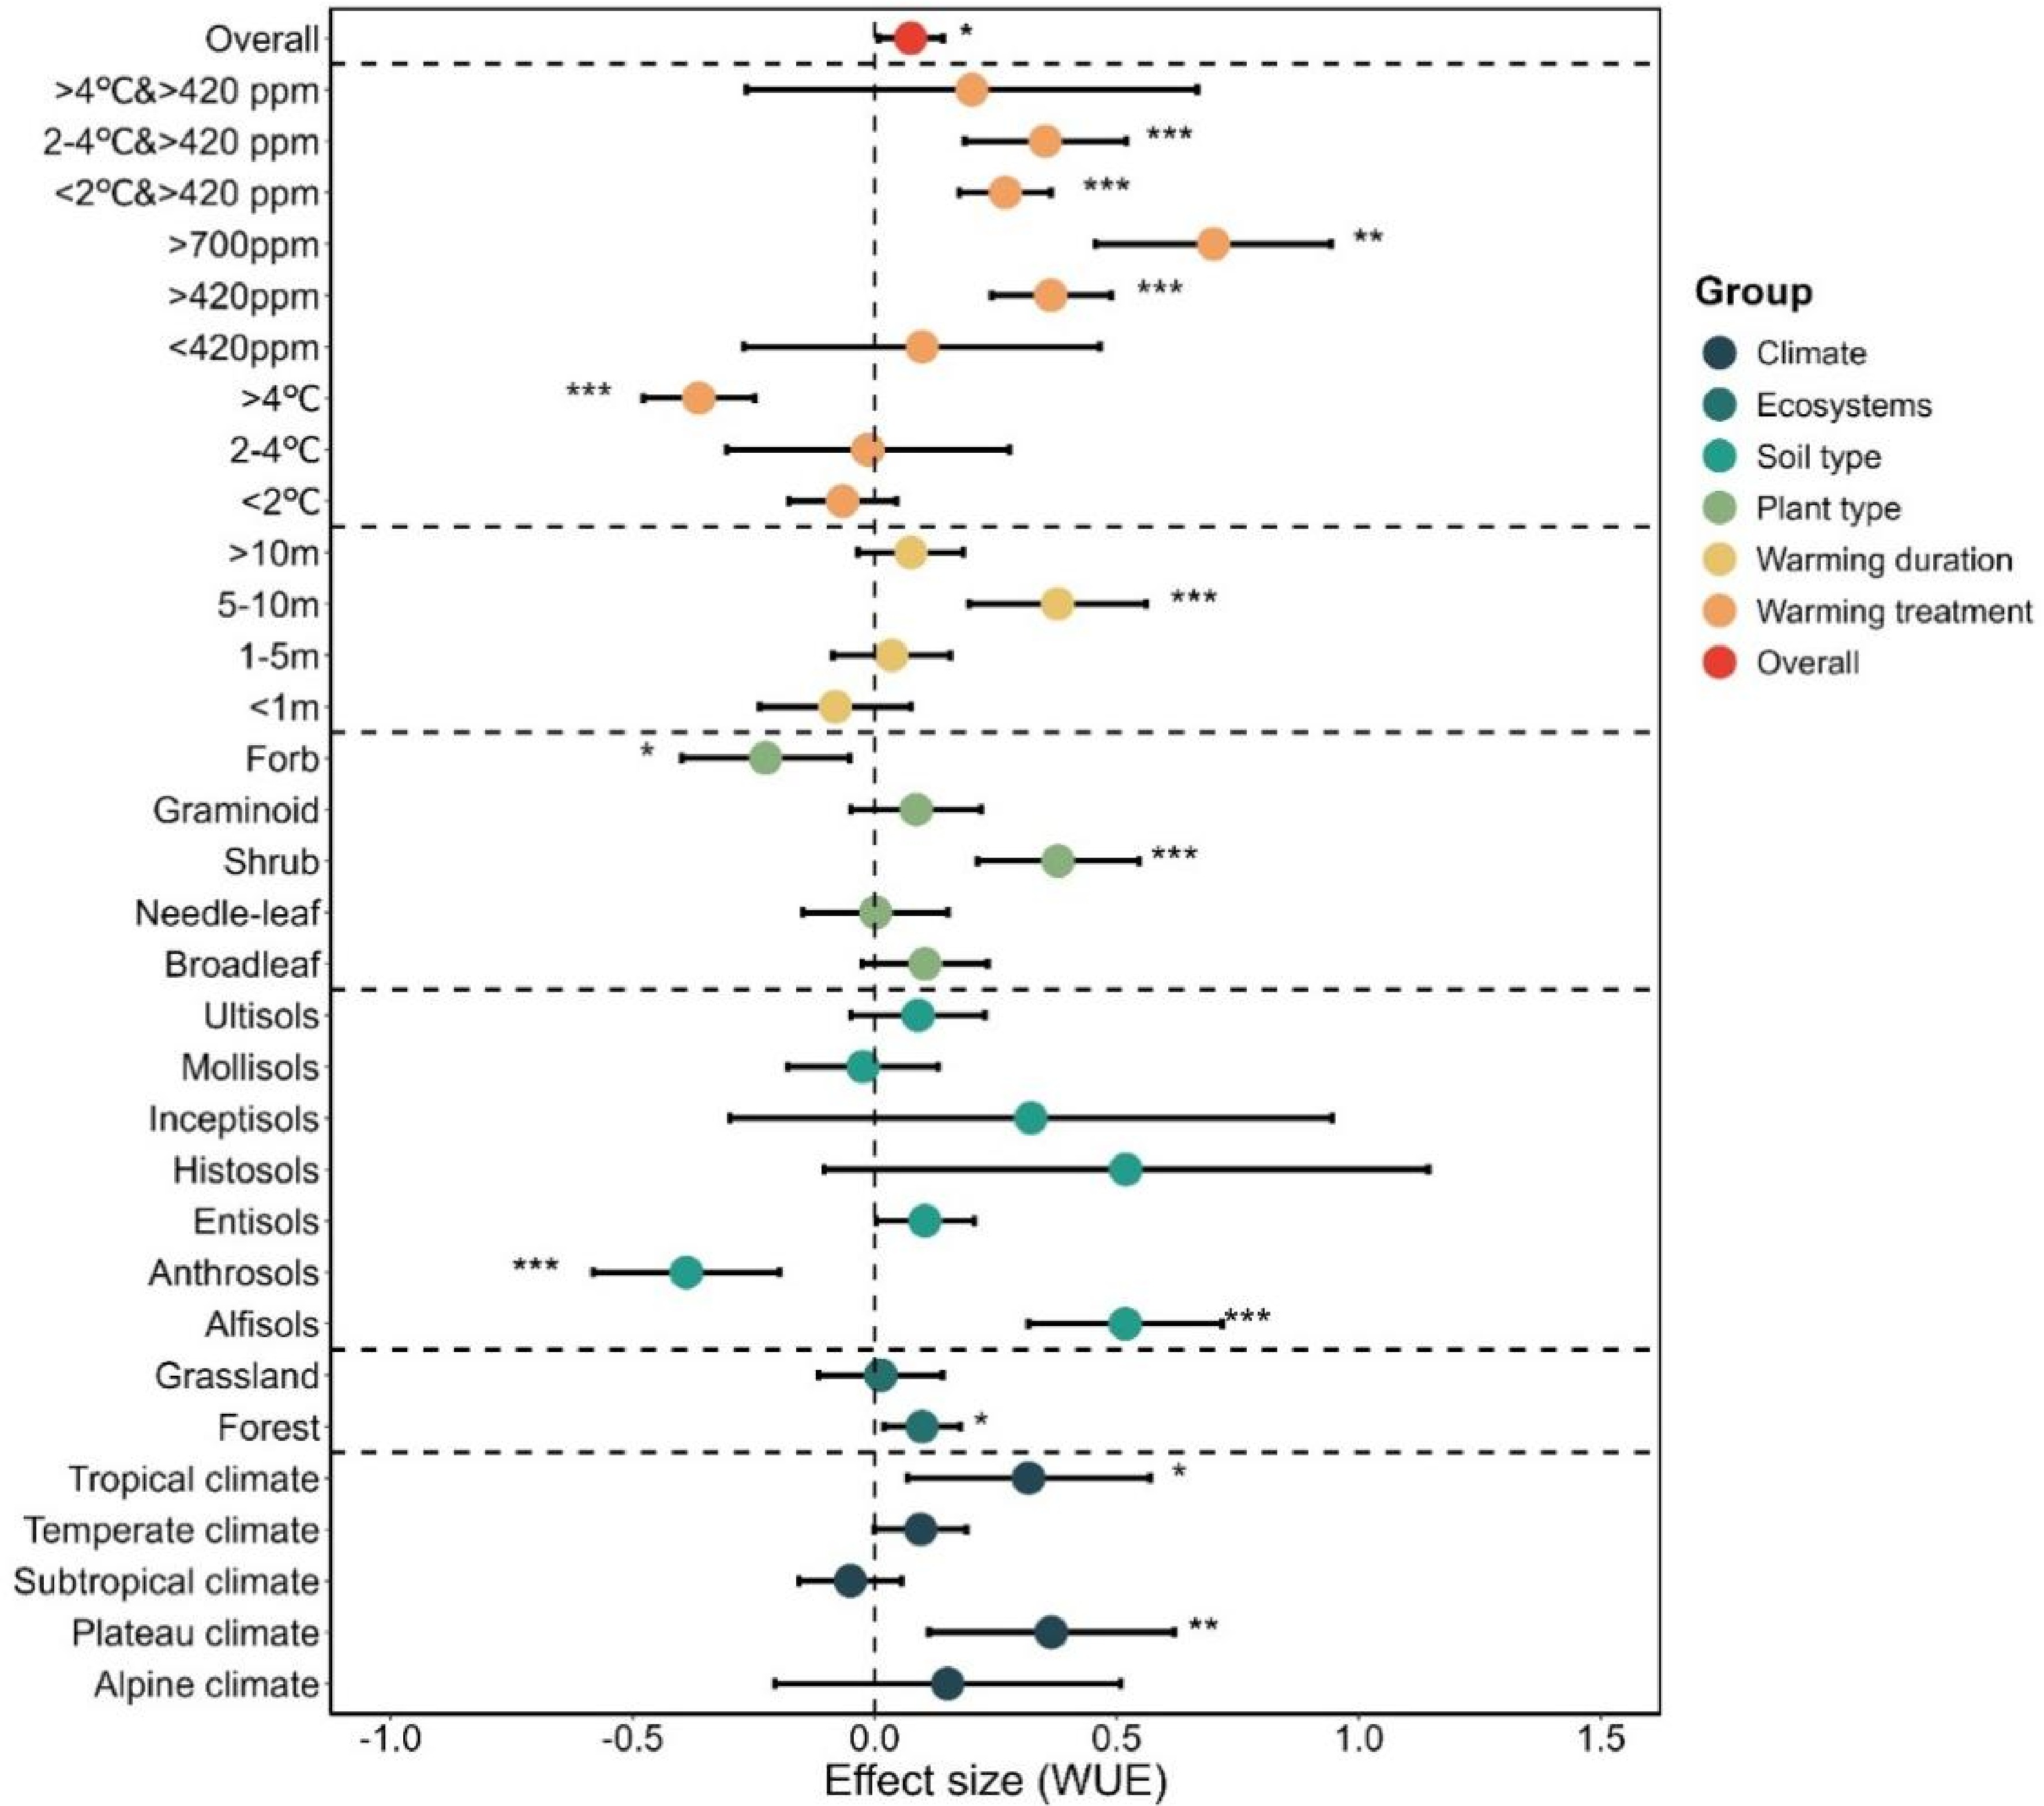
Figure 3.
Subgroup effect size of warming treatment (intensity and duration), ecosystems, soil texture, and plant types on plant WUE in forests and grasslands. Values represent lnRR and 95% CIs. * Indicates a significant correlation at the p < 0.05 level, ** indicates an extremely significant correlation at the p < 0.01 level, and *** indicates an extremely significant correlation at the p < 0.001 level.
The effect of climate warming on photosynthetic parameters in different groups
-
The effect of warming on photosynthetic parameters showed strong nonlinearity and factor interaction characteristics. Magnitudes of eT < 2 °C or > 4 °C mainly caused photosynthetic inhibition, resulting in a significant decrease in Pn by 20.37% and 18.22%, respectively (Supplementary Table S3). On the contrary, the eCO2 greatly reversed this inhibitory effect. When eT < 4 °C and eCO2 > 420 ppm, due to synergistic effects, Pn showed a strong promoting effect, with an increase of 47.52%, while eCO2 significantly stimulated the photosynthetic potential (+ 325.03%) at concentrations < 420 ppm (Supplementary Fig. S2a; Supplementary Tables S4, S5). Moreover, warming led to an overall significant decrease in Gs of 7.25% (Fig. 2; Supplementary Table S2). Under the background of CO2 greater than 420 ppm and 700 ppm, Gs was significantly downregulated by 16.19% and 18.39%, respectively (Supplementary Fig. S2b; Supplementary Tables S4, S5). In contrast, the overall effect of warming on T showed strong local heterogeneity (Fig. 2; Supplementary Fig. S2c). Although eCO2 > 420 ppm inhibited T (−11.70%), T increased significantly (21.75%) under eT > 4 °C (Supplementary Fig. S2; Supplementary Tables S3, S4). Overall, the warming significantly increased the plant δ13 C by 6.02% (Fig. 2; Supplementary Table S2). When eT < 2 °C and eCO2 > 420 ppm, δ13 C increased significantly by 18.23%, and when eCO2 > 420 ppm and 700 ppm, it increased significantly by 7.61% and 15.18%, respectively, while it significantly increased by 6.28% under eT at 2–4 °C. The response of photosynthetic physiology to warming showed significant time accumulation and nonlinear characteristics, especially for Pn and δ13 C. Short-term warming (< 1 month) triggered significant photosynthetic inhibition (Pn: −23.43%), but as the warming time was extended to 5–10 months, the plants showed strong positive adaptation (Pn: 36.33%; δ13 C: 10.23%), followed by continuous warming (> 10 months), the promotion effect began to decline (Supplementary Fig. S2; Supplementary Table S6). In addition, the response of these factors to warming varied in plant types, soil textures, ecosystems, and climates (Supplementary Fig. S2; Supplementary Tables S7–S10). In forest ecosystems, the warming effect promoted photosynthetic factors, but inhibited them in grasslands, and the warming had a greater effect on herbaceous plants, while only the T of coniferous trees showed a positive effect (Supplementary Fig. S2; Supplementary Table S10; T: 45.64%). δ13 C and Gs changed significantly in temperate climates (δ13 C: 12.54%; Gs: −12.16%), and the effects of soil texture on Pn, δ13 C, and T changed greatly (Supplementary Table S9).
Adaptive feedback of leaf morphology and biochemical traits to warming stress
-
The results showed that warming had variable effects on leaf functional traits. SLA, FV/FM, foliar nitrogen (FN), and stomatal size (SS) showed no significant responses, whereas chlorophyll content and stomatal density (SD) were significantly reduced (Supplementary Fig. S3). SLA increased by 33.10%, 39%, 14.60%, 52.58%, and 21.48% under warming < 2 °C with CO2 > 420 ppm interaction, warming < 2 °C, warming period > 10 months, Ultisols, and subtropical climate, respectively, while it decreased significantly by 26.83% and 13.77% under CO2 > 700 and 420–700 ppm, respectively (Supplementary Fig. S3a; Supplementary Tables S3–S10). FN decreased by 40.78%, 14.42%, 40.78%, 15.25%, and 23.78% under CO2 > 700 ppm, Broadleaf, Histosols, Entisols, and Alpine climates, respectively, while it increased significantly by 54.30%, 50.56%, and 40.30% under CO2 < 420 ppm, Graminoid, and Mollisols, respectively (Supplementary Fig. S3b; Supplementary Tables S3–S10). Chlorophyll decreased by 12.8%, 36.49%, 23.29%, 18.69%, 18.66%, 18.66%, and 14.82% under overall, eT at < 2 °C and eCO2 > 420 ppm interaction, warming duration of 1–5 months, Graminoid, Entisols, Forest, and Subtropical climates, respectively (Fig. 2; Supplementary Fig. S3c; Supplementary Tables S3–S10). FV/FM decreased significantly by 5.5%, 18.93%, and 9.79% under warming of 2–4 °C, Graminoid, and Mollisols, respectively (Supplementary Fig. S3d; Supplementary Tables S3–S10). SD decreased significantly by 12.58%, 27.75%, 13.74%, 10.24%, 11.44%, and 14.15% under warming < 2 °C with CO2 > 420 ppm, CO2 > 420 ppm, warming duration of 1–5 months, Ultisols, Forest, and Tropical climates, respectively (Supplementary Fig. S3e; Supplementary Tables S3–S10). Warming had no significant overall effect on pH (Supplementary Fig. S4a) and soil C (Supplementary Fig. S4b), but significantly decreased SWC by 15.56% overall (Fig. 2a; Supplementary Table S2, p < 0.05), and eT significantly reduced the effect size of SWC (Supplementary Fig. S4c). SWC decreased significantly by 32.75% during the short-term warming period in artificial soils and in grassland ecosystems, and temperate climates decreased significantly by 32.74%, 32.29%, and 30.54%, respectively (all p < 0.05; Supplementary Fig. S4; Supplementary Tables S6–S9). The effect size of leaf P was not significant, with only a decrease of 8.11% in subtropical climates (Supplementary Fig. S4d).
Variations in WUE and photosynthetic parameters along environmental warming gradients
-
Elevation, mean annual temperature (MAT), and warming methods exerted significant regulatory effects on plant WUE and were associated with physiological factors. Distinct divergent responses of WUE were observed under climate manipulation regimes. The lnRR of WUE displayed a slight increasing trend under eT and eCO2 (Fig. 4a), increased extremely significantly under eCO2 (p < 0.001; Fig. 4b; Supplementary Table S11), but had no change under eT (Fig. 4c). With elevation increasing, the lnRR of WUE in both forest and grassland ecosystems exhibited significant increasing trends (all p < 0.05; Fig. 5a), and the lnRR of Pn decreased significantly (p < 0.05; Supplementary Fig. S5a) in grasslands, while the lnRR of δ13 C in forests decreased (p < 0.001; Supplementary Fig. S6a). In contrast, the lnRR of T showed no changes in forest and grassland systems (all p > 0.05; Supplementary Fig. S5b). The lnRR of WUE and Pn in forests declined significantly (p < 0.05) with MAT increasing, but no change in the two systems with MAP changing (p > 0.05; Fig. 5; Supplementary Fig. S5). The lnRR of T in grasslands presented an extremely significant decreasing trend (p < 0.05; Supplementary Fig. S5d, f) with MAT and MAP increasing, while the variations in lnRR of T and δ13 C in forests were non-significant (Supplementary Figs S5, S6; Supplementary Table S12). Interestingly, the lnRR of Gs showed the same decreasing trend as MAP increased, but significantly so in forests (Supplementary Fig. S7; Supplementary Table S12).
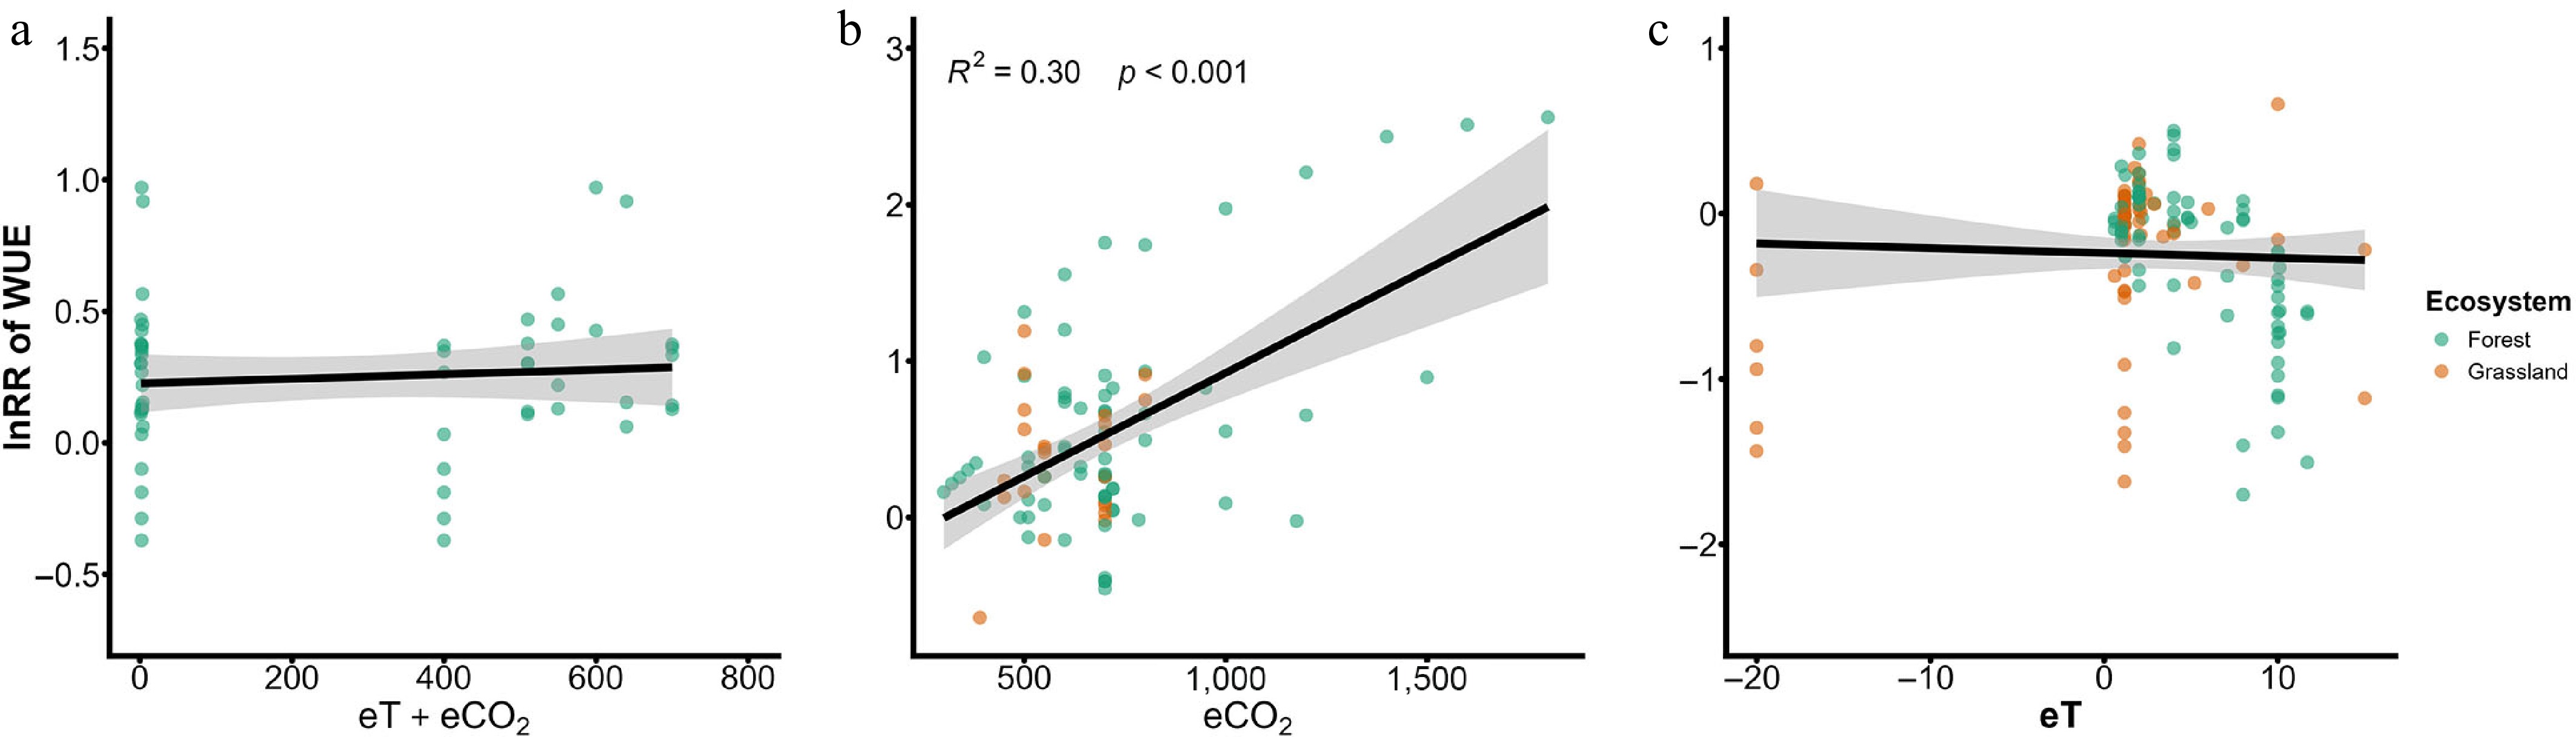
Figure 4.
Effects of different warming (eT, eCO2, and eT + eCO2) on WUE in forests and grasslands. The points represent the values predicted by the partial regression approach of warming treatments. Dashed lines show the average lnRR of WUE, whereas black lines show the mean responses with the 95% CI shaded.
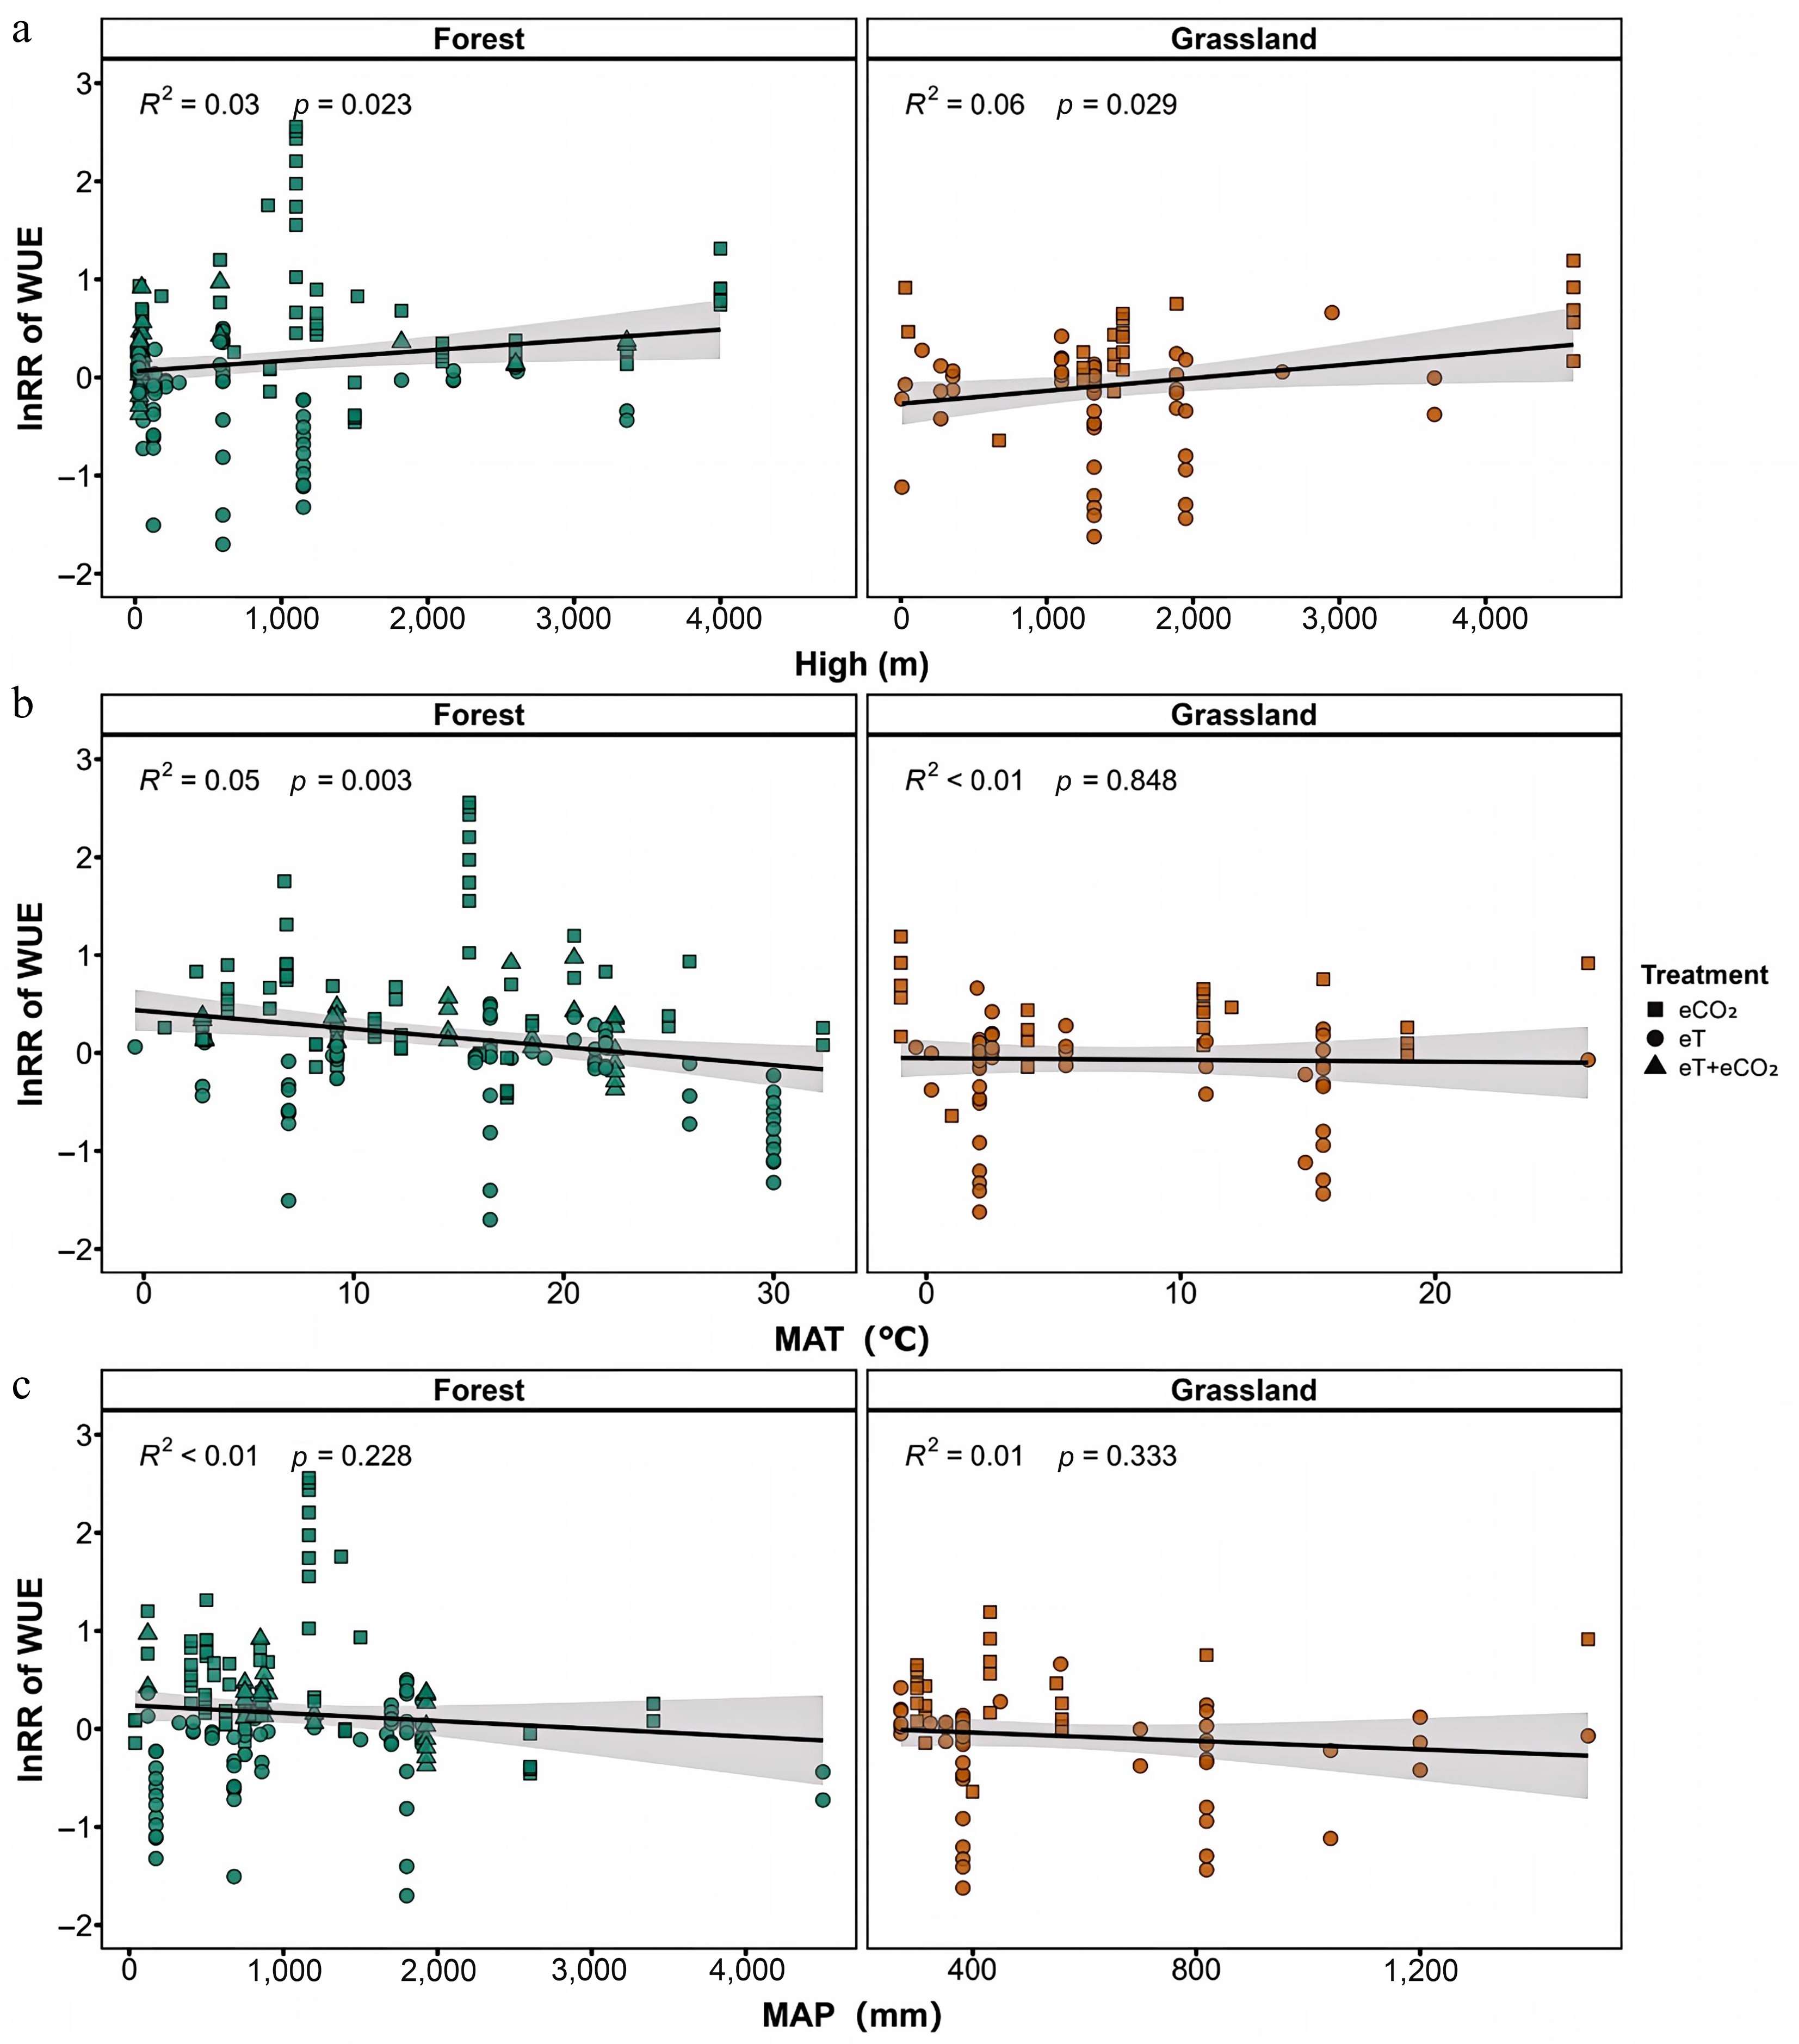
Figure 5.
Effects of MAT, MAP, and high on WUE in forests and grasslands. The points represent the values predicted by the partial regression approach of environmental factors. MAT, mean annual temperature; MAP, mean annual precipitation. Dashed lines show the average lnRR of WUE, whereas black lines show the mean responses with the 95% CI shaded.
Relationships between plant WUE and driving factors in forest and grassland ecosystems
-
In the forest ecosystem, the random forest model demonstrated strong explanatory power for WUE variation (R2 = 0.83). Variable importance analysis revealed that eT was the dominant driver, accounting for the highest increase in mean squared error (IncMSE = 21.6%). This was followed by a complex suite of structural and physiological factors, including SD (15.3%), Pn (15.2%), FP (15.1%), FN (14.7%), soil type (ST 10.9%), T (10.7%), and FV/FM (10.55%), while the contributions of all other variables were below 10% (Fig. 6; Supplementary Table S13). Correlation analysis highlighted a conservative water-use strategy in forests (Fig. 7). Specifically, WUE exhibited significant negative correlations with T and Gs, but a positive correlation with SWC (p < 0.05). Moreover, internal physiological co-ordinations were highly evident: Gs was negatively correlated with FN and SWC, yet positively associated with SLA and δ13 C. T scaled positively with SD and negatively with SWC. Furthermore, Pn showed positive associations with both WUE and δ13 C, but negative associations with FV/FM and SLA (p < 0.05), while its correlation with SD was not significant (p > 0.05). Additionally, δ13 C was positively linked to FN and negatively to TC (p < 0.05). Conversely, the explanatory power of the model was notably lower for the grassland ecosystem (R2 = 0.46). Here, the dominant drivers of WUE shifted towards gas exchange parameters, with Gs, Pn, and T ranking as the top three factors (IncMSE = 17.6%, 14.0%, and 11.7%, respectively). The relative importance of the remaining factors was generally below 10% (Fig. 6; Supplementary Table S14). Compared with the forest ecosystem, correlation analysis in grasslands revealed that WUE was significantly and positively correlated with both Gs and Pn, and negatively correlated with FN (p < 0.05). Additionally, Pn exhibited positive correlations with Gs and T, but a negative correlation with FV/FM (p < 0.05) (Fig. 7).
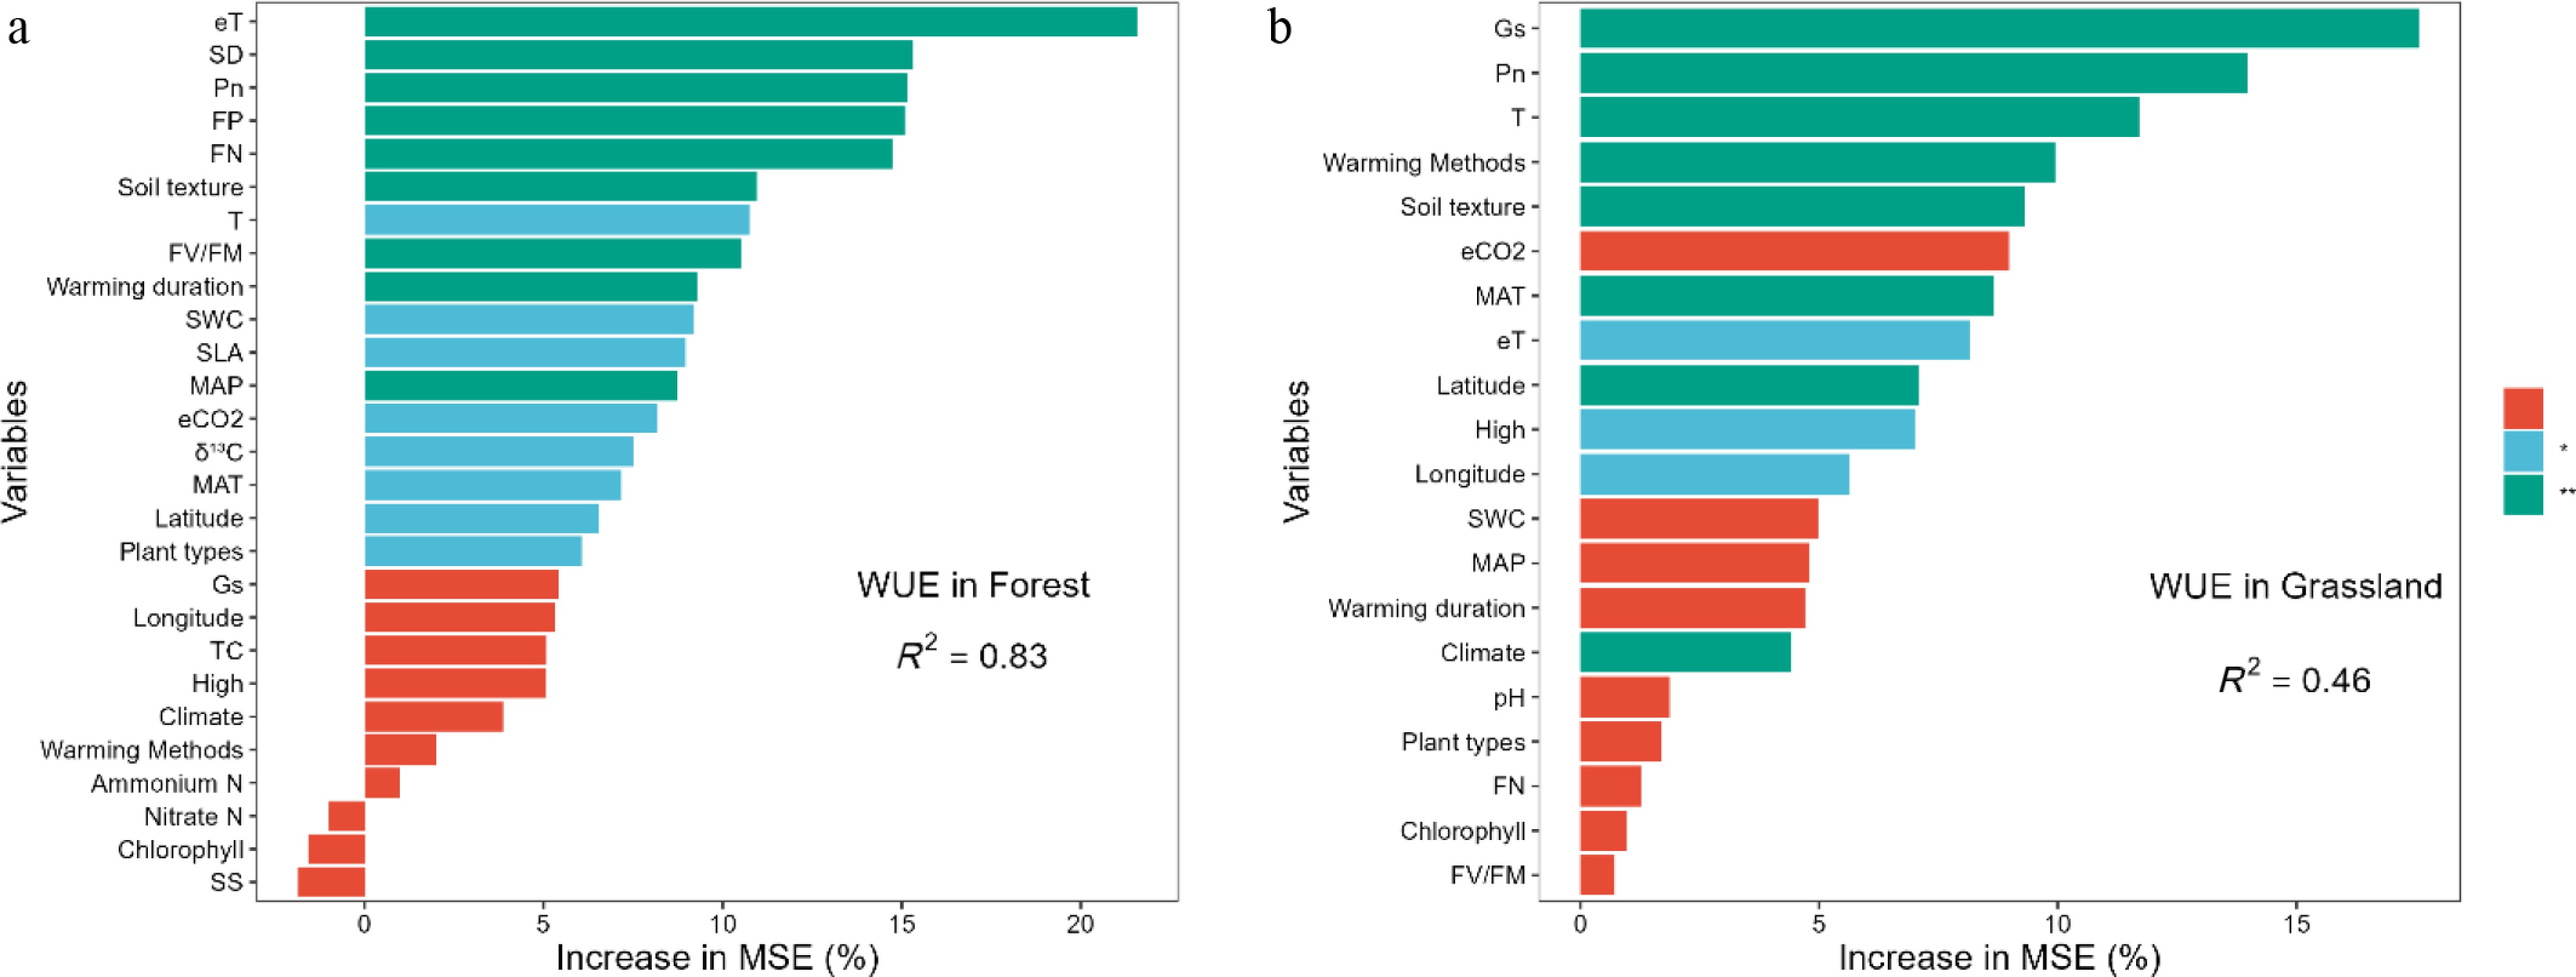
Figure 6.
Variable importance of explanatory factors based on the Random Forest model in (a) forests and (b) grasslands. WUE, water use efficiency; δ13 C, carbon stable isotope composition; Pn, net photosynthetic rate; Gs, stomatal conductance; T, transpiration rate; SD, stomatal density; SS, stomatal size; TC, total carbon; SWC, soil water content; FN, foliar nitrogen; FP, foliar phosphorus; FV/FM, Maximum quantum yield of PSII; SLA, specific leaf area; eT, elevated temperature; eCO2, elevated CO2 concentration; MAT, mean annual temperature; MAP, mean annual precipitation.
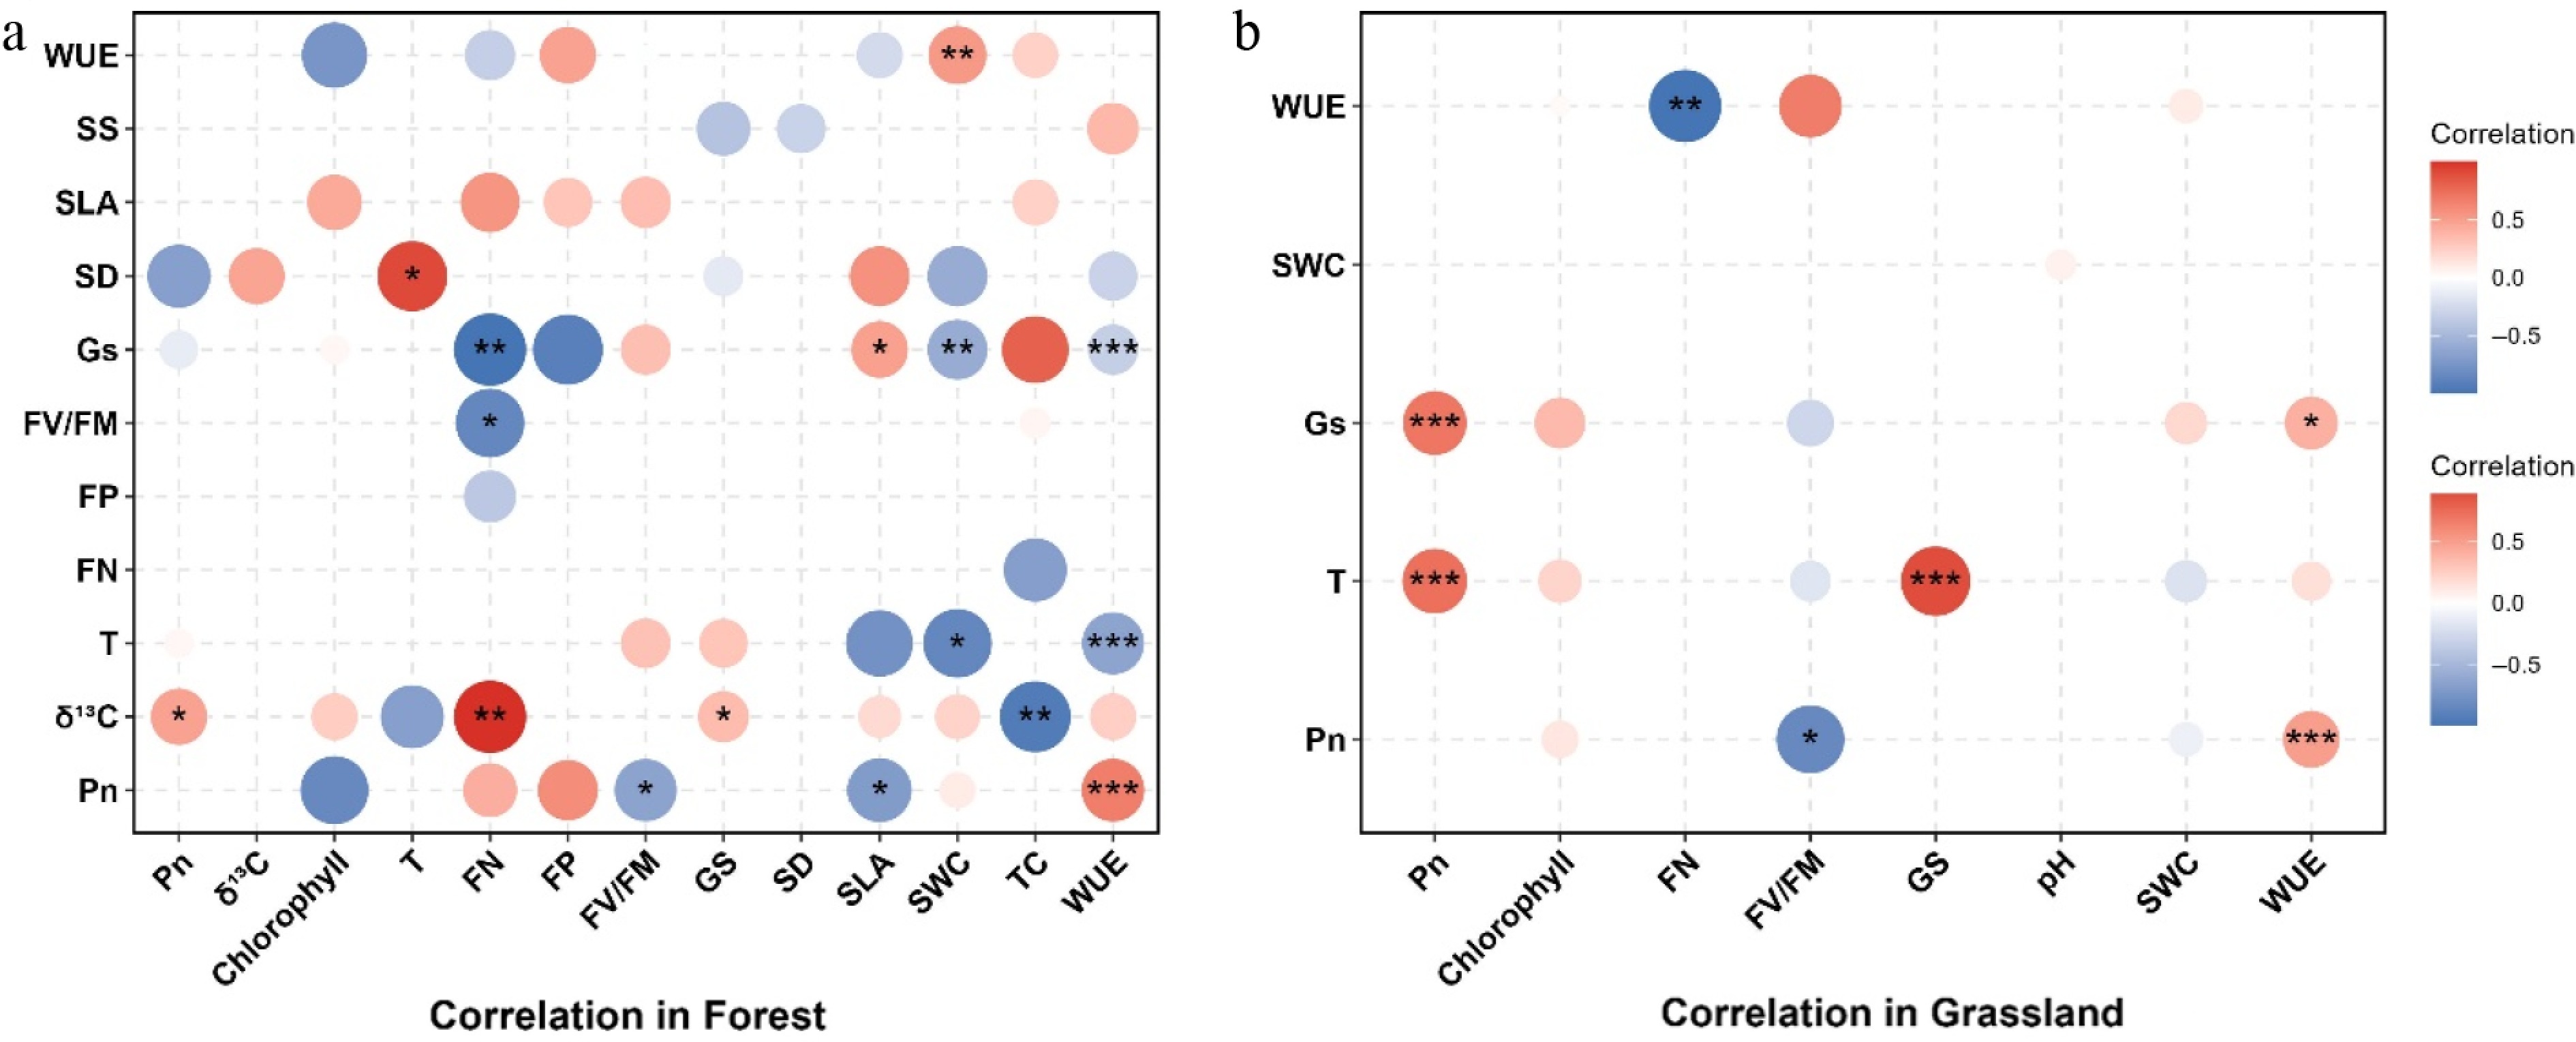
Figure 7.
The correlation between plant WUE and abiotic factors under warming treatment in (a) forests and (b) grasslands. The numbers in the box indicate the correlation coefficient and significance.
-
The result showed that warming significantly promoted plant WUE, which is primarily associated with a passive adjustment to warming-induced soil moisture deficits and stomatal status (Fig. 2; Supplementary Fig. S4). Under increasing water limitation with warming (SWC: −15.56%), plants consistently reduced Gs and SD to constrain transpirational water loss, reflecting a conservative stomatal strategy that helps maintain hydraulic integrity while sustaining baseline carbon assimilation[38]. This enhancement in WUE was distinguished between forms and duration of warming. Elevated CO2 consistently exerted a positive effect on WUE, accompanied by increases in Pn and δ13 C, indicating that enhanced carbon assimilation is the primary driver of WUE improvement. In contrast, Gs showed a general declining trend under elevated CO2, suggesting partial but limited stomatal regulation. The promoted Pn and impaired stomatal functionality under eCO2 can enhance WUE by ultimately increasing water consumption[39,40], which supported our results. As a key determinant of plant photosynthesis, plant used to showing positive responses to temperature within an optimal temperature range[41]. In this meta-analysis, temperature increase induced an overall reduction in WUE, which is contrary to recent analyses[38]. First of all, the response of Pn was greater than that of T and Gs, which caused the downgrade of WUE. Second, changes in mesophyll and stomatal status can cause different responses of photosynthesis under eT[42]. High temperature reduces WUE, as previously reported, because Gs rises disproportionately to Pn. This excessive stomatal opening, beyond photosynthetic demand, promotes transpiration cooling at the cost of lower WUE. The interaction between elevated CO2 and warming was generally positive, suggesting that CO2 fertilization partially offsets warming-induced water stress by enhancing carbon gain. This compensatory effect results in an overall stabilization or increase in WUE under combined treatments. Temporal dynamics further reveal a nonlinear response pattern, where WUE, Pn, and δ13 C initially increased with warming duration but declined under prolonged exposure. This pattern suggests a transition from short-term physiological acclimation to long-term stress-induced downregulation. Collectively, these results indicated that WUE responses under global change were governed by a trade-off between carbon acquisition and water limitation, with elevated CO2 enhancing carbon gain, warming imposing hydraulic and nutritional constraints, and their interaction producing partial compensation modulated by exposure time. Concurrently, SD and SS decreased by 11.44% and 1.73%, respectively, which likely limited transpiration and reduced water loss. At the same time, elevated chlorophyll content and enhanced photosynthetic capacity (Pn: +47.52%) supported efficient carbon assimilation, contributing to the observed increase in WUE. Notably, when the interactions of warming duration, warming magnitude, and CO2 concentration exceed certain thresholds, WUE shifted from an increase to a decrease, reflecting the lagged and cumulative effects of extreme climatic events[43]. This was compounded by soils like Anthrosols, which further reduced WUE by 32.23% (Supplementary Table S9); the poor structure and low organic matter content might limit water retention and root development, collectively exacerbating the negative WUE response.
Response of the leaf functional traits to climate warming
-
Warming interactively altered key plant morphological and physiological traits, with responses strongly regulated by environmental gradients and vegetation types. Morphologically, high eCO2 generally reduces SLA by promoting starch accumulation and mesophyll thickening. The overall effect size of SLA was positive but not significant, whereas SLA increased significantly under the combined eT and eCO2 treatment, particularly at low warming intensity and low CO2 concentrations. This pattern suggests that moderate warming and CO2 enrichment may favour a more acquisitive leaf strategy under certain resource conditions, partially offsetting the tendency towards lower SLA induced by eCO2[44,45], which accounts for the change in SLA in the results (Supplementary Fig. S3a; Supplementary Tables S3–S10). FN also exhibited strict CO2-dependence, significantly decreased under CO2 > 700 ppm and significantly increased under CO2 < 420 ppm (Supplementary Fig. S3b; Supplementary Tables S3–S10). High CO2 reduces the nitrogen demand of the photosynthetic system by inhibiting photorespiration and de novo nitrate assimilation, while downregulating Rubisco synthesis via sugar signaling—a process independent of soil N availability[46−48]. Conversely, under low CO2, plants increase N investment to synthesize more Rubisco[49]. Chlorophyll content consistently decreased under the interaction of warming and elevated CO2 (Supplementary Fig. S3c; Supplementary Tables S3–S10). This degradation was synergistically driven by heat-induced disruption of chloroplast ultrastructure[50,51] and high CO2-induced starch accumulation, which might distort thylakoid lamellae[44]. Concurrently, warming impaired photosystem II (PSII) electron transport, reducing maximum photochemical efficiency (FV/FM)[52,53]. This FV/FM decline was exacerbated in graminoids; despite higher root branching, their lower organic acid exudation and transpiration rates restrict the xylem-driven transport of essential nutrients to leaves[54,55]. Numerous studies demonstrated that elevated CO2 concentration typically reduces stomatal density, stomatal index, and stomatal conductance, thereby decreasing transpiration, raising leaf temperature, and conserving soil moisture during the growing season[56,57]. The significant reduction in SWC was the most direct hydrological response to warming, closely related to enhanced soil evaporation and increased plant transpiration caused by higher temperatures, which exacerbated P limitation for plants and microbes[58]. This finding suggests that future climate warming may attenuate the fertilization effect of elevated atmospheric CO2 on plant WUE.
Warming-induced regulation mechanisms of WUE in forest and grassland ecosystems
-
The different degrees of trends observed between forests and grasslands (Supplementary Tables S8, S10) indicate a fundamental divergence in their response mechanisms to warming. For forest ecosystems, warming significantly increased WUE by 10.3% (Supplementary Table S8), which is consistent with previous studies[59], while WUE in grassland ecosystems showed no significant change. In the forest ecosystem, eT emerged as the paramount variable explaining WUE variation (IncMSE = 21.6%). With the correlation heatmap (Fig. 7), we observed that this high sensitivity was fundamentally mediated by conservative physiological feedback. When confronted with potential water stress induced by warming, forest plants tend to downregulate Gs and T. This conservative behavior was strongly corroborated by the significant negative correlations between WUE and both Gs and T, which pronounced thermal sensitivity points to a fundamental structural bottleneck. As experimental warming drives up vapor pressure deficit (VPD) and depletes soil water content (SWC), forest canopies face intense hydraulic stress[60]. High VPD directly intensifies atmospheric evaporative demand, triggering stomatal closure before high-temperature biochemical damage even occurs[61−63]. To avoid excessive water loss, these species proactively restrict their stomatal aperture—a behavior clearly reflected in the negative correlations between WUE, Gs, and T in these results. Over longer experimental durations, plants also downregulate SD to adapt structurally to drier conditions[64]. However, limiting gas exchange inevitably restricts the supply of CO2 to the mesophyll. To maintain Pn despite this limitation, forests appear to shift their biochemical investments. Our correlation analysis revealed that FN was correlated positively with both Pn and δ13 C. By upregulating photosynthetic enzyme capacity (e.g., Rubisco), leaves can sustain carbon assimilation even when intercellular CO2 drops. This biochemical compensation minimizes carbon isotope fractionation and enriches the δ13 C signature[65]. Ultimately, this successful coupling of structural water conservation and biochemical adjustment drives the significant WUE increase observed in the forest subgroup of this meta-analysis. In contrast, grassland WUE is predominantly driven by Gs and Pn, and the heatmap reveals a robust association among these variables, which indicates coordinated regulation of carbon gain and water loss rather than independent effects of Pn and Gs on WUE. Grasses rely heavily on shallow root networks, making them less sensitive to gradual thermal trends but highly responsive to episodic soil moisture pulses[66]. Consequently, they adopt an opportunistic strategy, maximizing Gs when microclimatic conditions allow, thereby pushing Pn as high as possible. The primary issue under sustained experimental warming is that this opportunistic strategy is rendered unviable. Our overarching meta-analysis indicates that continuous warming consistently suppresses both SWC and Gs across studies. By eliminating the high-conductance windows that grasses depend on, warming effectively neutralizes their primary method of carbon-water coupling[67]. Furthermore, the lack of correlation between WUE and FN in the grassland data suggests that these plants do not systematically invest in the long-term biochemical compensations (such as nitrogen reallocation) employed by forests to buffer heat stress. Without this physiological plasticity, grasslands struggle to adapt to sustained environmental constraints. This biological limitation thoroughly explains the high unexplained variance (R2 = 0.46) in the machine learning model. To sum up, forest WUE is more sensitive to temperature changes, being subject to long-term regulation by Gs and T, and δ13 C, as a stable indicator of long-term WUE[68,69].
In addition, leaf functional types affected WUE responses to warming. Specifically, the responses of both forbs in grasslands and shrubs in forests showed significant changes (Fig. 3), which comes from the adaptive divergence of the two types of plants. Firstly, forbs have shallow root systems and are highly dependent on surface soil moisture[70]. Warming reduced SWC and decreased Gs by 5.9% and Pn by 27.5% (Supplementary Table S10), which inhibits photosynthetic carbon assimilation[71]. Secondly, forbs lack effective transpiration regulation[72]. Higher temperatures induce excessive stomatal opening (T: +23.14%), subsequently lowering water-use efficiency. Thirdly, shrubs have evolved a conservative water use strategy with greater heat tolerance and hydraulic safety[73,74]. This trait differentiation also indicates that shrubs may gradually gain a competitive advantage over herbaceous plants in the community under climate warming. The divergent WUE responses along the MAT gradient originate from contrasting life-history strategies. Notably, MAP had no significant regulatory effect on WUE in either ecosystem (p > 0.05), indicating that within the precipitation gradient of this study, water is not a direct limiting factor for WUE. Instead, WUE changes are more strongly regulated by factors such as temperature and CO2 concentration[75]. Furthermore, WUE in forest and grassland ecosystems increased with elevation, but their response strategies differ, mainly depending on life form differences. Low temperatures at high elevation reduce transpiration water loss, while strong radiation and low atmospheric pressure drive plants to optimize stomatal regulation and improve photosynthetic efficiency, thereby enhancing WUE[69]. However, forest trees mainly regulate stomatal behavior to adapt to long-term warming stress with decreased Gs along elevation, while grasslands respond to warming via photosynthetic plasticity, adopting passive water regulation accompanied by simultaneous decreases in Pn and Gs with increasing elevation. The differences show the eco-physiological optimization trade-off of plants between stomatal behavior and photosynthetic capacity under pressure deficit variations[76].
Despite the robust mechanistic insights provided by our integrated analysis, certain limitations warrant consideration. Notably, the absence of VPD data and other factors (such as root functional traits), which could change root morphology or physiology to adapt to water changes[77,78] in this primary dataset, remains a constraint. Future syntheses incorporating high-resolution VPD monitoring alongside soil moisture gradients would further refine our understanding of how ecosystems transition between energy-limited and water-limited states under climate warming.
-
This meta-analysis demonstrated that climate warming significantly enhanced plant WUE in forest and grassland ecosystems (forest: 10%; grassland: 1.37%), accompanied by increased δ13 C (6.02%) and reduced stomatal conductance (Gs), stomatal density (SD), and soil water content (15.56%). However, this warming-induced enhancement was strongly context-dependent, exhibiting nonlinear responses to warming intensity and duration. Specifically, plant carbon–water coupling exhibits a robust positive acclimation only under moderate warming (≤ 4 °C) and medium-term durations (5–10 months). When warming exceeds the 4 °C limit or becomes prolonged, these gains are rapidly reversed as severe hydraulic constraints and biochemical degradation overwhelm plant defenses. Furthermore, elevated CO2 (> 420 ppm) will act as a pivotal buffering agent against such thermal stress. Its synergistic fertilization effect effectively reverses heat-induced photosynthetic inhibition, exerting a far stronger positive effect on carbon–water coupling than warming alone. In addition, ecosystems also exhibited divergent adaptive strategies. Forests likely rely more on conservative stomatal control (reduced stomatal conductance and density) and long-term structural adjustments (enhanced foliar nitrogen), making them highly sensitive to thermal thresholds and prone to WUE declines under rising mean annual temperature. Conversely, grasslands leverage higher phenotypic plasticity, maintaining carbon–water equilibrium through agile, short-term gas exchange adjustments. These findings improve the mechanistic understanding of carbon–water coupling under global warming and support predictive modeling of terrestrial ecosystem functions.
-
The authors confirm their contribution to the paper as follows: conception and design: Jiang X, Fu S, Song M; data collection, original draft manuscript preparation: Jiang X, Lu S, Tang Y, Chen Q, Yang P, Chen M, Song M; writing − review and editing: Jiang X, Liu M, Song M; supervision, project administration: Liu M, Fu S, Song M; All authors reviewed the results and approved the final version of the manuscript.
-
All data generated or analyzed during this study are included in this published article and its supplementary information files.
-
The authors declare that they have no conflict of interest.
-
accompanies this paper online at: https://doi.org/10.48130/fra-0026-0009.
- Supplementary Table S1 Results from the Egger's tests of publication bias and fail-safe number on our findings.
- Supplementary Table S2 Overall percentage change (%) and lnRR of factors in response to warming.
- Supplementary Table S3 Percentage change (%) and lnRR of factors in response to warming under different intensity (eT).
- Supplementary Table S4 Percentage change (%) and lnRR of factors in response to warming under different intensity (eCO2).
- Supplementary Table S5 Percentage change (%) of and lnRR factors in response to warming under different intensity (eT + eCO2).
- Supplementary Table S6 Percentage change (%) of and lnRR factors in response to warming under different duration.
- Supplementary Table S7 Percentage change (%) of and lnRR factors in response to warming under different climate type.
- Supplementary Table S8 Percentage change (%) of and lnRR factors in response to warming under forest and grassland system.
- Supplementary Table S9 Percentage change (%) of and lnRR factors in response to warming under different soil texture.
- Supplementary Table S10 Percentage change (%) of and lnRR factors in response to warming with different plant types.
- Supplementary Table S11 Relationships of WUE, leaf traits, photosynthetic parameters, soil factors (soil pH, TC, SWC) and environment factors (MAP, MAT and high) under warming.
- Supplementary Table S12 Relationships of WUE, leaf traits, photosynthetic parameters, soil factors (soil pH, TC, SWC) and warming methods.
- Supplementary Table S13 The relative importance and significance of driving factors based on the Random Forest model in forest system.
- Supplementary Table S14 The relative importance and significance of driving factors based on the Random Forest model in grassland system.
- Supplementary Fig. S1 The meta-analysis's research sites' geographic distributions (52 study sites) in the map.
- Supplementary Fig. S2 Subgroup effect size of warming treatment (intensity and duration), ecosystems, soil texture and plant types on plant photosynthetic and water physiological traits in forest and grassland (a, Pn; b, Gs; c, T; d, δ13C).
- Supplementary Fig. S3 Subgroup effect size of warming treatment (intensity and duration), ecosystems, soil texture and plant types on leaf functional traits and stomatal traits in forest and grassland (a, SLA; b, FN; c, Chlorophyll; d, FV/FM; e, SD; f, SS).
- Supplementary Fig. S4 Subgroup effect size of warming treatment (intensity and duration), ecosystems, soil texture and plant types on soil properties (a, pH; b, soil C; c, SWC) and leaf P content (d) in forest and grassland.
- Supplementary Fig. S5 Relationship between the lnRR of Pn, T and (a, b) high, (c, d) mean annual temperature (MAT), and (e, f) annual average precipitation (MAP).
- Supplementary Fig. S6 Relationship between the lnRR of δ13C (carbon stable isotope composition) and (a) high, (b) mean annual temperature (MAT), and (c) annual average precipitation (MAP).
- Supplementary Fig. S7 Relationship between the lnRR of Gs (stomatal conductance) and annual average precipitation (MAP) in forest and grassland systems.
- Supplementary Text 1 The data used in this study were collected from the following published papers.
- Copyright: © 2026 by the author(s). Published by Maximum Academic Press, Fayetteville, GA. This article is an open access article distributed under Creative Commons Attribution License (CC BY 4.0), visit https://creativecommons.org/licenses/by/4.0/.
-
About this article
Cite this article
Jiang X, Lu S, Tang Y, Chen Q, Yang P, et al. 2026. Climate warming affects vegetation water use efficiency in forest and grassland ecosystems. Forestry Research Advances 1: e014 doi: 10.48130/fra-0026-0009 

Climate warming affects vegetation water use efficiency in forest and grassland ecosystems
- Received: 17 May 2026
- Revised: 22 July 2026
- Accepted: 29 July 2026
- Published online: 28 September 2026
Abstract: Climate warming profoundly changes the carbon–water cycling processes in terrestrial ecosystems, and water use efficiency (WUE) is a key physiological indicator reflecting the relationship between carbon assimilation and water consumption. However, how warming intensities and environmental conditions regulate the response of plant WUE remains unquantified. We conducted a meta-analysis based on 52 publications and 258 sets of paired observational data to investigate the effect of climate warming on plant WUE in forest and grassland ecosystems and key environmental drivers. Overall, warming significantly increased plant WUE (7.73%), while the degree of response differed between forest (+ 10.3%) and grassland (+ 1.31%), which was highly nonlinear and context-dependent. Specifically, elevated temperature (eT) exceeding 4 °C reduced WUE by 30%, and the stimulation peaked at 45.94% during the 5–10 months. Elevated CO2 substantially enhanced WUE, although this enhancement was attenuated by eT. These shifts were accompanied by decreases in soil water content (15.56%), chlorophyll (12.8%), and stomatal density (11.44%), concomitant with an increase in plant δ13 C (6.02%; p < 0.05). Moreover, warming drove divergent ecosystem responses. Forests likely exhibit a conservative strategy, coupling structural water conservation with biochemical buffering to sustain photosynthesis. Conversely, grasslands tend to show an opportunistic strategy, which becomes unstable under sustained warming due to the loss of episodic moisture pulses and a lack of physiological plasticity. Environmental factors, including elevation and mean annual temperature, further regulated WUE responses. Our findings reveal ecosystem-specific and nonlinear WUE responses to warming and improve predictions of terrestrial carbon–water dynamics under climate warming.
-
Key words:
- Water use efficiency /
- Climate warming /
- Forest and grassland /
- Photosynthetic parameters