


-
Banana (Musa spp.) is a monocotyledonous herbaceous crop that originated in Southeast Asia and is currently cultivated in more than 135 countries across tropical and subtropical regions worldwide[1−3]. As one of the most important staple foods, bananas meet the dietary needs of over 400 million people, particularly in Africa[4]. Beyond its role as a fresh fruit, banana is widely consumed either raw or processed and serves as a functional ingredient in diverse food products[5].
Starch metabolism is a critical determinant of fruit quality. In starchy fruits such as banana[6−8], kiwifruit[9], and mango[10,11], starch degradation directly influences sweetness, texture, waxiness, and postharvest shelf life. In cereal crops, starch breakdown provides a sustained carbon supply during seed germination and early seedling establishment[12,13]. These observations underscore the physiological importance of starch catabolism in both reproductive and postharvest developmental contexts. Starch degradation is a highly coordinated and multistep biochemical process. Numerous enzymes participating in this pathway have been characterized, including glucan, water dikinase (GWD)[14,15], phosphoglucan water dikinase (PWD)[16], starch excess 4 (SEX4)[17], Like SEX4 isoforms 1 and 2 (LSF1/2)[8], starch phosphorylase (PHO)[6], α-amylases (AMY)[18], and β-amylase (BAM)[19]. Despite the identification of these core components, it remains unclear whether additional regulatory or catalytic proteins contribute to starch degradation in fresh fruit.
Sucrose nonfermenting-1-related protein kinase 2 (SnRK2) is a plant-specific serine/threonine protein kinase characterized by an N-terminal catalytic kinase domain and a C-terminal regulatory domain[20]. SnRK2 proteins are central regulators of plant growth, development, and abiotic stress responses, primarily through the abscisic acid (ABA) signaling pathway[20]. Based on phylogenetic classification, SnRK2 members are grouped into three subfamilies (I–III)[21]. Group I and II kinases are typically activated via ABA-independent mechanisms, whereas group III members (SnRK2.2/2.3/2.6) are strongly responsive to ABA and function as core components of ABA signaling[22]. In Arabidopsis thaliana, SnRK2.2 phosphorylates transcription factors (TFs) associated with ABI3 and VP1 (RAV), modulates the expression of abscisic acid-insensitive genes ABI3, ABI4, and ABI5, and thereby regulates seed development and dormancy[23]. In tomato, SnRK2.3 enhances cytoplasmic glucose accumulation, phosphorylates the TF ABRE-binding factor 1.2 (AREB1.2), and regulates the expression of tonoplast sugar transporters TST1/2, ultimately affecting fruit sugar accumulation[24]. During strawberry ripening, elevated ABA levels suppress SnRK2.6 expression, relieving phosphorylation-mediated inhibition of the TF bHLH3, promoting the transcription of UDP-glucose: flavonol O-glucosyltransferase (UFGT), and accelerating fruit coloration[25]. In cassava, the MeSnRK2.3–MebHLH68 regulatory module links ABA signaling with starch biosynthesis[26]. Furthermore, several transcription factors—including MYBs, homeobox proteins (HBs), and AREB1—have been reported to regulate SnRK2 expression and participate in developmental and ripening processes[24,27−29]. For example, the R2R3-MYB transcription factor PsFLP positively regulates SnRK2.3 expression to promote symmetric division of guard mother cells during stomatal development in Pisum sativum[27]. In apple, MdSnRK2.4 and MdSnRK2.9 phosphorylate MdHB1 and MdHB2, enhancing their protein stability and stimulating ethylene biosynthesis associated with fruit ripening and osmoregulation[28]. In banana, the MaMADS1-MaNAC083 transcriptional regulatory cascade regulates ethylene biosynthesis during banana fruit ripening[30]. The interaction between MuMADS1 and MaOFP1 affects banana ripening[31]. In both apple and tomato, the SnRK2.3–AREB1–TST1/2 cascade mediates sugar accumulation across the tonoplast[24]. Nevertheless, whether MYBs, HBs, AREB1, or other interacting factors regulate banana SnRK2 genes and thereby influence fruit starch degradation remains to be elucidated.
In the present study, we identified 14 distinct MaSnRK2 members in the banana A-genome database and systematically characterized their genome-wide features, evolutionary relationships, transcriptome profiles, and spatiotemporal expression patterns. Among them, the subcellular localization of the highly expressed MaSnRK2.10 protein was examined in Nicotiana benthamiana leaf cells. The functional significance of MaSnRK2.10 during fruit ripening was further assessed through transient silencing and transient overexpression assays in banana fruit. Additionally, molecular docking analysis was employed to predict potential transcription factor partners of MaSnRK2.10. Collectively, these findings provide a theoretical framework for elucidating the role of SnRK2 genes in fruit starch degradation and offer valuable candidate genes for improving postharvest fruit quality and developing storage-tolerant banana cultivars through molecular breeding.
-
The banana cultivar 'Cavendish' (Musa acuminata, AAA genotype) was cultivated in the Banana Germplasm Nursery (19° N, 110° E) at the Chinese Academy of Tropical Agricultural Sciences, Wenchang, Hainan Province, China. For spatial expression analysis, roots, leaves, and fruits were collected at 80 d after the emergence of the inflorescence from the pseudostem (DAF; days after flowering). For temporal expression analysis during fruit development and ripening, pulp samples were harvested at 0, 20, and 80 DAF, as well as at 0, 8, and 14 d postharvest (DPH). Each sampling point consisted of three biological replicates.
Genome-wide identification of SnRK2 genes
-
The protein sequences of Arabidopsis thaliana AtSnRK2.1–AtSnRK2.10 (TAIR10) were used as query sequences to identify banana SnRK2 homologs via BLASTp (E-value ≤ 1 × 10⁻¹⁰) against the banana A genome (DH Pahang, v2)[32]. Candidate proteins were further validated for conserved kinase domains using SMART and the NCBI Conserved Domain Database (CDD). After removing redundant sequences, 14 non-redundant MaSnRK2 genes were identified and designated MaSnRK2.1–MaSnRK2.14 according to their chromosomal positions. Physicochemical properties of the encoded proteins were predicted using ExPASy ProtParam[33]. Subcellular localization was predicted using Cell-PLoc 2.0 and WoLF PSORT[34].
Gene structure, conserved motifs, and phylogenetic analysis
-
Conserved motifs of SnRK2 proteins were identified using MEME Suite v5.5.0 with the following parameters: maximum motif number = 10 and motif width between 6 and 200 amino acids[35]. Exon–intron structures were visualized using TBtools based on genome annotation (GFF3) files[34]. Phylogenetic analysis was conducted using MEGA-X v10.1.1. A maximum likelihood (ML) tree was constructed under the JTT+G substitution model with 1,000 bootstrap replicates. The phylogenetic tree was further visualized and annotated using iTOL v6.
Selection pressure and collinearity analysis
-
Coding sequences (CDSs) of MaSnRK2 genes were extracted and compared with genome-wide collinear homologous genes using ParaAT2.0. Synonymous (Ks) and nonsynonymous (Ka) substitution rates, as well as Ka/Ks ratios, were calculated using the R package DoubleTrouble to evaluate selection pressure[36]. Intraspecific collinearity analysis was performed using MCScanX[37]. For interspecific synteny analysis, the banana A genome (DH Pahang v2) was used as a reference and compared with A. thaliana (TAIR10) and rice (Oryza sativa, MSUv7.0) genomes. The parameters were set as E-value ≤ 1 × 10⁻⁵ and match score ≥ 50[20].
Prediction of promoter cis-acting elements
-
The 2,000 bp upstream sequences from the translation start site of each MaSnRK2 gene were retrieved as putative promoter regions. Cis-acting regulatory elements were predicted using PlantCARE. Plant-specific elements with E-value ≤ 1 × 10⁻⁴ were retained for further analysis. Distribution maps were generated using TBtools, and frequency heatmaps were visualized using the R package ggplot2[8].
Three-dimensional protein structure prediction
-
The three-dimensional structures of MaSnRK2.1–MaSnRK2.14 monomeric proteins were predicted using AlphaFold 3[38]. Structural alignment, annotation of the S-TKc domain and activation loop, and root mean square deviation (RMSD) calculations were conducted using PyMOL v2.5.
Transcriptome sequencing and expression analysis
-
Total RNA was extracted using the RNAprep Pure Plant Kit (DP441; Tiangen Biochemical, Beijing, China), treated with DNase I, and assessed for integrity (RIN ≥ 7.5) using an Agilent 2100 Bioanalyzer. Libraries were prepared using the NEBNext Ultra RNA Library Prep Kit and sequenced on the Illumina NovaSeq 6000 platform (PE150). Each sample included three biological replicates and two technical replicates. Raw reads were quality-checked using FastQC v0.12.1. Adapters and low-quality reads (Q < 20) were removed using Trimmomatic v0.39. Clean reads were aligned to the banana A genome using HISAT2, and transcript assembly was performed with StringTie v2.2.1. Gene expression levels were calculated as fragments per kilobase of exon model per million mapped fragments (FPKM). Differential expression analysis was conducted using DESeq2 with thresholds of |log2FC| ≥ 1 and FDR < 0.05. Heatmaps of the MaSnRK2 family across tissues and developmental stages were generated using pheatmap, and Z-score normalization was performed in TBtools. The transcriptome datasets have been deposited under accession numbers SRX3938704, SRX3938706, SRX3938707, SRX3938708, SRX3938709, SRX3938715, and SRX3938722 (BioProject: PRJNA432894).
RT-qPCR analysis
-
Gene expression of MaSnRK2 members in different tissues and developmental stages was validated by quantitative real-time PCR (RT-qPCR) using SYBR Premix Ex Taq (TaKaRa, Shiga, Japan) on a Stratagene Mx3000P detection system (Stratagene, San Diego, CA, USA). Primer sequences are provided in Supplementary Table S1. MaActin (EF672732) and MaUBQ2 (HQ853254) were used as internal reference genes. Relative expression levels were calculated using the 2−ΔΔCᴛ method[39]. Each reaction was performed with three biological replicates.
Subcellular localization of MaSnRK2.10
-
The full-length open reading frame (ORF) of MaSnRK2.10 was cloned into the pART-CAM-EGFP vector to generate a MaSnRK2.10-GFP fusion construct. The recombinant plasmid and marker plasmid were transformed into Agrobacterium tumefaciens strain LBA4404. Agrobacterium-mediated transient expression was performed in Nicotiana benthamiana leaves[6]. After incubation at 25 °C for 48 h, GFP fluorescence was observed using a Nikon confocal laser scanning microscope (CLSM).
Transient overexpression and silencing of MaSnRK2.10 in banana fruit
-
The ORF of MaSnRK2.10 was inserted into the pCAMBIA3300 vector using XbaI and KpnI restriction enzymes for overexpression analysis. For gene silencing, the N-terminal S-TKc activation domain of MaSnRK2.10 was cloned into the pTRV2 vector using the same restriction sites. Constructs were introduced into A. tumefaciens strain GV3101. Banana fruit slices at 80 DAF were immersed in Agrobacterium suspension (OD600 = 0.6) and cultured on MS medium at 30 °C for 3 d[40]. I2–KI staining was subsequently performed, and total starch, amylopectin, and amylose contents were quantified as previously described[40]. All experiments were conducted in triplicate.
Prediction of transcription factors and molecular docking analysis
-
Potential transcription factors (TFs) binding to the promoter region of MaSnRK2.10 were predicted using PlantTFDB v5.0. Protein–DNA interaction models between identified TFs and cis-regulatory elements in the MaSnRK2.10 promoter were simulated using AlphaFold 3[38]. Three-dimensional docking models were visualized in PyMOL v2.5.2 to infer potential regulatory mechanisms[41].
Statistical analysis
-
All statistical analyses were performed using R v4.4.2. For multiple comparisons, significance was evaluated using the least significant difference (LSD) test at α = 0.05. Graphical representations were generated using appropriate R packages.
-
All SnRK2 protein sequences were retrieved from the banana A genome database[32]. Fourteen SnRK2 members were identified and designated MaSnRK2.1–MaSnRK2.14 according to their chromosomal positions (Fig. 1a). Phylogenetic analysis classified the 14 MaSnRK2 proteins into three groups (I–III). Group I comprised MaSnRK2.1–MaSnRK2.6; Group II included MaSnRK2.8, MaSnRK2.10, and MaSnRK2.13; and Group III contained MaSnRK2.7, MaSnRK2.9, MaSnRK2.11, MaSnRK2.12, and MaSnRK2.14 (Fig. 1a). Conserved motif analysis revealed that Motifs 1–7, and 10 were shared across all groups, whereas Motifs 8 and 9 were absent in Group I members (Fig. 1b). Gene structure analysis showed that all MaSnRK2 genes contained nine coding sequences (CDSs) interrupted by eight introns, displaying highly conserved exon–intron organization (Fig. 1c). Domain analysis confirmed that each protein harbors a conserved serine/threonine protein kinase catalytic domain (S_TKc, cd14662) with comparable amino acid lengths (Fig. 1d). Three-dimensional structural prediction demonstrated that the S_TKc domain forms canonical secondary structural elements, including α-helices and β-sheets (Fig. 1e), which are essential for maintaining protein structural stability.
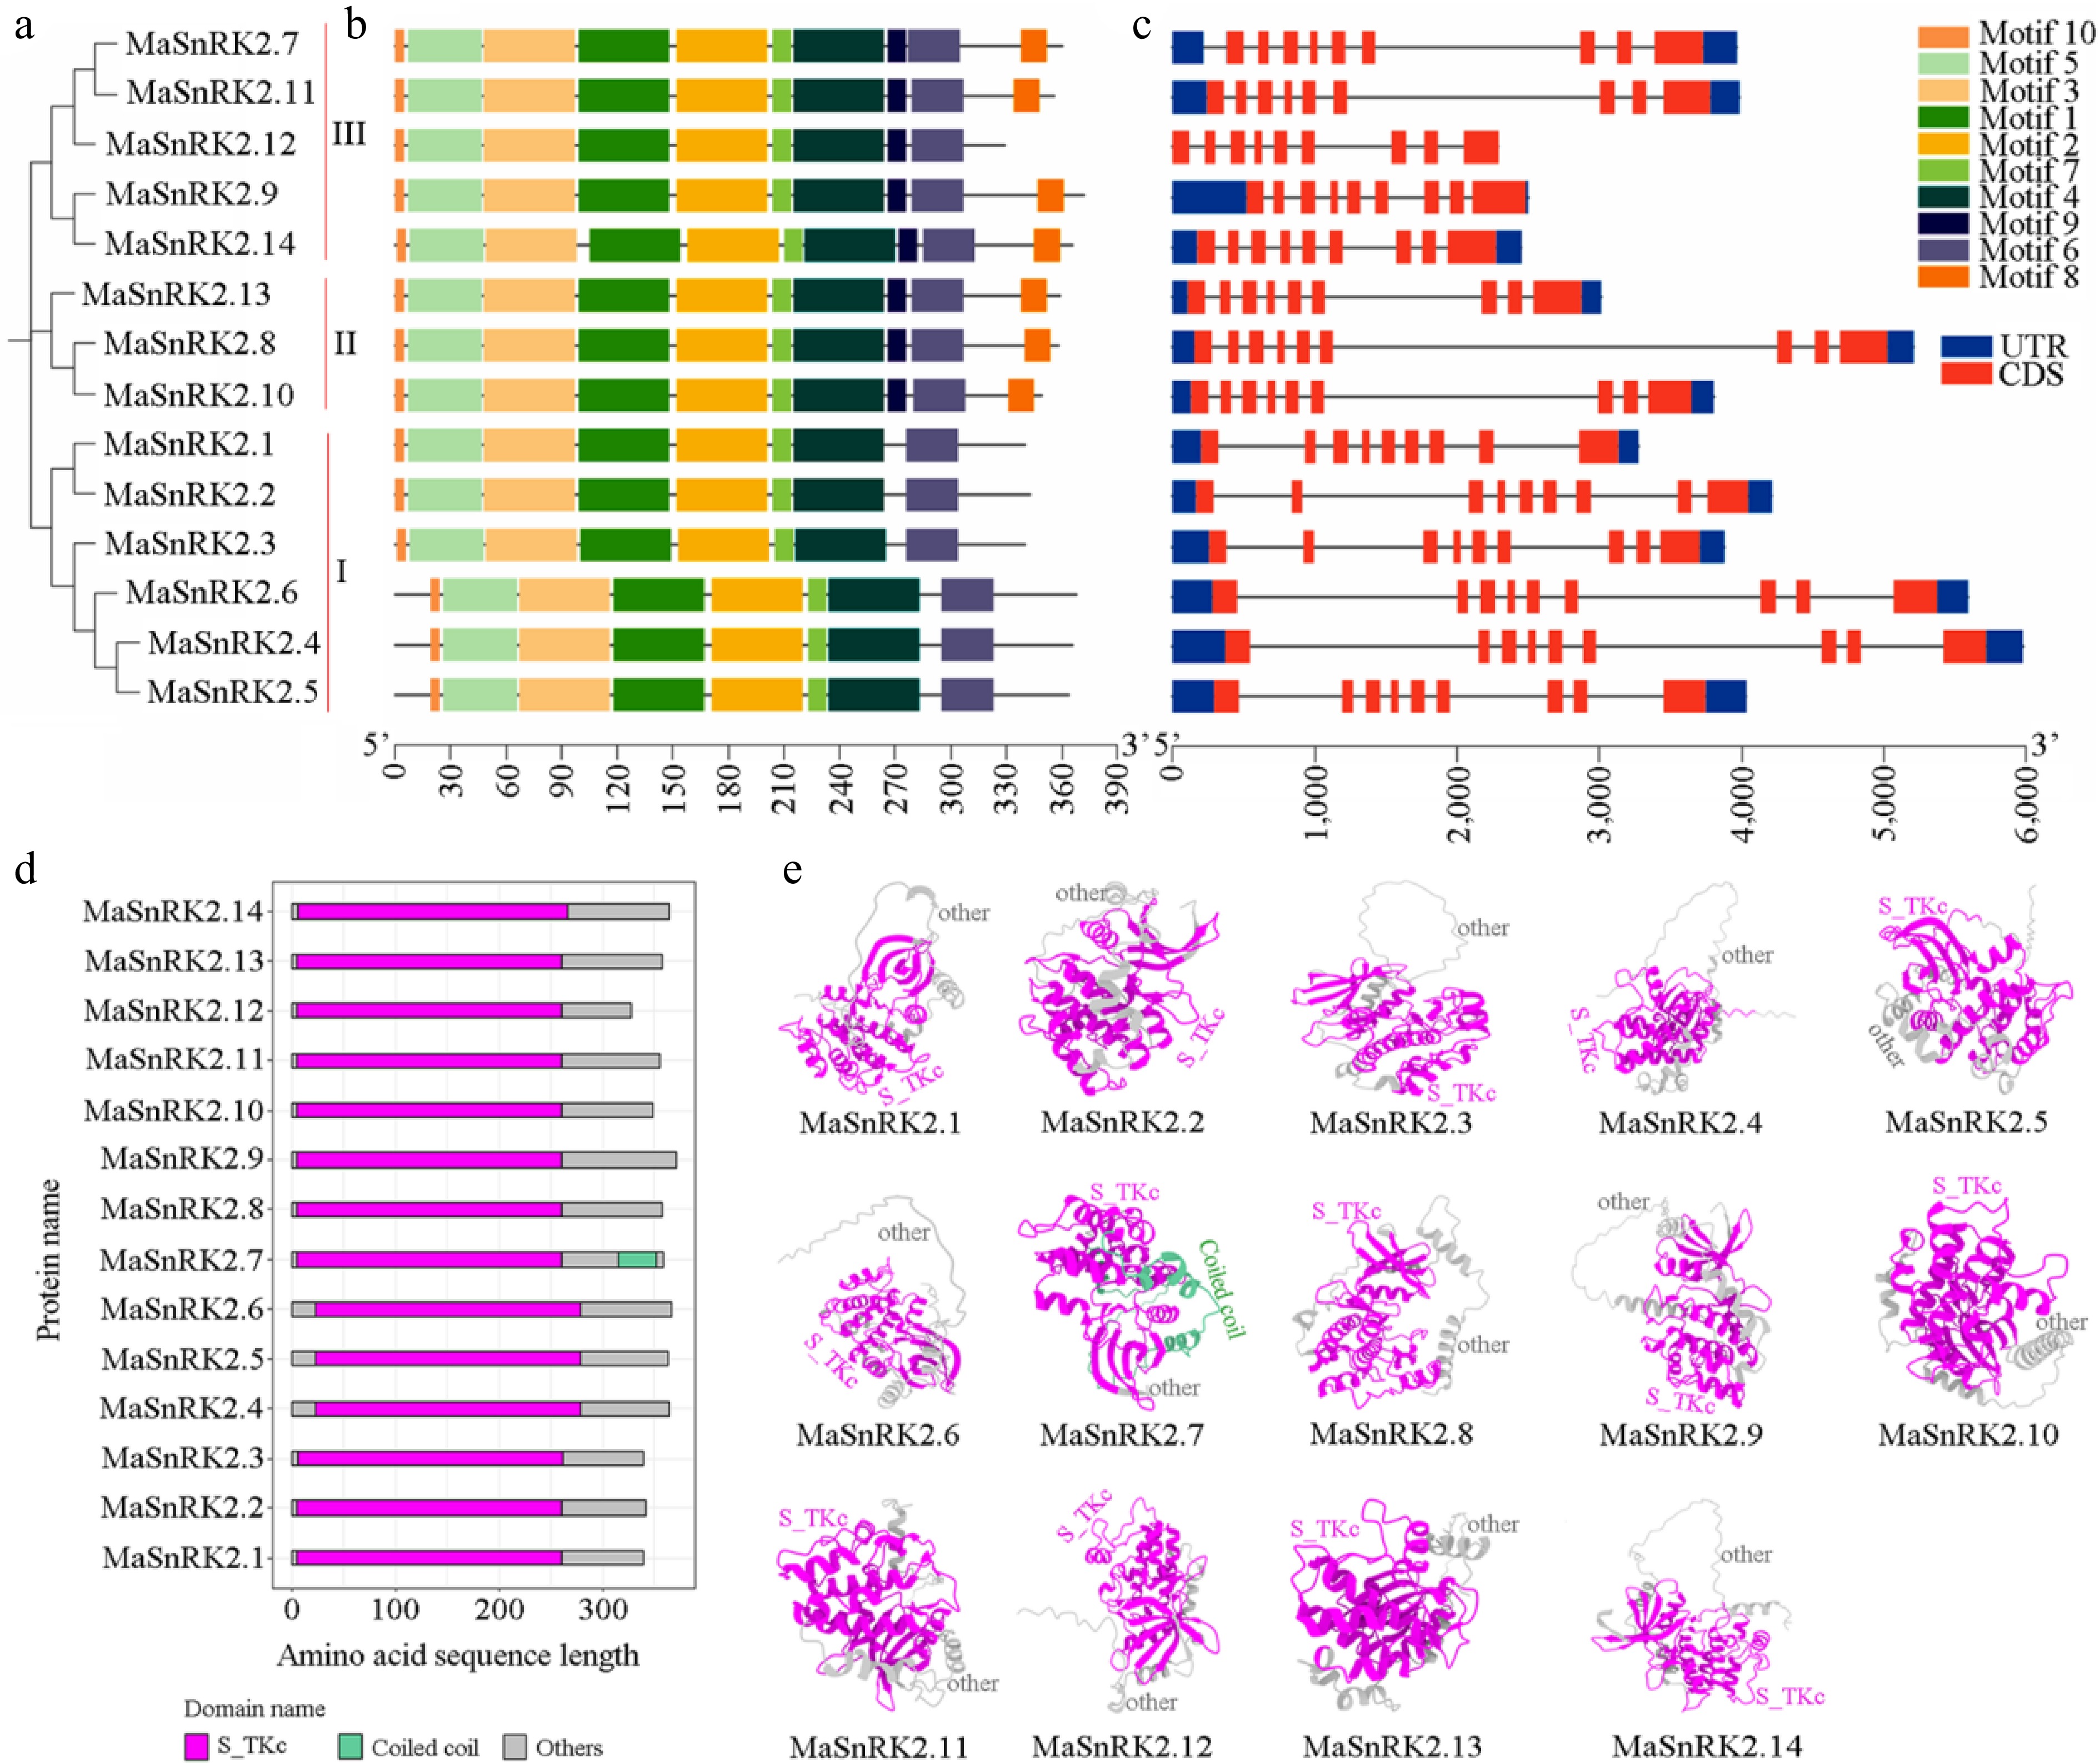
Figure 1.
Bioinformatics analyzes of MaSnRK2 genes family. (a) Phylogenetic evolution of the MaSnRK2 protein family. (b) Motif analysis of the MaSnRK2 gene family. (c) Gene structure analysis of the MaSnRK2 gene family. (d) Protein domain analysis of MaSnRK2 family members. (e) Three-dimensional (3D) structure prediction of MaSnRK2 proteins. Purple represents a conserved serine/threonine protein kinases catalytic domain (S_TKc, cd14662). Green represents a coiled coil domain. Gray represents the other domain.
Physicochemical properties of the MaSnRK2 proteins are summarized in Supplementary Table S2. Amino acid lengths ranged from 328 aa (MaSnRK2.12) to 371 aa (MaSnRK2.9). Molecular weights varied between 37.78 kDa (MaSnRK2.12) and 42.61 kDa (MaSnRK2.9), and theoretical isoelectric points ranged from 4.77 (MaSnRK2.4) to 8.07 (MaSnRK2.12). All proteins were predicted to be hydrophilic (GRAVY < 0). Subcellular localization prediction indicated nuclear localization for all members (Supplementary Table S2), suggesting their potential involvement in nuclear regulatory processes.
Evolutionary analysis of the SnRK2 gene family
-
Phylogenetic analysis incorporating SnRK2 proteins from banana, Arabidopsis thaliana, and rice (Oryza sativa) revealed three major clades (A–C), with protein names and accession numbers listed in Supplementary Table S3. Notably, MaSnRK2.3 clustered with rice OsSnRK3 in Group C. The majority of SnRK2 proteins from all three species were distributed within Groups A and B (Fig. 2a). Ka/Ks ratio analysis demonstrated that all SnRK2 orthologous gene pairs across the three species exhibited Ka/Ks < 1 (Fig. 2b), indicating strong purifying selection during evolutionary divergence. The conserved clustering patterns of Groups A and B further suggest functional conservation and shared evolutionary origin. Chromosomal mapping showed that MaSnRK2 genes are unevenly distributed across seven chromosomes (Fig. 2c). Specifically, MaSnRK2.2, MaSnRK2.4, and MaSnRK2.1 are located on chromosomes 1, 2, and 3, respectively; MaSnRK2.5 and MaSnRK2.6 are clustered on chromosome 4; MaSnRK2.3 and MaSnRK2.10 reside on chromosome 5; and four genes (MaSnRK2.7, MaSnRK2.12, MaSnRK2.13, and MaSnRK2.14) are located on chromosome 6. Additionally, MaSnRK2.9 is located on chromosome 10, while MaSnRK2.8 and MaSnRK2.11 are positioned on chromosome 11 (Fig. 2c). The clustered chromosomal distribution suggests that certain MaSnRK2 members may have originated through local duplication events.
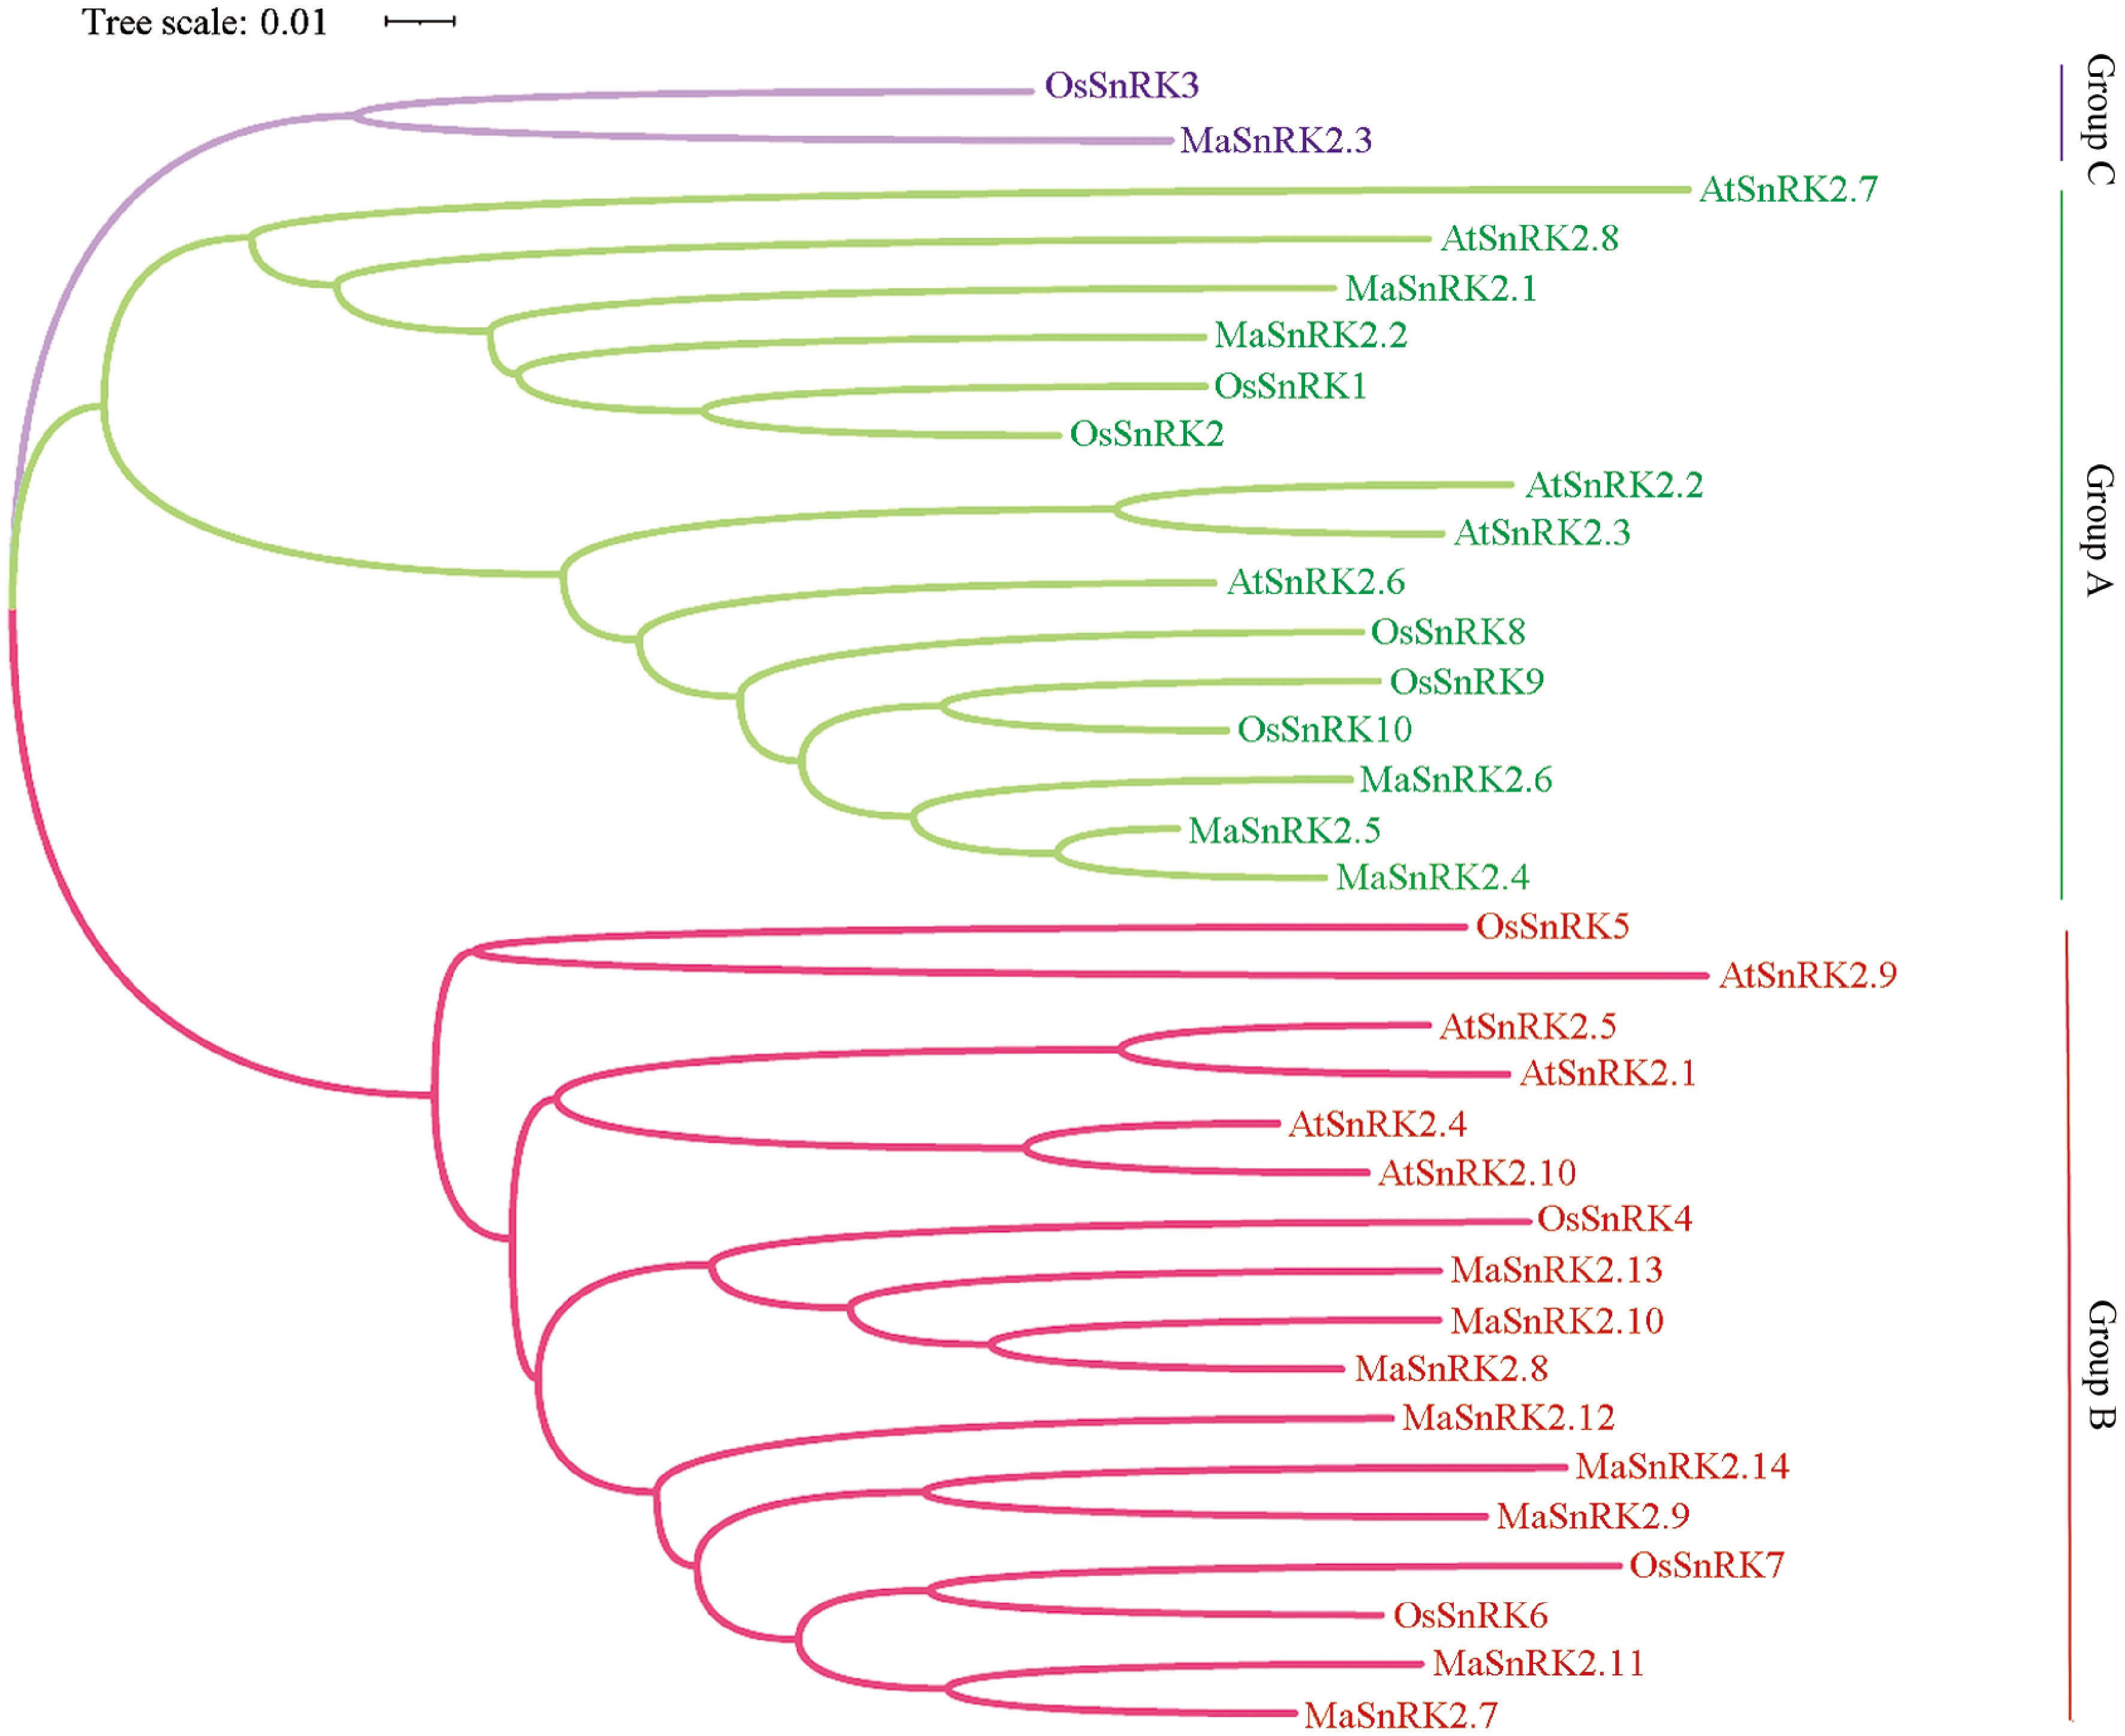
Figure 2.
Phylogenetic, Ka/Ks ratio, and chromosomal distribution of SnRK2 proteins from banana, A. thaliana, and rice species. The phylogenetic tree constructed by MEGA X v.10.1.1 software. (a) The SnRK2s were divided into three groups including group I, II, and III based on banana MaSnRK2s and other plants SnRK2 amino acid sequences. The MaSnRK2s, OsSnRK2s, and AtSnRK2s represent SnRK2s from Musa acuminata, Oryza sativa, and Arabidopsis thaliana, respectively. (b) Boxplot with scatter points of Ka/Ks values by species.
Cis-acting element analysis of MaSnRK2 promoters
-
Promoter analysis revealed that all MaSnRK2 genes contain canonical core promoter elements, including the CAAT-box and TATA-box. Numerous hormone-responsive and stress-related cis-elements were also identified (Fig. 3). Abscisic acid-responsive elements (ABREs) were present in the promoters of MaSnRK2.1, MaSnRK2.2, MaSnRK2.4, MaSnRK2.5, MaSnRK2.9, MaSnRK2.11, and MaSnRK2.12. Methyl jasmonate-responsive elements (TGACG motif and CGTCA motif) were detected in the majority of promoters. Additional elements associated with auxin (AuxRR-core, TGA-element), salicylic acid (TCA-element, SARE), gibberellin (TATC-box), and defense/stress response (TC-rich repeats) were also identified. Moreover, most MaSnRK2 promoters contained multiple light-responsive elements (Fig. 3). Collectively, these results indicate that MaSnRK2 gene expression may be finely regulated by diverse hormonal signals and environmental cues, supporting their potential roles in banana growth, development, and stress adaptation.
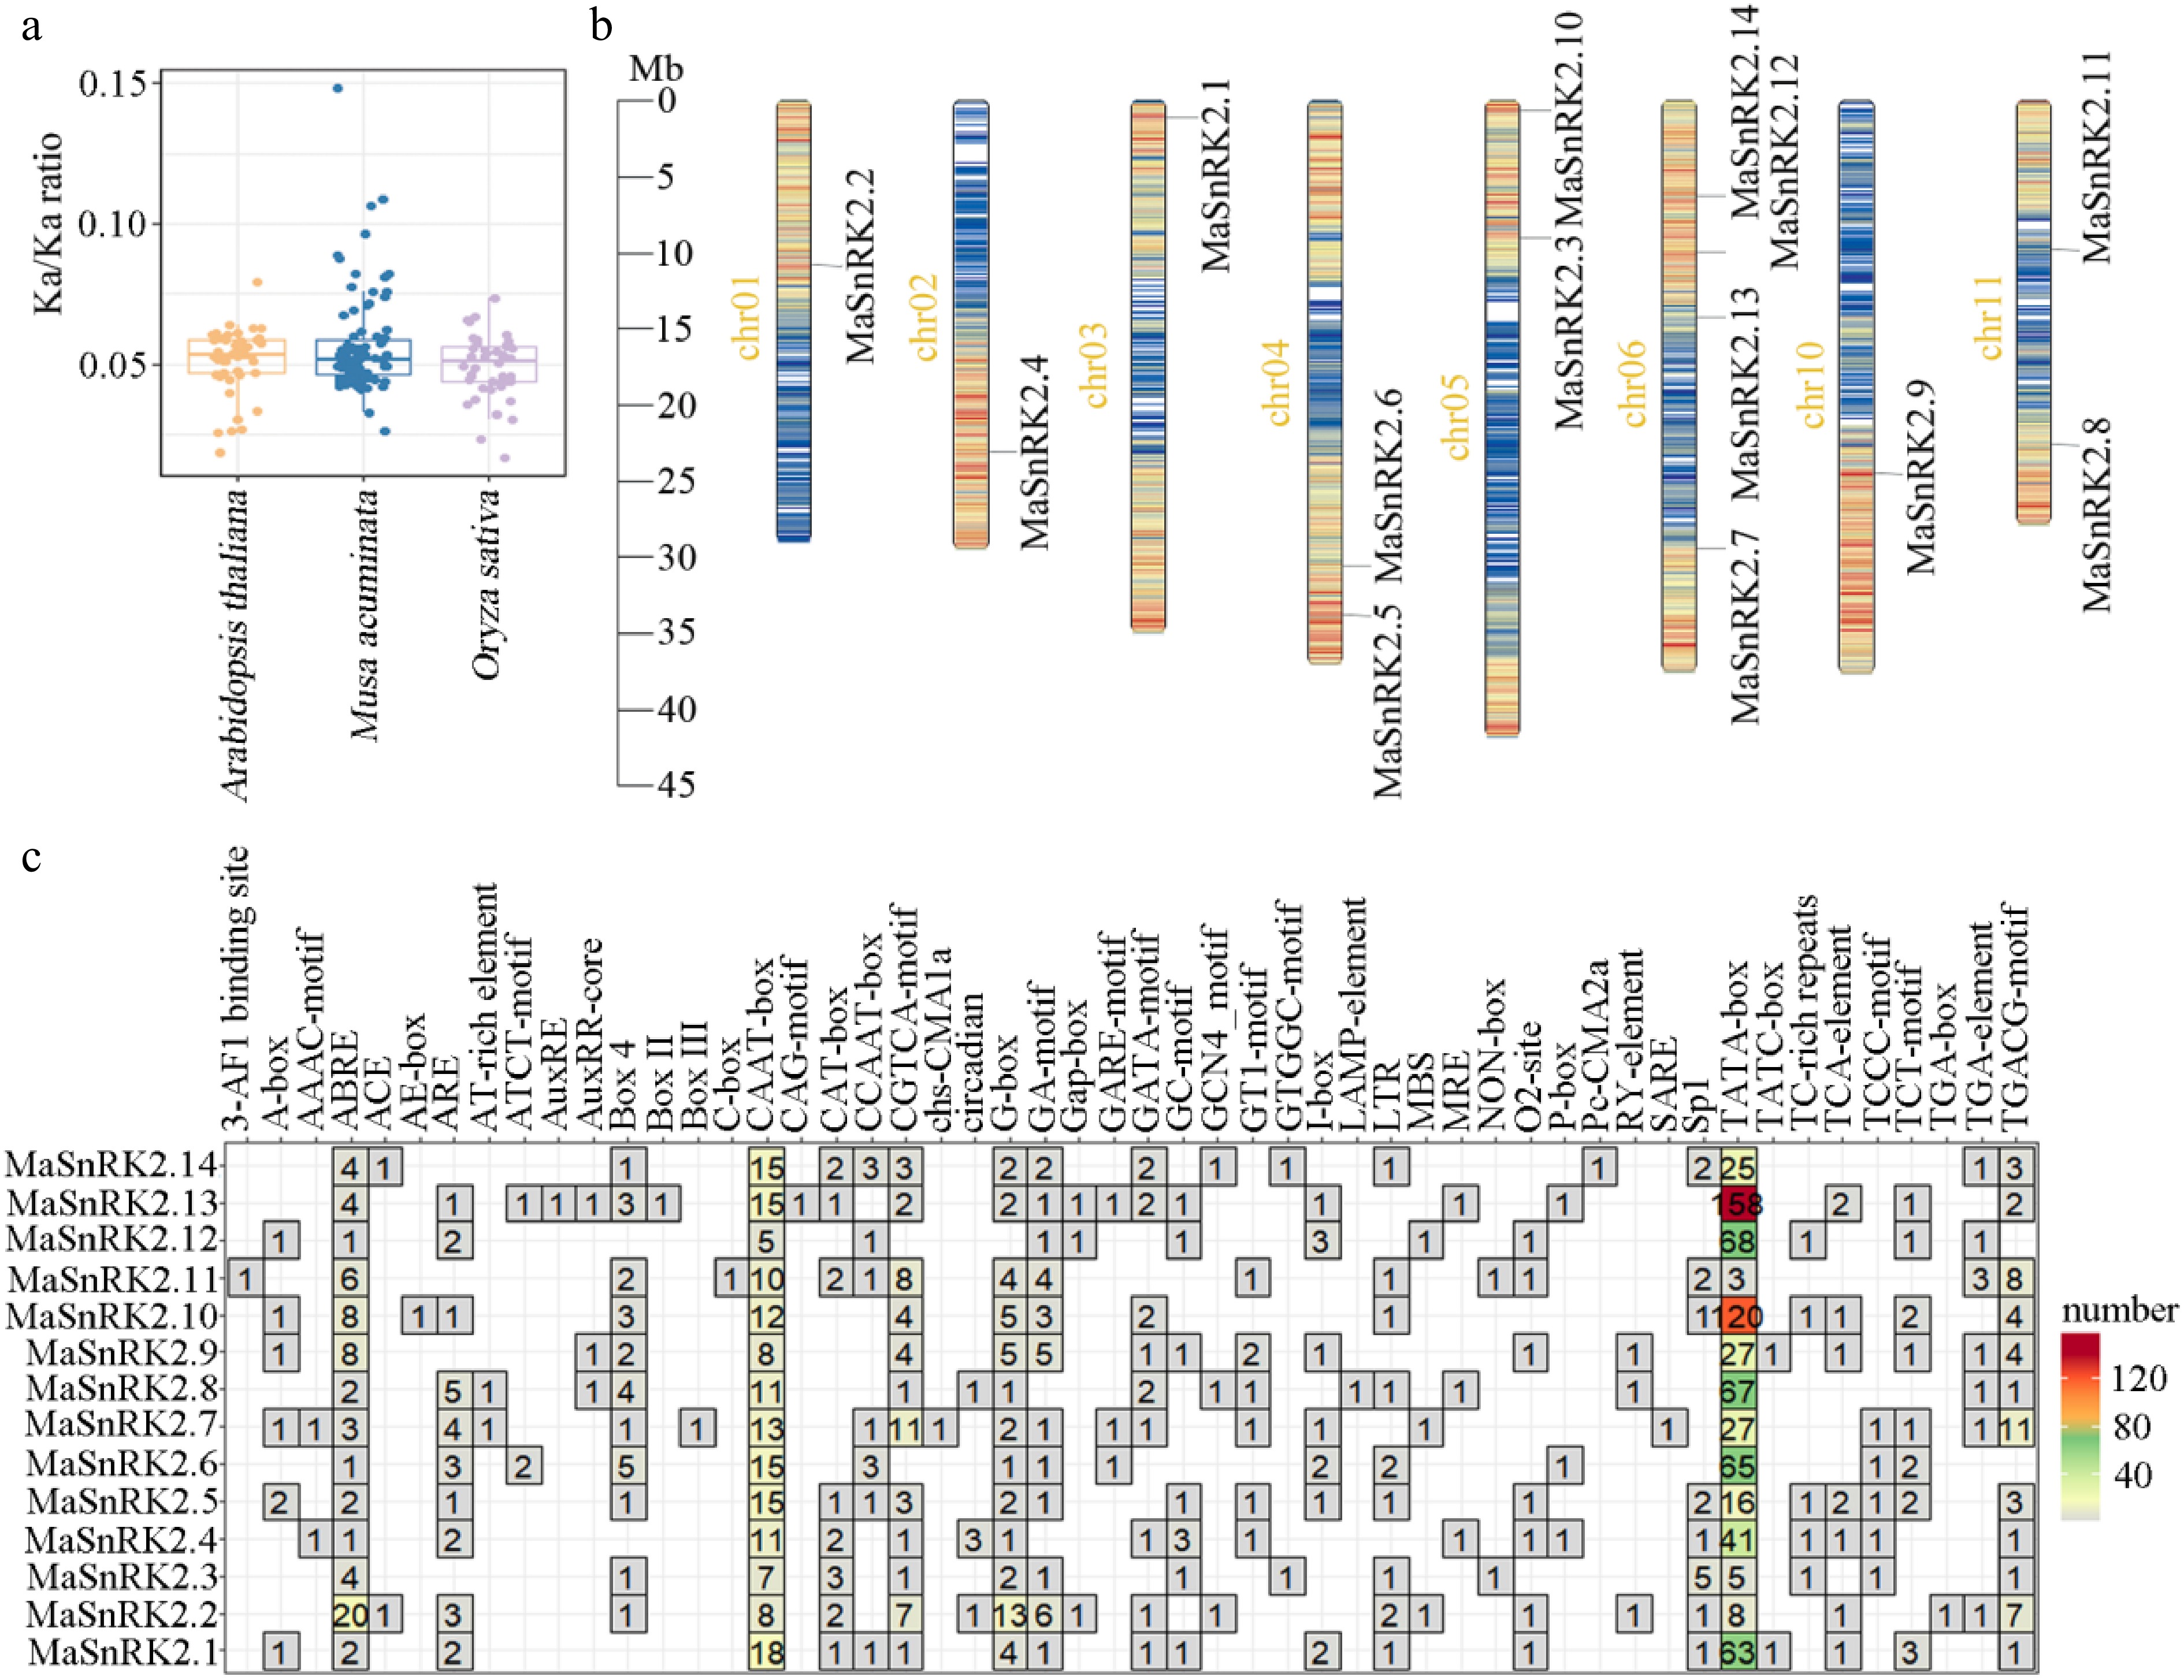
Figure 3.
Cis-acting elements analysis of MaSnRK2 family. (a) Chromosomal localization of 14 MaSnRK2 gene family members. Different colors represent different gene densities on the chromosome. Specifically, green, blue, and orange represent low, medium, and high gene density, respectively. (b) Promoter cis-acting elements of MaSnRK2 genes; the number represents the number of cis-acting elements in each MaSnRK2 promoter.
Collinearity analysis of the MaSnRK2 gene family
-
Genome-wide synteny analysis revealed several collinear gene pairs among MaSnRK2 members (Fig. 4a). MaSnRK2.9 exhibited collinearity with both MaSnRK2.12 and MaSnRK2.14. Similarly, MaSnRK2.10 showed syntenic relationships with MaSnRK2.8 and MaSnRK2.13, while MaSnRK2.4 formed collinear pairs with MaSnRK2.5 and MaSnRK2.6. These findings suggest that segmental duplication events contributed to the expansion of the MaSnRK2 gene family and that duplicated genes retained substantial sequence and structural similarity. Cross-species collinearity analysis between banana, A. thaliana, and rice detected no conserved syntenic pairs involving SnRK2 genes (Fig. 4b), indicating that the SnRK2 family may have undergone lineage-specific expansion following species divergence or experienced structural genomic rearrangements that disrupted collinearity conservation.
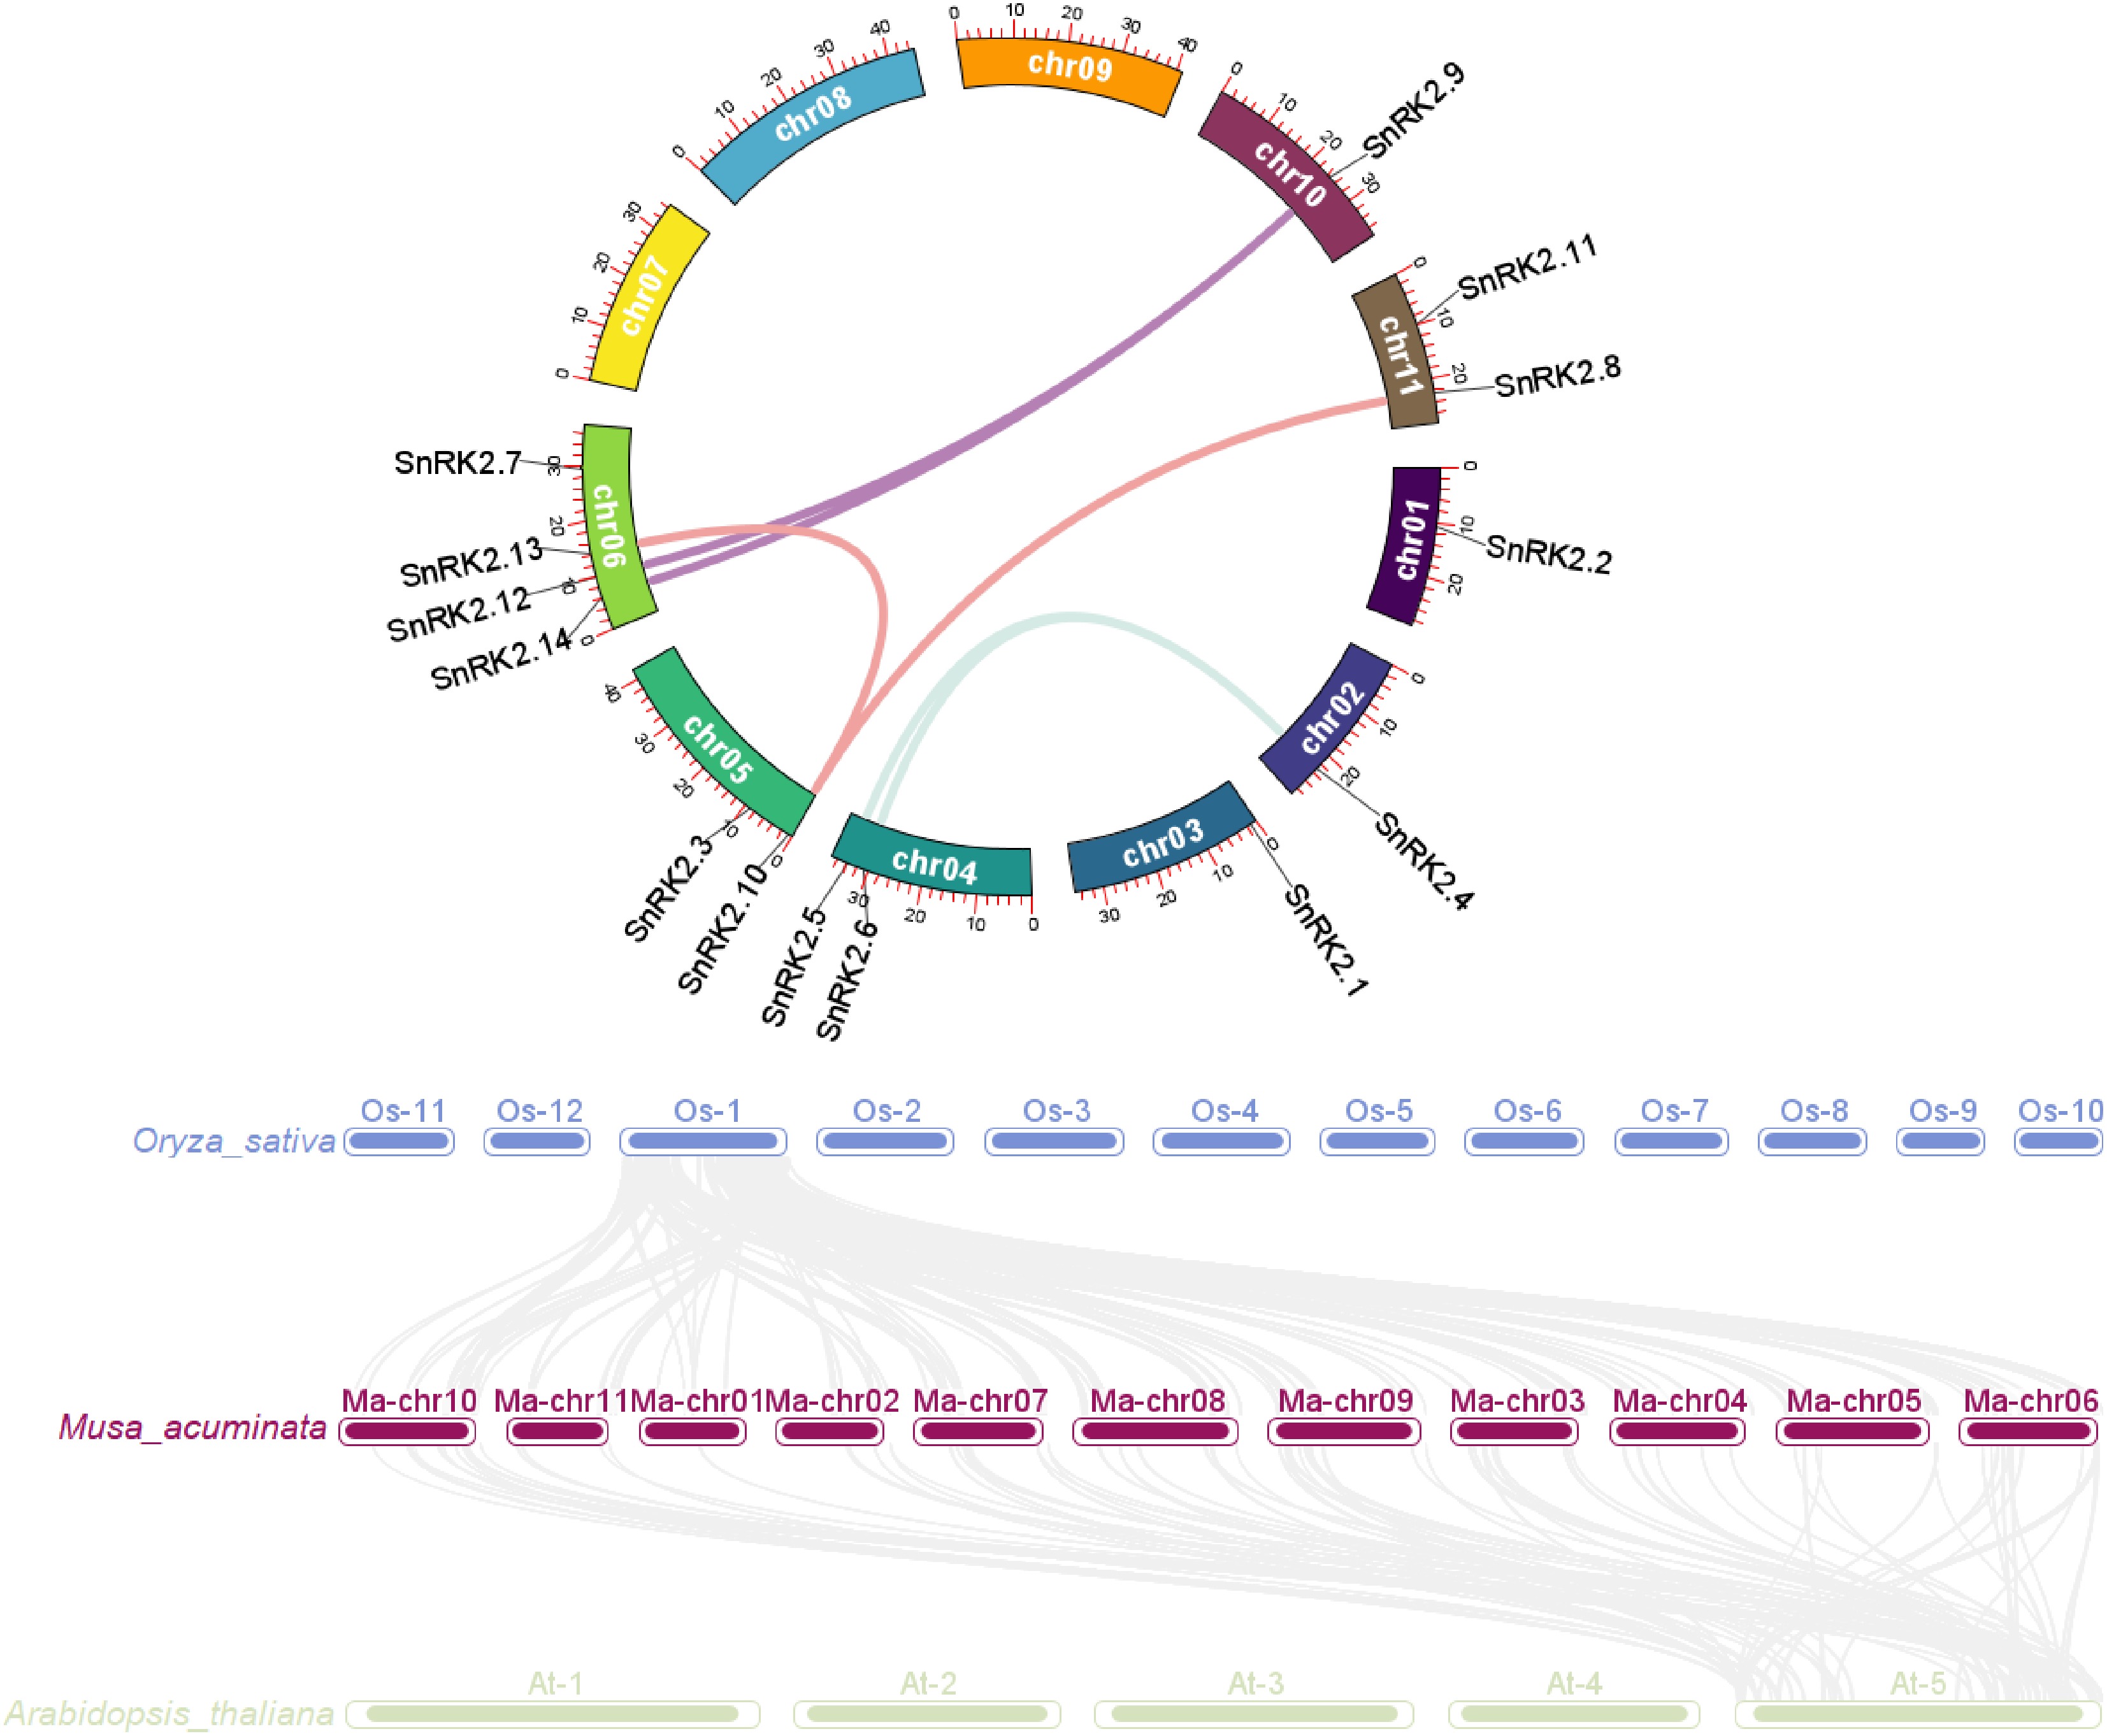
Figure 4.
Intergenomic and intragenomic synteny relationship of the SnRK2 family members among banana (Musa acuminata), Arabidopsis (Arabidopsis thaliana), and rice (Oryza sativa). (a) Intergenomic synteny relationship of the MaSnRK2 members in the banana genome. Green lines indicate intrachromosomal collinearity between MaSnRK2.4 and MaSnRK2.5 or MaSnRK2.6. Red lines indicate intrachromosomal collinearity between MaSnRK2.10 and MaSnRK2.8 or MaSnRK2.13. Purple lines indicated intrachromosomal collinearity between MaSnRK2.9 and MaSnRK2.12 or MaSnRK2.14. (b) Collinear SnRK2 family gene pairs between rice and banana, and between banana and A. thaliana.
Expression patterns of the MaSnRK2 gene family
-
To investigate potential functional roles, expression profiles of MaSnRK2 genes were analyzed across multiple tissues (roots, stems, leaves, and fruits) and developmental stages (0 and 20 DAF; 0, 8, and 14 DPH). Transcriptome analysis revealed that MaSnRK2.1, MaSnRK2.3, MaSnRK2.8, and MaSnRK2.10 were highly expressed in fruit compared with other tissues (Fig. 5a). During fruit ripening, MaSnRK2.1, MaSnRK2.8, and MaSnRK2.10 were significantly upregulated at early postharvest stages (0 and 8 DPH), with MaSnRK2.10 showing the highest expression level (Fig. 5b, Supplementary Table S4). RT-qPCR validation confirmed that MaSnRK2.10 expression patterns were consistent with transcriptomic data across tissues and developmental stages (Fig. 5c, d), supporting the reliability of the transcriptome data and suggesting a potential role for MaSnRK2.10 in early postharvest fruit physiology (Supplementary Tables S5, S6).
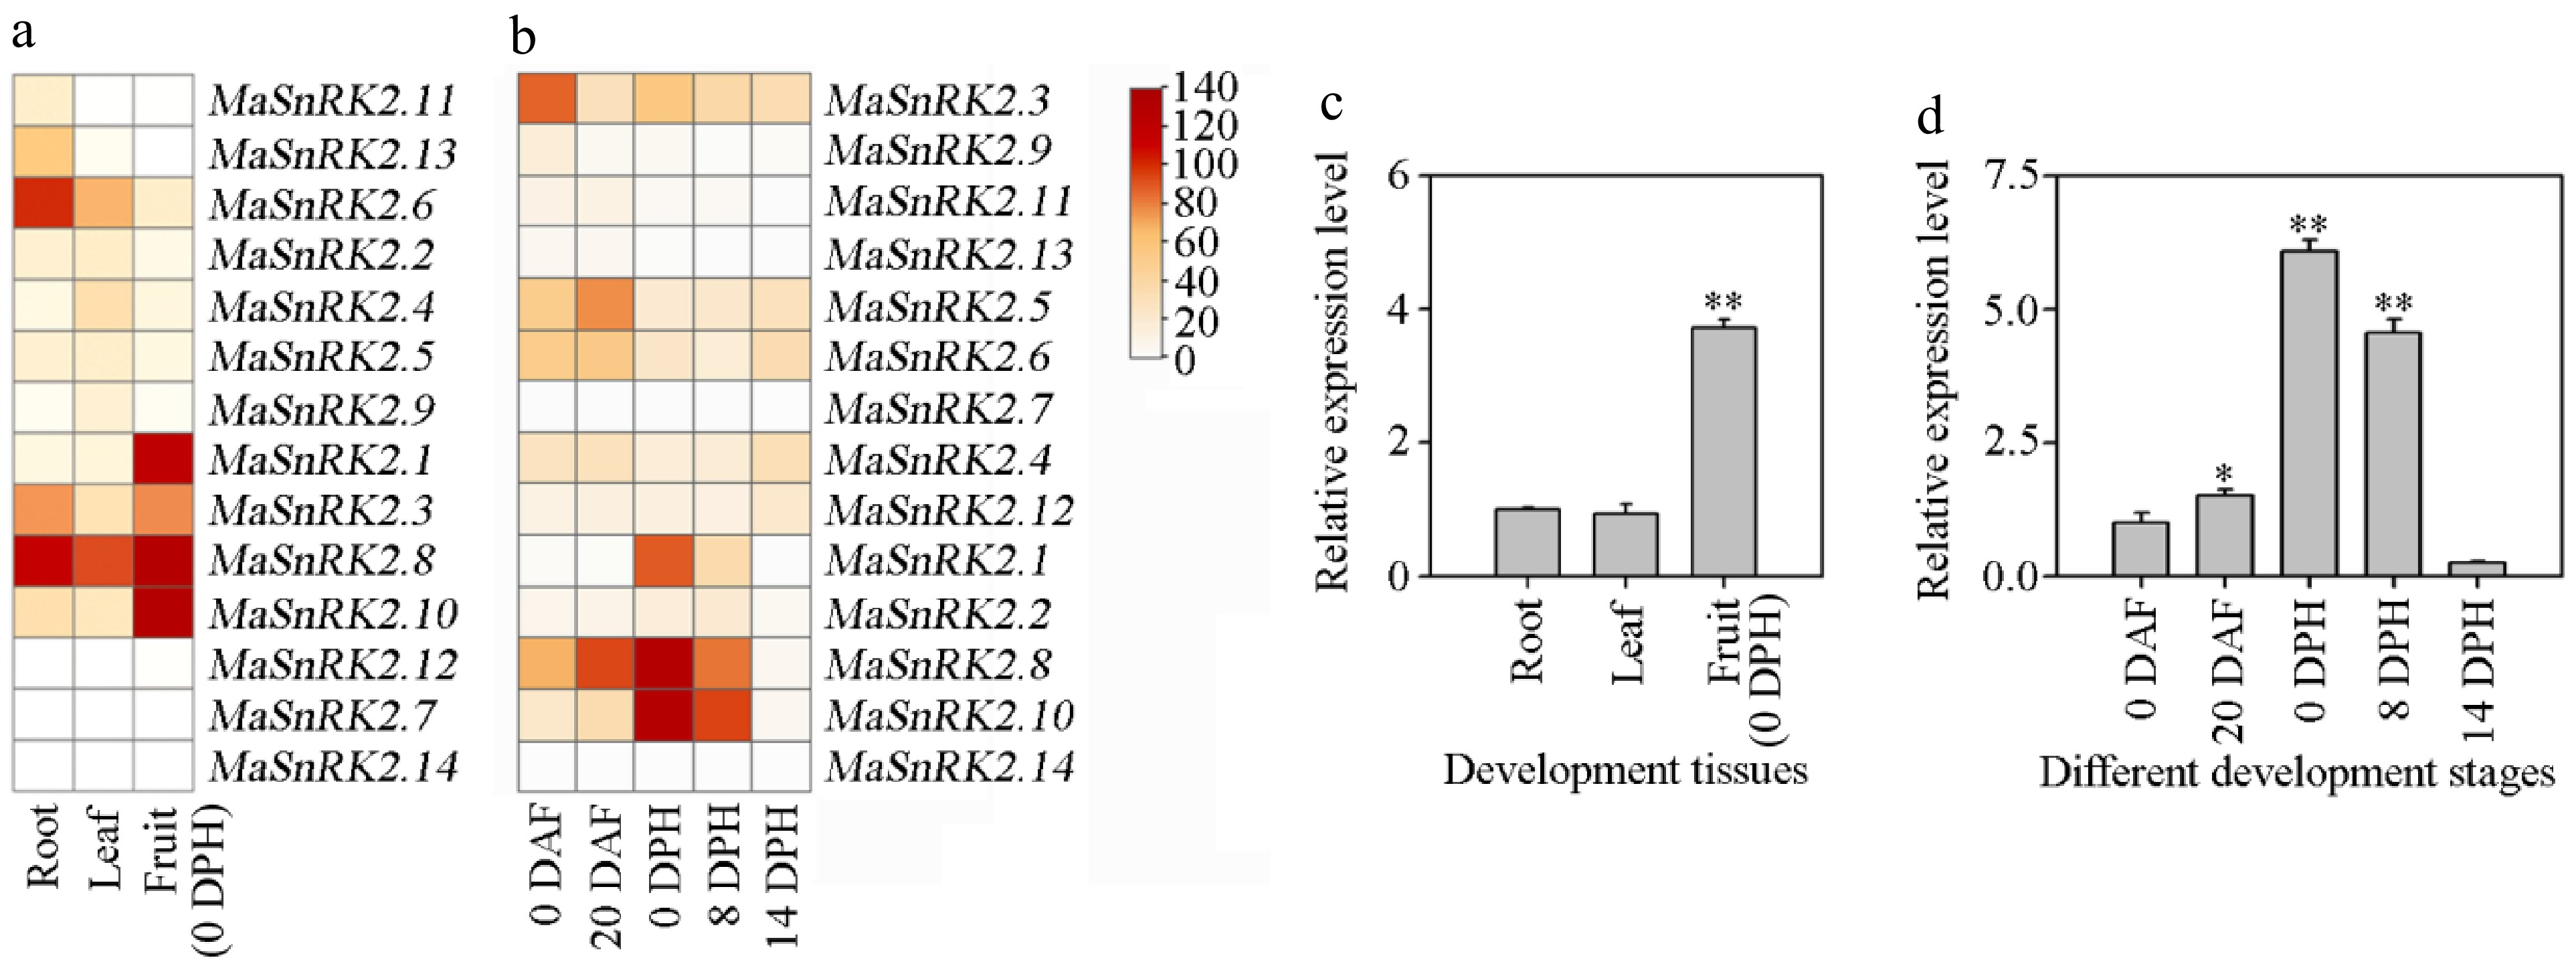
Figure 5.
Expression profiles of MaSnRK2 family genes in the different organs and different developmental stages by banana transcriptome and qRT-PCR. (a), (b) Expression of MaSnRK2s in different organs and during different stages of banana fruit development and ripening. The heat map with clustering was created based on the FPKM value of the MaSnRK2s. Differences in gene expression changes are shown in color in the red-yellow scale. (c) Expression of MaSnRK2.10 in different tissues. (Note: the expression data were detected by real-time fluorescence quantitative PCR [RT-QPCR]). (d) Expression of MaSnRK2.10 at different stages of fruit development and ripening. Data are presented as means ± standard deviations, n = 3 biological replicates.
Subcellular localization and functional analysis of MaSnRK2.10 in starch metabolism
-
To determine subcellular localization, the ORF of MaSnRK2.10 was fused to GFP and transiently expressed in Nicotiana benthamiana leaves. Confocal microscopy showed that the MaSnRK2.10-GFP fusion protein predominantly localized to the nucleus and plasma membrane, whereas free GFP displayed diffuse cellular distribution (Fig. 6a). Functional analysis was performed using transient silencing and overexpression assays in banana fruit discs. Silencing of MaSnRK2.10 resulted in darker I2–KI staining relative to controls (Fig. 6b), indicating reduced starch degradation. Transcript analysis confirmed significant downregulation of MaSnRK2.10 expression (Fig. 6c). Quantitative measurements showed increases in total starch (17.94%), amylopectin (14.80%), and amylose (3.14%), compared with the empty vector control (Fig. 6d). Conversely, transient overexpression of MaSnRK2.10 altered I2–KI staining intensity (Fig. 6e) and significantly increased transcript levels (Fig. 6f). However, carbohydrate contents did not show a uniform decrease; total starch, amylopectin, and amylose exhibited changes of approximately 14%, 8.53%, and 5.39%, respectively (Fig. 6g, Supplementary Table S7). These results indicate that MaSnRK2.10 modulates starch metabolism rather than acting as a simple modulator of starch degradation.
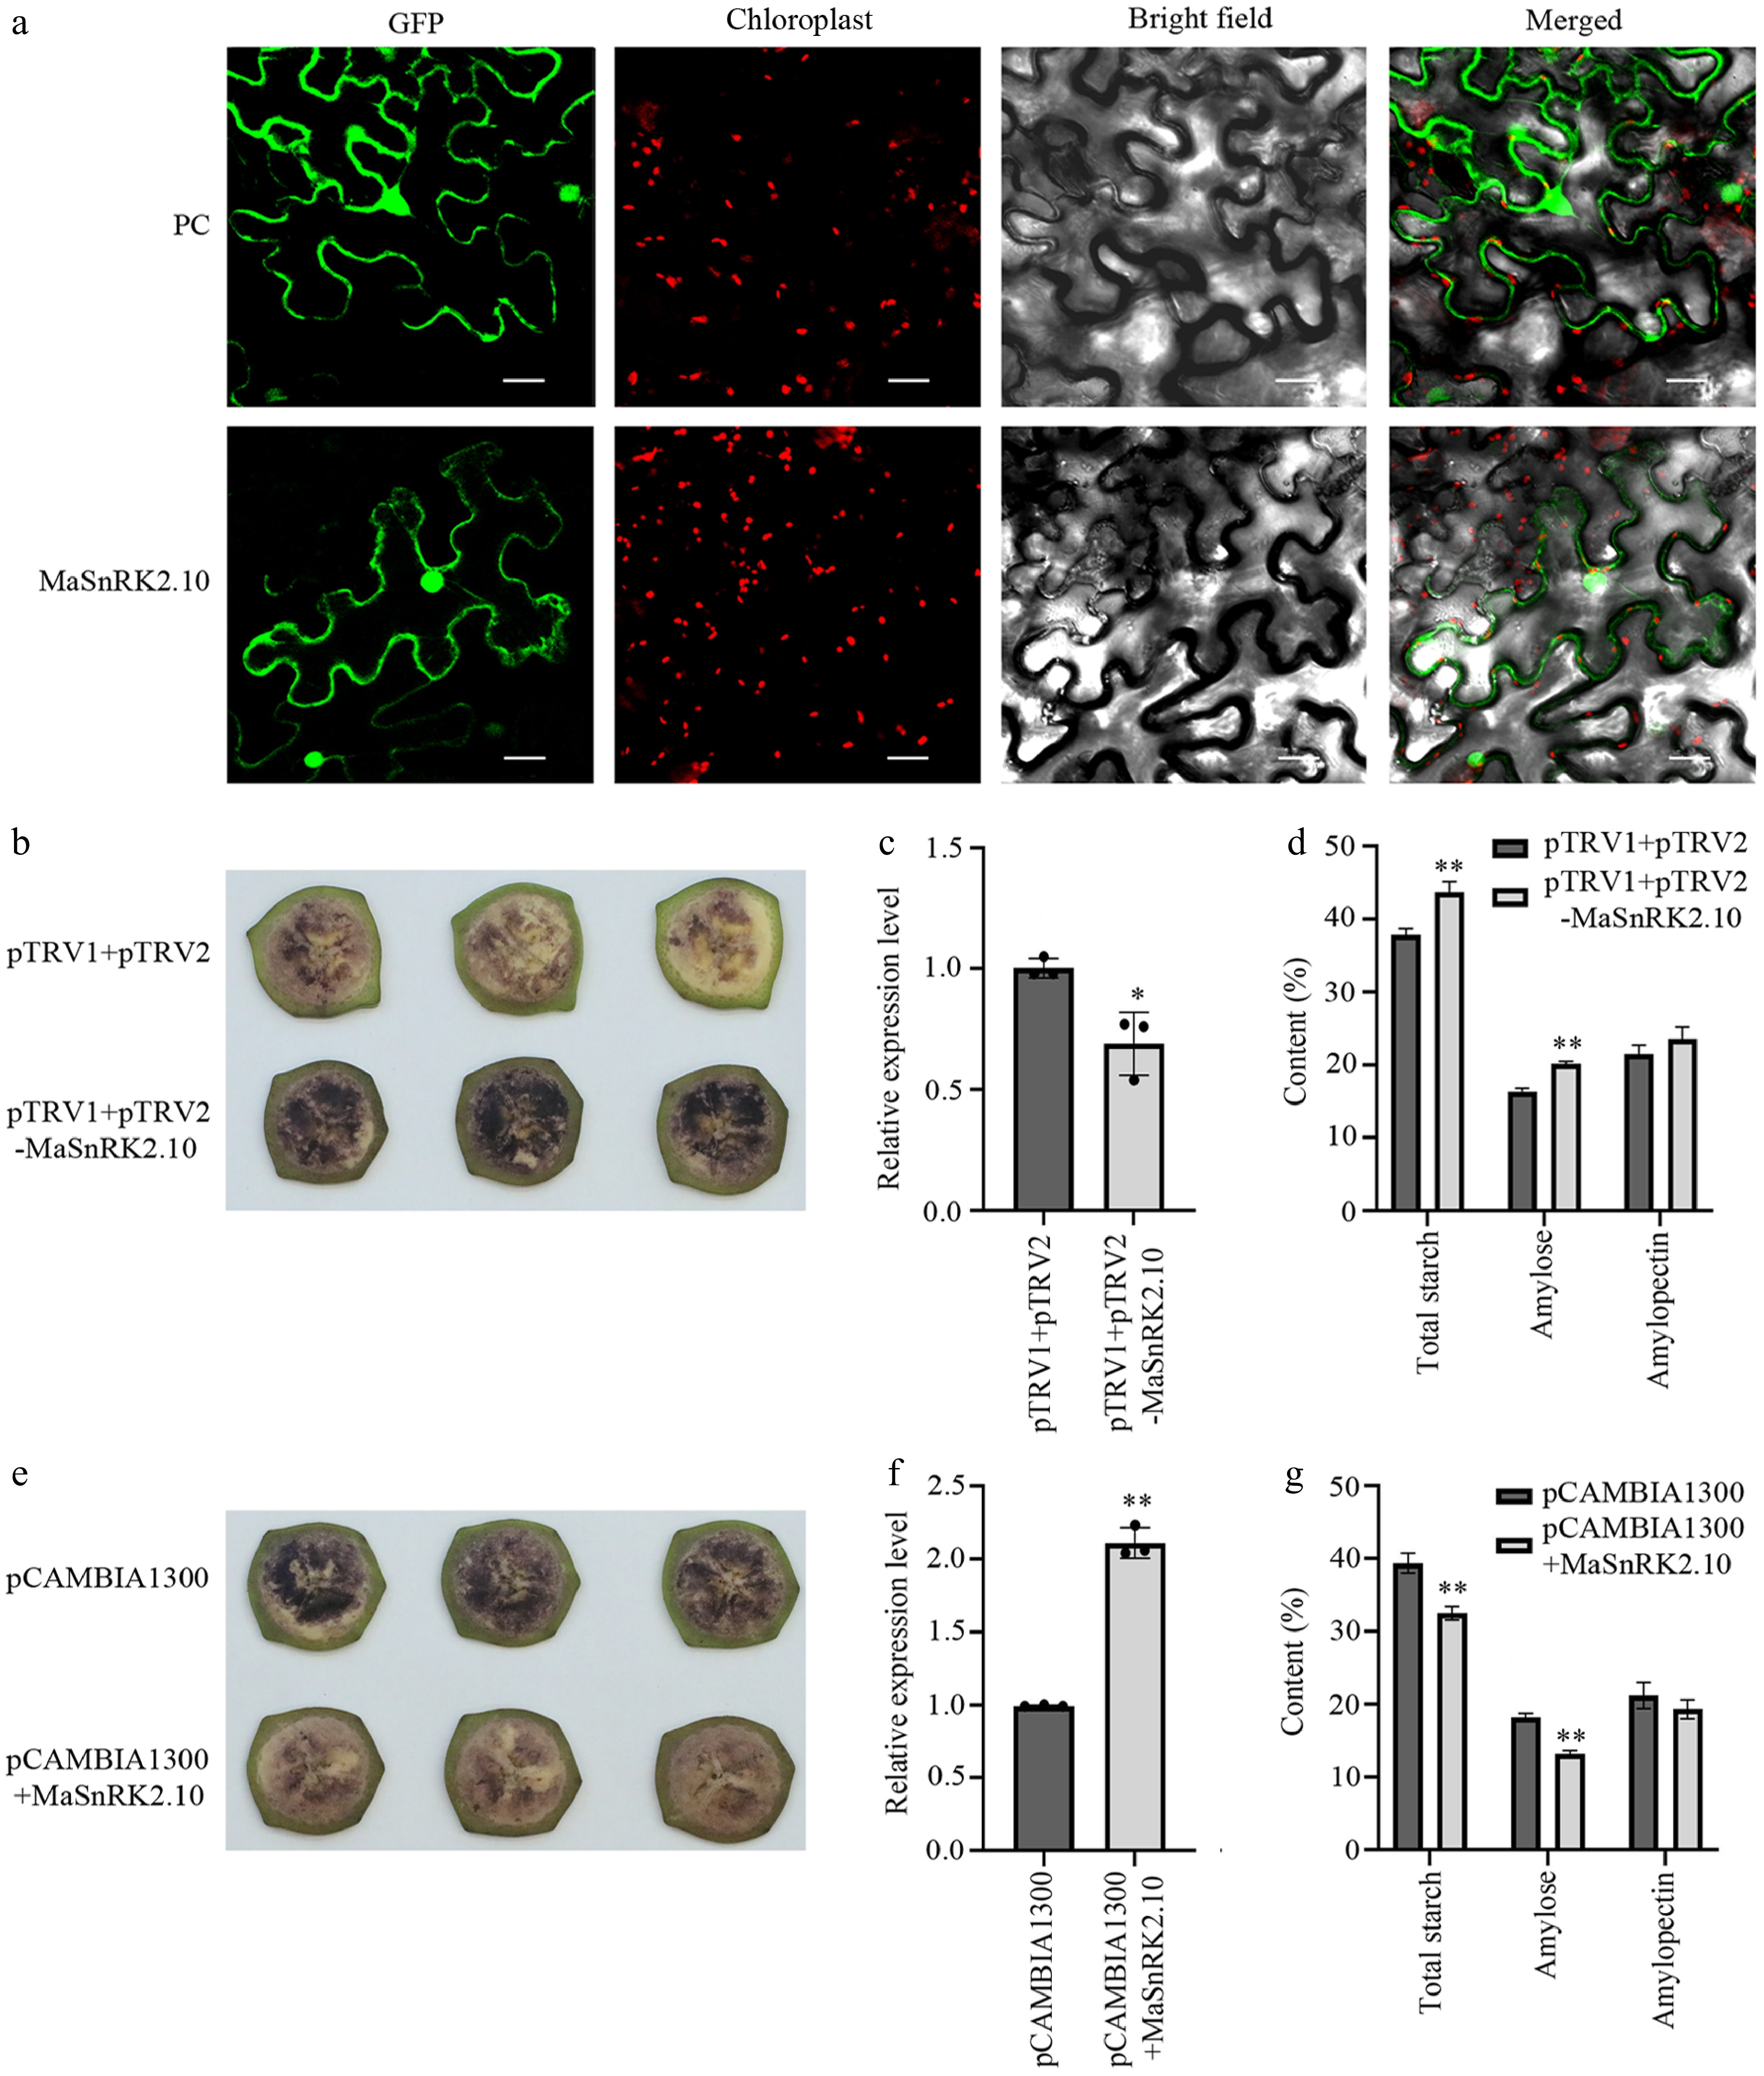
Figure 6.
Co-localization of MaSnRK2.10 in Nicotiana benthamiana and its functional analysis in banana (M. acuminata) fruit. (a) Co-localization of MaSnRK2.10. The green fluorescent protein (GFP) fluorescence is represented by green, whereas red fluorescence indicates chloroplast red fluorescent proteins. A composite image was created by merging the GFP and RFP fluorescence images, represented under 'merge'. Bar = 10 μm. (b) Iodine (I2-KI) staining of banana fruit discs showing reduced starch degradation following transient suppression of MaSnRK2.10. (c) Relative expression levels of MaSnRK2.10 in banana fruit discs after gene silencing, as determined by quantitative reverse transcriptase PCR (RT-qPCR). (d) Quantification of total starch, amylose, and amylopectin contents in banana fruit discs following MaSnRK2.10 suppression. (e) Iodine (I2-KI) staining of banana fruit discs showing increased starch degradation following transient overexpression of MaSnRK2.10. (f) Relative expression levels of MaSnRK2.10 in banana fruit discs after gene overexpression, as determined by RT-qPCR. (g) Quantification of total starch, amylose, and amylopectin contents in banana fruit discs following MaSnRK2.10 transient overexpression. Data represent the mean ± standard error (SE) of three independent biological replicates. Statistically significant differences between samples were determined by Analysis of Variance (ANOVA) (* p < 0.05; ** p < 0.01).
Prediction of upstream transcriptional regulators of MaSnRK2.10
-
Potential transcription factors (TFs) interacting with the MaSnRK2.10 promoter were predicted (Fig. 7a). Expression profiling revealed that NAC1, NAC2, NAC3, and ERF transcription factors were significantly upregulated during fruit ripening (Fig. 7b, Supplementary Table S8). Binding prediction analysis demonstrated high interaction scores between these TFs and the MaSnRK2.10 promoter (Fig. 7c). Molecular docking simulations further characterized potential protein–DNA interactions. Specifically, Lys156 of NAC1 was predicted to interact with DG4 and DT5 bases within the promoter sequence 'cttgttcctcacgcctcct', forming OP2–N2/H2 interactions with bond lengths of 10.85 Å and 10.04 Å, respectively (Fig. 7e). Arg155 of NAC2 was predicted to bind DT11 in the sequence 'tgcttccttgttccacg' via O3′–NH2 interaction (9.46 Å) (Fig. 7f). DG16 within 'tcctcacgcct' interacted with Arg90 via OP1–NE (7.61 Å) (Fig. 7g). ERF was predicted to bind DC3 and DG4 bases in 'gccgccgttgccg' through OP1–NH2 (Arg75) and O6–NH2 (Arg44) interactions, respectively (11.10 Å) (Fig. 7d, Supplementary Table S9). These findings identify candidate transcription factors potentially involved in regulating MaSnRK2.10 expression and provide a theoretical framework for future experimental validation of transcriptional regulatory networks governing starch degradation in banana fruit.
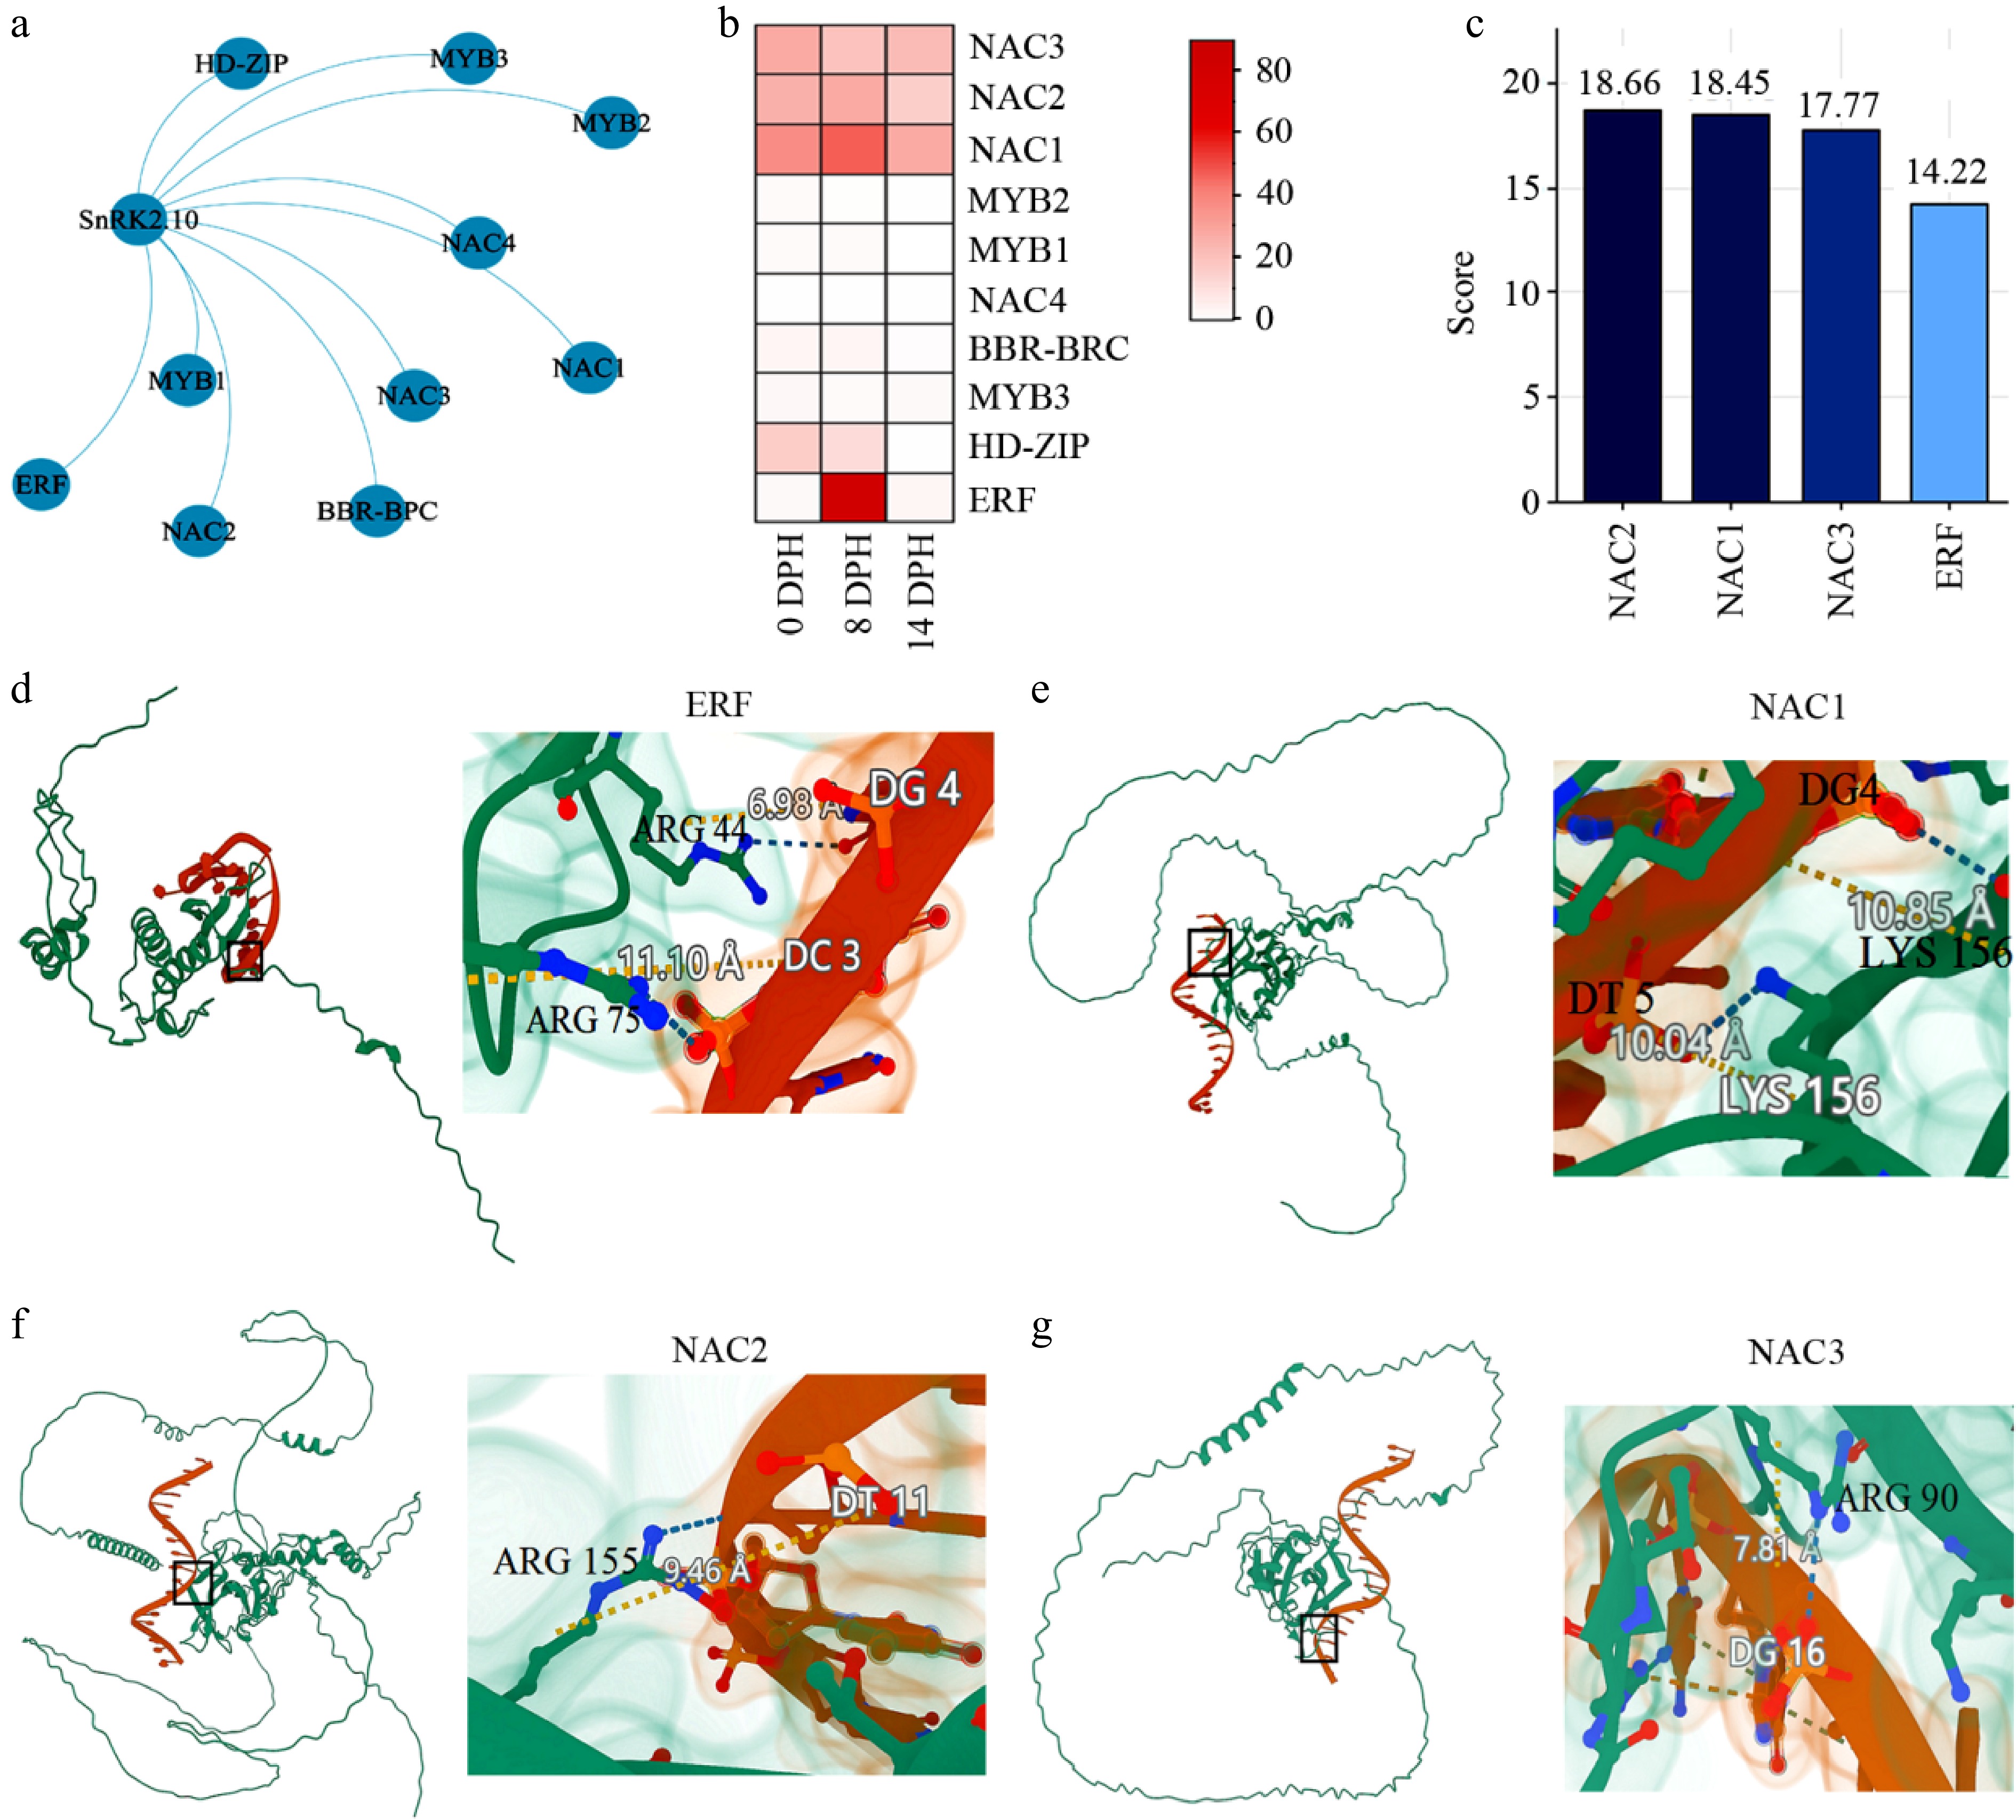
Figure 7.
Prediction and validation of transcriptional regulators targeting the MaSnRK2.10 promoter in banana (Musa acuminata). (a) Predicted transcriptional regulatory network involving transcription factors targeting the MaSnRK2.10 promoter. (b) Expression profiles of candidate transcription factors (NAC1, NAC2, NAC3, and ERF) associated with the MaSnRK2.10 regulatory network across different ripening stages of banana fruit. (c) Predicted binding scores of NAC1, NAC2, NAC3, and ERF to the MaSnRK2.10 promoter based on in-silico analysis. (d)–(g) Molecular docking simulations showing the predicted binding interactions between the MaSnRK2.10 promoter and transcription factors (d) ERF, (e) NAC1, (f), NAC2, and (g) NAC3, supporting their potential regulatory roles in starch biosynthesis.
-
Starch degradation is a central metabolic process governing postharvest quality formation and shelf life in banana[6], mango[11], kiwifruit[9], peach[42], and apple[18]. Numerous genes and transcription factors (TFs) involved in fruit starch degradation have been identified, including AMY1[18], BAM9b[43], PHO1[6], LSF1[8], MYB10.1[42], MYB16L[44], MYB44[45], ERF17– bHLH149[18], BEL1[46], GTL1a[47], APETALA2 (AP2a)[48], Dof3[49], NAC029[50], WRKY32[51], and C2H2[52].
Sucrose nonfermenting-1-related protein kinase 2 (SnRK2) is a plant-specific serine/threonine protein kinase that plays pivotal roles in plant growth, development, abiotic stress responses, and abscisic acid (ABA) signaling[53−55]. However, the genome-wide characteristics and functional roles of MaSnRK2 genes in banana have not previously been systematically investigated. In the present study, 14 MaSnRK2 genes (MaSnRK2.1–MaSnRK2.14) were identified in the banana A genome (Fig. 1). All encoded proteins contained a conserved S_TKc catalytic domain and displayed highly conserved motif composition and exon–intron organization. This structural conservation is consistent with reports in Arabidopsis thaliana[22], rice (Oryza sativa)[56], and cassava (Manihot esculenta)[26], indicating that SnRK2 proteins are evolutionarily conserved across monocots and dicots. Interestingly, the predicted coiled-coil domain in MaSnRK2.7 is unique among banana SnRK2 family members. Coiled-coil motifs typically serve as platforms for protein dimerization or interaction with binding partners. Although such domains are rarely annotated in SnRK2s, their presence in MaSnRK2.7 suggests a potential regulatory mechanism involving conformational changes or protein complex assembly, possibly linked to developmental or stress signaling. This structural divergence warrants further investigation into its functional significance.
Phylogenetic analysis categorized banana SnRK2 proteins into three subgroups (I–III), consistent with classifications reported in rice, A. thaliana, and cassava[22,26,56]. Members of Group I exhibited close evolutionary relationships with rice orthologs OsSnRK1 and OsSnRK2, whereas Groups II and III clustered with OsSnRK4, OsSnRK6, OsSnRK7, and OsSnRK3 (Fig. 2a). Interestingly, this phylogenetic classification (Fig. 1a; Subgroup I–III) did not fully align with the grouping based on gene structure or expression patterns (Fig. 2; Group A–C). Such discrepancies are not uncommon in multigene families, often reflecting functional differentiation following gene duplication events[35]. Thus, presenting both classifications provides complementary views of the evolutionary and functional diversification of banana SnRK2s. Ka/Ks ratios below 1.0 for all MaSnRK2 homologous pairs indicate that the gene family has undergone strong purifying selection during evolution (Fig. 3a), suggesting functional constraint and conservation. Gene duplication represents a primary mechanism driving gene family expansion[57]. The clustered chromosomal distribution and intragenomic collinearity observed among MaSnRK2.9 and MaSnRK2.12/2.14, MaSnRK2.10 and MaSnRK2.8/2.13, and MaSnRK2.4 and MaSnRK2.5/2.6 suggest that segmental or tandem duplication events contributed to family expansion (Fig. 4a). The absence of conserved collinear pairs between banana and either A. thaliana or rice (Fig. 4b) implies lineage-specific expansion and divergence following species differentiation.
Promoter analysis revealed that MaSnRK2 genes contain multiple cis-acting regulatory elements associated with phytohormone responses, stress signaling, and developmental regulation. In maize, a naturally occurring 20 bp deletion in the ZmSnRK2.10 promoter reduces transcript abundance and increases shoot Na+ accumulation under salt stress[58], underscoring the functional importance of promoter architecture. Similarly, in A. thaliana, double mutants of snrk2.2 snrk2.3 exhibit reduced expression of ABA-responsive genes containing ABRE motifs, leading to altered seed germination and root growth[59]. The promoter of MaSnRK2.10 is enriched with hormone-responsive elements, including ABRE, AuxRE, and GARE motifs, as well as stress-related elements (MBS and LTR) and development-associated elements (O2-site and MRE). Such enrichment suggests that MaSnRK2.10 may integrate hormonal and developmental signals during fruit ripening. The presence of conserved TATA-box and CAAT-box elements further confirms canonical promoter structure, consistent with SnRK2 promoters in cassava, pepper, A. thaliana, and rice[26,60,61].
The SnRK2 genes are implicated in starch biosynthesis, seed germination, and fruit development across species. For example, MeSnRK2.3 is highly expressed in cassava storage roots[26], and pepper CaSnRK2 genes exhibit strong expression in developing fruit tissues and under abiotic stress[60]. In strawberry, SnRK2.6 expression is ABA-inducible and negatively correlated with ripening progression[25]. In tomato, ABA acts as a core hormone regulating fruit ripening. Through the dual mechanisms of transcription and post-translational mediated by SnRK2s, it collaboratively regulates the activities of ACO and ACS in the ethylene synthesis pathway, thereby precisely initiating and advancing the fruit ripening process[62]. In banana, MaSnRK2.1, MaSnRK2.8, and particularly MaSnRK2.10 were significantly upregulated during early ripening stages (Fig. 5). Among them, MaSnRK2.10 exhibited the highest expression level, suggesting a central regulatory role. Subcellular localization analysis demonstrated that the MaSnRK2.10 protein localizes predominantly to the nucleus and plasma membrane, consistent with previous findings for TaSnRK2.8 in wheat[63] and ZmSnRK2 (ZmSAPK8) in maize[64]. Functional assays further supported its role in starch metabolism. Silencing of MaSnRK2.10 led to increased total starch, amylose, and amylopectin accumulation, accompanied by darker I2–KI staining (Fig. 6b), indicating reduced starch degradation. Conversely, transient overexpression of MaSnRK2.10 decreased starch components in banana fruit. These results provide direct functional evidence for the role of MaSnRK2.10 in regulating starch degradation during banana ripening. This regulatory role aligns with findings in cassava, where overexpression of MeSnRK2.3 enhanced starch accumulation and growth[26], highlighting conserved yet context-dependent functions of SnRK2 proteins in carbohydrate metabolism. Mechanistically, we propose that MaSnRK2.10 may directly phosphorylate rate-limiting enzymes (e.g., AMY, BAM) or act upstream of transcription factors (e.g., bZIP, NAC), regulating starch catabolic genes. Future kinase assays and phosphor-site mutagenesis are needed to identify its bona fide targets.
Transcriptional regulation is critical for coordinating starch degradation during banana ripening. For instance, MaMADS36 directly activates MaBAM9b expression to enhance starch degradation[65], whereas MaMYB3 represses multiple starch-degradation-related genes (GWD1, SEX4, BAM7–8, AMY2B, AMY3, AMY3A, AMY3C, MEX1, and pGlcT2-1) and delays ripening[66]. MaMYB44 and MaMYB73 form a complex that suppresses EXPA15 and BAM3, influencing fruit firmness and starch metabolism[45]. In the present study, four candidate TFs—NAC1, NAC2, NAC3, and ERF—were predicted to bind the MaSnRK2.10 promoter. Their expression patterns were significantly correlated with MaSnRK2.10 during early ripening. Molecular docking simulations supported the potential for direct protein–DNA interactions, suggesting that these TFs may regulate MaSnRK2.10 transcription. Although these findings are based on computational modeling and co-expression analysis, and require experimental validation (e.g., EMSA or ChIP assays), they provide a plausible regulatory framework linking upstream TF activity with SnRK2-mediated starch degradation. Further experiments will be conducted—such as yeast one-hybrid and EMSA assays—to further verify these predicted interactions.
Most studies have focused on transcriptional or enzymatic mechanisms. In contrast, our study identifies MaSnRK2.10, a Ser/Thr protein kinase, as a new player associated with starch degradation. This finding is conceptually significant because it highlights a potential post-translational regulatory layer—reversible protein phosphorylation—into the starch catabolic pathway. Given that SnRK2 kinases respond to ABA and stress signals, MaSnRK2.10 may integrate ripening-related or environmental cues into starch metabolism. While its precise targets remain unknown, our work opens a new direction for investigating how starch breakdown is fine-tuned at the protein level, complementing existing transcriptional models. Future studies should explore whether MaSnRK2.10 phosphorylates known starch-degrading enzymes (e.g., MaPHO1, MaBAM9b) or acts independently.
-
This study provides a comprehensive genome-wide characterization of the MaSnRK2 gene family in banana and reveals its functional relevance to fruit starch degradation. Fourteen MaSnRK2 genes were identified and classified into three conserved phylogenetic groups, exhibiting highly conserved gene structures, protein motifs, and evolutionary patterns under strong purifying selection, with tandem duplication contributing to family expansion. Promoter analysis indicated that MaSnRK2 genes, particularly MaSnRK2.10, harbor diverse cis-acting elements associated with phytohormone signaling, stress responses, and developmental regulation, suggesting complex transcriptional control. Expression profiling demonstrated that MaSnRK2.10 is specifically and highly expressed during early fruit ripening, and subcellular localization showed that the MaSnRK2.10 protein is distributed in the nucleus and cell membrane. Functional assays further confirmed that MaSnRK2.10 significantly regulates starch degradation, as transient silencing increased starch, amylose, and amylopectin contents, whereas transient overexpression reduced their accumulation in banana fruit. In addition, several candidate transcription factors were predicted to regulate MaSnRK2.10 expression, implying a potential regulatory network underlying starch metabolism during ripening. Together, these findings identify MaSnRK2.10 as a key regulator of starch degradation and provide a solid theoretical basis for future molecular improvement of starch metabolism and postharvest quality in banana.
-
The authors confirm their contributions to the paper as follows: study conception and design, draft manuscript preparation: Miao H, Wang Y; data collection: Tu Y, Zhu Z, Sun P, Jin Z, Liu J; analysis and interpretation of results: Miao H, Zhu Z, Sun P, Zhang M, Jin Y, Wu M, Wang L, Zhou L; resources: Miao H, Jin Z, Liu J; manuscript writing and revising: Miao H, Tu Y, Ali MM. All authors reviewed the results and approved the final version of the manuscript.
-
All data generated or analyzed during this study are included in this published article and its supplementary information files.
-
This work was supported by the National Natural Science Foundation of China (No. U24A20413, 32560720, and 32172545), the project of the State Key Laboratory of Tropical Crop Breeding (No. SKLTCBGJ202515), the project of the National Key Laboratory for Tropical Crop Breeding (No. NKLTCBCXTD25), the Hainan Provincial Natural Science Foundation of China (No. 325CXTD620 and 324QN278), the Central Public-interest Scientific Institution Basal Research Fund for Innovative Research Team Program of CATAS (No. 1630052022007 and 1630052025014), and the Modern Agro-industry Technology Research System of China (No. CARS-31).
-
The authors declare that they have no conflict of interest.
-
accompanies this paper online at: https://doi.org/10.48130/frures-0026-0014.
-
# Authors contributed equally: Yunen Tu, Zhao Zhu, Peiguang Sun
- Supplementary Table S1 Primers used in this study.
- Supplementary Table S2 Table S2 Subcellular localization and physicochemical properties of proteins of all family members of MaSnRK2.
- Supplementary Table S3 Protein names and accession numbers for the three species.
- Supplementary Table S4 Temporal expression data of MaSnRK2 genes during banana fruit development and ripening.
- Supplementary Table S5 Expression data of MaSnRK2.10 genes in different organs in banana.
- Supplementary Table S6 Relative expression data of MaSnRK2.10 genes during banana fruit development and ripening.
- Supplementary Table S7 Starch content and relative expression levels in fruit slices.
- Supplementary Table S8 Expression patterns of predicted regulatory transcription factors for the MaSnRK2 gene.
- Supplementary Table S9 Predicted regulatory transcription factors of the MaSnRK2 gene.
- Copyright: © 2026 by the author(s). Published by Maximum Academic Press, Fayetteville, GA. This article is an open access article distributed under Creative Commons Attribution License (CC BY 4.0), visit https://creativecommons.org/licenses/by/4.0/.
-
About this article
Cite this article
Tu Y, Zhu Z, Sun P, Zhang M, Ali MM, et al. 2026. Revealing the functional role of sucrose nonfermenting-1-related protein kinase gene SnRK2.10 in regulating starch degradation in banana (Musa acuminata). Fruit Research 6: e020 doi: 10.48130/frures-0026-0014 

Revealing the functional role of sucrose nonfermenting-1-related protein kinase gene SnRK2.10 in regulating starch degradation in banana (Musa acuminata)
- Received: 09 March 2026
- Revised: 14 April 2026
- Accepted: 15 April 2026
- Published online: 31 May 2026
Abstract: Starch degradation is a critical process influencing fruit quality and shelf life during postharvest ripening of banana. Sucrose nonfermenting-1-related protein kinase 2 (SnRK2) is a plant-specific Ser/Thr protein kinase family primarily involved in abscisic acid (ABA) signaling; however, its role in regulating fruit starch degradation remains largely unclear. In this study, 14 MaSnRK2 genes were identified from the Musa acuminata genome and classified into three phylogenetic groups, all containing a conserved S_TKc catalytic domain. Evolutionary analysis indicated that the MaSnRK2 family has undergone strong purifying selection, with six tandem duplication events contributing to its expansion. Promoter analysis revealed abundant cis-acting elements associated with development, hormone signaling, and stress responses. Among the identified members, MaSnRK2.10 exhibited distinct functional differentiation and was markedly upregulated during fruit ripening, suggesting a specialized role in starch metabolism. Subcellular localization analysis showed that the MaSnRK2.10 protein is predominantly localized to the nucleus and cell membrane. Functional assays demonstrated that transient silencing of MaSnRK2.10 increased total starch content, whereas transient overexpression reduced starch accumulation in banana fruit, confirming its involvement in the regulation of starch degradation. Furthermore, coexpression analysis and molecular docking predict that ERF, NAC1, NAC2, and NAC3 may bind to the MaSnRK2.10 promoter, suggesting a complex transcriptional regulatory network. Collectively, this study systematically characterizes the genome-wide features of the MaSnRK2 family and identifies MaSnRK2.10 as a key regulator of starch degradation, providing valuable molecular insights and targets for improving banana fruit quality and shelf life.
-
Key words:
- Banana /
- Starch degradation /
- Gene function /
- SnRK2 /
- Fruit quality