












-
Cornus mas L., commonly known as cornelian cherry, is a member of the dogwood genus (Cornus sp.) and is valued both as an ornamental plant and for its edible fruits[1]. Although the Cornus genus is widely distributed across the temperate regions of the Northern Hemisphere, extending into the tropical and subtropical areas of Asia, the Americas, and Africa[2], the natural range of C. mas is more restricted. It is centered in Western Asia and extends across the mountainous regions of the Caucasus, Asia Minor, and into Southern and Central Europe[3,4]. Natural thickets of C. mas are particularly widespread in the Caucasus. Cornus mas shows a clear preference for wooded and mountainous landscapes across its native range[5]. While many Cornus species are cultivated mainly for ornamental purposes, C. mas stands out for its extensive cultivation, especially in southern and central Europe and southwest Asian regions, that significantly overlaps with its native distribution[1].
Fruit traits are among the most morphologically variable characteristics of C. mas. Most fruits are dark red or cherry red, though yellow-fruited populations also exist[6]. These differences in fruit size and color are among the most visible indicators of the species' morphological diversity. Studies of local genotypes across different ecological zones have confirmed high levels of variation in both morphological and biochemical traits, supporting the hypothesis that environmental pressures contribute to local adaptation in natural populations[7]. The species also demonstrates remarkable ecological adaptability. C. mas is easy to grow and tolerant of diverse soils, sites, and diseases[6]. This ecological flexibility is mirrored in its chemical composition, which varies according to environmental factors, cultivation practices, and climatic conditions[1]. Such adaptability likely contributes to its capacity to sustain viable populations across a wide geographic area, from Western Asia through the Caucasus to Southern and Central Europe.
In Hungary, C. mas is a widespread native species, and is abundant in the hilly and mountainous areas of Northern and Transdanubian Hungary (Fig. 1). Several studies have documented the presence of valuable wild-growing genotypes in Hungary, emphasizing the species' adaptability to the dry continental climate and its potential for local selection and domestication[3,8,9].
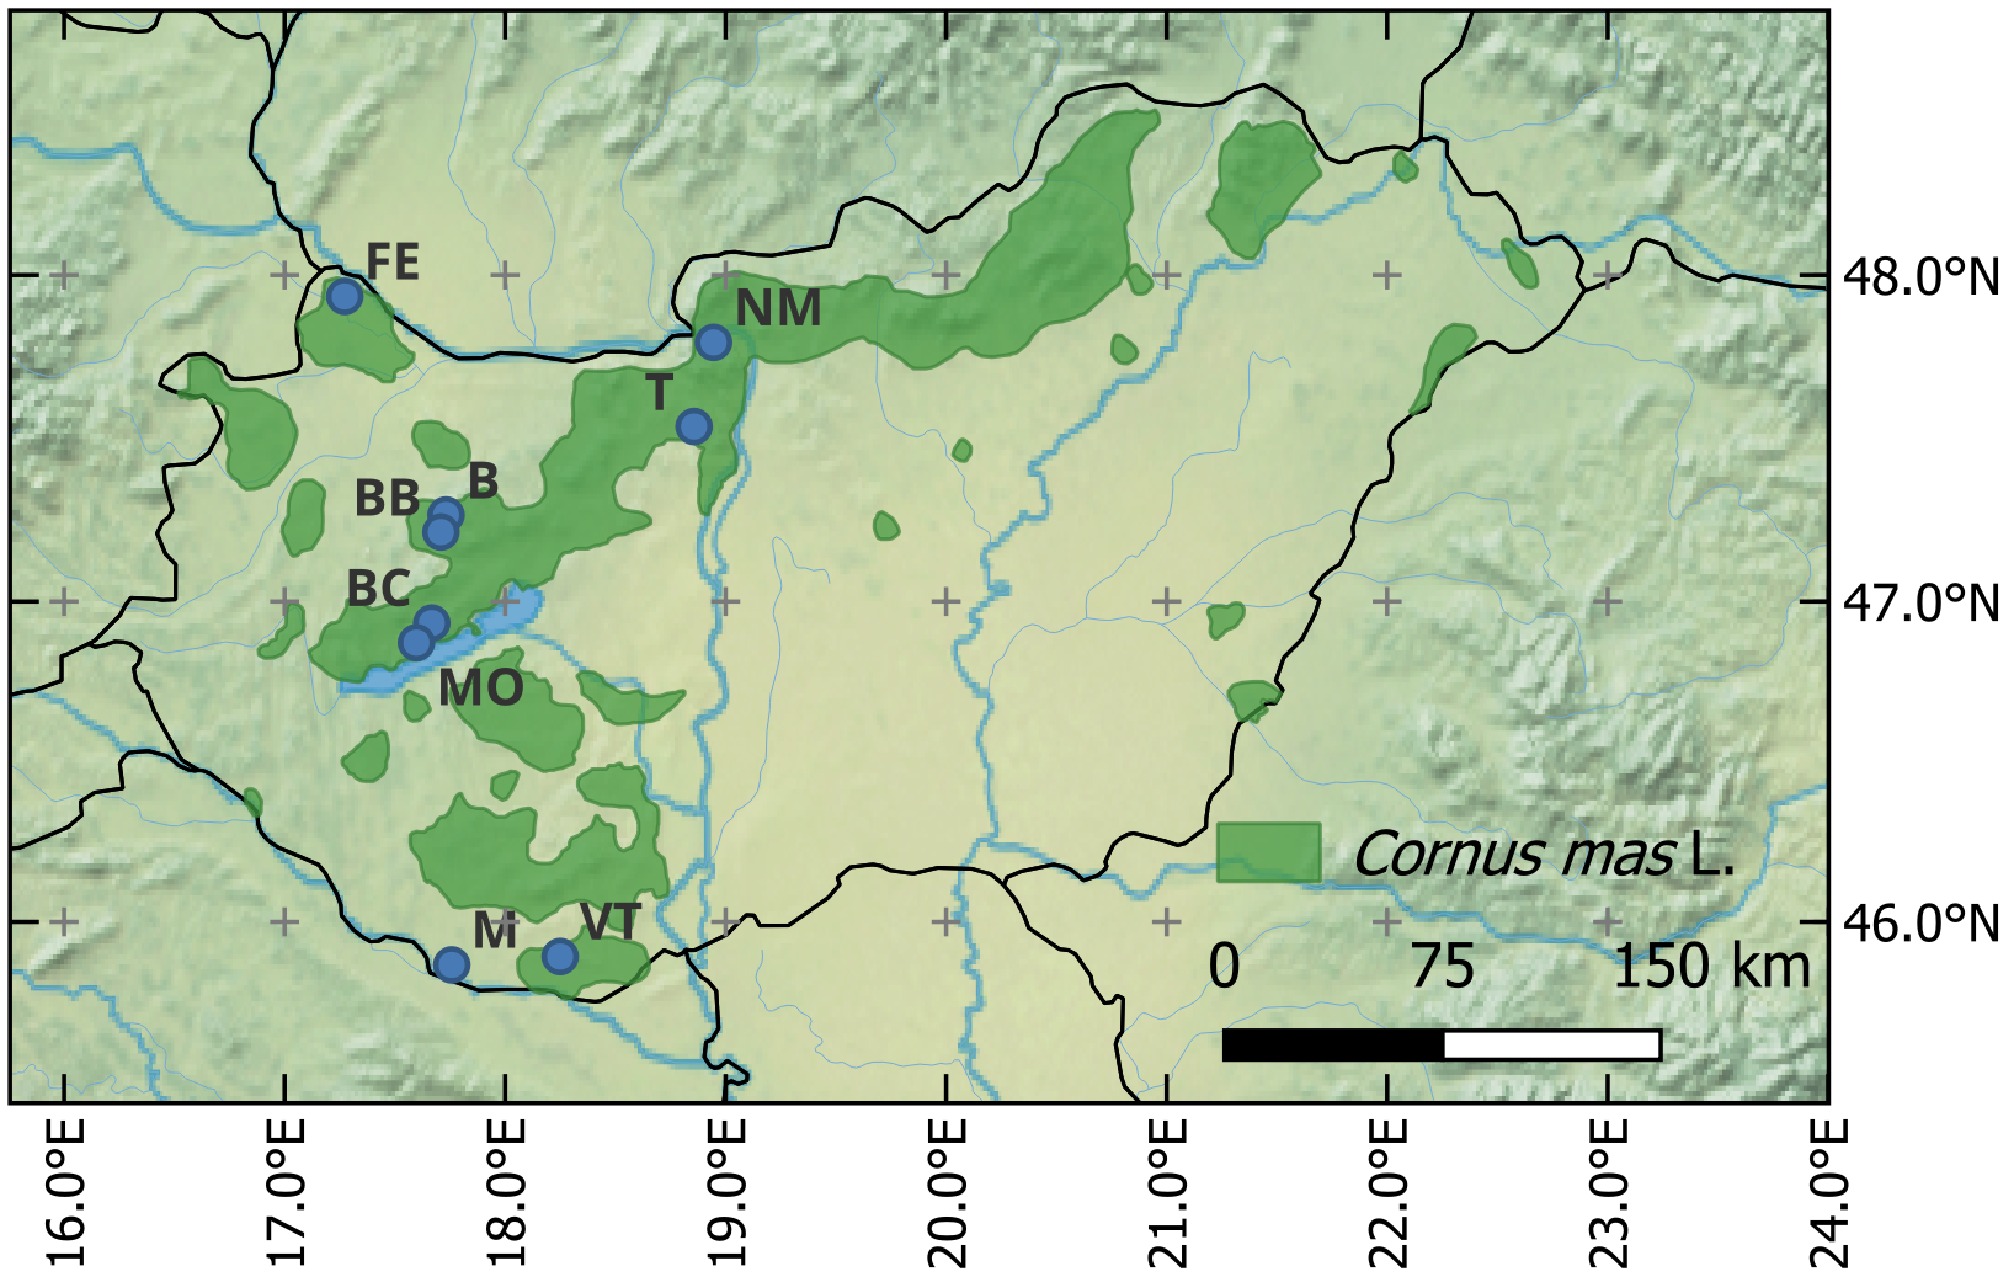
Figure 1.
Sampling sites of Cornus mas in Hungary. B, Bakony, Tönkös- hegy; BB, Bakonybél monastry; BC, Balatoncsicsó; FE, Feketeerdő; M, Markóc; MO, Monoszló; NM, Nagymaros; T, Telki; VT, Tenkes-hegy. The green color indicates the natural occurrence of the species in Hungary.
Only a limited number of studies have performed the molecular marker-based identification of Cornus species and cultivars, or assessed the genetic stability of their genotypes. As with many other plant species, research on cornelian cherry was initially done using random molecular markers. The few existing analyses have mainly used random amplified polymorphic DNA (RAPD) and inter simple sequence repeat (ISSR) markers, which consistently revealed high levels of polymorphism and differentiation among genotypes. Ercisli et al.[10] assessed the genetic relationships among C. mas genotypes collected from the natural populations of Eastern Anatolia using RAPD markers; their results indicated a high degree of polymorphism among the analyzed genotypes. RAPD markers were likewise effectively used by Morozowska et al.[11] to distinguish C. mas, C. officinalis, and their interspecific hybrid; among 72 tested random primers, 24 proved suitable for differentiating the three genotypes.
Hassanpour et al.[12] used ISSR markers to investigate the genetic diversity of Iranian C. mas accessions, revealing a considerable level of polymorphism. Their findings indicate that ISSR markers are effective tools for the characterization and clustering of cornelian cherry accessions[12]. Kalalagh et al.[13] also used ISSR markers to assess the genetic relatedness and population structure of C. mas in the Arasbaran region. However, the dominant nature and limited reproducibility of RAPD and ISSR markers restricted their application in fine-scale genetic analyses and long-term genotype identification.
Microsatellite or simple sequence repeat (SSR) markers are favored over ISSR and RAPD markers due to their high polymorphism, co-dominant inheritance, and reproducibility, which make them particularly suitable for genetic mapping, parentage analysis, and cultivar identification. The first SSR markers for the Cornus genus were developed by Cabe and Liles, for C. florida[14]. Wang et al.[15] created further SSR markers for the same species. In the same year, Wadl et al.[16] published primers for C. kousa. Wadl et al. later evaluated 18 previously developed SSR markers for their cross-species transferability within the Cornus genus. Their study showed that markers derived from C. florida exhibited greater transferability than those derived from C. kousa, with five of the 18 C. florida markers successfully amplifying in C. mas, whereas none of the C. kousa markers proved effective[17]. Subsequently, Wadl et al.[18] developed SSR markers specifically for C. mas, identifying nine that were polymorphic and suitable for genotypic differentiation. They evaluated 37 C. mas cultivars from Austria, Poland, Romania, Ukraine, and the USA, along with one C. eydeana sample, and ultimately selected five loci to establish a molecular identification key capable of distinguishing each sample.
Behan et al. conducted a comprehensive SSR-based analysis of 50 C. mas cultivars from Eastern Europe using nine microsatellite markers based on the previously mentioned studies. They identified a total of 85 alleles, with high levels of polymorphism and genetic diversity. Bayesian clustering and multivariate analyses revealed three major genetic groups, largely reflecting geographic origin and distinguishing yellow-fruited cultivars as a separate cluster. The study also highlighted significant intra-cultivar variation, particularly among landraces and historically named cultivars such as "Macrocarpa" and "Variegata". These results confirm the effectiveness of SSR markers for a detailed genetic characterization and cultivar identification in C. mas[19]. However, natural populations—especially those in Central Europe—remain much less studied, and the Hungarian wild gene pool has not yet been characterized using SSR markers.
The objective of this study was to assess the genetic diversity and relationships of natural populations of the Hungarian (Central European) gene pool of C. mas based on available polymorphic SSR markers.
-
Young and healthy leaves of ninety-two cornelian cherry (C. mas) specimens were collected from nine populations of Hungary (Table 1 and Fig. 1). Eight populations were natural, while one population was a plantation in the monastery garden of Bakonybél that has become wild over the years.
Table 1. The studied Hungarian cornelian cherry accessions with their geographical location.
Code No. of
samplesLocation County GPS coordinates B 12 Tönkös-hegy Veszprém 47.267052, 17.731369 BB 5 Bakonybél Veszprém 47.251345, 17.727807 BC 10 Balatoncsicsó Veszprém 46.933607, 17.666828 FE 10 Feketeerdő Győr-Moson-Sopron 47.935377, 17.272106 M 9 Markóc Baranya 45.864789, 17.757312 MO 10 Monoszló Veszprém 46.906460, 17.641493 NM 13 Nagymaros Pest 47.795524, 18.944578 T 13 Telki Pest 47.538695, 18.856101 VT 10 Tenkes-hegy Baranya 45.891071, 18.248926 B = Bakony, Tönkös-hegy; BB = Bakonybél monastry; BC = Balatoncsicsó; FE = Feketeerdő; M = Markóc; MO = Monoszló; NM = Nagymaros; T = Telki; VT = Tenkes-hegy. Leaf samples were frozen and stored at −20 °C until DNA extraction. Genomic DNA was isolated using the E.Z.N.A.® Plant DNA Kit (VWR, Hungary) following the manufacturer's instructions. DNA concentration and quality were determined using a NanoDrop ND-1000 spectrophotometer (BioScience, Hungary) and further verified by electrophoresis on 1% agarose gel. The extracted DNA was subsequently stored at −20 °C.
PCR amplification of SSR loci
-
SSR loci were selected based on their previously reported high polymorphism, reliable amplification, and successful application in Cornus species. Markers were chosen from the studies of Wang et al.[15], Wadl et al.[17,18], and our earlier work[19], in which they proved to be effective for genotype discrimination and genetic structure analysis. In total, twelve SSR loci originally developed for C. mas (CM) or C. florida (CF) were analyzed, including loci shown to be transferable across Cornus species (Table 2). PCR amplifications were performed for each loci separately in a final reaction volume of 15 µL. The reaction mix included 20–80 ng DNA, 10x PCR reaction buffer, 0.2 mM dNTP mix, 0.3 µmol each of 5′ and 3′ end primers with 0.5 unit of DreamTaq DNA polymerase (Fermentas, Szeged, Hungary), 1% BSA, 2% DMSO, and sterile distilled water. Forward primers were fluorescently labelled with 6-FAM. Reactions were carried out using a Swift MaxPro thermocycler (Esco Healthcare Pte, Singapore) using the following cycling parameters: an initial denaturation step at 94 °C for 4 min, followed by 30 cycles consisting of 94 °C for 30 s, 50 °C for 40 s (for each primer pair), and 72 °C for 60 s, with a final synthesis at 72 °C for 5 min. Amplification success was confirmed by electrophoresis on a 1% (w/v) agarose gel stained with ethidium bromide in 1×TBE buffer, using xylene cyanol as the loading dye. Fragment sizes were initially estimated by comparison with a 100 bp DNA ladder (Fermentas, Waltham, MA, USA). Precise fragment sizing was performed by capillary electrophoresis using an ABI PRISM 3100 Genetic Analyzer (Applied Biosystems, Budapest, Hungary) at Eurofins Biomi Ltd. (Gödöllő, Hungary). Fragment lengths were manually scored using Peak Scanner Software v1.0 (Applied Biosystems), and the resulting data were compiled in Microsoft Excel.
Table 2. SSR loci used in this study, with forward and reverse primer sequences, repeat motifs, and references.
Locus Primer sequence Repeat motif Ref. CF48 L: GCTTTGACATCCTCTTTGCTTCTC (TG)9 [15] R: AAGAGGCTTCACAAGACAATCAGC CF51 L: GGGCTAGTAGGTCGAGTGATCAAA (AG)7(GT)10 [15] R: CATTGCTTGGTGGTGATCTCTAAA CF55 L: TGGAGTAGGGCAAAAGATCAAGAG (GT)7T(TG)10 [15] R: TCCAGGGAATGTTCGGTAGATTAG CF59 L: TGGACTATAACGAGCAAGAAAGCA (AAAG)4 [15] R: GCTTTGTCCATAATCGTTTAGGCT CM007 L: GTTTAGGTGTGAGTGCAGATGG (GT)24 [18] R: CAATGCTAACAAGCACCATTCC CM008 L: TCGTTAATGTGAAATTGGAACG (GT)11 [18] R: CACCGTACACGCAAAGTCC CM010 L: GCTAGCAGAAGCACAGTTAGCC (CA)12 [18] R: TCCAACATGTAAAACCTAGATGC CM026 L: GAATTCATGTAATGTTGTTGTCTGC (CA)14 [18] R: CCTGCATATAATTCAGGTAAAGAGC CM031 L: TACCCTCTCTTGCTCTTTGTCC (AG)26(TG)13 [18] R: AAACAATCAAACCCAAACAACC CM037 L: AACACAGAGAAACACGTGCAA (TG)20 [18] R: TGGAGATCTTTGAAGAACAGGA CM039 L: GGGTATTGTAATCAATGTAAAACCAA (GT)18 [18] R: TCACACCACCAGCAATCACT CM043 L: GTCCACACCTGTTGTTCAGC (TG)16(TA)5 [18] R: GGTTGCAATGCTTTCTTGGT Data analysis
-
Statistical analysis was conducted using the GenAlEx 6.5 add-in within Microsoft Excel[20]. This software was used to compute allele frequencies (Pi), expected (He) and observed (Ho) heterozygosity, and the Shannon index (I), and to perform principal coordinate analysis (PCoA) and analysis of molecular variance (AMOVA). Hardy–Weinberg equilibrium (HWE) was evaluated for each locus in every population using chi-square tests; significance was determined at p < 0.05. Polymorphic information content (PIC) was calculated in MS Excel using the formula PIC = 1−Σ(Pi)2, where Pi is the proportion of samples carrying the 'ith' allele of a particular locus.
Neighbour joining cluster analysis was conducted using PAST software version 4.03[21] based on Jaccard similarity index, with 2,000 bootstraps. STRUCTURE v2.3.4 was used to infer the most probable number of genetic groups within the SSR dataset[22]. The analysis was conducted using an admixture model with correlated allele frequencies. The number of clusters (K) was set ranging from 1 to 8, with a burn-in period of 100,000 iterations followed by 500,000 Markov Chain Monte Carlo (MCMC) repetitions. Each K value was tested across 20 independent runs. Subsequently, the "pophelper" package in R[23] was used to implement the Evanno method[24] to identify the most appropriate K value. The 20 replicate runs were then averaged using CLUMPP v1.1.2[25].
To investigate the genetic structure of the populations, a discriminant analysis of principal components (DAPC) was conducted using the "adegenet" R package[26]. To further establish the divergence between the populations, a minimum spanning tree (MST), based on the squared distances between population centroids, was fitted on the final plot.
The unweighted pair-group method with arithmetic mean (UPGMA), as implemented in the "poppr" R package[27], was used to create a dendrogram showing the genetic relationships among populations based on Nei's genetic distances[28]. Bootstrap values were calculated by running 10,000 simulations, and are presented at the intersections of the tree branches. Genetic differentiation (FST) between populations was plotted on a heat map using the "hierfstat" package in R[29].
-
Successful amplification was achieved with six SSR markers (Table 3). Although markers CM010 and CF48 yielded clear amplification products, they exhibited monomorphic allele patterns. Marker CF59, originally developed for C. florida, did not produce any amplified fragments, while CF51 and CM007 showed successful amplification in only a limited number of samples. In contrast, marker CM039 generated four distinct fragments, indicating its multilocus nature. Hence, these six markers were excluded from the final evaluation.
Table 3. Expected and observed allele size ranges and genetic diversity parameters of the six studied SSR loci.
CF55 CM08 CM26 CM31 CM37 CM43 Average Expected size 155 156 192 208 184 220 − Obtained size 137–165 152–175 179–201 180–221 171–202 206–232 − Na 5 9 16 23 15 11 13.17 Ne 1.615 7.52 5.041 8.584 4.144 3.291 5.03 I 0.764 2.079 1.943 2.529 1.884 1.543 1.79 Ho 0.359 0.793 0.804 0.891 0.783 0.565 0.7 He 0.381 0.867 0.802 0.884 0.759 0.696 0.73 PIC 0.483 0.867 0.813 0.886 0.778 0.718 0.757 FIS 0.058 0.085 −0.003 −0.009 −0.032 0.188 0.048 Na = Number of different alleles, Ne = Number of effective alleles, I = Shannon's Information Index, Ho = Observed heterozygosity, He = Expected heterozygosity, PIC = Polymorphic Information Content, FIS = Wright's inbreeding coefficient. The remaining six primer pairs produced a total of 79 alleles and the amplified allele sizes corresponded well with the expected sizes reported in previous studies. The number of alleles per locus ranged from 5 (CF55) to 23 (CM031), with an average of 13.17 alleles per locus, indicating a high level of polymorphism (Table 3).
The genetic indices for each locus are given in Table 3. The CF55 locus, which yielded only five alleles, also exhibited the lowest heterozygosity and PIC values. The PIC values of the other loci were all above 0.7 (varying between 0.718 and 0.886), confirming that the studied loci were highly informative and suitable for assessing the genetic structure of the studied populations. The expected heterozygosity (He) ranged from 0.381 to 0.884, while the observed heterozygosity (Ho) varied between 0.359 and 0.891. These values indicate the generally high genetic diversity across loci and suggest that most loci were close to HWE. This was further supported by the HWE tests: across the nine populations and six loci (54 population–locus combinations), only three cases showed statistically significant deviations from HWE (Balatoncsicsó–Locus CM31, Balatoncsicsó–Locus CM43, and Tenkes-hegy–Locus CM37; p < 0.05). All other tests were non-significant, indicating that the vast majority of genotypic distributions conformed to Hardy–Weinberg expectations. The most polymorphic locus was CM31, producing 23 alleles and having the highest PIC value of 0.886. FIS values ranged from –0.032 to 0.188, with an overall mean of 0.048. Most loci showed values close to zero, indicating minimal deviation from HWE and little evidence of inbreeding. The slightly negative FIS values at CM26, CM31, and CM37 reflect marginal heterozygote excess, whereas CF55 and CM08 showed weak heterozygote deficits. The highest value was observed at CM43 (FIS = 0.188), suggesting a moderate heterozygote deficit at this locus. Overall, the results indicate generally random mating and low levels of inbreeding across loci.
These findings were consistent with the AMOVA, which partitioned the genetic variance primarily within individuals, with only a smaller proportion attributable to differences among populations. The overall level of genetic differentiation was low to moderate (FST = 0.077, p = 0.001), indicating that although populations are genetically distinguishable, most of the genetic variation resides within individuals rather than among populations. The AMOVA-based fixation indices further supported this pattern, showing negligible within-population inbreeding (FIS = –0.021) and low overall multilocus inbreeding (FIT = 0.057). Collectively, the heterozygosity measures, F-statistics, and AMOVA converge on the conclusion that the populations are characterized by high genetic diversity, largely random mating, and only modest genetic structuring.
The high level of polymorphism and heterozygosity observed across loci provided a robust basis for subsequent analyses of genetic relationships and population structure. Principal coordinates analysis (PCoA) based on microsatellite data revealed moderate but discernible patterns of genetic differentiation among C. mas populations (Fig. 2). The first two coordinates explained 10.8% and 9.6% of the total genetic variation, respectively. Although this represents a relatively modest proportion of the overall variance, such values are typical for PCoA based on highly polymorphic microsatellite data. Each of the subsequent coordinates accounted for less than 7% of the variation and did not reveal additional clustering patterns beyond those observed along the first two axes. Most populations from the North Transdanubia region (Tönkös-hegy, Bakonybél Monastery, Balatoncsicsó, Feketeerdő, Monoszló, Nagymaros, Telki, and Tenkes-hegy) overlapped extensively in the ordination space, indicating a largely shared genetic background and genetic similarity among them. In contrast, individuals from the Markóc (South Transdanubia) population were clearly separated from the remaining populations along the first coordinate, but did not form a compact cluster, instead displaying a relatively dispersed distribution indicative of high within-population genetic variability. This pattern suggests pronounced genetic differentiation of the Markóc population from the other sampled groups, while simultaneously indicating substantial genetic diversity within the population itself. Such a pattern may reflect historical factors such as long-term demographic processes, local founder effects, or reduced but not completely interrupted gene flow, rather than strict contemporary geographic isolation. Overall, the PCoA pattern suggests a moderate population structure in C. mas, with one genetically distinct peripheral population (Markóc) and several interrelated populations across the North Transdanubia.
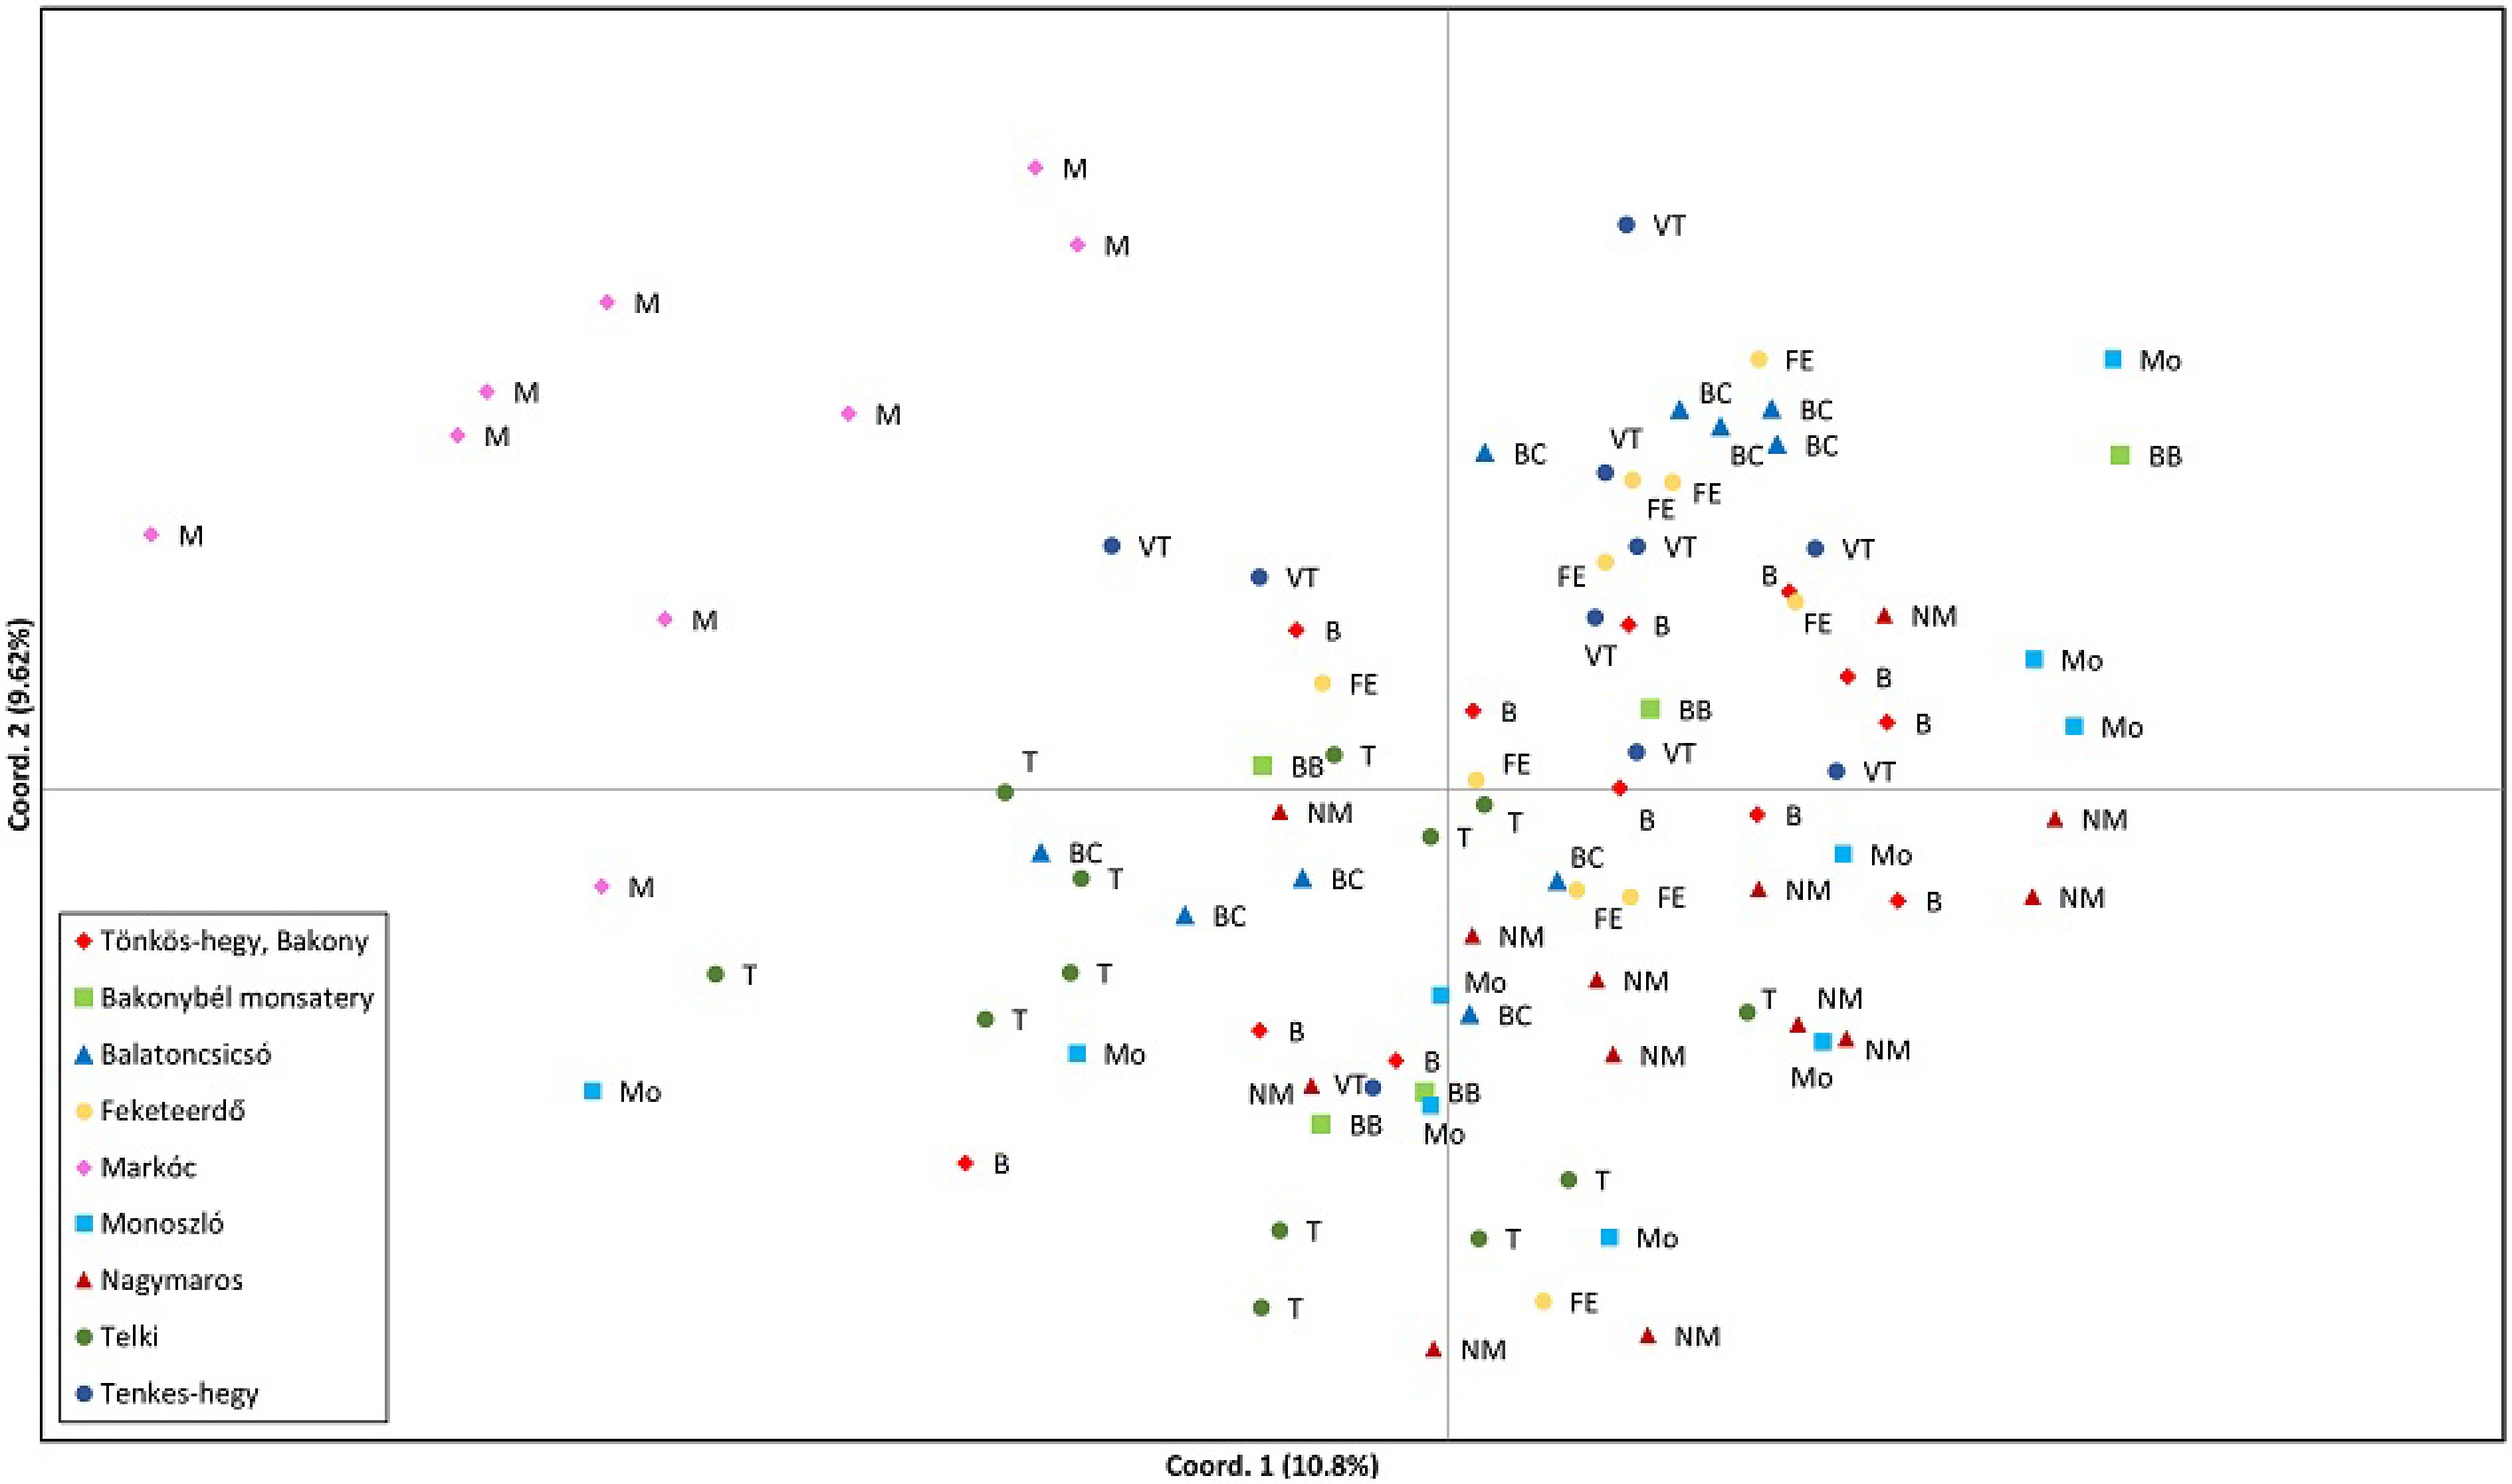
Figure 2.
Principal coordinate analysis (PCoA) of the cornelian cherry individuals collected from nine Hungarian populations. Individuals are colored by population. The first two axes explain 10.8% and 9.62% of the variance, respectively.
In addition to PCoA, we applied DAPC to further explore the population structure, which often performs better with few loci and does not assume HWE. DAPC integrates principal component analysis (PCA) for dimensionality reduction with discriminant analysis to maximize the variation among groups while minimizing the variation within groups. As seen in Fig. 3, DAPC revealed clear genetic structuring among the studied populations. The first discriminant axis, explaining 49.2% of the variance, primarily separates the Markóc population from all others, indicating a pronounced genetic differentiation. The second axis (16.2%) further distinguishes clusters within the remaining populations, although these groups exhibit substantial overlap, suggesting some level of genetic connectivity.
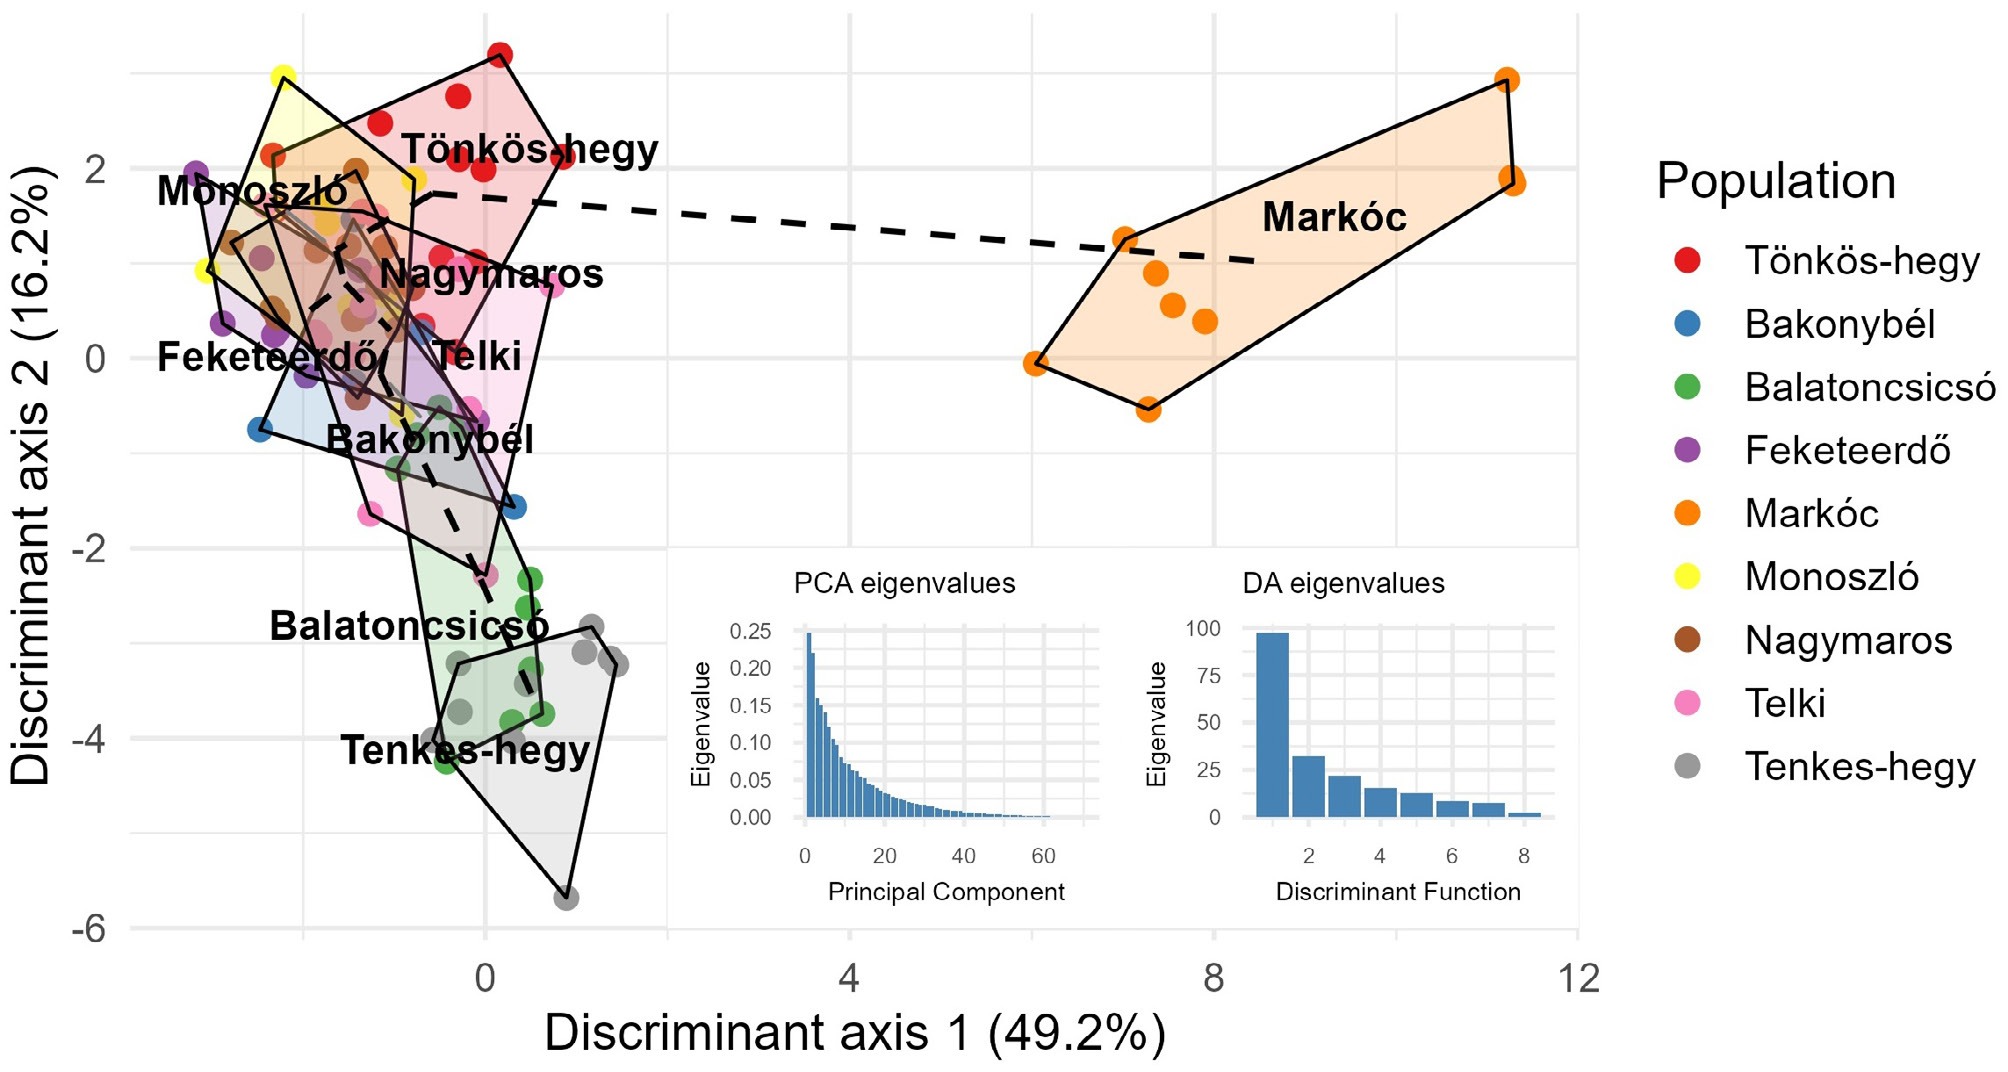
Figure 3.
Discriminant analysis of principal components (DAPC) with minimum spanning tree (MST). Individuals are colored by population, with polygons indicating clusters. The first two discriminant axes explain 49.2% and 16.2% of the variance, respectively. Dashed lines represent the MST connecting populations. Insets show eigenvalue distributions for PCA and discriminant functions.
Populations from Tönkös-hegy, Monoszló, Nagymaros, Telki, and Feketeerdő form a relatively cohesive cluster, implying shared genetic backgrounds or recent gene flow. In contrast, Balatoncsicsó and Tenkes-hegy occupy distinct positions along the negative side of axis 2, reflecting unique genetic signatures compared to the central cluster.
MST supports these observations by illustrating the shortest genetic distances among populations. The MST connects the central cluster sequentially, while Markóc remains linked through a longer branch, reinforcing its genetic isolation. This pattern may result from geographic separation, historical bottlenecks, or limited migration.
Eigenvalue distributions confirm that most of the discriminatory power resides in the first few axes, validating the robustness of the observed clustering. Overall, these findings indicate a significant population structure, with Markóc as an outlier and other populations forming partially overlapping genetic groups.
The genetic relationships among C. mas individuals were further examined using cluster analysis based on microsatellite genotypes (Fig. 4). The resulting dendrogram revealed a generally weak but consistent population structure, in agreement with the PCoA and DAPC results. Individuals from the Markóc population formed a separate and cohesive cluster, clearly distinct from the remaining populations, confirming its unique genetic composition. In contrast, individuals from the Bakony and adjacent North Transdanubian populations were widely interspersed across multiple branches, reflecting high genetic similarity and indicating extensive gene flow among these regions. Minor subclusters were observed within some localities (e.g., Balatoncsicsó and Nagymaros), but without clear geographic separation. Overall, the analysis supports a pattern of moderate differentiation, with one genetically distinct population (Markóc) and a largely panmictic gene pool across North Transdanubia.
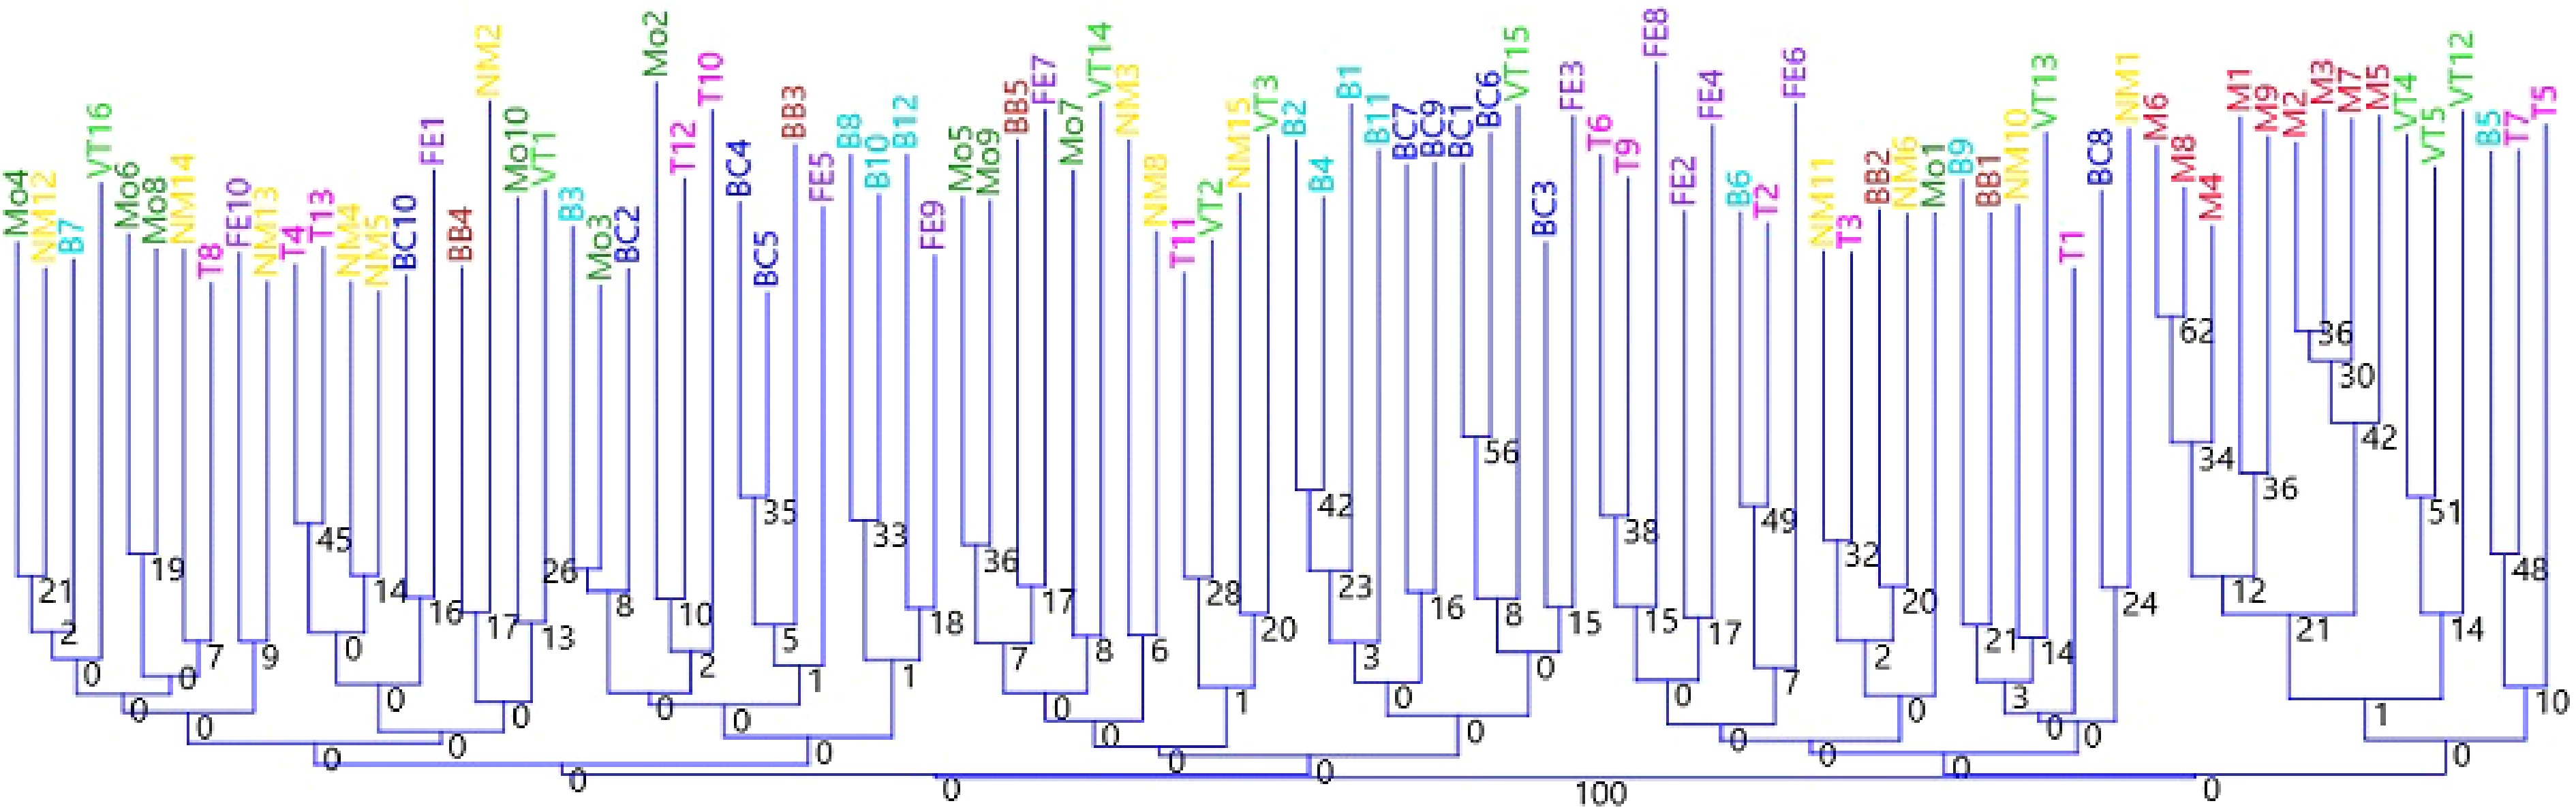
Figure 4.
Genetic distance of the studied Hungarian C. mas accessions using six SSR markers. Individuals are colored by population (B-Bakony, Tönkös-hegy = light blue, BB-Bakonybél monastery = brown, BC-Balatoncsicsó = dark blue, FE-Feketeerdő = purple, M-Markóc = red, MO-Monoszló = dark green, NM-Nagymaros = yellow, T-Telki = pink, VT-Tenkes-hegy = light green). The dendrogram was constructed by Neighbor joining method based on Jaccard similarity index. The numbers at specific nodes indicate percentage of 2000 bootstrap replicates in which a given group was found.
The UPGMA dendrogram and Nei's FST heatmap (Fig. 5) jointly illustrate the genetic differentiation among the studied cornelian cherry populations. The dendrogram shows hierarchical clustering based on genetic distances, with Markóc forming the most distinct branch (bootstrap support = 100), indicating strong genetic isolation from all other populations. The next major split separates Telki from the remaining cluster, suggesting moderate differentiation.
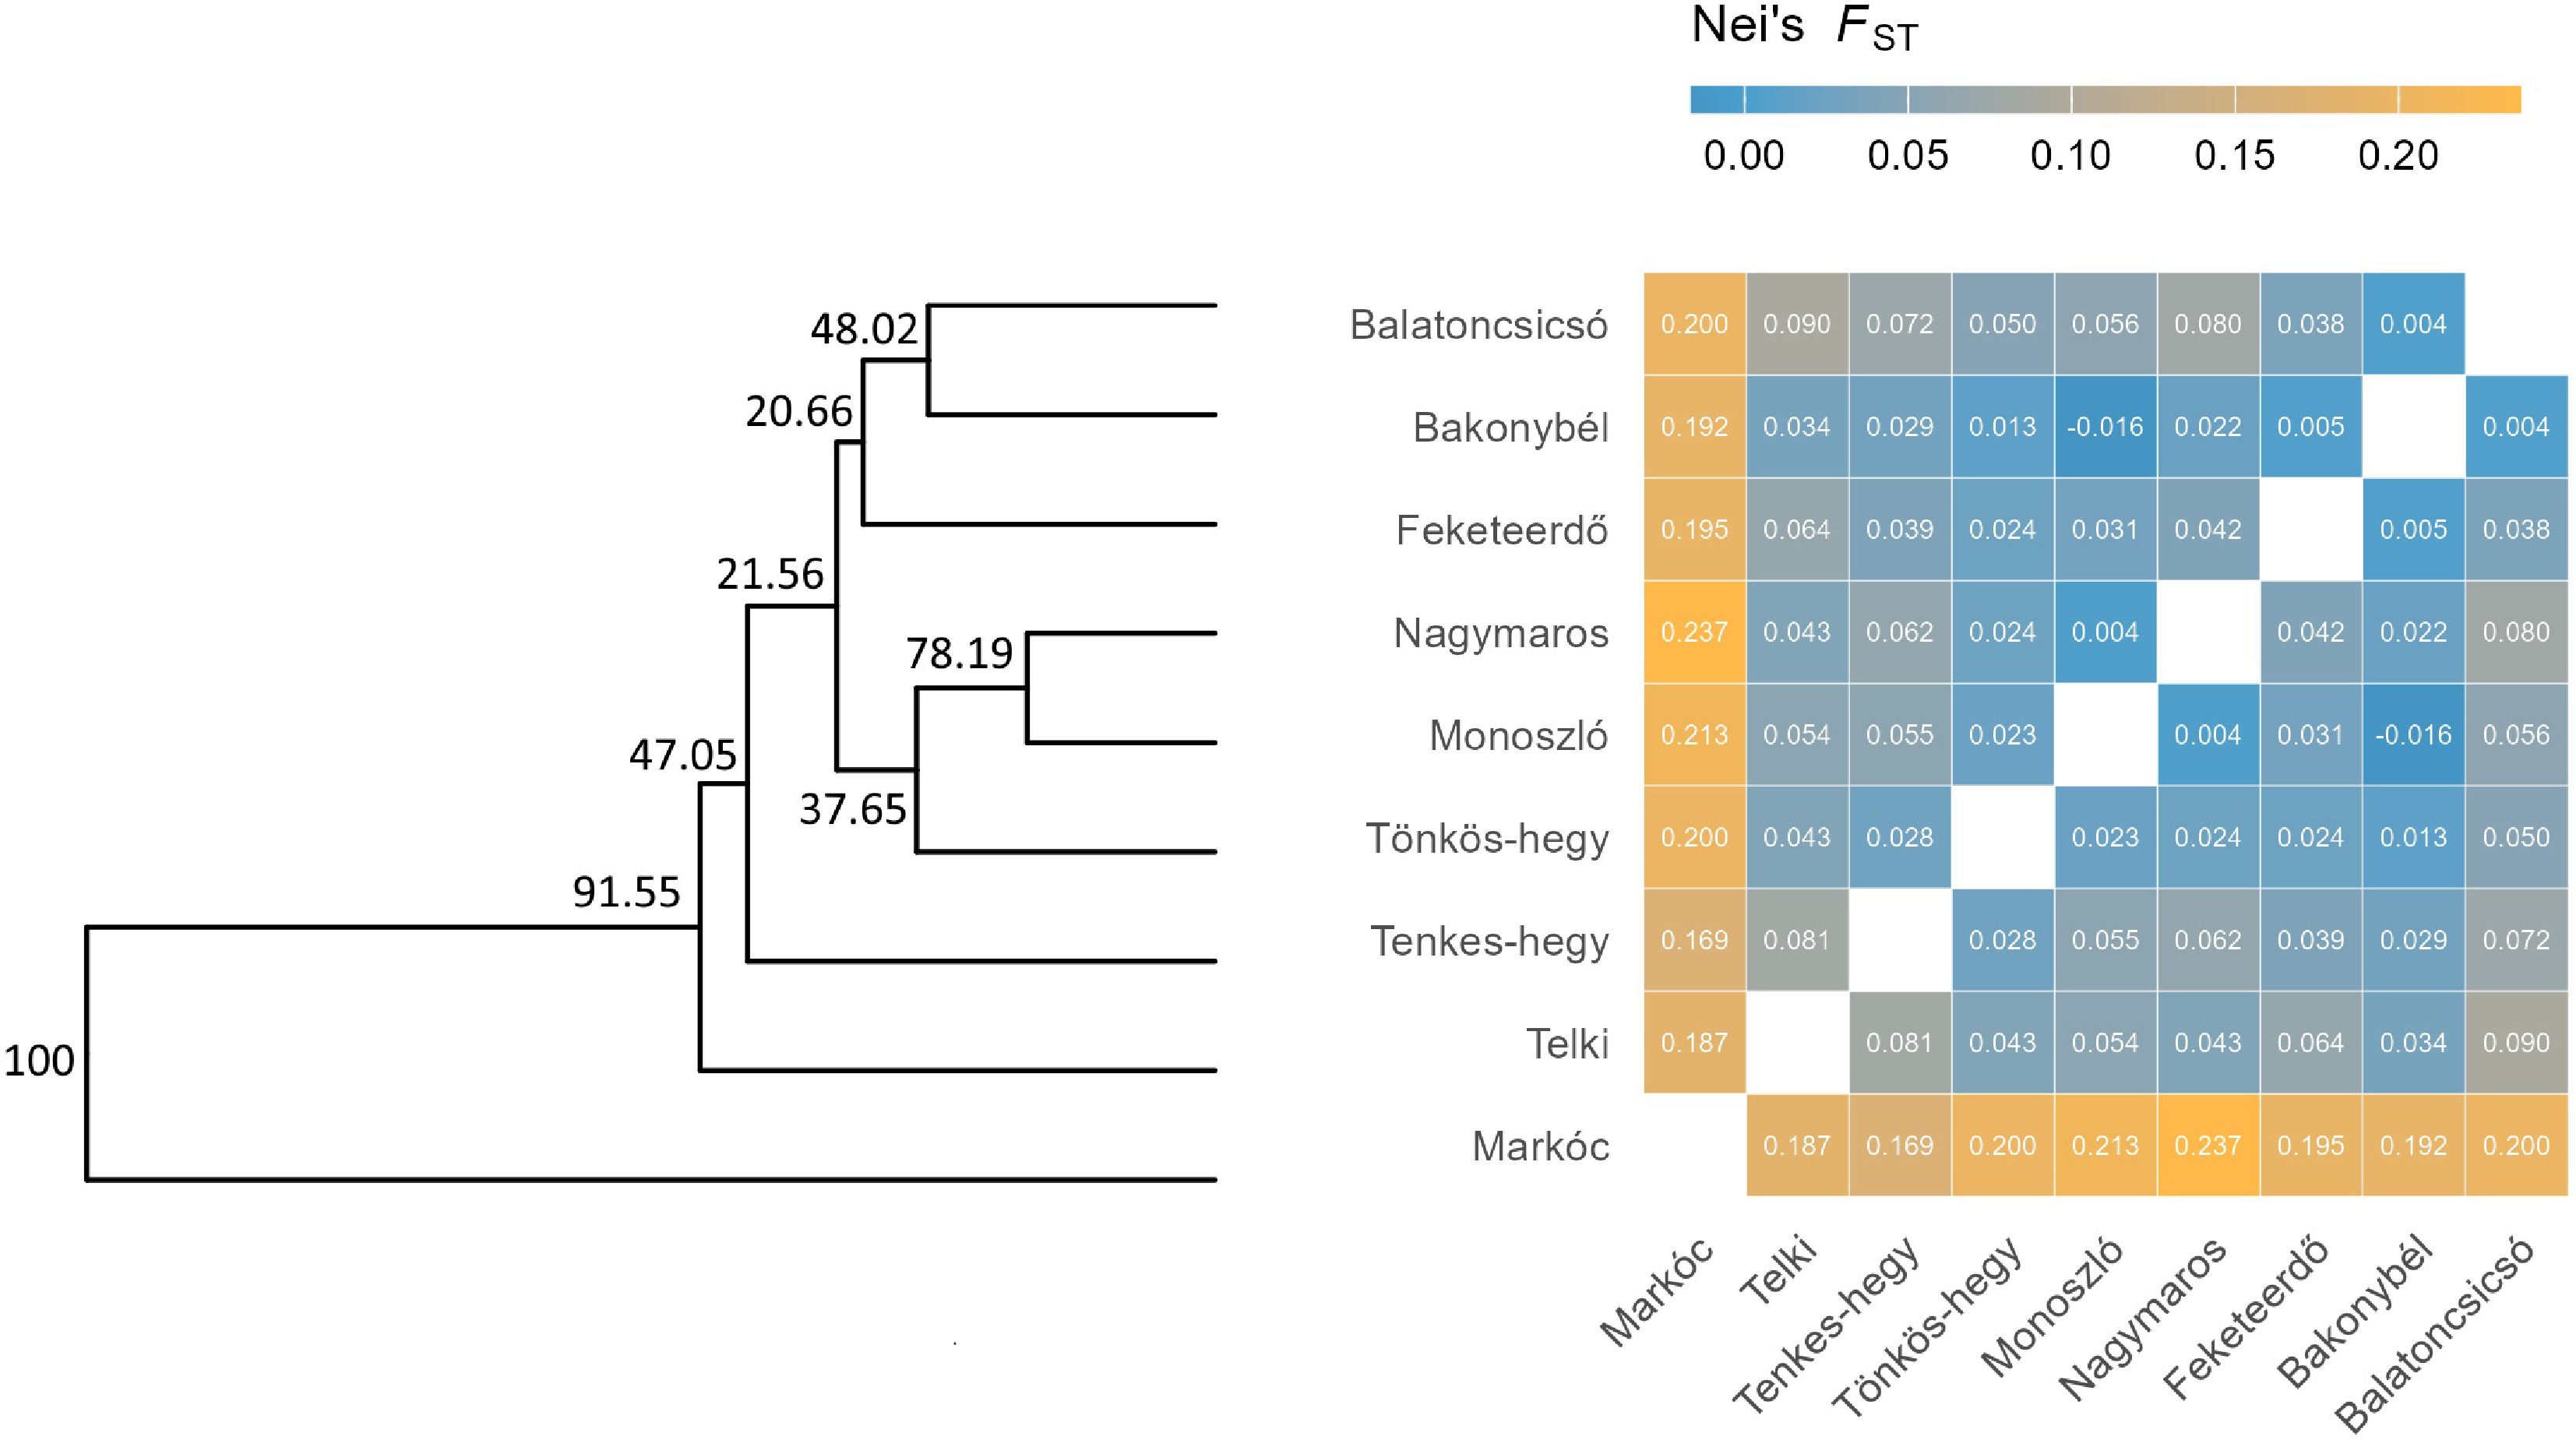
Figure 5.
UPGMA dendrogram and Nei's FST heatmap for Hungarian C. mas populations. The dendrogram (left) shows hierarchical clustering based on genetic distances, with bootstrap values indicating branch support. The heatmap (right) displays pairwise Nei's FST values, where color intensity reflects the degree of genetic differentiation (blue = low, orange = high). Higher FST values (> 0.18) indicate strong differentiation, while lower values (< 0.05) suggest closer genetic relationships among central populations.
Within the central cluster, Balatoncsicsó, Bakonybél, and Feketeerdő exhibit close genetic relationships, while Nagymaros, Monoszló, and Tönkös-hegy form another closely related group. Nei's FST heatmap confirms these patterns. Markóc displays the highest pairwise FST values (0.187–0.237), reinforcing its genetic distinctiveness. Populations within the main cluster exhibit lower FST values (0.004–0.136), suggesting ongoing gene flow or shared ancestry. The overall range of FST values (0.004–0.237) indicates moderate to high genetic structure across the dataset. These results highlight pronounced isolation of Markóc, moderate differentiation of Telki, and relatively low differentiation among the remaining populations.
Analysis using STRUCTURE v2.3.4 identified four genetic clusters (K = 4) as the most likely scenario based on the Evanno method (ΔK peak at K = 4). The barplot (Fig. 6) shows that individuals from Markóc are almost entirely assigned to a single cluster, confirming strong genetic isolation. Similarly, individuals from Tenkes-hegy form another cluster with a more admixed genetic makeup. The 3rd cluster is composed of individuals from Balatoncsicsó and Bakonybél, the latter being more admixed. The rest of the samples form a big admixed group, indicating constant gene flow. Overall, the STRUCTURE results corroborate the presence of one highly distinct population, and two genetic clusters partially overlapping with the rest of the populations.
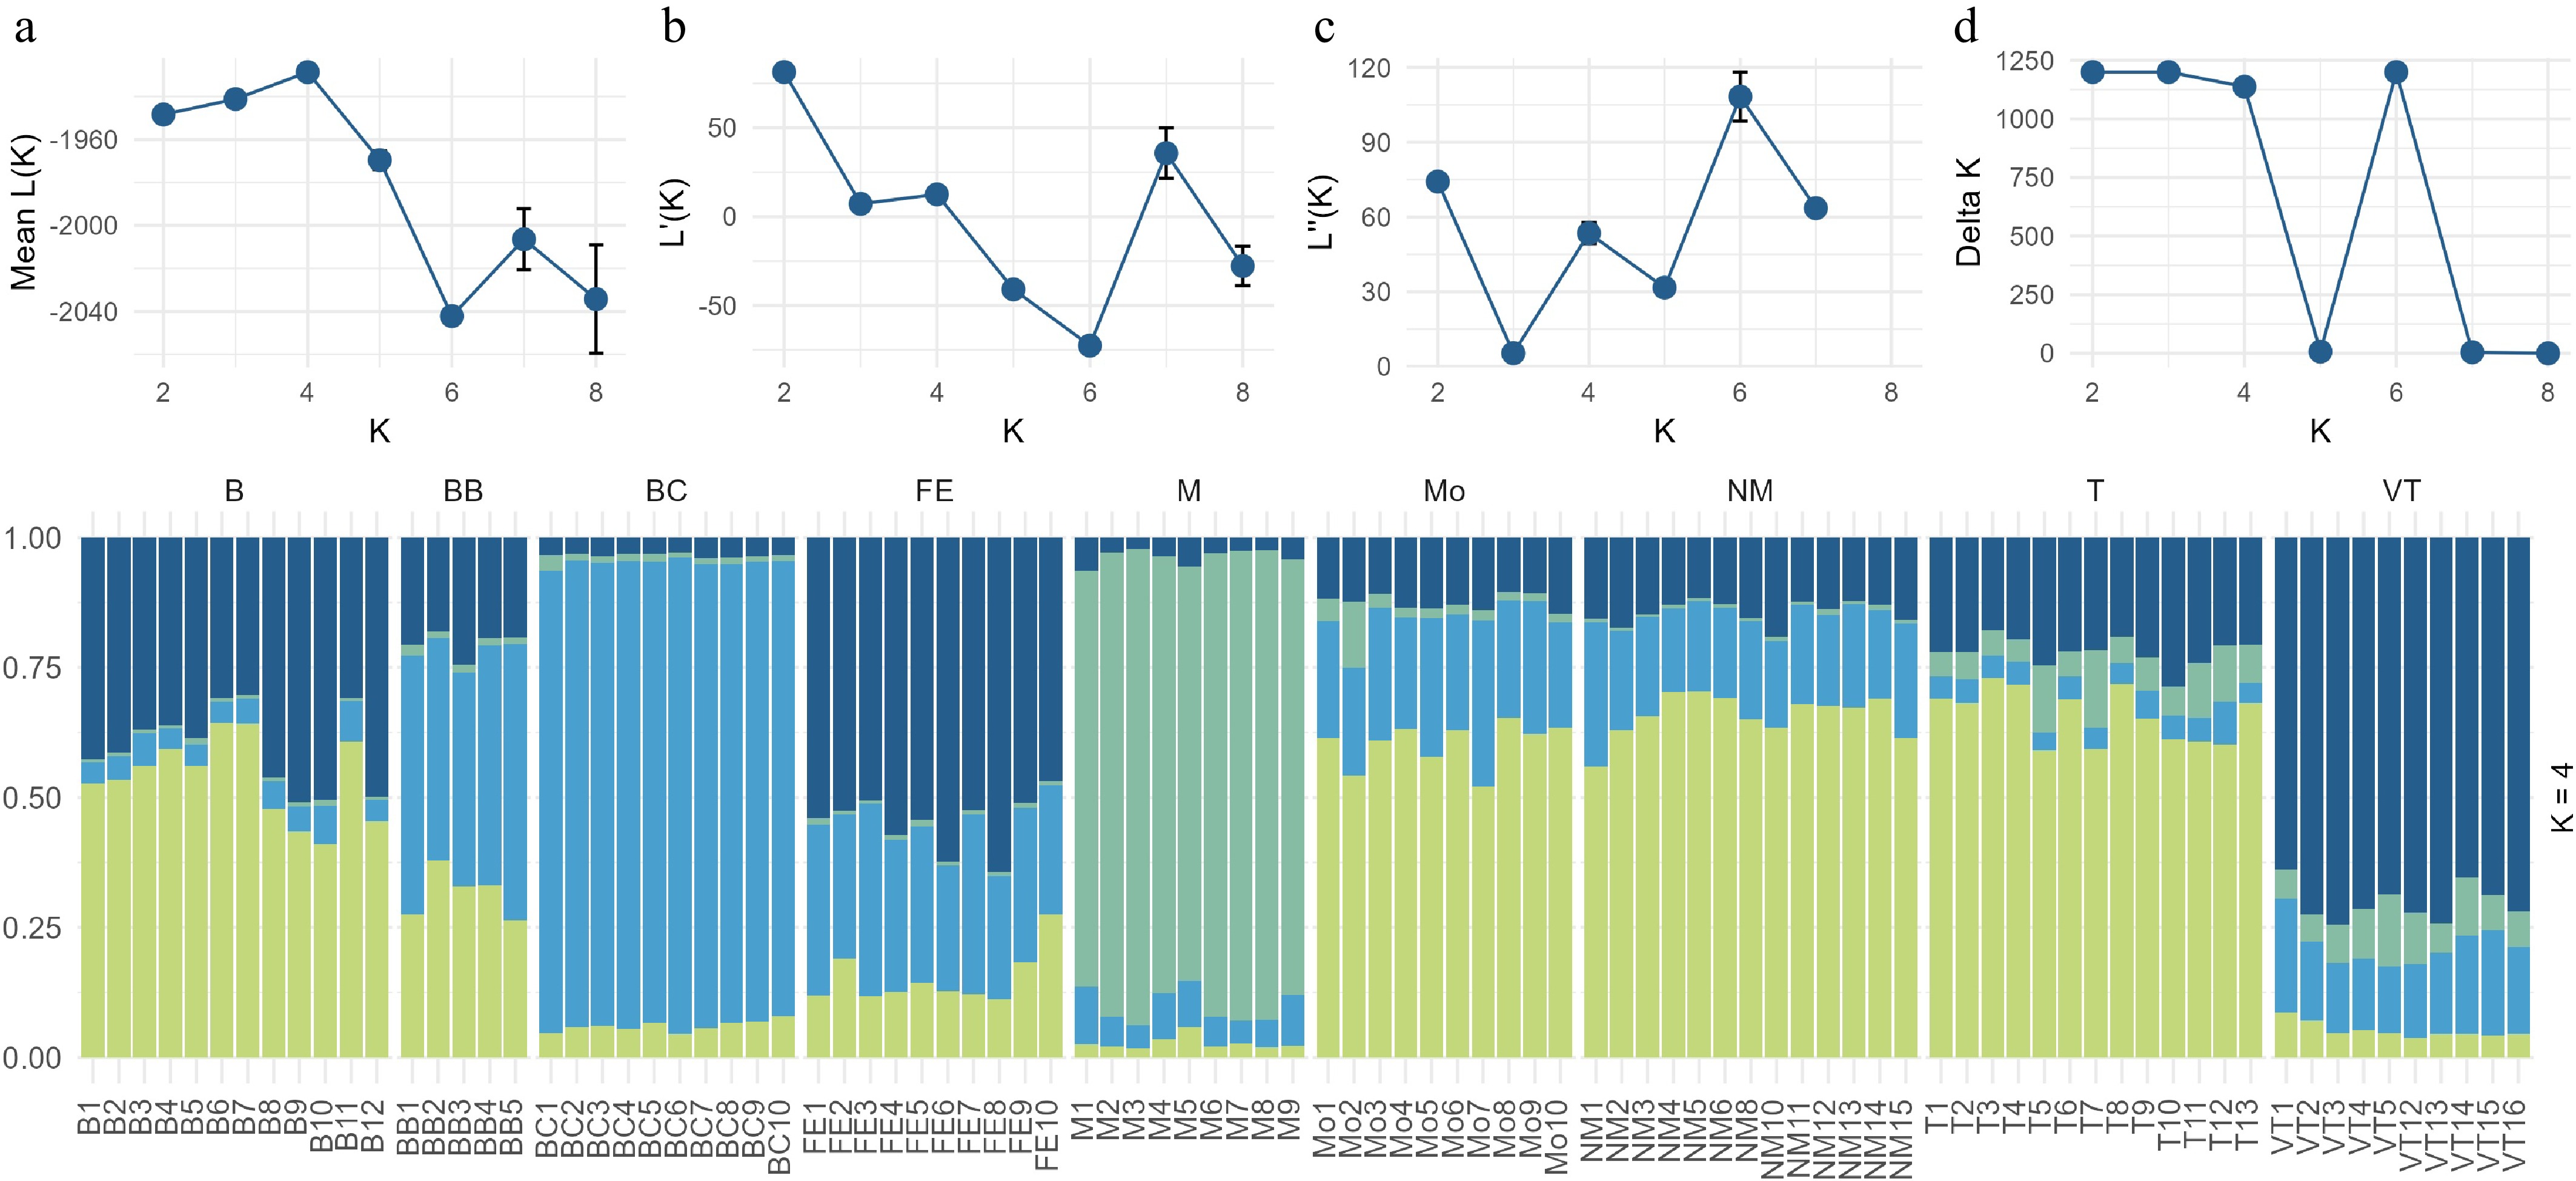
Figure 6.
Analysis of Hungarian cornelian cherry populations using STRUCTURE v2.3.4. Top: Model choice metrics for K = 2–8, including (a) mean log-likelihood, (b) its standard deviation, (c) second-order rate of change, and (d) ΔK, indicating K = 4 as optimal. Bottom: Barplot of individual assignment probabilities for K = 4. Each vertical bar represents an individual, and colors indicate membership proportions in each genetic cluster.
-
This study provides the first comprehensive assessment of genetic diversity in C. mas populations in the Hungarian part of the species' native Central European range using SSR markers. Analysis of individuals from nine localities across six loci revealed substantial genetic variation both within and among populations, providing a strong foundation for breeding programs aimed at developing locally adapted cultivars and underscoring the ecological significance of this species in Central Europe. Although the use of only six SSR markers imposes some limitations on resolving very fine-scale population structure, these markers nevertheless provided sufficient power to detect meaningful patterns of genetic diversity and differentiation.
The high genetic diversity observed here is consistent with the species' biology as a cross-pollinated, long-lived woody plant and with previous SSR-based work on C. mas. Studies involving SSR loci for distinguishing cultivars reported substantial allelic richness and clear genetic structure, confirming the suitability of these markers for discrimination and diversity assessment[19]. Cross-species transfer tests and species-specific SSRs further demonstrated that marker origin strongly influences informativeness in C. mas, as species-specific loci generally outperformed those derived from other Cornus taxa[17]. In line with these findings, the least informative locus in our panel (CF55) originated from C. florida[17], whereas the C. mas–specific primers were markedly more polymorphic.
Besides SSRs, reports based on other marker systems (RAPD/ISSR) also describe a high polymorphism in C. mas across its range, reinforcing the view that wild gene pools harbor extensive variation[10−13]. Natural populations are known to display considerable genetic and morphological variability, including the stable genotype polymorphism[4] reflected in traits such as fruit shape, mass, color, and ripening time[30]. Our SSR-based results fit well within this broader picture of pronounced diversity across the species' native range. Similar patterns have been reported in Serbian populations, supporting the notion that C. mas exhibits wide genetic diversity throughout its natural range[6]. Regionally, patterns of moderate differentiation and occasional strong divergence in geographically peripheral groups have also been documented in the Balkans, in Bosnia and Herzegovina[31], which is consistent with the divergent signal we detected for the Markóc population.
Our molecular analyses confirm that most genetic variation resides within individuals rather than between populations, a pattern typical of outcrossing species, as also evidenced by the AMOVA, which showed that the vast majority of variance occurred within individuals rather than among populations (FST = 0.077). Comparable findings were reported in Bosnian populations, where only 8% of the total genetic variation occurred between individuals and 3% between groups[31]. Nevertheless, our results reveal notable population differentiation, particularly for geographically isolated groups. The Markóc population exhibited the highest pairwise FST values and formed a distinct cluster in both DAPC and STRUCTURE v2.3.4 analyses, suggesting historical isolation. Telki also showed moderate differentiation, while other populations displayed an admixture, indicating ongoing gene flow. These patterns mirror the observations regarding other regions, where distant populations such as Mostar and Zenica exhibit the greatest genetic divergence[31].
Multivariate and clustering analyses revealed a clear population structure. DAPC highlighted the pronounced differentiation of Markóc, which formed a distinct cluster with no overlap with other groups. STRUCTURE v2.3.4 analysis corroborated this finding, identifying four genetic clusters (K = 4) and assigning Markóc individuals almost exclusively to a single cluster. The high pairwise FST values (0.187–0.237) further confirm the genetic isolation of the Markóv population, likely reflecting its historical separation and its position outside the main Hungarian distribution range. Telki formed an early split in the UPGMA dendrogram, while most other populations exhibited partial admixture and low FST values (< 0.05), suggesting ongoing gene flow or shared ancestry.
The presence of admixture in populations such as Bakonybél, Feketeerdő, and Balatoncsicsó indicates connectivity within the central cluster, which may result from pollen-mediated gene flow or historical population continuity. These findings have practical implications: populations with high genetic diversity and admixture could serve as valuable sources for breeding programs, while isolated populations such as Markóc may harbor unique alleles important for conservation.
Marker performance varied among loci; CF55 yielded the fewest alleles, as expected because it was developed for C. florida[17], whereas the other five primers were species-specific and more informative for C. mas. Despite this limitation, the overall marker set provided sufficient resolution to distinguish all sampled individuals and detect a fine-scale population structure. From an applied perspective, admixed central populations with high diversity constitute valuable sources for breeding and selection, while isolated populations such as Markóc may harbor unique alleles relevant for conservation and for maintaining adaptive potential under environmental change.
-
In summary, Hungarian cornelian cherry populations maintain considerable genetic diversity and exhibit a moderate to high genetic structure. The identification of distinct and admixed clusters highlights the importance of conserving both isolated and interconnected populations to preserve the species' genetic resources. Future studies should expand sampling across the species' range and incorporate additional molecular markers to refine our understanding of its evolutionary history and inform breeding strategies.
This study was financed by the Flagship Research Groups Program of the Hungarian University of Agriculture and Life Sciences. We are grateful to Tamás Lantos for his support in the course of the sample collection. We thank the Szent Mauríciusz Monastry in Bakonybél for allowing us to collect samples from their garden.
-
The authors confirm their contributions to the paper as follows: study conception and design: György Z; data collection: Behán T, Kovács S, György Z; analysis and interpretation of the results: Behán T, Tóth EG, György Z; draft manuscript preparation: Behán T, György Z. All authors reviewed the results and approved the final version of the manuscript.
-
The datasets generated and/or analyzed during the current study are available from the corresponding author on reasonable request.
-
The authors declare that they have no conflict of interest.
- Copyright: © 2026 by the author(s). Published by Maximum Academic Press, Fayetteville, GA. This article is an open access article distributed under Creative Commons Attribution License (CC BY 4.0), visit https://creativecommons.org/licenses/by/4.0/.
-
About this article
Cite this article
Behán T, Kovács S, Tóth EG, György Z. 2026. Genetic diversity of natural cornelian cherry (Cornus mas L.) populations based on SSR markers. Fruit Research 6: e027 doi: 10.48130/frures-0026-0021 

Genetic diversity of natural cornelian cherry (Cornus mas L.) populations based on SSR markers
- Received: 02 December 2025
- Revised: 11 May 2026
- Accepted: 21 May 2026
- Published online: 17 July 2026
Abstract: In this study, we provide a comprehensive assessment of the genetic diversity and population structure of cornelian cherry (Cornus mas) using six simple sequence repeat (SSR) loci across nine Hungarian localities. All loci amplified successfully, producing 79 alleles with an average of 13.17 alleles per locus, indicating high polymorphism. Except for one locus, all others showed polymorphic information content (PIC) values > 0.70, demonstrating their high informativeness for a genetic analysis of the population. The observed and expected heterozygosity ranged from 0.359 to 0.891 and from 0.381 to 0.884, respectively, suggesting substantial genetic variation and approximate Hardy–Weinberg equilibrium. Multivariate analyses showed a moderate population structure: principal coordinate analysis and a discriminant analysis of principal components consistently distinguished the Markóc population as a distinct genetic cluster, while showing the other populations to have a partial overlap, indicating gene flow. The unweighted pair-group method with an arithmetic mean and Nei's FST values of 0.004–0.237, respectively, confirmed the strong isolation of the Markóc population, moderate differentiation of the Telki population, and low differentiation among North-Transdanubian populations. Analysis using the software STRUCTURE v2.3.4 supported four genetic clusters (K = 4), including one highly distinct population and three admixed groups. These findings highlight a significant genetic diversity within Hungarian C. mas populations and emphasize the importance of conserving both isolated and interconnected populations to maintain genetic resources for future breeding programs.
-
Key words:
- Cornelian cherry /
- Fruit /
- Genetic diversity /
- Microsatellites /
- Natural /
- Population