


-
Genomic evolution plays a fundamental role in speciation, encompassing changes in species' diversity, genetic variation, and adaptation throughout evolutionary processes[1]. It encompasses multiple facets, including changes in genome size, gene rearrangements, variations in gene sequences, regulatory changes in gene expression, and alterations in genes' function and structure[2]. These molecular changes not only influence the genetic composition of populations but also play a crucial role in their ecological interactions and adaptation to dynamic environments[3]. The rapid evolution of the genome underpins the emergence of numerous new species and traits[4], thus constituting a pivotal focus in the study of speciation.
Structural variations (SVs) drive genomic evolution, fostering evolutionary changes through diverse mechanisms. Firstly, SVs can entail changes in chromosome numbers, such as deletions, duplications, insertions, or inversions, potentially impacting the genome's stability and function[5]. Secondly, they may alter genes' sequence or position on chromosomes, thereby influencing gene expression patterns and regulation[6]. Moreover, chromosomal SVs may provoke imbalanced recombination between chromosomes, leading to chromosomal instability and aberrant genetic phenomena like chromosome breakage and rearrangement[7]. Sex chromosome sequence disparities constitute a prominent feature underlying sex differences, and variations in sex chromosomes can contribute to alterations in sexual dimorphism[8]. Through mechanisms such as chromosomal rearrangement and the translocation of sex-linked genes, SVs contribute to the development of sex-specific traits[9,10]. Additionally, new genes may arise from sequence insertions, duplications, or transposon variations, contributing novel functions or expression patterns[11]. Nevertheless, direct evidence linking specific SVs to the divergence of species-specific traits remains scarce, underscoring the need for functional studies that clarify how SVs contribute to phenotypic differentiation.
Sexual dimorphism is widespread across the tree of life, largely arising from ongoing sexual conflict[10,12]. In many sexually reproducing species, females and males invest different resources in various biological processes, such as metabolism, reproduction, and rearing offspring. These differences are precursors to the emergence of sexual conflict[13]. Due to the numerical disparities between males and females, sex chromosomes can recruit autosomal genes to induce sex-biased expression, thereby alleviating sexual conflict[8,14]. The unique presence of the Y chromosome in males provides a potential mechanism for genes located on it to achieve male-specific expression. A recent study has found that the transfer of a gene to the Y chromosome can help alleviate conflicts related to sexual dimorphism in body size, indicating the significant contribution of the Y chromosome in resolving sexual conflict[8]. However, recombination suppression and the enrichment of sequence mutations often result in an abundance of transposons on the Y chromosome[15]. This factor makes the assembly of the Y chromosome extremely difficult and, consequently, impedes research into the relationship between Y chromosome genes and sex-biased genes.
Seed beetles are a classic model for studying sexual selection and sexual conflict, with nine autosomes and a typical XY sex-determination system[12,16]. There are notable trait variations among different seed beetles, encompassing diverse dietary habits, physical attributes, and expression of sex pheromones[17,18]. Moreover, distinct sexual dimorphisms are observed across various seed beetle species, implying potential differences in sexual conflict. For instance, in C. chinensis, antennal morphology differs between males and females, whereas in C. maculatus, no such distinction in antennal shape exists between the sexes[19]. The seed beetle C. maculatus is considered a classic model for studying sexual conflict, including reproductive characteristics[20] and body size differences[21]. In summary, the pervasive sexual dimorphism observed across Bruchinae species provides the possibility of studying sexual conflicts and genomic evolution. However, due to the current scarcity of comprehensive genome resources in seed beetles[8,22−24], studying the seed beetles' traits and sexual conflict through comparative genomic methods remains challenging.
In this study, we assembled the chromosome-level assemblies of three seed beetle species: A. obtectus, C. chinensis, and C. maculatus. Utilizing whole-genome sequencing data from both male and female samples, we successfully identified their X and partial Y chromosomes. Comparative analyses revealed a striking landscape of extensive and large-scale genome rearrangements within the Bruchinae family. Through a comparative analysis of Bruchinae family genomes, this study reveals that SVs are associated with genomic features in multiple dimensions, including sex chromosome differentiation and the dynamic changes in sex-biased gene expression. These findings underscore the role of SVs in speciation and enhance our understanding of the genetic mechanisms shaping biological diversity.
-
The C. chinensis populations were collected from Shijiazhuang, Hebei Province, in China. The C. maculatus populations were collected from Beijing in China. The A. obtectus populations were collected from Qujing, Yunnan Province, in China. All insects were reared at room temperature (25–28 °C) in Beijing and established stable laboratory colonies. C. chinensis, C. maculatus, and A. obtectus were nurtured with mung bean, red bean, and white kidney bean, respectively.
Genomic DNA isolation and sequencing
-
Genomic DNAs of seed beetles were extracted and purified from adult insects. DNA libraries for short-read sequencing were prepared and sequenced on the DNBseq-T7 platform (MGI Tech Co., Ltd., Shenzhen, China). Raw reads were filtered to remove low-quality bases and sequencing adaptors using Trimmomatic (v0.39)[25]. For long-read sequencing, libraries were prepared following the protocol provided for the SQK-LSK109 library preparation kit (Oxford Nanopore Technologies [ONT], Oxford, UK). DNA quantification was performed using Qubit (v4.0) (Invitrogen). Subsequently, the libraries were sequenced on an Oxford Nanopore PromethION flow cell.
High-throughput chromosome conformation capture (Hi-C) library preparation and sequencing
-
Using whole bodies of adult male insects, we constructed an Hi-C library of seed beetles. Briefly, genomic DNA was extracted and purified, then digested with 100 units of DpnII and marked through incubation with biotin-14-dATP. The ligated DNA was subsequently sheared into 300–600-bp fragments, followed by end-repair, A-tailing, and purification of the DNA fragments. Finally, the Hi-C libraries were quantified and sequenced using the DNBseq-T7 platform (MGI Tech Co., Ltd., Shenzhen, China).
RNA library preparation, sequencing, and data processing
-
Using TRIzol reagent (Thermo Fisher Scientific, Waltham, MA, USA), the total mRNA of different tissues was extracted from 15 adult samples. RNA-Seq libraries were then prepared, and paired-end sequencing (at least 6 G per sample) was conducted on the DNBseq-T7 platform (MGI Tech Co., Ltd., Shenzhen, China) provided by Annoroad Genomic Company. RNA sequencing from different tissues were mapped to genomes using HISAT2 (v2.2.1)[26] (--min-intronlen 20 --max-intronlen 600000 --fr -x), using the SAMtools tool to generate BAM files. FeatureCounts (v2.0.1)[27] was used to count expression reads in each gene, and reads counts between different library were normalized to transcripts per kilobase per million mapped reads (TPM) for comparison. To measure expression divergence, we computed the Euclidean distances following the formulas previously described[28]. RNA-Seq libraries of Tribolium castaneum were collected from public databases (SRR14070860, SRR14070861, SRR14070872, SRR14070873, SRR19548808, SRR19548809, SRR19548810, and SRR19548811).
Genome assembly and annotation
-
De novo assembly with NextDenovo (v2.4.0)[29] using the default settings gave the initial assembly of contigs. The NextDenovo assembly was polished with two rounds of Pilon (v1.24)[30] using 150-bp paired-end reads (~162, 134, and 292 coverage of the C. chinensis, C. maculatus, and A. obtectus genomes). For the highly heterozygous seed beetles' genomes, we used purge haplotigs[31] to reduce the heterozygosity. Finally, we used Hi-C data (~224, 293, and 76 coverage of the C. chinensis, C. maculatus, and A. obtectus genomes) and assembled the polished contigs into chromosomes using the standard process of ALLHIC (v0.9.8)[32]. We visualized the Hi-C matrix with Juicebox (v1.11.08)[33] and adjusted the order and orientation of contigs manually.
RepeatModeler (v2.0.1)[34] with the default parameters was used to generated the custom transposable element (TE) libraries of three genomes. The repetitive sequences in genomes were annotated by RepeatMasker (v4.0.9) (
www.repeatmasker.org ) using custom TE libraries. To gain deeper insights into the evolutionary history of the TE sequences, we estimated their insertion times in three seed beetles using a Kimura distance-based analysis with the parseRM pipeline.For de novo prediction, we utilized RNA-Seq alignments in BAM files to train the AUGUSTUS (v3.4.0)[35] gene prediction tool via BRAKER (v2.1.4)[36]. Importantly, we imported the protein-coding sequences of C. chinensis, C. maculatus, and A. obtectus into miniport (v0.11)[37] with the parameter '-I600kb --gff' to generate gene structures based on orthologous evidence. In the transcriptome-based prediction, raw reads underwent filtering by Trimmomatic (v0.39). These filtered reads were subsequently aligned to the genome assembly using HISAT2 (v2.2.1)[26] to determine the transcript positions and extract transcript sequences using StringTie (v2.2.1)[38]. Next, we mapped the extracted transcript sequences to the genomes using PASA (v2.4.1)[39]. Additionally, TransDecoder (v5.5.0) (
https://github.com/TransDecoder/TransDecoder ) was employed to generate gene predictions using PASA-extracted transcripts. Finally, we integrated gene predictions from the three methods using EVidenceModeler (v2.1.0), assigning weights for each method (AUGUSTUS, 2; TransDecoder, 3; Miniport, 8; PASA, 10;). The parameters used were: '--segmentSize 1000000 --overlapSize 100000'.Identification of orthologous proteins
-
To maximize the identification of orthologous protein pairs between species, we employed BLAST to search for sequence relationships between proteins from two species. For each gene alignment, we selected the orthologous gene with the lowest E-value in the comparison, using one species as a reference.
To identify orthologous protein relationships between the Y chromosome and autosomes within the species, we utilized the Y chromosome's protein sequence as a reference. Using BLAST, we searched for autosomal protein with the lowest E-value to the Y-linked protein and subsequently calculated the sequence identity between them.
Phylogenetic tree construction and estimation of species divergence time
-
Eight coleopteran species (Pachyrhynchus sulphureomaculatus, Pyrochroa serraticornis, T. castaneum, Propylea japonica, Rhagonycha fulva, Pogonus chalceus, T. confusum, and T. freemani) and our three genomes, with Drosophila melanogaster as an outgroup, were selected, and their longest transcripts were extracted for ortholog inference using OrthoFinder (v2.5.4)[40]. Subsequently, MAFFT (v7.508)[41] was employed for sequence alignment of the resulting single-copy orthologous genes. Gblocks (v0.91b)[42] was utilized to extract conserved sites with the parameters '-b4 = 5 -b5 = h -t = p' for inference of the phylogenetic tree. The best-fitting model (Q. insect + F + I + I + R5) was determined by the ModelFinder program implemented in IQ-TREE (v2.2.0.3)[43] based on the Bayesian information criterion and ultrafast bootstrap approximation with 1,000 replicates. Divergence time was estimated using MCMCTree, a tool within the PAML (v4.9)[44] package. The calibration information of fossil nodes was obtained from the Timetree website.
Coverage and synteny analyses
-
We mapped whole-genome sequencing reads from female and male individuals to the assemblies using the aln function of bwa (v0.7.17-r1188). Alignments were filtered for uniquely mapped reads, and average chromosome coverage was calculated using bedtools with 100-kb windows. The male to female fold change in the coverage of each chromosome was calculated to determine the X/Y chromosome.
To examine the degree of collinearity between species, we used MCscanX[45] to identify collinearity regions between different genomes. The syntenic blocks are defined as regions with a similar order of gene distribution in different genomes, comprising at least five genes (-s 5). We extracted 1367 BUSCO loci (insect v10) coordinates to calculated the gene order conservation (GOC) score using a common script[46]. The orthologous proteins identity (OPI) was calculated by average benchmarking universal single-copy ortholog (BUSCO) loci similarity between genomes.
Identification of evolutionary chromosomal SVs
-
Pairwise genome alignments were performed between different genomes using mummer (v4.0.0rcl)[47]. The sequencing similarity of collinearity regions was calculated by nucmer with custom parameters (--mum -l 10 -c 100 -d 10). The resulting alignments were then used as the input for SyRI (v1.6)[48] to identify chromosomal rearrangement events. For analysis between two genomes of C. maculatus, the chromosomal rearrangement events with a size of < 10 kb were filtered manually and the 1-kb region on the flank was considered to be the boundary of the chromosomal rearrangement event. For analysis of C. chinensis and C. maculatus relative to A. obtectus, the chromosomal rearrangement events with a size of < 50 kb were filtered manually. The subroutine plotsr (-H 8 -W 5) of SyRI was used for visualization.
We considered the 1-kb region surrounding the SVs' boundary as the breakpoint region of SVs. Specifically, we used 'bedtools flank' to extract the 1-kb regions flanking the left and right boundaries of SVs. For the control group, we used 'bedtools random' to randomly extract 10,000 regions from the genome, with each region being 1 kb in length.
Identification and evolutionary analysis of sex-biased genes
-
DESeq2 (v1.38.3)[49] was used to estimate differential gene expression between the sexes in different tissue samples. Genes with low read counts (= 0) in any samples would be filtered, and the read counts for the remaining genes were normalized on a log2 scale. Genes exhibiting a fold change of ≥ 1.5 in male-to-female expression were categorized as male-biased genes, while genes with a fold change of ≥ 1.5 in female-to-male expression were categorized as female-biased genes.
To visualize the impact of gene bias patterns on the genetic evolution rate, we assigned each pair of single-copy orthologous genes to one of seven bins with predefined ranges of log2 fold change (log2FC) in gene expression: extreme female bias (log2FC < –1), strong female bias (–1 ≤ log2FC < –0.59), moderate female bias (−0.59 ≤ log2FC < 0), moderate male bias (0 ≤ log2FC < 0.59), strong male bias (0.59 ≤ log2FC < 1), and extreme male bias (log2FC ≥ 1). Only gene families containing orthologous genes from both A. obtectus and C. chinensis/C. maculatus within the same box were assessed for their evolutionary rates from A. obtectus to C. chinensis/C. maculatus. Categorization was carried out separately based on the expression levels in the head, gut, and gonads. The evolutionary rate of orthologous sex-biased genes was calculated using ParaAT (v1.0)[50] with the default parameters.
Transcriptomic heterozygosity analysis
-
Variants were called from the BAM files of mapped RNA-Seq reads by the subroutine HaplotypeCaller of the Genome Analysis Toolkit UnifiedGenotyper (GATK) (v3.8)[51]. Variants were subsequently filtered to exclude those with Fisher strand values exceeding 20.0 or qual-by-depth values below 3.0 using VCFtools (v0.1.16)[52]. Finally, we used a custom script to summarize the number of heterozygous and homozygous single nucleotide polymorphism (SNP) loci on each chromosome.
X chromosome enrichment analysis
-
To identify the enrichment of sex-biased genes on the X chromosome of seed beetles, we used a method previously described[14]. Briefly, we counted the sex-biased genes on the X chromosome and compared them with the autosomes. Chromosomal counts of sex-biased and unbiased genes were tabulated, and a 2 × 2 contingency table was constructed to facilitate Fisher's exact test. This test was employed to assess deviations in the proportions of sex-biased and unbiased genes between the X chromosome and autosomes.
Gene translocation analysis
-
To identify the gene translocation events, we first used BLAST with the lowest E-value to search for orthologous genes between species. Next, we employed MCscanX to identify collinear genes across species. It was hypothesized that species-specific gene translocation events would not exhibit collinearity with other species, whereas the orthologous genes among the remaining species should maintain collinearity. Additionally, we utilized a custom script to exclude gene translocation events that were incorrectly identified due to tandem repeats. Finally, we manually filtered the remaining genes and obtained accurate gene translocation events.
-
To advance our understanding of genomic evolution in seed beetle species and enable comparative genomic analyses of previously inaccessible regions (e.g., the Y chromosome), we generated de novo genome assemblies for three diverse seed beetle species using long-read sequencing data. The first species we selected for sequencing is C. maculatus, which serves as a model species for studying insect evolution and has previously been assembled at the contig level[12]. We generated 2.5 million high-fidelity (HiFi) reads, resulting in a total of 44.6 Gb of raw sequencing data, corresponding to approximately 38-fold coverage of its estimated genome size (1,107 Mb). We assembled the HiFi reads using hifiasm and obtained a consensus genome assembly of 1,153 Mb with contig N50 up to 13.1 Mb. Additionally, we assembled de novo the genomes of two other seed beetle species, C. chinensis, and A. obtectus, to expand our understanding of the genome's evolution within the Bruchinae family. For these two species, we generated 21.3 and 1.3 million Oxford Nanopore Technology (ONT) ultra-long reads (90.6 and 25.7 Gb), corresponding to approximately 143-fold and 28-fold genome coverage of their estimated genome sizes (642 and 866 Mb), respectively. We applied NextDenovo to assemble the ONT long reads, resulting in assemblies of 633 Mb for C. chinensis and 917 Mb for A. obtectus, with contig N50s of 3.6 and 4.2 Mb, respectively. These contig-level assemblies were further polished with paired-end short reads and anchored using Hi-C interaction reads to generate the chromosome-scale genome assemblies of the three species. Approximately 99.5%, 91.6%, and 99.36% of the assembled contigs were placed into 11 pseudo-chromosomes for the seed beetles C. chinensis, C. maculatus, and A. obtectus, respectively (Fig. 1a and Supplementary Fig. S1a).
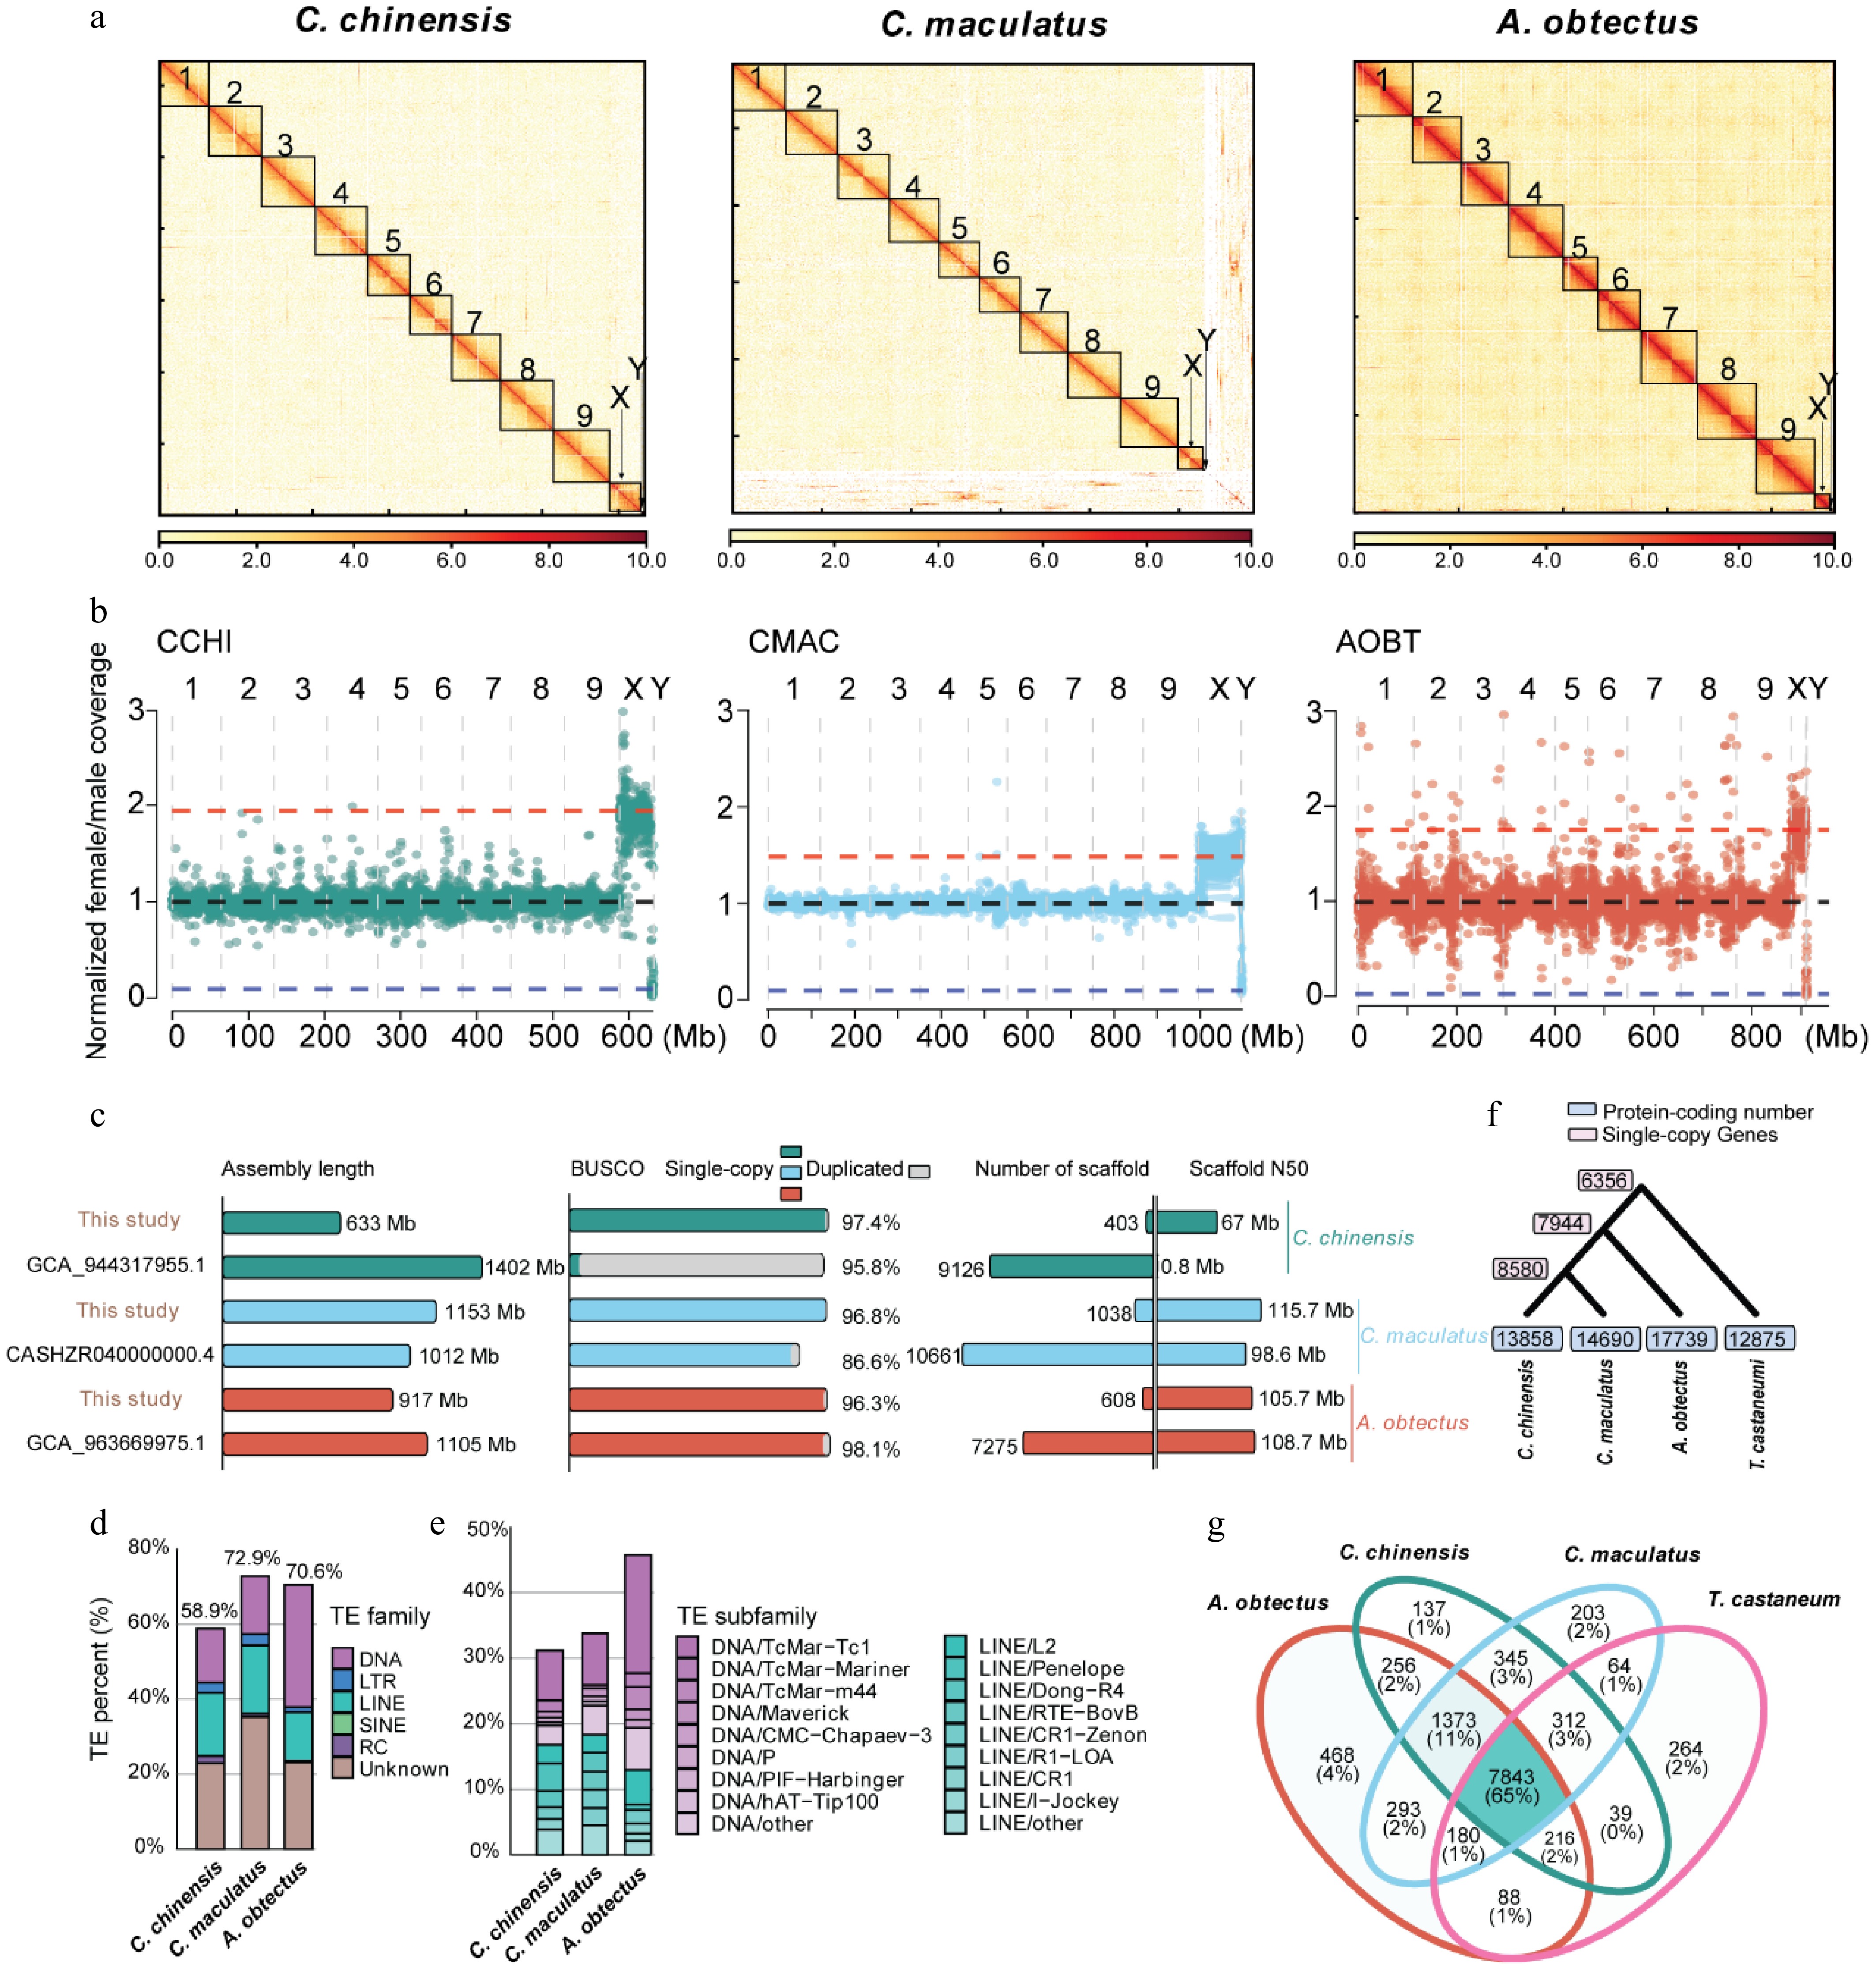
Figure 1.
Genome assembly and annotation of C. chinensis, C. maculatus, and A. obtectus. (a) Hi-C contact maps of the C. chinensis, C. maculatus, and A. obtectus genome assembly. Black boxes denote putative chromosomes. White indicates the weakest scaffold interaction, while red indicates the strongest interaction. (b) Normalized female/male whole-genome sequencing coverage over the three seed beetle species's genome assemblies. Each point represents a 100-kb window. Blue, black, and red horizontal lines indicate the expected coverage over Y-linked, autosomal, and X-linked scaffolds, respectively. (c) Comparison of genome assembly parameters with previously published genomes for the three seed beetle species. (d) Repeat landscape of the three seed beetle species' genomes. (e) Landscape of the subfamily of DNA transposons and long interspersed nuclear element (LINE) transposons of the three seed beetle species' genomes. (f) Phylogenetic trees and gene number of three seed beetle species and the model species T. castaneum. (g) Comparative analysis of orthologous families from the three seed beetle species and the model species T. castaneum.
During the preparation of this manuscript, genome assemblies of the three seed beetles have been published or released[22−24,53]. Compared with the previous version of C. chinensis[53], the number of contigs in the current assembly has been drastically reduced from 9,126 to 403, and the contig N50 has increased from 0.8 to 67 Mb. Furthermore, the genome size has been reduced from 701 to 633 Mb by removing the redundancy between haplotypes in the current assembly. The current assembly of C. maculatus is similar to the latest genome of C. maculatus[23] (Fig. 1c and Supplementary Table S1). Additionally, it exhibits strong chromosomal correspondence with previously assembled versions (Supplementary Fig. S2). Similarly, the current assembly of A. obtectus is similar to the previous version[22] in terms of genome size and contig N50, but it demonstrates improved contiguity (Fig. 1c). The new genome assemblies of C. chinensis, C. maculatus, and A. obtectus also demonstrate high completeness in gene space, containing 97.4%, 96.8%, and 96.3% of the conserved Insecta benchmarking universal single-copy ortholog (BUSCO) genes (n = 1,367) as complete single copies, respectively (Fig. 1c and Supplementary Table S1). These high-quality seed beetle genomes allow us to pinpoint genomic changes among species with unprecedented precision.
Identification of sex chromosomes in three seed beetle species
-
To identify the sex chromosomes, we aligned the short-read DNA sequencing data obtained from both female and male samples to the assembled pseudo-chromosomes and calculated the female-to-male coverage ratio of each bin with a 100-kb sliding window. Cytological studies have indicated a correlation between the sex of seed beetles and the number of X and Y chromosomes[16], where females possess two X chromosomes and males have one X chromosome paired with one Y chromosome, resulting in an expected coverage ratio of the X chromosome in females of approximately 2:1 compared with males. In contrast, the ratio involving the Y chromosome should approach zero, as it is present only in males. Consistent with the cytological analysis, we observed a specific chromosome in each seed beetle that exhibits the expected coverage characteristic of an X chromosome along its entire length (Fig. 1b). Furthermore, these X chromosomes from the three seed beetles possess unique Hi-C matrices and exhibit sequence homology with each other (Supplementary Fig. S3).
Conversely, we found that the shortest scaffold in each seed beetle exhibits the expected coverage pattern of the Y chromosome, with the female-to-male coverage ratio being almost zero (Fig. 1b and Supplementary Fig. S4). Each scaffold is composed of multiple contigs. The presence of Hi-C signals between these contigs results in the formation of an independent Hi-C matrix unit, signifying a segment within the Y chromosome (Supplementary Fig. S4a, c). Building on previous studies that identified several Y-linked contigs in C. maculatus, we conducted a comparative analysis to assess the homology between the published Y-linked contigs and the Y chromosome sequence we assembled in C. maculatus. A high level of sequence conservation was observed between our identified Y chromosome and the previously published Y-linked contigs of C. maculatus, confirming the accuracy of our Y chromosome identification (Supplementary Fig. S4d–f). However, the Y chromosome of our genomes appears to be relatively smaller in size compared with the Y-linked contigs reported in a previous study[8]. In addition, we observed that the previously reported Y-linked contig CATOUR010000029.1 is located on chromosome 3 in our genome assembly (Supplementary Fig. S4e). Coverage analysis further supports that this region is part of the autosomal region rather than the Y chromosome (Supplementary Fig. S4e). Previous cytological experiments have revealed size variations in the Y chromosome among different populations of C. maculatus[16]. We proposed that the observed discrepancies in Y chromosome length suggest that our genome assembly of C. maculatus corresponds to a distinct population compared with the previously reported genome.
In summary, we identified the X and Y chromosomes in three seed beetles. For C. maculatus, we assembled an X chromosome of similar size to the previous version[23] through 11 contigs (56.0 Mb vs 47.3 Mb). As for A. obtectus and C. chinensis, we produced the first chromosome-level X chromosomes (29.8 and 40.7 Mb). Regarding the Y chromosome, the previous version of C. maculatus[8,12] only generated Y-linked contig fragments, whereas we utilized Hi-C signals to assemble a scaffold-level Y chromosome (3.9 Mb). Similarly, we also assembled the first scaffold-level Y chromosomes for A. obtectus and C. chinensis (1.9 and 3.6 Mb) (Supplementary Table S1). These newly assembled Y chromosomes offer improved genomic resources for investigating how the Y chromosome contributes to divergence among Bruchinae species.
Genome annotation of three diverse seed beetle species
-
Compared with the genomes of other Coleoptera species, a notable distinctive feature of the seed beetle genomes is their significantly higher content of repetitive sequences. Specifically, 58.9%, 72.9%, and 70.7% of the genomes in C. chinensis, C. maculatus, and A. obtectus, respectively, consist of repetitive sequences (Fig. 1d and Supplementary Tables S2–S4). In A. obtectus, DNA-type transposons (32.72%) constitute the largest proportion among all transposable element (TE) types in the genome (Supplementary Table S4). In contrast, both DNA transposons (14.28% and 16.04%) and LINE retrotransposons (16.85% and 18.93%) are prominent in C. chinensis and C. maculatus (Fig. 1e, Supplementary Tables S2, S3). This suggests that a lineage-specific amplification of LINEs may have occurred in the ancestral lineage leading to both C. chinensis and C. maculatus. The most abundant superfamily among DNA-type transposons is Tc1/Mariner, which accounts for 7.88% to 20.08% of the genomes of the three seed beetle species. The abundance of the LINE retrotransposons shows a relatively consistent distribution across superfamilies and species (Fig. 1e).
The predicted number of protein-coding genes is 13,858 for C. chinensis, 14,690 for C. maculatus, and 17,739 for A. obtectus, with an average coding sequence (CDS) length ranging between 1,297 and 1,529 bp (Fig. 1f and Supplementary Fig. S1b, c). Protein-coding genes that have functional annotations make up 72.7%, 71.5%, and 68.9% of the total predicted genes, respectively, for C. chinensis, C. maculatus, and A. obtectus. The completeness of the gene sets for the three seed beetle species was assessed using the Insecta BUSCO gene set (n = 1,367), with 93.8% to 95.2% of these genes identified as complete (Supplementary Table S1). Comparing the predicted genes with the T. castaneum genome[54] (Fig. 1g), we found a total of 7,843 (65%) orthologous families shared across all four species, and 1,373 (11%) orthologous families specific to the Bruchinea family. Additionally, we identified 7,944 strict single-copy genes among three seed beetle species; of them, 6,356 are also shared with T. castaneum (Fig. 1f). In summary, we generated high-quality gene annotations for these three seed beetle species and demonstrated that over half of the genes are conserved between Bruchinae and T. castaneum.
Extensive chromosomal rearrangements among the genomes in Bruchinae
-
To explore the structural differences in genomes of these three seed beetle species, we extended the comparative genomic analysis to eight species with varying divergence times within the Coleoptera family: P. sulphureomaculatus[46], P. serraticornis (GCA_963669975.1), T. castaneum[54], T. freemani (GCA_939628115.1), T. confusum (GCA_029207805.1), P. japonica[55], R. fulva (GCA_905340355.1), and P. chalceus[56], using D. melanogaster as the outgroup. A maximum likelihood phylogenetic analysis based on 1,397 single-copy orthologous genes allowed us to estimate that C. chinensis and C. maculatus split from their common ancestor approximately 30 million years ago (MYA), while A. obtectus diverged from the Callosobruchus genus around 56 MYA (Fig. 2a). The genome-wide synteny analysis across these species confirms the homologous relationships of the chromosomes and karyotypes among most Coleoptera insects (Fig. 2b), which is consistent with observations from earlier studies[46]. It is also established that the genomes of the three seed beetle species in the Bruchinae family retain synteny in both the autosome and X chromosome (Fig. 2b). However, extensive large-scale chromosomal rearrangements were observed between the Bruchinae species and other Coleoptera species, except for the X chromosomes, which exhibited widespread gene collinearity in all Coleoptera species examined (Fig. 2b and Supplementary Fig. S5a–e). For example, P. sulphureomaculatus, the phylogenetically closest species to Bruchinae in our study, displays a conserved karyotype with most Coleoptera species, except for those in Bruchinae (Supplementary Fig. S5a–e, h). We found that most genes located on the autosomes of A. obtectus have homologs in the genomes of all other Coleoptera species, but their genomic positions have changed (Supplementary Fig. S5f, g). These findings reveal that, despite the presence of most gene families in both Bruchinae and other Coleoptera species, gene synteny has largely decayed between these groups.
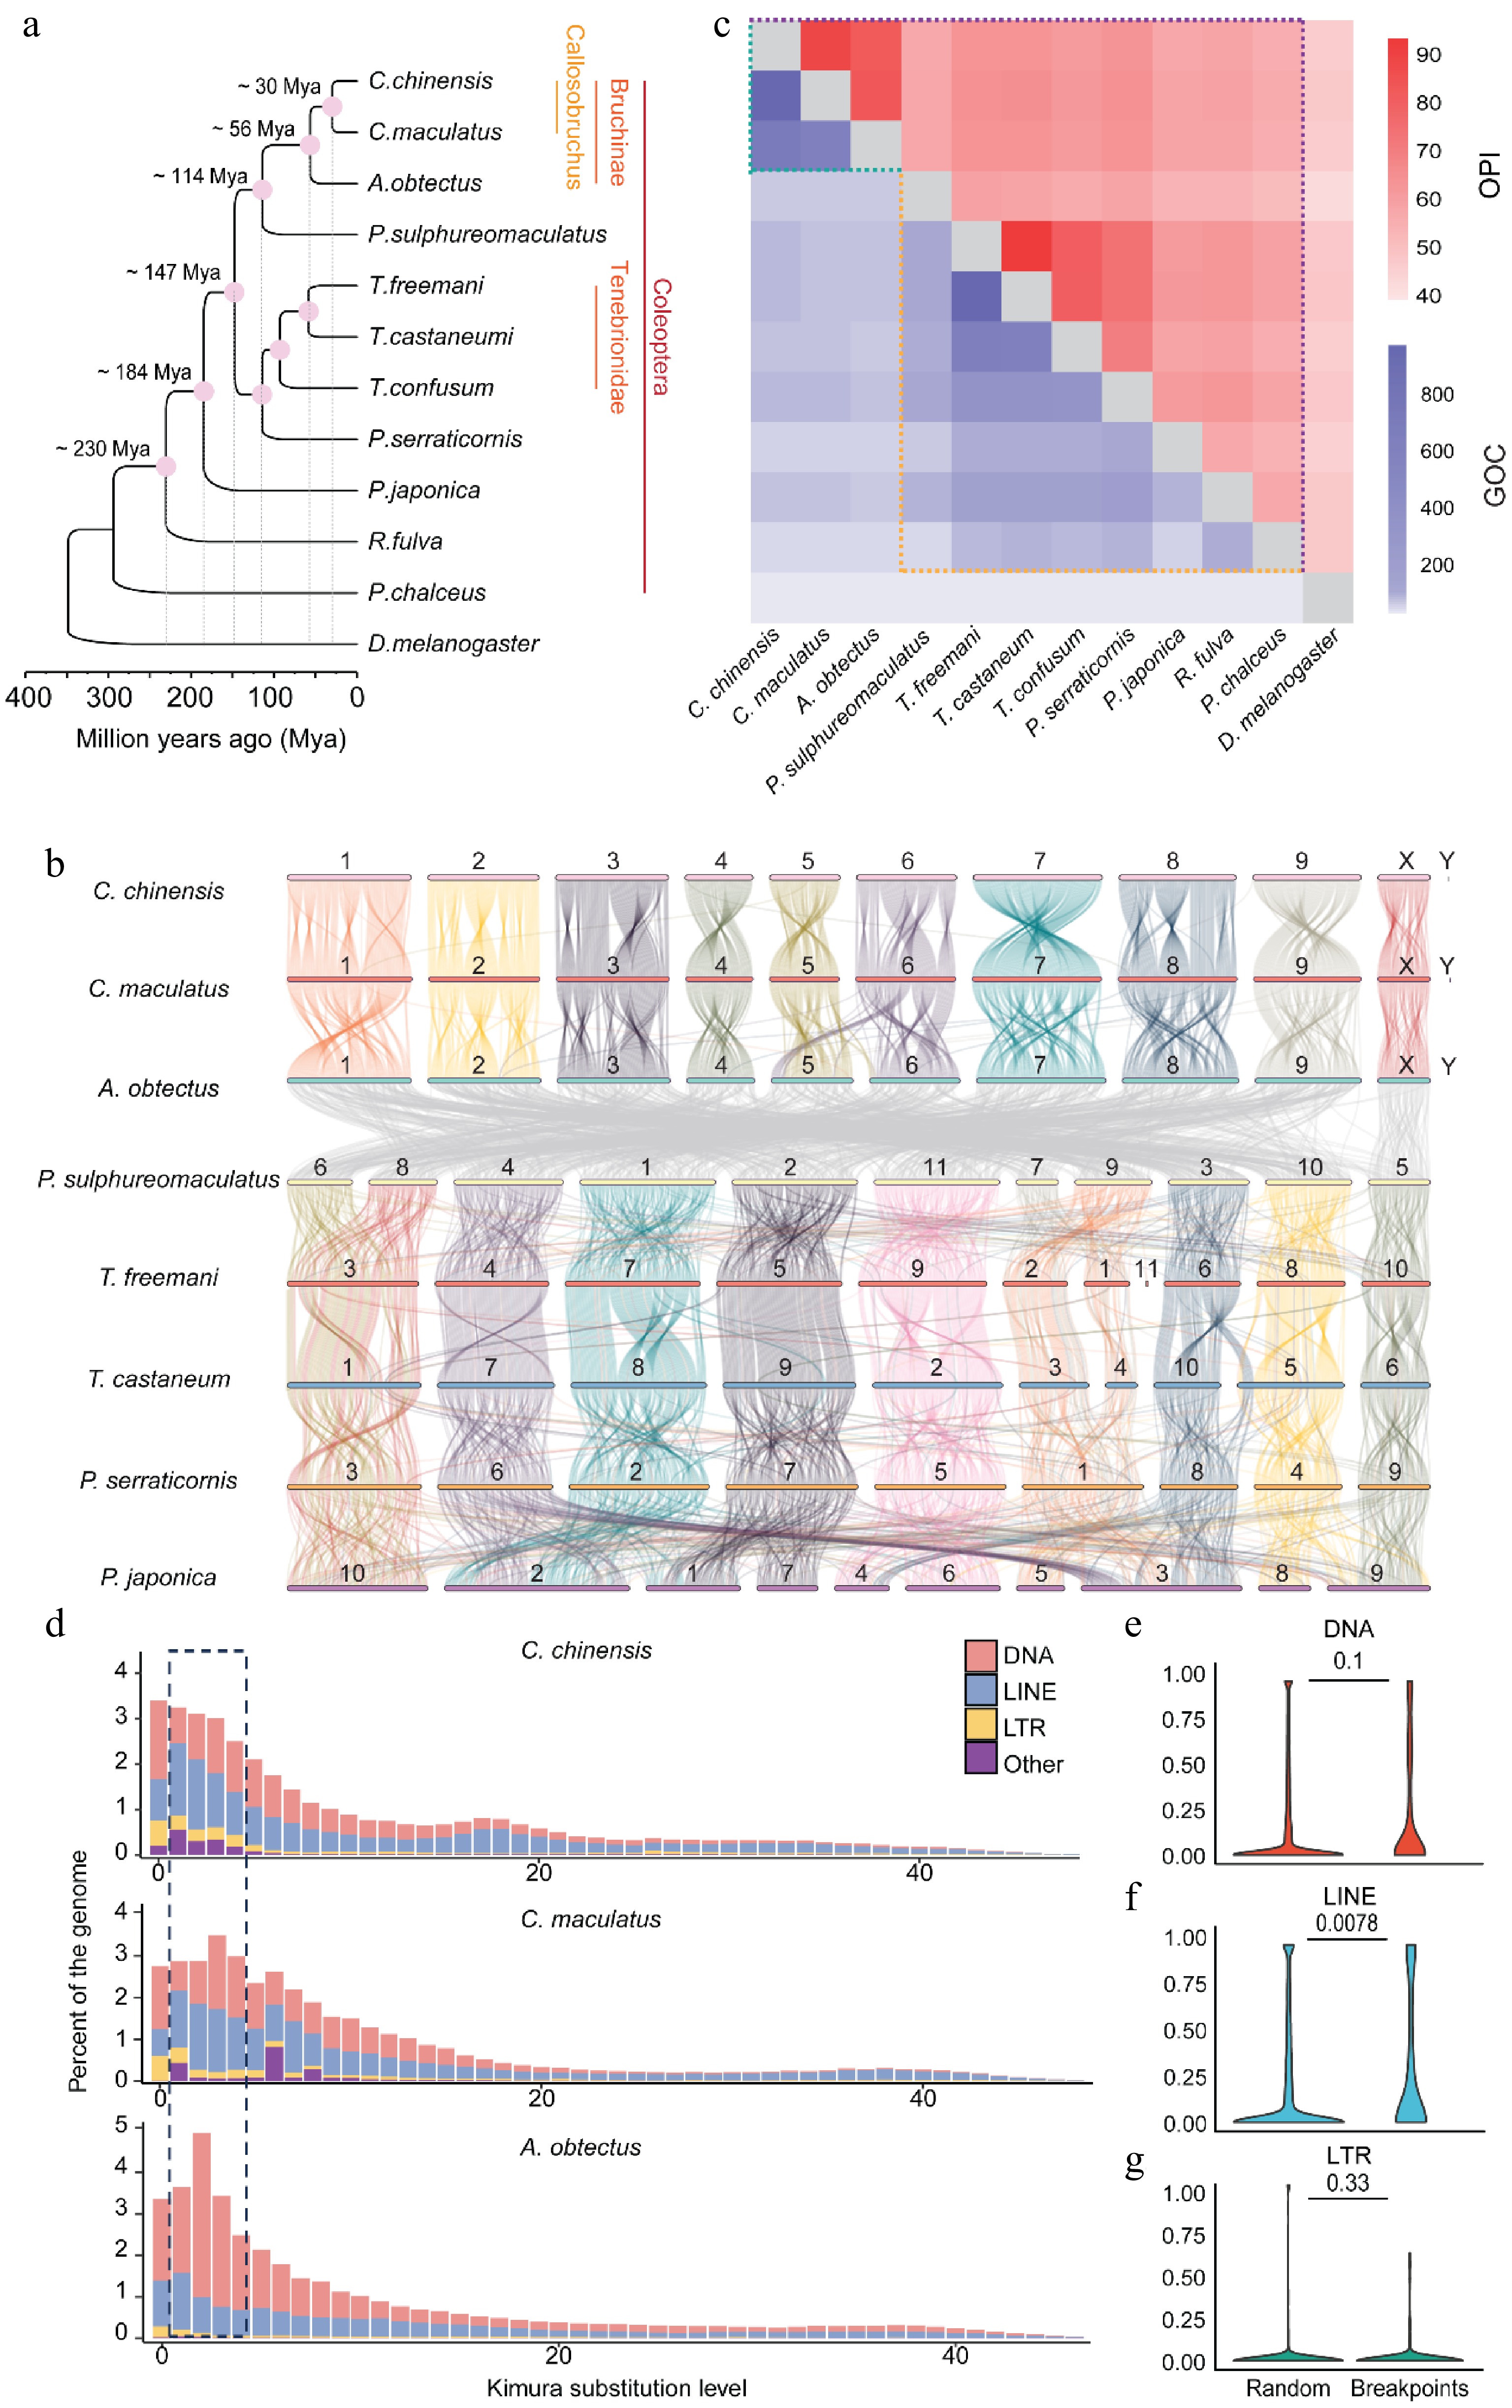
Figure 2.
Widespread genome rearrangements in Bruchinae. (a) The phylogenetic tree of different species in Coleoptera. A maximum likelihood tree of different Coleoptera species with D. melanogaster as the outgroup was established by iqtree. (b) Pairwise whole-genome alignments across eight Coleoptera genomes. Chromosome identifications (IDs) of each species are labeled on the chromosomes. The color of the collinear region in P. sulphureomaculatus, T. freeman, T. castaneum, P. serraticornis, and P. japonica is with reference to P. sulphureomaculatus. The color of the collinear region in C. chinensis, C. maculatus, and A. obtectus is with reference to C. chinensis. (c) A heat map matrix for orthologous proteins identity (OPI) and gene order conservation score (GOC) in Coleoptera and Bruchinae. The difference boundary between identity and GOC along evolutionary distance is highlighted with dashed lines. (d) Insertion history of TEs in seed beetles. Vertical bars show the frequency of TE insertions during the evolution of a species. Recent DNA and LINE TE amplifications are highlighted by dashed lines. (e–g) Contents of DNA, LINE, and LTR in chromosomal rearrangement (CR) regions and random regions. CR events are identified between our assembly and Lu et al.'s genome. The 1-kb regions flanking the CR events are compared with 10,000 random regions of the same length. The number on the horizontal line above each two boxes represents p-values (Wilcoxon's test).
To quantitatively describe the extent of chromosomal rearrangements in Bruchinae species, we computed orthologous protein identity (OPI) (Supplementary Table S5) and Gene Order Conservations (GOC)[46] scores (Supplementary Table S6) across all pairwise comparisons among the 11 Coleoptera species using the highly conserved gene set from BUSCO (version 4; Insecta BUSCO gene, n = 1,367) (Fig. 2c). The results show that A. obtectus has the highest OPI with C. maculatus (84.2%) and C. chinensis (83.1%) compared with other Coleoptera species, which have OPI values ranging from 46% to 65%. Similarly, the Bruchinae species have higher GOC scores (624–953) compared with other Coleoptera species (10–65) (Fig. 2c). These results demonstrate that the Bruchinae species have experienced an extensive decay of synteny since they diverged from other Coleoptera species. We also compared the sequence similarity of syntenic segments between Tenebrionidae and Bruchinae species, considering their differentiation times, and observed that species in Bruchinae exhibited comparatively higher sequence divergence. For example, the sequence divergence between A. obtectus and C. chinensis (~56 MYA, 87.45%) is notably higher than that observed between T. castaneum and T. freemani (~58 MYA, 90.42%). Even between C. chinensis and C. maculatus (~30 MYA, 89.75%), the sequence differences are greater than those found within the Tenebrionidae, indicating a more rapid sequence divergence within the Bruchinae family (Supplementary Fig. S6a–c).
The activity of TEs is a major mechanism for generating SVs. We investigated whether any TE families are associated with the rapid occurrence of chromosomal rearrangements in Bruchinae species. We observed a lineage-specific recent burst of LINE retrotransposons in C. chinensis and C. maculatus, while the genomes of A. obtectus and most other Coleoptera species have experienced greater amplification of DNA transposons compared with LINE retrotransposons (Fig. 2d and Supplementary Fig. S7). By comparing two available C. maculatus genomes (Supplementary Fig. S2d), we identified 117 chromosomal rearrangement events larger than 10 kb (including 74 translocations, 34 inversions, and 9 duplications) (Supplementary Table S7). In the absence of differences in other transposon families, we observed an enrichment of LINE transposons at the boundaries of chromosome rearrangements (Fig. 2e–g). These results suggest that the lineage-specific amplification of LINEs were associated with the higher rate of chromosomal rearrangements in Bruchinae species compared with other Coleoptera species.
Structure and expression characteristics of sex chromosomes in Bruchinae
-
As a model for studying sexual conflict, the evolution of the sex chromosomes of seed beetles is crucial[8,12]. To explore the sex chromosome evolution in the Bruchinae family, we performed a comparative sequence analysis of the X and Y chromosomes between species with different degrees of divergence within this family. Synteny analysis reveals that the X chromosome exhibits a high degree of conservation across most species within the Coleoptera order (Fig. 2b). For example, approximately 59.4%–65.9% of the genes located on the X chromosome of T. castaneum have orthologous counterparts on the X chromosomes of the three seed beetle species, whereas the proportion on autosomes is only 8.3%–9.9% on average (Fig. 3a). Similar results are also observed when comparing P. sulphureomaculatus to species in Bruchinae (Supplementary Fig. S8). The comparative genomic analysis also identified extensive SVs on the X chromosome within the Bruchinae family (Fig. 3b), but most of the X-linked genes retain orthologs on the X chromosome of at least one other species (65.4%, 66.9%, and 72.0% for A. obtectus, C. chinensis, and C. maculatus, respectively) (Fig. 3c). These results reveal that despite the fact that extensive SVs occurred on the X chromosome of species in the Bruchinae family, gene content and synteny remain conserved, likely due to the evolutionary functional constraints of X-linked genes and their chromosomal locations[57].
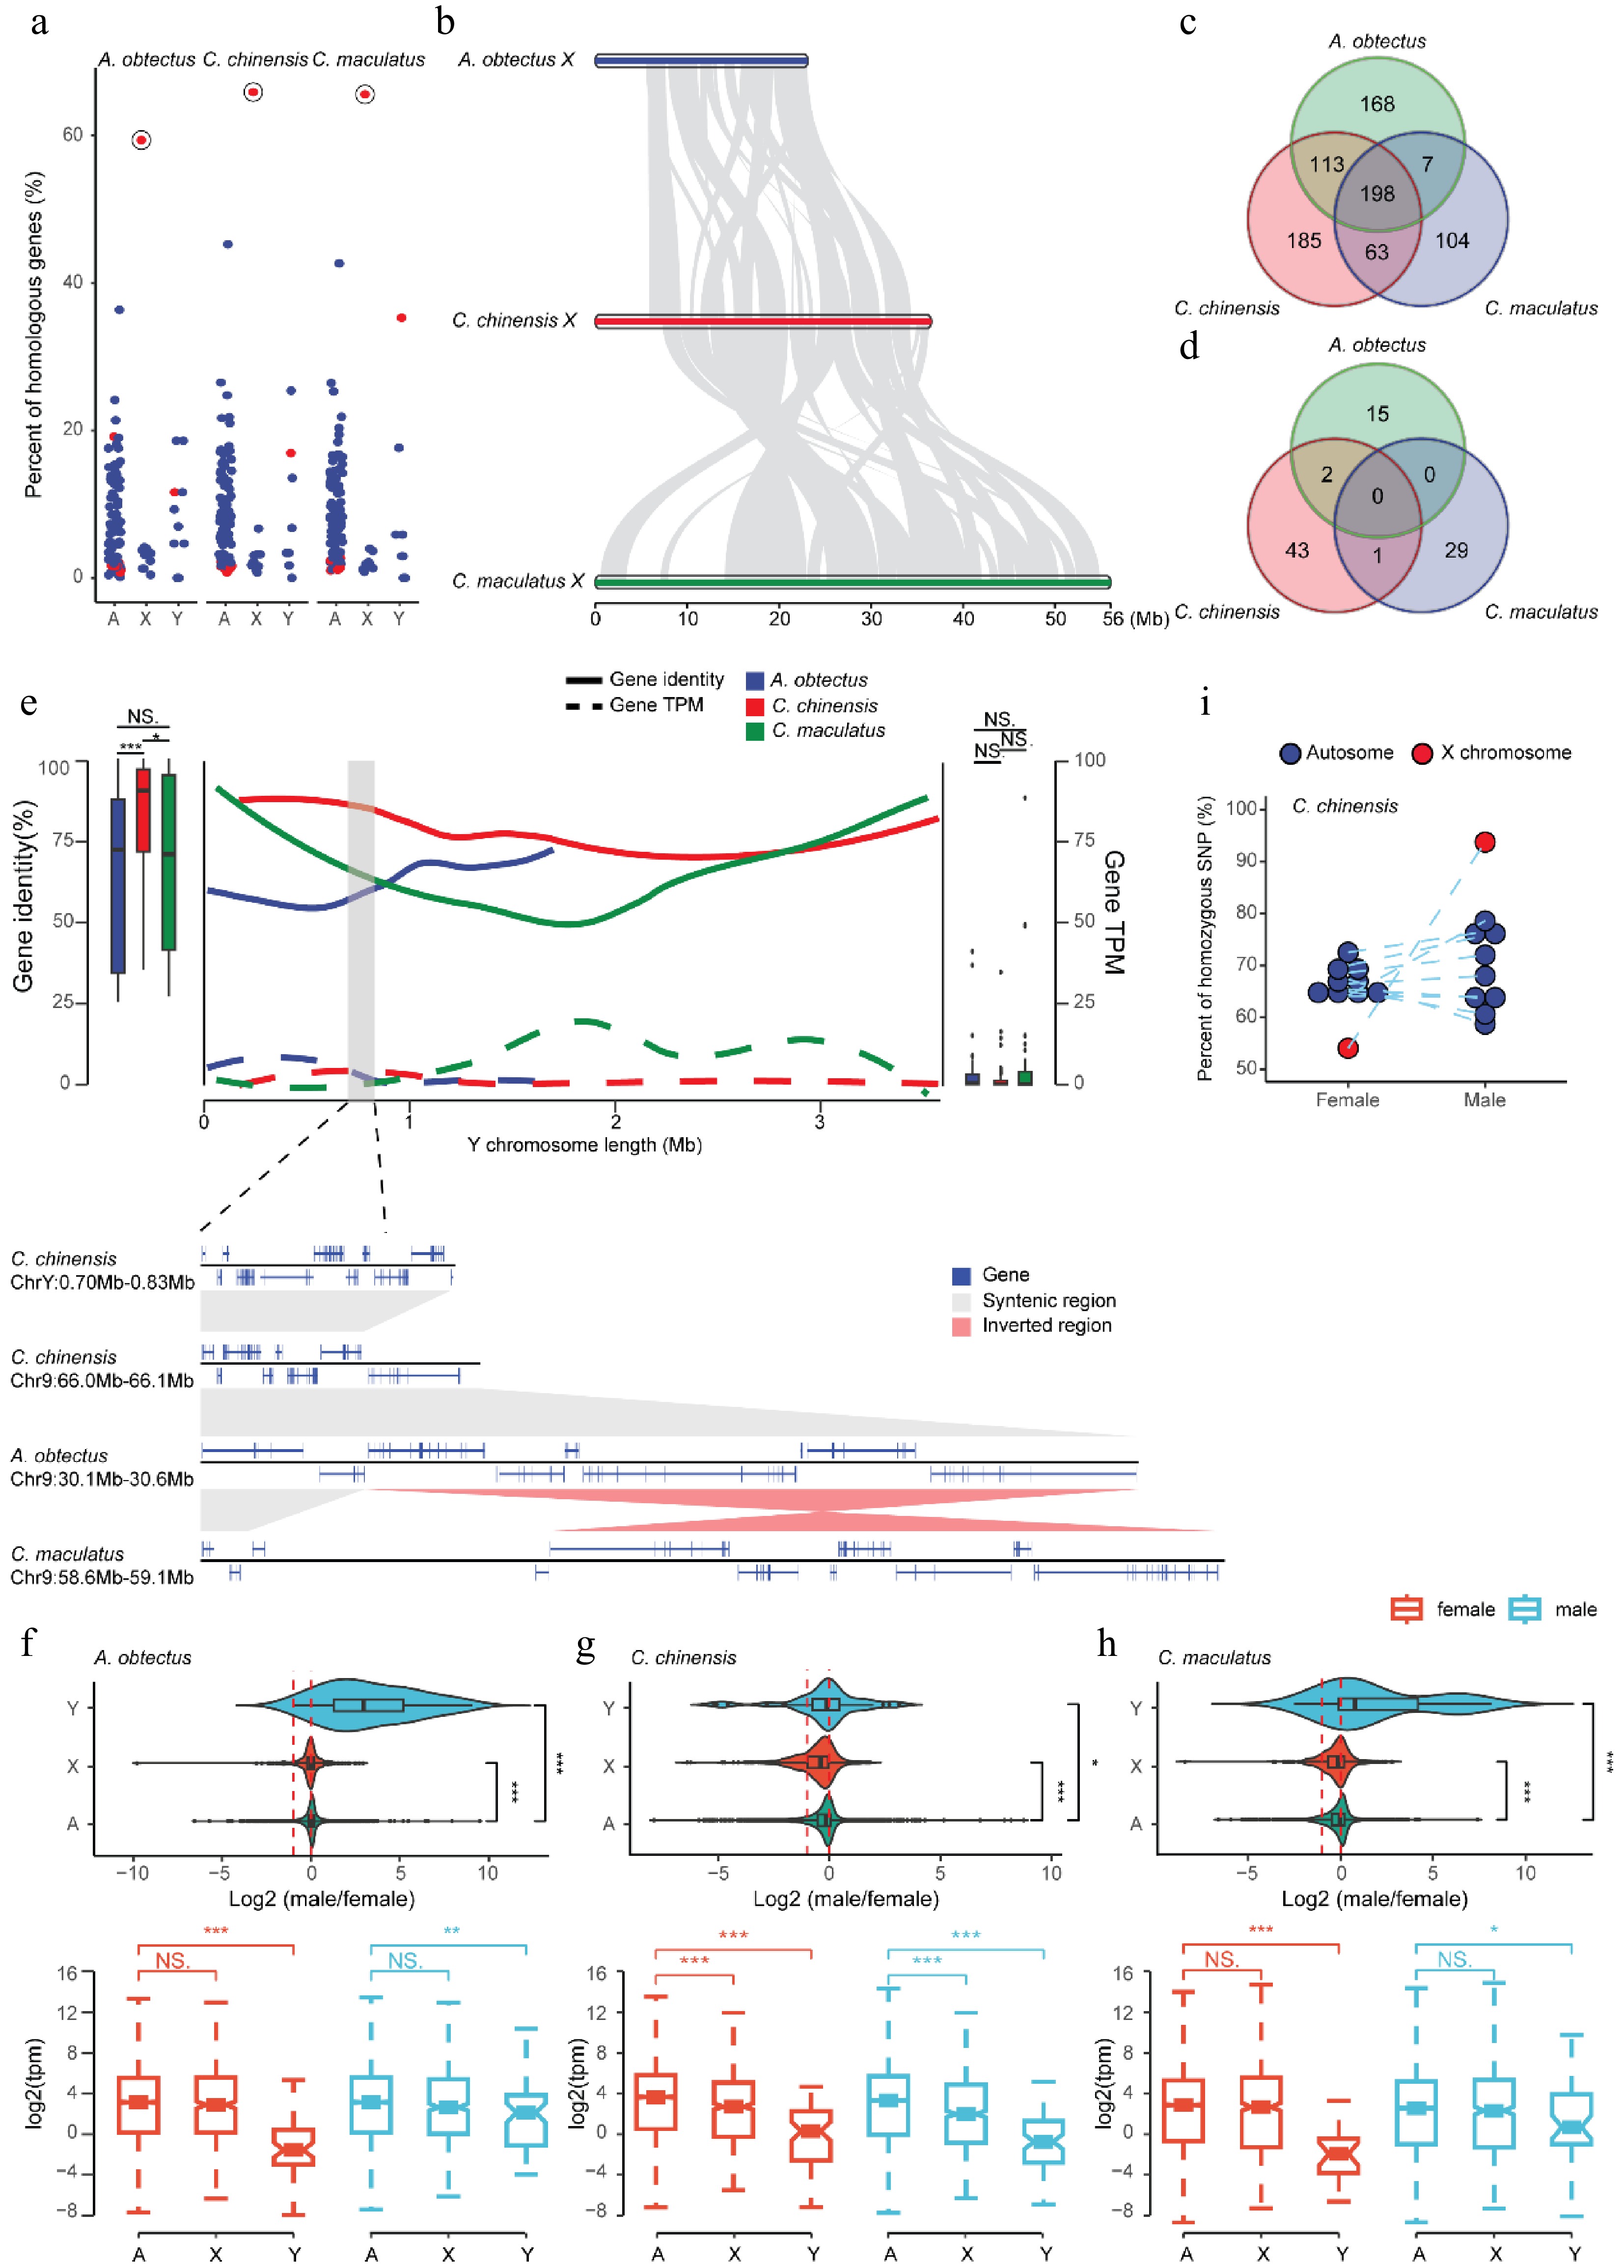
Figure 3.
The evolution of sex chromosomes in Bruchinae. (a) Chromosomal conservation of orthologous genes between Bruchinae and T. castaneum. Each point represents the percentage of orthologous genes between different chromosomes of T. castaneum and the autosomes, X chromosome, and Y chromosome of the corresponding Bruchinae species relative to the total number of genes on each chromosome of T. castaneum. The X chromosome of T. castaneum is marked with red dots, exhibiting the highest percentage of orthologous genes with Bruchinae species' X chromosome. (b) Widespread chromosomal rearrangement between the X chromosome of the seed beetles. Gray blocks represent regions of gene collinearity. (c, d) Conservatism of orthologs between seed beetles' X (c) and Y (d) chromosomes. (e) Sequence characteristics and gene expression of the Y chromosome. The overall similarity between Y chromosome genes and their orthologs in autosomes is depicted by a box plot. The distribution of gene identity (solid line) and expression levels (dashed line) along the Y chromosome is illustrated by a line graph. The collinearity of a segment of C. chinensis' Y chromosome with autosomes is magnified at the bottom. (f–h) Dose expression patterns of sex chromosomes for A. obtectus (f), C. chinensis (g), and C. maculatus (h) in the head. The log2 of the male-to-female expression ratio for autosomal and sex-linked genes is depicted in the violin plot. Expression of autosomal and sex-linked genes in males and females is depicted in the box plot. Female samples are represented by red and male samples are represented by blue. p-values (* p < 0.05, ** p < 0.01, *** p < 0.001) were derived from two-sided Wilcoxon matched-pair signed-rank tests. (i) Allelic heterozygosity in C. chinensis. Each point represents a chromosome, and the X chromosome is represented by red dots.
Conversely, the Y chromosome exhibits very little conservation in both gene content and synteny. Among species in the Bruchinae family, the Y chromosome shows minimal synteny conservation and lacks gene content conservation altogether (Fig. 3d). This dramatic difference in sequence content may be attributed to the high rate of sequence gain and loss during the evolution of the Y chromosome as a result of specific SV events. For example, we identified a genomic segment spanning ~130 kb containing 14 genes on the Y chromosome of C. chinensis that was derived from chromosome 9, which remains syntenic across all three species in Bruchinae (Fig. 3e). These results suggest that gene-related SVs lead to the rapid dynamics of gene content on the Y chromosome of species in Bruchinae, consistent with observations in humans and Drosophila[58].
We next specifically characterized the expression of sex chromosomes in Bruchinae by comparing gene expression profiles between male and female tissues across the three seed beetle species (Fig. 3f–h). At a genome-wide scale, we found no significant sex-biased differences in X-linked gene expression in all three seed beetle species (Fig. 3f–h). The ratio of X chromosome expression levels between males and females was similar to that of autosomes (Fig. 3f–h), indicating that the gene expression on the X chromosome in the three species is compensated in males to reach levels similar to autosomes. This is demonstrated by further analyzing the RNA-Seq data from male and female individuals, where we found that males exhibit a higher proportion of homozygous X chromosome transcripts, while females show heterozygous X chromosome transcripts, comparable with the autosomes, in C. chinensis (Fig. 3i and Supplementary Fig. S9). This result suggests that X chromosome dosage compensation is achieved by upregulating the expression level of the X-linked genes in males. In contrast, the expression of Y-linked genes is significantly lower than that of autosomal genes, even in the head tissues of male individuals (Fig. 3f–h and Supplementary Fig. S10g–i). A similar pattern was also observed in the gut and gonad tissues (Supplementary Fig. S10). In addition, we found that certain genes on the Y chromosome are pseudogenized due to sequence mutations (Supplementary Fig. S11). Furthermore, we found that genes with shorter evolutionary histories tend to exhibit lower expression levels (Supplementary Fig. S12), where we observed the lowest gene expression levels and the most recent chromosomal rearrangements. These results suggest that the discrepancy between the X and Y chromosomes may be due to the rapid evolutionary dynamics on the Y chromosome, which led to incomplete and unstable gene expression levels.
Dynamic changes in sex-biased genes in Bruchinae
-
Seed beetles, particularly C. maculatus, have been widely studied in evolutionary biology due to their pronounced sexual dimorphism and the sexual conflict that arises from their mating behavior[8,12,20,59]. The evolution of sex-biased genes is often considered a key step in alleviating sexual conflict[10]. To investigate the genomic features underlying sex-biased genes in seed beetles, we collected RNA-Seq data from three tissues (mature gonads, guts, and heads) of adult males and females in A. obtectus, C. chinensis, and C. maculatus, and compared them with T. castaneum. In total, we identified 8,367, 10,005, 8,882, and 8,609 sex-biased genes across tissues in T. castaneum, A. obtectus, C. chinensis, and C. maculatus, respectively, with the majority (86.6%–97.6%) predominantly observed in the gonads (Fig. 4a). We observed a higher proportion of female-biased genes in the head tissues from C. chinensis (13.0%) and C. maculatus (18.5%) compared with A. obtectus (2.1%), suggesting that lineage-specific transcriptome evolution related to sexual conflict may have emerged in the head tissue following their divergence from A. obtectus. Additionally, we found that the set of genes displaying sex-biased expression differs substantially between C. chinensis and C. maculatus (Fig. 4b and Supplementary Fig. S13), with only 56.8% of the single-copy genes being conserved between these two species in gonads. Furthermore, we observed that a substantial fraction of sex-biased genes exhibit different directions of bias between species, even within the same tissue (13.9% in the guts; 22.9% in the heads; 64.3% in the gonads). Among all genes with sex-biased expression direction changes, we only found one single-copy ortholog between A. obtectus and C. chinensis with different chromosomal backgrounds (chromosome 9 of A. obtectus vs. X chromosome of C. chinensis). This extremely limited number suggests that the chromosomal background is unlikely to be the primary driver of the large-scale dynamic changes in sex-biased genes. In addition, we found that sex-biased genes exhibit a faster rate of evolution (Supplementary Fig. S14). This trend was particularly pronounced for genes with stronger sex-biased expression, which is consistent with a previous study[12]. These results indicate that the expression patterns of sex-biased genes can evolve rapidly between seed beetle species, which may be associated with different degrees of phenotypic dimorphism among seed beetles.
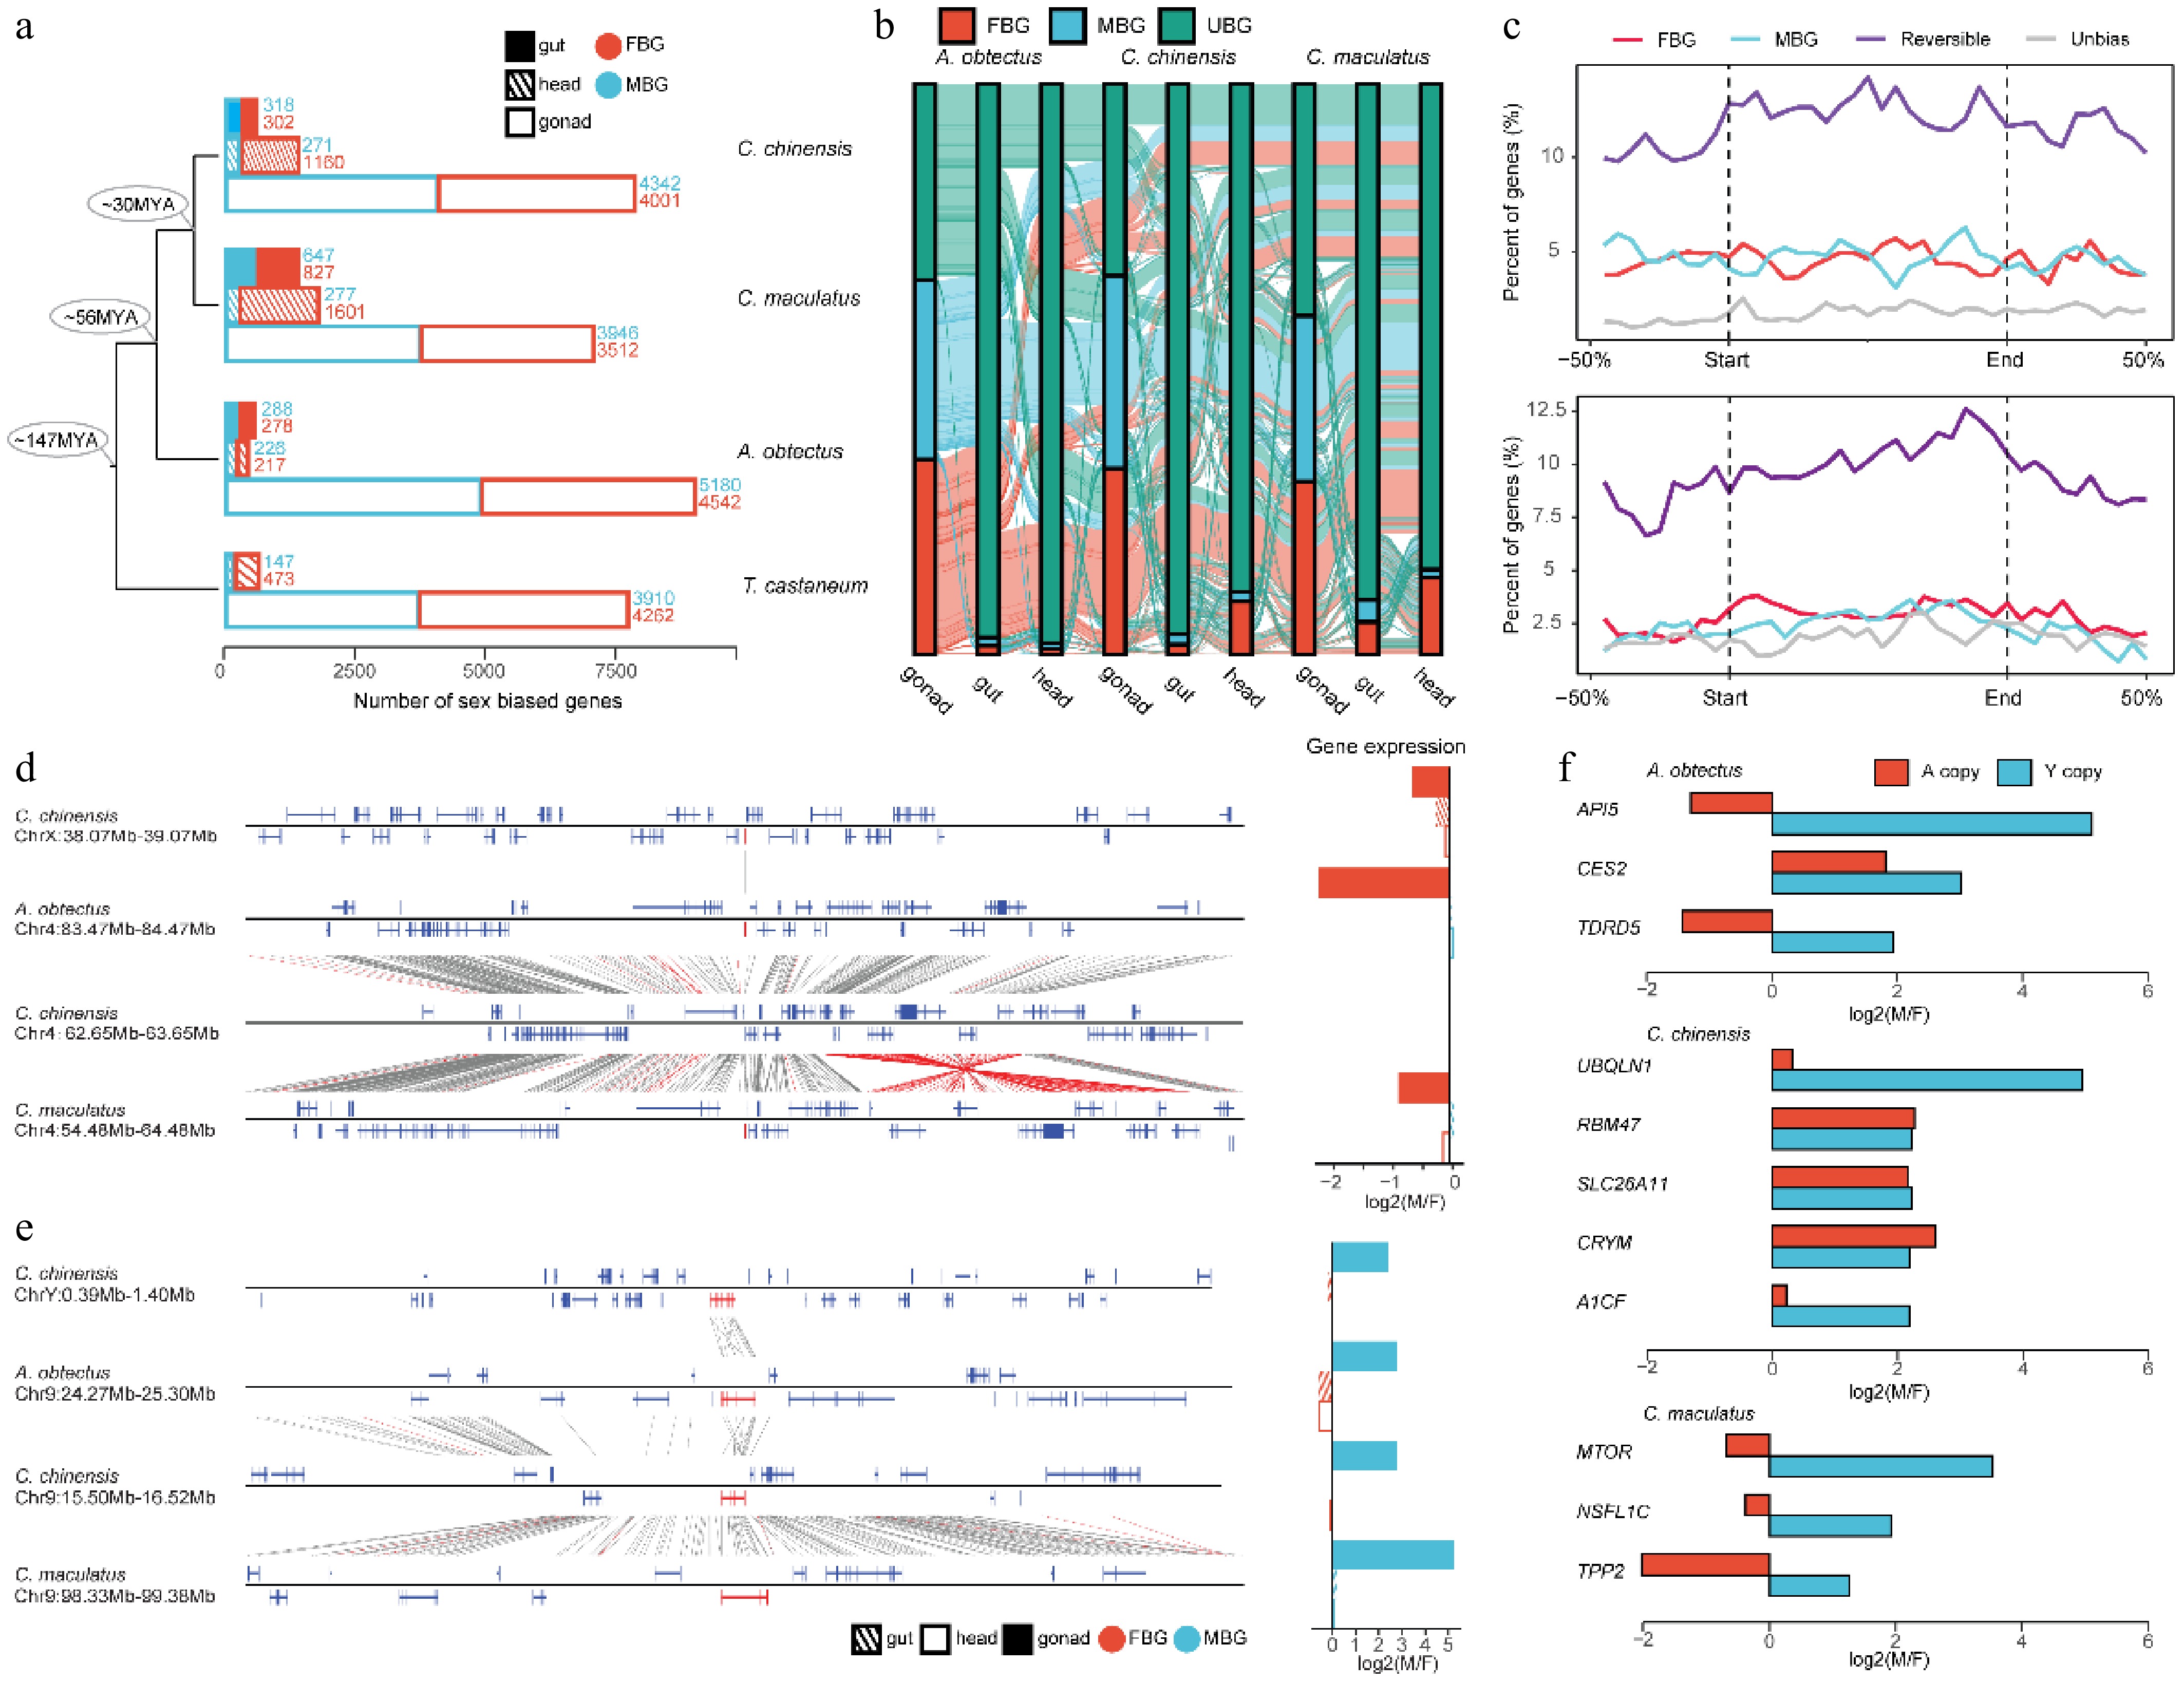
Figure 4.
The evolution of sex-biased genes in Bruchinae. (a) Comparison of the number of sex-biased genes between different species and tissues. We identified male-bias genes (MBG) and female-bias genes (FBG) in male and female samples from different tissues. The specific number of genes is indicated by numbers. (b) The Sankey diagram showing dynamic variation in sex-biased genes across different tissues and species. UBG, unbiased gene. (c) Distribution of sex-biased gene density between A. obtectus and C. chinensis (top) and between A. obtectus and C. maculatus (bottom) along sequence inversions. 'Reversible' represents the orthologs with different sex-biased expression patterns in different species. (d) Nonreplicating translocation event of gene. (e) Replication translocation event of genes. The genes that undergo translocation are marked in red on the collinearity chart, and the corresponding sex-biased expression patterns in different tissues are shown in the bar plot. (f) The expression of genes with strong sex bias on the Y chromosome and their orthologous genes on the autosomes. Expression of Y-linked genes was calculated using testis and ovary tissues.
We next sought to investigate whether any genomic features are associated with changes in sex-biased gene expression in C. chinensis and C. maculatus relative to A. obtectus. We focused on large genomic variants and identified 45 and 46 inversions larger than 50 kb in C. chinensis and C. maculatus, respectively, relative to A. obtectus (Supplementary Tables S8, S9). We observed that sex-biased genes with changes in bias direction (reversible) identified between C. chinensis and A. obtectus, or between C. maculatus and A. obtectus, are significantly enriched in genomic regions overlapping with inversions (Fig. 4c and Supplementary Fig. S15). These results suggest a potential correlation between SVs and the biased direction of expression of sex-biased genes, possibly through changes in the chromosomal positions of sex-biased genes.
Translocation-based gene birth on the Y chromosome of seed beetle species
-
Gene traffic has been recognized as an important evolutionary process that can alter gene expression patterns, including sex-biased gene expression, especially when the translocations involve sex chromosomes[9]. As a result, sex-biased genes on sex chromosomes are not randomly distributed; instead, they often exhibit patterns of under-representation or over-representation[60]. This pattern is also observed in our data, where female-biased genes across all tissues are significantly enriched on the X chromosome in all three seed beetles (Supplementary Fig. S16a–c). To further examine the impact of gene translocation on sex-biased gene expression, we identified the derived gene traffic events between chromosomes both in C. chinensis (Supplementary Table S10) and C. maculatus (Supplementary Table S11) since they diverged from A. obtectus. In total, we identified 43 and 138 gene traffic events in C. chinensis and C. maculatus, respectively (Supplementary Tables S10, S11). Of them, 35 and 107 indicate gene traffic between autosomes, while two genes and 11 genes moved from the autosomes to the X chromosome or vice versa in C. chinensis and C. maculatus, respectively. Due to the rapid decline in homology between the Y chromosomes of these Bruchinae species, we were unable to determine gene traffic events between the Y chromosome and other chromosomes. This suggests that nearly all genes (97.1% in C. chinensis and 97.6% in C. maculatus) on the Y chromosome are either newly emerged or the results of translocation-based gene birth since their divergence from A. obtectus (Supplementary Tables S12, S13). Moreover, the translocation of Y-linked genes appears to involve more than simple positional shifts; it encompasses the flank regions of each locus (Supplementary Fig. S16d, e). This pattern suggests that the events are driven by region recombination rather than by gene relocation alone.
Gene traffic between autosomes and sex chromosomes is often related to the original expression patterns of genes[60]. For example, the Y chromosome tends to fix genes with male-biased expression, while the X chromosome tends to fix genes with female-biased expression[9]. We began by examining a case of nonduplicative translocation of a gene in C. chinensis, specifically the movement of a gene from chromosome 4 to the X chromosome, accompanied by the loss of the orthologous gene at the original locus (Fig. 4d). Analysis of gene expression reveals that this gene is specifically highly expressed in the gonadal tissues of females, whether it is located on an autosome prior to translocation or on the X chromosome afterward, across all three species of seed beetle. Similar outcomes were observed in a gene duplication translocation event (Fig. 4e). Specifically, the orthologous gene has been translocated to the Y chromosome in C. chinensis. Notably, prior to this translocation, the gene already demonstrated high tissue-specific expression in male gonadal tissues on the autosomes across all three seed beetles. Furthermore, we also found that the expression profiles of certain genes shifted following translocation between autosomes and sex chromosomes (Supplementary Fig. S17). These results indicate that the gene translocation between autosomes and sex chromosomes is correlated with alterations in the gene expression patterns in seed beetles.
Seed beetles exhibit numerous sexually dimorphic traits, including differences in gene expression, body size, and immunity, reflecting their evolutionary history under sexually antagonistic selection[20,21]. We identified several genes (n = 11) that may be associated with sexually dimorphic traits. In all three species of seed beetles, these genes exhibited changes in the direction of sex-biased expression following their translocation from the autosomes to the Y chromosome (Fig. 4f). These genes were previously female-biased or unbiased in expression when located on the autosomes but became male-biased after being translocated to the Y chromosome (Fig. 4f). For example, API5[61], a gene essential for wing development, is located on the Y chromosome of A. obtectus and shows male-biased expression, whereas its ancestral copy on the autosome exhibits female-biased expression. TDRD5, a gene that is required for spermiogenesis in insects[62], shows strong male-biased expression when located on the Y chromosome in A. obtectus. We also identified genes related to metabolism (UBQLN1 and A1CF)[63,64] in C. chinensis and a gene regulating body size in C. maculatus (MTOR)[8] that exhibit male-biased expression after being translocated to the Y chromosome from autosomes. The specific expression of these genes on the Y chromosome may contribute to the development of sexual dimorphism or help alleviate the sexual conflict between males and females in seed beetles.
-
Species in the Bruchinae, as a group with significant sexual dimorphism, are often used for research on sex chromosomes[8,12,59]. We assembled high-quality chromosome-level genomes of three Bruchinae species, namely C. chinensis, C. maculatus, and A. obtectus, which allows us to gain a deeper understanding and insight into the genomic evolution and SVs within the Bruchinae family.
The assembly of Y chromosomes is challenging due to the abundance of repetitive sequences on it, which complicates the process of generating a contiguous and accurate genomic sequence. For example, the assembled Y chromosome of C. maculatus is relatively small compared with the Y-linked contigs reported in previous studies[8]. Cytological analysis across various species of seed beetles has revealed diversity in their Y chromosome[16]. Additionally, there are significant differences in Y chromosome lengths between different populations of the same species. This genetic variation could be a reflection of the dynamic evolutionary processes and population-specific factors influencing the structure and size of the Y chromosome in these insects. Moreover, the substantial variation in the lengths of Y-linked contigs identified by Kaufmann et al.[8] across different populations of C. maculatus further demonstrates the prevalence of Y chromosome changes in Bruchinae. The sequence alignment between the Y chromosome of the current genome of C. maculatus and the published Y-linked contigs suggests the higher contiguity of the current Y chromosome assembly. Furthermore, sequence alignment shows that the Y-linked contig CATOUR010000029.1, which was identified by Kaufmann et al.[8], is actually part of chromosome 3 in our genome assembly. This observation suggests that variations in Y chromosome length across different populations may be attributed to the exchange of sequences between the Y chromosome and autosomes. Such exchanges could potentially account for the observed differences in Y chromosome length among various populations. However, these findings do not preclude the possibility that repetitive sequences may have been omitted from our assembly, potentially leading to an underestimation of the size of the Y chromosome.
Our analysis reveals distinctive SVs occurring among species within the Bruchinae family. The conservation of chromosomes in Coleoptera spans across multiple families and correlates with evolutionary distance, exhibiting a degree of decay[46]. Similar chromosome conservation patterns were observed beyond Coleoptera, with notable instances of high-level collinearity identified across diverse families within Lepidoptera[57]. In Drosophila, each chromosome is characterized by a specific type of Muller element. Rearrangements of sequences can only occur within the same type of Muller element, thereby limiting rearrangements between different chromosomes. Similar mechanisms have also been proposed in nematodes to elucidate chromosome conservation across diverse nematode species[9]. Compared with other species within the Coleoptera order, species of the family Bruchinae have undergone extensive chromosomal rearrangements, resulting in complete disruption of chromosomal correspondence and showing distinctive SVs. It is noteworthy that while extensive rearrangements occur among autosomes, the X chromosome exhibits relatively high conservation across the entire Coleoptera species. Similar observations have been noted in Hemiptera[57], suggesting evolutionary constraints specific to the X chromosome[57]. Furthermore, we observed a correlation between extensive chromosomal rearrangements and TEs, particularly LINE retrotransposons. This correlation may be influenced by their shared locations in nonrecombining genomic regions. This spatial association does not exclude the possibility that LINE insertions facilitate SV formation, for example, via homologous recombination between TE copies. However, whether there is a causal relationship between LINE insertions and SV formation requires further experimental verification.
We show the rapid dynamic changes in the repertoire of sex-biased expression genes in Bruchinae. sex-biased genes are not conserved among closely related species or even among different tissues within one species, and most sex-biased genes are subject to a certain degree of relaxed purifying selection[10]. The sex-biased expression of genes can be caused by intra-locus sexual conflict, which gives rise to sexual dimorphism in biological traits or characteristics between males and females[10]. Several studies have found a correlation between the widespread sexual conflict traits in C. maculatus and the large number of sex-biased genes in its genome, and these sexual conflict traits also contribute to the unique evolutionary rate of sex-biased genes[12,59]. Similar to C. maculatus, both C. chinensis and A. obtectus exhibit numerous sexual dimorphism traits between males and females[65], making them excellent models for studying the evolution of sex-biased genes and sexual conflict. Comparisons of sex-biased genes among closely related species of Bruchinae reveal that these genes underwent rapid changes between C. chinensis and C. maculatus, which diverged 30 MYA. The widespread differences in sex-biased genes among closely related species of Bruchinae suggest the existence of diverse sexual dimorphism traits among them, which may have contributed to their gradual divergence from a common ancestor into distinct species[66]. Genes located at sex-conflict loci often exhibit tissue-specific and sex-biased expression patterns. These expression patterns result in reduced balancing selection pressure, thereby allowing these genes to evolve at a faster rate[10]. We found that sex-biased genes have a faster evolution rate, and this ratio was notably elevated for those genes with stronger sex-biased expression, which is consistent with the prediction that sex-biased genes may experience relaxed purifying selection[67]. The distribution of sex-biased genes in the genome is not completely random, and they are often enriched or depleted on the sex chromosomes[60]. Hence, gene translocation between autosomes and sex chromosomes can effectively modify the repertoire of sex-biased genes, thereby influencing the degree and direction of gene expression bias and quickly adapting to sexual conflicts[60].
The rapid translocation of genes on the Y chromosome provides an effective way to alleviate sexual antagonism through gene sex-specific expression. When the expression of a gene has opposite effects on different sexes, it will be subject to different selective pressures between the sexes, leading to sexual antagonism[10]. At the expression level, genes can alleviate sexual conflict at certain loci through sex-biased/specific expression, which has been proven in many species[8,68]. Since the Y chromosome is male-limited, many genes that are beneficial to males but detrimental to or inconsequential for females can be transferred to the Y chromosome, thereby escaping selection in females[69]. Our findings suggest that genes on the Y chromosome lack synteny or orthologs across seed beetles, indicating a rapidly evolving and dynamic pattern. The collinear region between the Y chromosome and chromosome 9 of C. chinensis further suggests that gene translocation events between the Y chromosome and autosomes are one of the driving forces behind the emergence of new Y chromosome genes and novel sex-biased expression genes, which is also similar in C. maculatus[8]. In seed beetles, numerous traits, including body size[59], gene expression[12], and reproductive costs[20], have been found to vary between males and females, indicating that their genomes are subject to a great amount of sexual antagonism selection. Genes on the Y chromosome can resolve the sexual conflict between male and female traits through male-specific expression, a mechanism that has been observed on the Y chromosome of C. maculatus[8,12]. We identified several male-biased expression genes associated with sexual dimorphism through the Y chromosome of three types of seed beetles. However, specific functional verification requires additional experimental support.
-
In this study, we show that three seed beetle genomes in Bruchinae have undergone rapid genomic changes. The extensive genomic SVs observed in seed beetles have significantly shaped their genomic architecture and sex-biased regulatory patterns. The high-quality reference genomes generated by this study offer invaluable genomic resources for studying the evolution of regulation of sex-biased genes and their related traits in these seed beetles.
-
The study fully complied with institutional, national, and international guidelines. All insect samples were strictly controlled in the laboratory and did not involve endangered species. The sample collection of the three types of seed beetles was completed domestically using domestic sources only; no foreign specimens were collected or imported from abroad. No ethical approval was required.
This work was supported by National Key R&D Program of China (2022YFD1400800), Initiative Scientific Research Program, Institute of Zoology, Chinese Academy of Sciences (2023IOZ0203), the National Natural Science Foundation of China (Nos. 31571737), and the Open Research Fund Program of State Key Laboratory of Integrated Management of Pest Insects and Rodents (Grant No. IPM2201).
-
The authors confirm their contributions to the paper as follows: study conception and design: Zhang X, Liao Y, Chen J; seed beetle rearing and experiment: Lin M, Liu C, Wang L; genome assemble, protein-coding gene and TE annotatation, and data analyses: Chen W, Zhao J, Liu Y, Xie L; manuscript writing and revision: Chen W, Zhao J, Zhang X, Liao Y, Chen J. All authors reviewed the results and approved the final version of the manuscript.
-
The raw sequences of Nanopore ultra-long reads, whole-genome sequencing (WGS) short reads, RNA-Seq reads, and Hi-C reads have been deposited in the National Center for Biotechnology Information SRA (BioProject accession No. PRJNA792679 for C. chinensis and C. maculatus and PRJNA912403 for A. obtectus). The genome assembly has been deposited in the National Center for Biotechnology Information Genome (JBICBS000000000 for C. chinensis; JBCIKN000000000 for C. maculatus, and JBHEVA000000000 for A. obtectus). The assembled genome sequences and gene and transposable element annotations and the scripts used for analyses are available on Zenodo (https://doi.org/10.5281/zenodo.13744296). All study data are included in the main article and Supplementary Materials. All codes or tools used in this study are described in the methods and available on Zenodo (https://doi.org/10.5281/zenodo.13744296).
-
The authors declare that they have no conflict of interest.
-
# Authors contributed equally: Weiyao Chen, Jinshuai Zhao, Miaojin Lin
- Supplementary Table S1 Assembly statistics of three seed beetle genomes.
- Supplementary Table S2 Transposon annotation of Callosobruchus chinensis.
- Supplementary Table S3 Transposon annotation of Callosobruchus maculatus.
- Supplementary Table S4 Transposon annotation of Acanthoscelides obtectus.
- Supplementary Table S5 Identity of the single-copy protein similarity matrix for 12 species (n = 1,397).
- Supplementary Table S6 Gene Order Conservations score martix for 12 species (n = 1,397).
- Supplementary Table S7 Summary of structural variants between two genomes of C. maculatus.
- Supplementary Table S8 Summary of structural variants between A. obtectus and C. chinensis.
- Supplementary Table S9 Summary of structural variants between A. obtectus and C. maculatus.
- Supplementary Table S10 Summary of gene traffic between A. obtectus and C. chinensis.
- Supplementary Table S11 Summary of gene traffic between A. obtectus and C. maculatus.
- Supplementary Table S12 Summary of C. chinensis Y-links gene traffic compared to A. obtectus.
- Supplementary Table S13 Summary of C. maculatus Y-links gene traffic compared to A. obtectus.
- Supplementary Fig. S1 Genomic characteristics of three seed beetles.
- Supplementary Fig. S2 Comparison of C. maculatus genome assembly with previously published C. maculatus genomes.
- Supplementary Fig. S3 Independent Hi-C matrix and sequence alignment of X chromosomes.
- Supplementary Fig. S4 Independent Hi-C matrix and sequence alignment of Y chromosomes.
- Supplementary Fig. S5 Analysis of collinearity between Coleoptera species.
- Supplementary Fig. S6 Sequence differences between the genomes of seed beetles.
- Supplementary Fig. S7 Insertion history of TEs among Coleoptera species.
- Supplementary Fig. S8 Chromosomal conservation of orthologous genes between Bruchinae and P. sulphureomaculatus.
- Supplementary Fig. S9 Allelic heterozygosity in C. chinensis' transcriptome.
- Supplementary Fig. S10 Dose expression pattern of sex chromosomes for seed beetles.
- Supplementary Fig. S11 Pseudogenization of Y-linked genes.
- Supplementary Fig. S12 The evolutionary rate of Y-linked genes in three seed beetles.
- Supplementary Fig. S13 Orthologous genes' sex-biased pattern in different species.
- Supplementary Fig. S14 The evolutionary rate of sex-biased genes.
- Supplementary Fig. S15 Boxplot for the density of classification genes inside/outside SV/no-SV regions.
- Supplementary Fig. S16 X Chromosomal enrichment analysis of sex-biased genes.
- Supplementary Fig. S17 Examples of gene transfer resulting in genetic environmental changes and altered sex bias in gene expression.
- Copyright: © 2025 by the author(s). Published by Maximum Academic Press, Fayetteville, GA. This article is an open access article distributed under Creative Commons Attribution License (CC BY 4.0), visit https://creativecommons.org/licenses/by/4.0/.
-
About this article
Cite this article
Chen W, Zhao J, Lin M, Liu C, Xie L, et al. 2025. Chromosome-level genomes of Bruchinae reveal the rapid evolution of sex chromosomes and sex-biased genes in seed beetles. Genomics Communications 2: e016 doi: 10.48130/gcomm-0025-0016 

Chromosome-level genomes of Bruchinae reveal the rapid evolution of sex chromosomes and sex-biased genes in seed beetles
- Received: 27 June 2025
- Revised: 19 July 2025
- Accepted: 28 July 2025
- Published online: 11 August 2025
Abstract: Structural variations (SVs) provide a material basis for genomic evolution, which can influence gene expression and three-dimensional (3D) genome structure, and even alter complex chromosomal features through regional recombination, copy number variation, and chromosome rearrangement. Here, we assemble and compare the chromosome-level assemblies of three species (Acanthoscelides obtectus, Callosobruchus chinensis, and C. maculatus) in Bruchinae, a clade of Coleoptera that is often used as a model to study sexual conflict, to investigate the role of SVs in their genomic differences. Through a comparative genomic analysis of Coleoptera species, we reveal extensive SVs within the Bruchinae family, which are linked to the ongoing activity of long interspersed nuclear element (LINE) retrotransposons. We show that the significant SVs between the chromosomes of different species are correlated with the dynamic evolution of sex-biased genes. Our analysis highlights the acquisition of novel genes on the Y chromosome through frequent gene translocations. In addition, we observed additional copies of some gene families on the Y chromosome of seed beetles, which may alleviate conflicts associated with certain sexually dimorphic traits. Our findings reveal the significant contributions of SVs to the differences in genomic features in Bruchinae, specifically in sex chromosome evolution and the evolutionary dynamics of sex-biased genes.
-
Key words:
- Structural variation /
- Bruchinae /
- Sex chromosome evolution /
- Sex-biased gene /
- Y chromosome