


-
Aquatic biological resources serve as a crucial source of high-quality protein for humans and play an essential role in maintaining global ecological balance[1]. However, these resources are currently facing substantial threats globally[2]. Recent assessments indicate that 37.7% of marine aquatic animal stocks are being exploited at biologically unsustainable levels, whereas 40% of major inland rivers are under 'moderate stress' and 13% are under 'high stress'[3]. In response to these alarming trends, the Kunming–Montreal Global Biodiversity Framework (KMGBF), adopted at the 2022 Conference of the Parties (COP) to the Convention on Biological Diversity (CBD), underscores the dual goals of ensuring a sustainable aquatic food supply while reducing species extinction risks and promoting the responsible utilization of wild aquatic species. Therefore, the conservation, rational utilization, and scientific monitoring of aquatic biological resources have emerged as global priorities[4,5].
Brachymystax lenok tsinlingensis, a species of Brachymystax belonging to the family Salmonidae and order Salmoniformes, is a cold-water fish endemic to China and has been listed as a national Class 'II' protected wildlife species since 1988 (
https://www.gov.cn/ ). As a relict species that migrated southward during the Quaternary glaciations, B. lenok tsinlingensis is now primarily distributed across northeastern and northwestern China. In the northeast, it is commonly referred to as 'river Brachymystax' and inhabits narrow mountain streams, whereas in the northwest, it is known as 'mountain Brachymystax' and occurs in broad and slow-flowing rivers[6]. Because of habitat degradation, water conservancy developments, and overfishing, wild populations have undergone a marked decline[7−9]. To reverse this trend, restocking efforts have been conducted over several years[6,10−13]. However, a clear taxonomic classification, coupled with a precise delineation of lineage relationships and genetic divergence at the genomic level, is a prerequisite for effective germplasm conservation and management.The taxonomic status of B. lenok tsinlingensis has long been a subject of debate. Two major perspectives exist: one proposes that the Qinling population represents a distinct local subspecies[14] different from B. lenok lenok (Pallas, 1773) distributed in the Heilongjiang River basin[15]; the other argues that the genus Brachymystax in China comprises only a single species without subspecific differentiation[16]. Notably, genetic studies based on mitochondrial cytochrome b[17] and D-loop sequences[6] have revealed a high degree of genetic divergence among populations from different geographic regions. Phylogenetically, Brachymystax species represent an early-diverging lineage within salmonids and provide important insights into the evolutionary history of this group. Genomic studies indicate that salmonid fishes possess a distinctive GC content and codon usage patterns; this lineage has diverged from other salmonids approximately 41 million years ago, exhibits relatively slow evolutionary rates following the salmonid-specific whole-genome duplication event, and has lost the HoxAbβ Hox gene cluster[18]. Although these findings help explain migration-related issues, the geographic isolation hypothesis has been widely accepted as the predominant explanation for the genetic divergence; however, the evolutionary history and population genetic processes underlying the observed diversity among populations remain to be elucidated.
In this study, we assembled a high-quality chromosome-level genome for a wild-caught individual of B. lenok tsinlingensis from a stream that had not been stocked, and conducted whole-genome resequencing of its geographically distributed populations in northeastern and northwestern China. We aimed to elucidate its population genetic structure through genomic research and provide insights into its evolutionary history. Further, as a typical species used in stock enhancement, the results for B. lenok tsinlingensis can be applied to the conservation of its germplasm resources and can also provide a new genomic perspective on species evolution and environmental adaptation.
-
Specimens of B. lenok tsinlingensis (2023; ~400 g; sex: female; body length: 21 cm, and age: three years old) for DNA and RNA extraction were collected from the Bangsha River, Gansu Province, China. All sampling and subsequent experimental procedures were approved by Gansu Key Laboratory of Cold Water Fishes Germplasm Resources and Genetics Breeding (B20200103-01), and were conducted in strict accordance with the ethical guidelines. Tissues, including the dorsal muscle, brain, gonads, liver, and heart, were collected and immediately flash-frozen in liquid nitrogen until further processing. DNA used for genome assembly was extracted from muscle tissue, whereas the remaining tissues were used for transcriptome construction.
Between 2020 and 2025, 124 individuals were collected in total from five representative geographic populations of B. lenok tsinlingensis across its distribution range in China (Fig. 1; Supplementary Table S1): Zhangxian (population A; n = 30; Gansu Province), Wushan (population C; n = 18; Gansu Province), Qinzhou (population D; n = 22; Gansu Province), Zhangjiachuan (population E; n = 23; Gansu Province), and Xunke-Sunwu (population P; n = 31; Heilongjiang Province). Genomic DNA from all individuals was extracted using the DNeasy Blood & Tissue Kit (Qiagen, Valencia, CA, USA) following the manufacturer's protocol. Whole-genome resequencing was performed on the MGISEQ platform (BGI, Shenzhen, China).
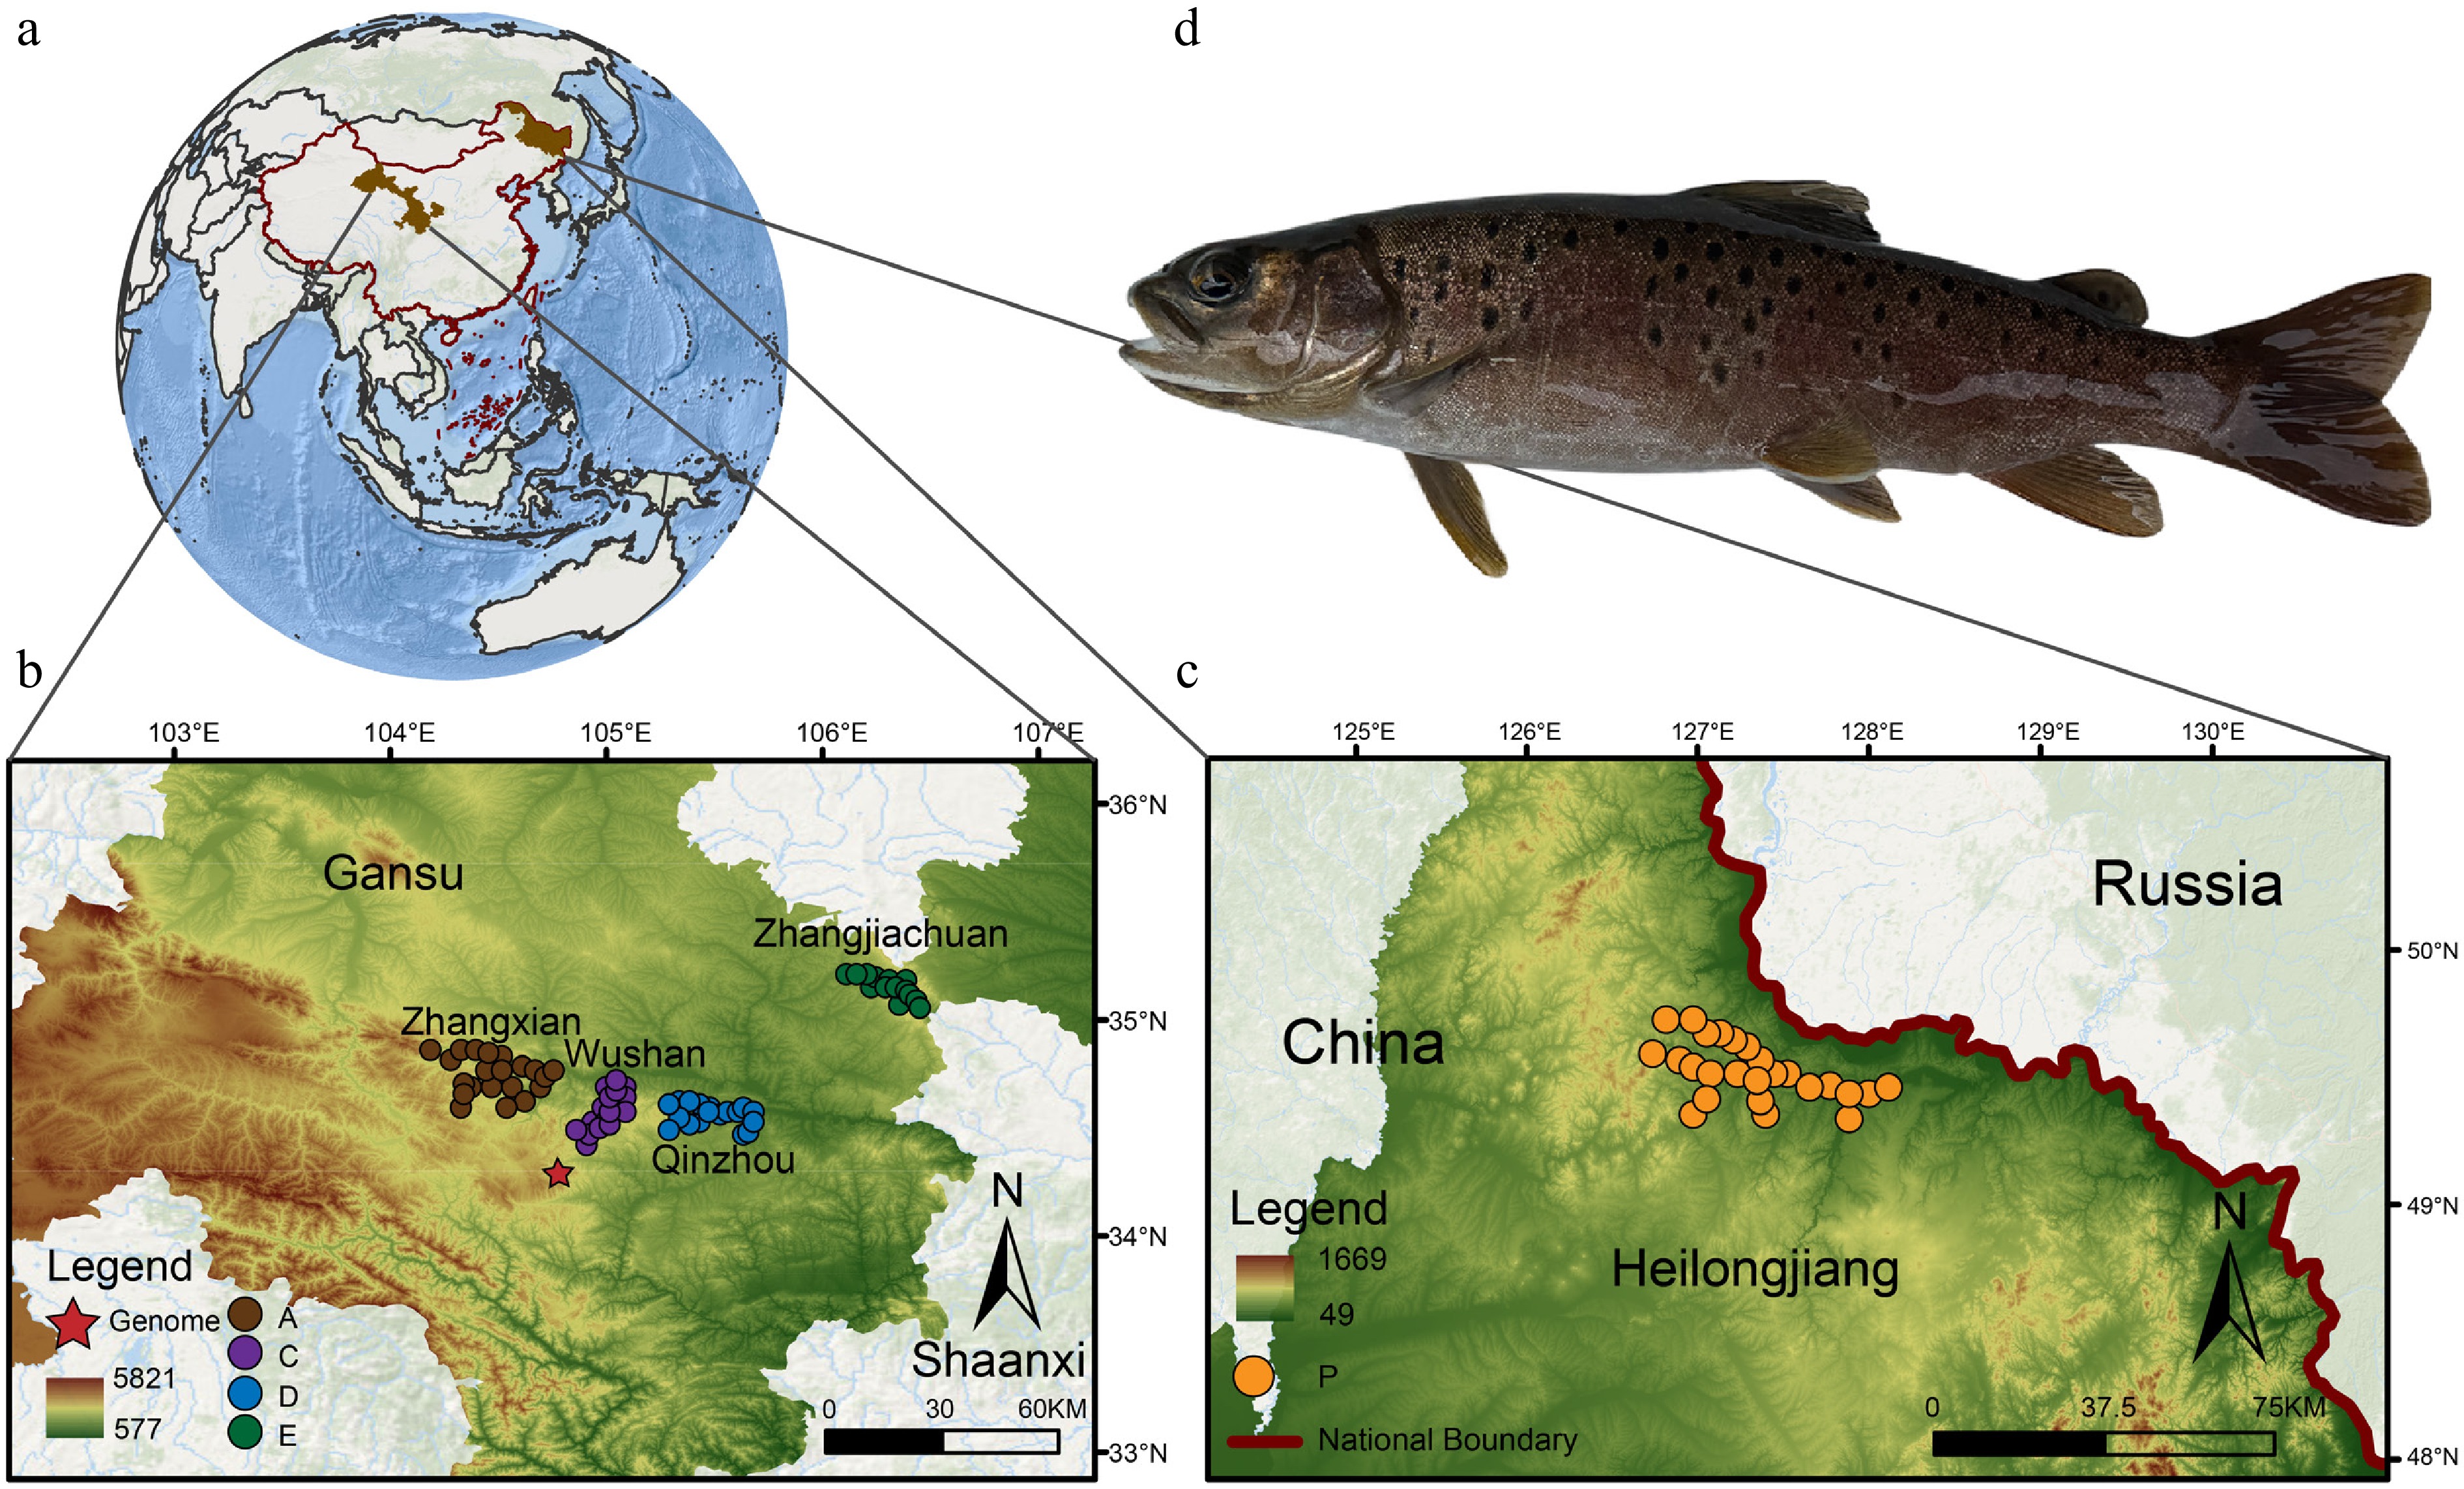
Figure 1.
Geographical distribution of Brachymystax lenok tsinlingensis. A total of 124 individuals were collected from five representative geographic populations of B. lenok tsinlingensis across its distribution range in China: Zhangxian (population A), Wushan (population C), Qinzhou (population D), Zhangjiachuan (population E), and Xunke-Sunwu (population P). (a) Geographical location of the sampling sites. (b) Locations of sampling sites for populations A, C, D, and E. (c) Locations of sampling sites for population P. (d) Morphological photos of B. lenok tsinlingensis. (Created with ArcMap 10.8; basemap sourced from the Geospatial Data Cloud,
www.gscloud.cn ).Genome sequencing, assembly, and evaluation
-
High-quality DNA was extracted from muscle tissue using the QIAGEN® Genomic Kit and subsequently subjected to PacBio HiFi sequencing, Illumina short-read sequencing, and Hi-C sequencing. Genome assembly was performed using the hifiasm assembler based on third-generation HiFi data. The hifiasm pipeline[19] includes three main steps: (1) error correction through an all-versus-all read alignment; (2) construction of a phased string graph based on overlapping sequences; and (3) generation of primary and alternate assemblies, with each representing different haplotypes when no phasing information is available. The draft genome was further polished using Illumina reads. Subsequently, Hi-C sequencing reads were aligned to the assembled genome using Bowtie v2.3.2 (parameters: '--end-to-end --very-sensitive -L 30')[20]. Scaffolding was then performed using LACHESIS (
http://shendurelab.github.io/LACHESIS/ ) based on the cleaned Hi-C reads, assembling the contigs into 40 pseudochromosomes.To assess the quality of the genome assembly, we used BUSCO analysis[21] based on the OrthoDB database, which identified approximately 96.54% of the conserved single-copy orthologs, indicating high completeness. Further validation was conducted by mapping the Illumina paired-end reads to the assembled genome (Supplementary Fig. S1) using BWA v0.7.12[22] and evaluating the mapping rate and sequencing depth using Samtools v1.4[23]. Additionally, minimap2 was used to map the Oxford Nanopore long reads to the genome for calculating the GC content and sequencing depth (Supplementary Figs S2 and S3).
Gene structure and function annotation
-
Simple sequence repeats (SSRs) were first identified using GMATA[24]. Tandem repeats were annotated using Krait and Tandem Repeats Finder (TRF). For dispersed repeats, transposable element (TE) libraries were constructed using MITE-Hunter[25] and LTR_finder[26], followed by TE identification using RepeatModeler (
www.repeatmasker.org ).Gene structure prediction was performed using a combined strategy incorporating ab initio, homology-based, and transcriptome-based approaches. The results from all three approaches were integrated using TSEBRA v1.1.1[27] to produce the final gene annotation. The untranslated regions (UTRs) were annotated using GUSHR v1.0.0 and GeMoMa v1.6.2[28] based on the transcriptome alignments.
Functional annotation of predicted protein-coding genes was performed by comparison against five databases: the Non-Redundant Protein Database (NR,
www.ncbi.nlm.nih.gov/ ), Kyoto Encyclopedia of Genes and Genomes (KEGG,www.kegg.jp/ ), Eukaryotic Orthologous Groups (KOG;www.ncbi.nlm.nih.gov/ ), Gene Ontology (GO,http://geneontology.org/ ), Swiss-Prot (www.uniprot.org/ ), and TrEMBL (www.uniprot.org/ ). Taxonomic distribution analysis of annotated genes revealed consistency between B. lenok tsinlingensis and its phylogenetically related species, indicating reliable annotation results (Supplementary Fig. S4).Whole-genome SNP calling and filtering
-
Raw sequencing reads were quality-controlled and filtered using fastp[29] to obtain clean reads. These reads were then aligned to the reference genome of B. lenok tsinlingensis using BWA-MEM v0.7.8[30]. The resulting alignments were sorted using Samtools v1.9 (parameters: '-sort')[31] and marked for duplicate reads using Sambamba v1.0.1 (parameters: -markdup')[32]. Potential PCR duplicates were subsequently removed using the MarkDuplicates tool in Picard v2.2 (
http://broadinstitute.github.io/picard ).Variant calling was performed using the HaplotypeCaller module in GATK v4.1.2.0 (parameters: '-ERC GVCF')[33]. All individual GVCF files were combined using CombineGVCFs, genotyped with GenotypeGVCFs, and filtered with SelectVariants to generate an initial candidate SNP set. A stringent filtering strategy was applied to retain high-confidence SNPs based on the following criteria: 'QD < 2, FS > 60, MQ < 40, MQRankSum < −12.5, ReadPosRankSum < −8.0, and StrandOddsRatio > 3.0.' Further filtering was performed using VCFtools v0.1.17[34] to retain SNPs with a genotype call rate > 80% (i.e., missing rate < 20%) and a Minor Allele Frequency (MAF) > 0.01. The resulting high-quality SNP dataset was used for downstream population genetic analyses (Supplementary Tables S2–S4).
SNP density across the genome was calculated and visualized using the CMplot v4.5.1 R package[35], which plotted the number of SNPs per 1 Mb window on each chromosome. SNP functional annotations were performed using the annotate_variation.pl script from ANNOVAR software[36].
Phylogenetic and population genetic analyses
-
Phylogenetic relationships among the geographic populations of B. lenok tsinlingensis were inferred using the maximum likelihood (ML) method implemented in IQ-TREE[37] based on the high-quality SNP dataset. Principal component analysis (PCA) was conducted using PLINK (parameters: '—pca')[38], which reduced dimensionality based on eigenvectors and eigenvalues to visualize population structure. Linkage disequilibrium (LD) patterns were analyzed using PopLDdecay v3.41 (default parameters)[39], and population genetic diversity parameters were calculated using VCFtools v0.1.16[34]. Population structure was further examined using ADMIXTURE v1.3.0[40] with the number of clusters (K) tested from one to four. The optimal K was determined based on the minimum cross-validation error.
Gene flow analysis and demographic history Inference
-
Gene flow events among B. lenok tsinlingensis populations were modeled using TreeMix v1.13[41], which infers migration events based on allele frequency covariance. The Dtrios function in Dsuite v0.4[42] was used to compute the D-statistics and f4-ratio statistics for detecting potential introgression signals. Historical changes in the effective population size (Ne) were inferred using the Pairwise Sequentially Markovian Coalescent (PSMC) model[41], which provided insights into the long-term demographic history of B. lenok tsinlingensis.
Gene screening and functional annotation
-
The predicted protein-coding gene set was functionally annotated by alignment against multiple databases, including Swiss-Prot (
www.gpmaw.com/html/swiss-prot.html ), Gene Ontology (GO,http://geneontology.org/ ), Kyoto Encyclopedia of Genes and Genomes (KEGG,www.genome.jp/kegg/ ), Pfam (protein domain database,www.ebi.ac.uk/interpro/ ), Eukaryotic Orthologous Groups (KOG,www.ncbi.nlm.nih.gov/ ), NCBI non-redundant protein database (NR,www.ncbi.nlm.nih.gov/ ), and TrEMBL (www.uniprot.org ). BEDTools v2.3[43] was used to detect candidate adaptive genes. The fixation index (FST) between populations was calculated using VCFtools v0.1.16[34] with a 10 kb sliding window and no overlap. Windows ranked within the top 5% of FST values were selected, and the clusterProfiler v4.0[33] tool was used to identify enriched GO terms and KEGG pathways associated with overlapping genes. -
Based on 373.43 Gb of Hi-C data, 65.33 Gb of HiFi data, and 48.12 Gb of next-generation sequencing data, we successfully constructed a chromosome-level genome assembly for wild B. lenok tsinlingensis. The final assembled genome size was 2.03 Gb with a contig N50 of 2,898,134 bp (Fig. 2a; Supplementary Tables S5–S7). In total, 40 pseudochromosomes were obtained, with lengths ranging from 28,608,702 bp to 112,269,073 bp (Supplementary Table S8). Benchmarking Universal Single-Copy Orthologs (BUSCO) analysis identified 3,514 complete single-copy genes with 96.54% completeness (Supplementary Table S9; Fig. 2b, c, e).
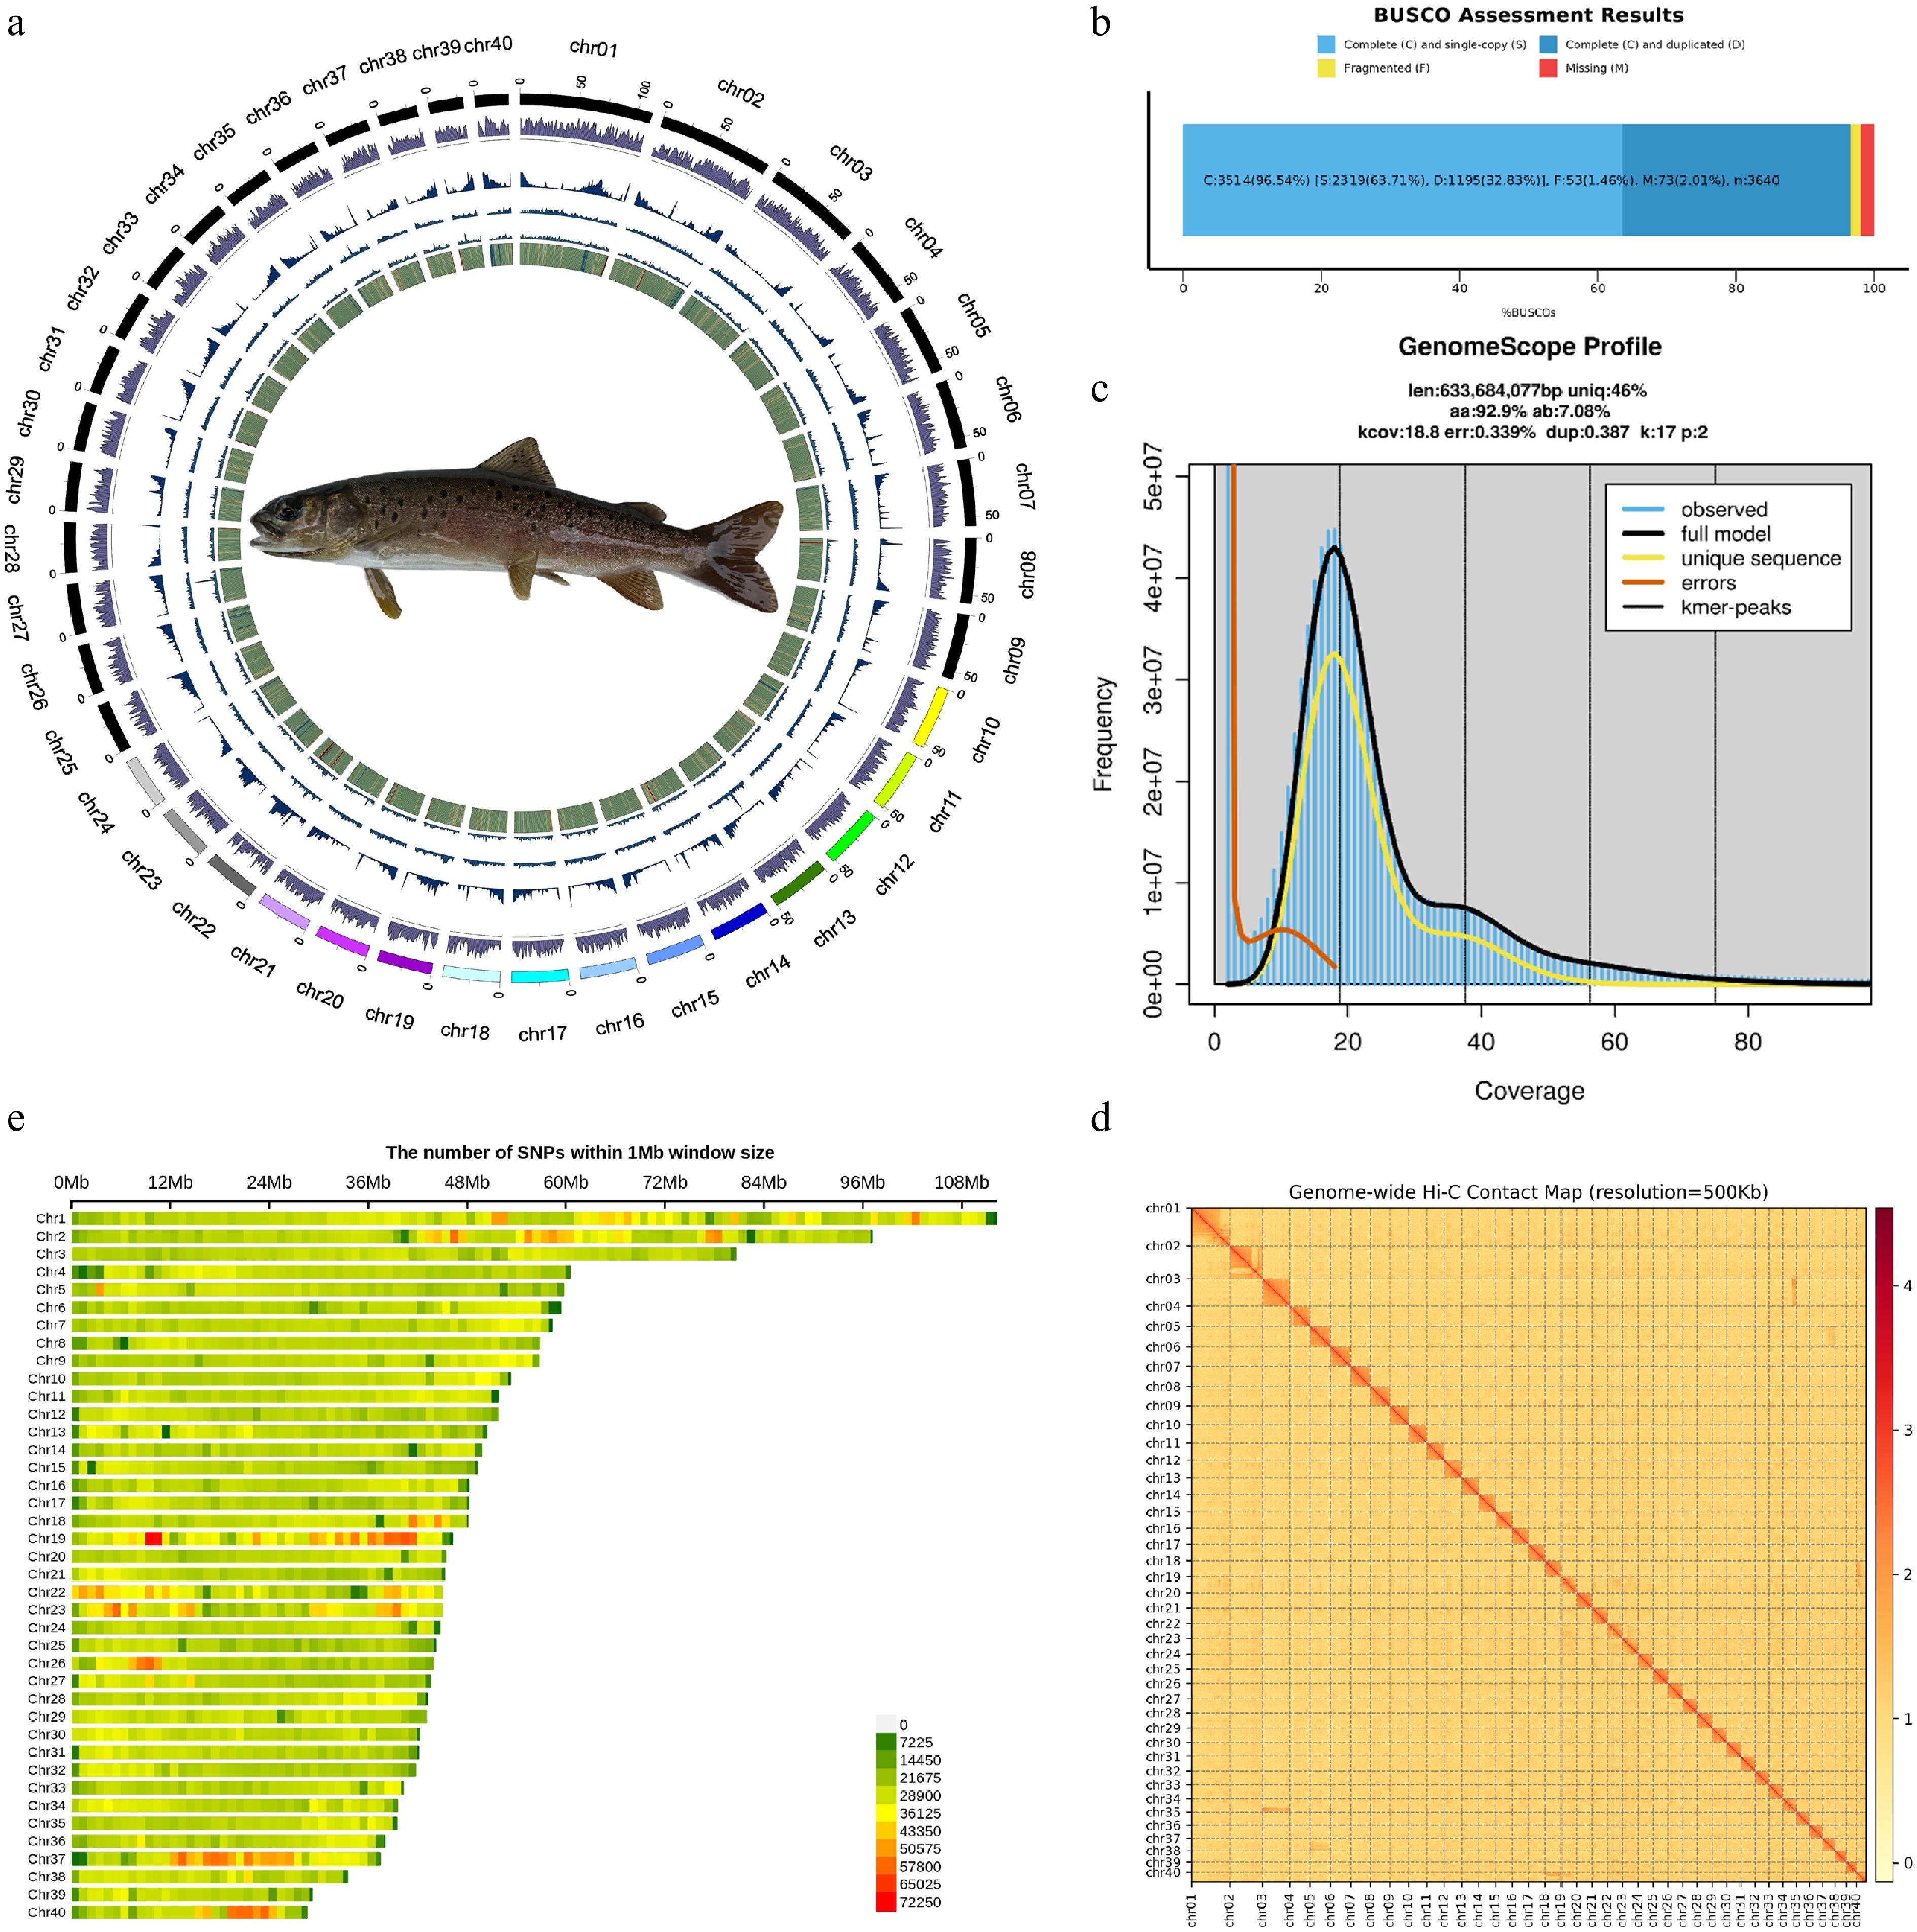
Figure 2.
Genome and SNP landscape of Brachymystax lenok tsinlingensis. (a) Landscape of B. lenok tsinlingensis, from the innermost to the outermost layer, as follows: GC content, Copia TEs, Gypsy TEs, repeat, and gene density. (b) BUSCO assessment of genome assembly completeness. (c) Genome survey of B. lenok tsinlingensis based on K-mer analysis, the genome size was estimated to be 633.68 Mb with a duplication rate of 0.39%. (d) Hi-C contact map revealing extensive hierarchical chromatin interactions in the genome of B. lenok tsinlingensis. (e) Chromosomal distribution of identified single-nucleotide polymorphisms.
In total, 1,150,613,860 bp (56.61%) of repetitive sequences were annotated, with DNA transposons (29.12%), long interspersed nuclear elements (LINEs; 14.91%), and long terminal repeats (LTRs, 5.73%), which were the three most abundant classes of repeats (Supplementary Table S10). We predicted 44,212 protein-coding genes with an average gene length of 20,111.40 bp, and annotated 96,614 non-coding RNAs (ncRNAs) (Supplementary Tables S11, S12). Functional annotation based on Swiss-Prot, NR, TrEMBL, KOG, GO, and KEGG databases assigned putative functions to 43,380 genes (98.12%) (Supplementary Table S13; Supplementary Fig. S4). Additionally, BUSCO assessment of protein-coding genes showed that 93.85% had functional annotations (Supplementary Table S14).
We performed whole-genome resequencing on 124 individuals from five representative geographic populations of B. lenok tsinlingensis across China based on the high-quality reference genome, including Zhangxian (A; n = 30), Wushan (C; n = 18), Qinzhou (D; n = 22), Zhangjiachuan (E; n = 23), and Xunke-Sunwu (P; n = 31) (Fig. 1; Supplementary Table S1). In total, 1.92 billion clean reads were generated, yielding 28,324,567 genome-wide single-nucleotide polymorphisms (SNPs), which were unevenly distributed across the 40 chromosomes (Fig. 2e; Supplementary Tables S2–S4).
Phylogenetic relationships and population structure
-
We constructed a phylogenetic tree encompassing all five populations (Fig. 3a) based on the SNP dataset. The Zhangxian population (A) was positioned at a distinct basal branch, clearly separated from the other four clades. Nested clustering was observed for the clades of Wushan (C) and Qinzhou (D), with further nesting between Qinzhou (D) and Zhangjiachuan (E). Most individuals from the Xunke-Sunwu (P) clade formed a separate lineage. Phylogenetic analysis revealed an intermixed topological structure among non-A groups. Principal component analysis (PCA) further supported these findings with PC1 explaining 64.17% of the total variation, distinctly separated group A from the others, whereas the C, D, E, and P populations were clustered tightly (Fig. 3b).

Figure 3.
Population structure of 124 individuals from five representative geographic populations of Brachymystax lenok tsinlingensis. (a) Phylogenetic tree constructed using whole-genome SNPs from five geographic populations. (b) Principal component analysis of the five geographic populations. (c) Linkage disequilibrium (LD) decay pattern of different groups. (d) Cross-validation error rate value of ADMIXTURE analysis from K = 1 to K = 8 for all B. lenok tsinlingensis. (e) Population structure analysis based on whole-genome SNPs, with K values ranging from 2 to 4.
Linkage disequilibrium (LD) decay patterns varied among populations (Fig. 3c). Group A showed the fastest LD decay and lowest r2 values, whereas populations C, D, and E showed higher levels of LD. Nucleotide diversity (π) estimates based on the five SNP datasets (Supplementary Table S3) showed that population A had the highest nucleotide diversity (π = 3.174 × 10⁻³), whereas population P had the lowest (π = 6.376 × 10⁻⁴).
Population structure analysis using ADMIXTURE (Fig. 3d, e) revealed genetic patterns across K = 2 to K = 4. Group A was clearly separated from all other populations when K = 2, with the lowest cross-validation error (Fig. 3d). At K = 3, population C was distinguished further, and at K = 4, genetic heterogeneity was observed within the D, E, and P populations. Several individuals showed signs of genetic admixture, especially in Groups 3 and 5, implying historical hybridization or gene flow.
Population history and inference of gene flow
-
To further elucidate the evolutionary history and potential gene flow among populations, we applied TreeMix to infer historical migration events, calculated population genetic divergence (FST), and reconstructed demographic history using the PSMC model (Fig. 4).
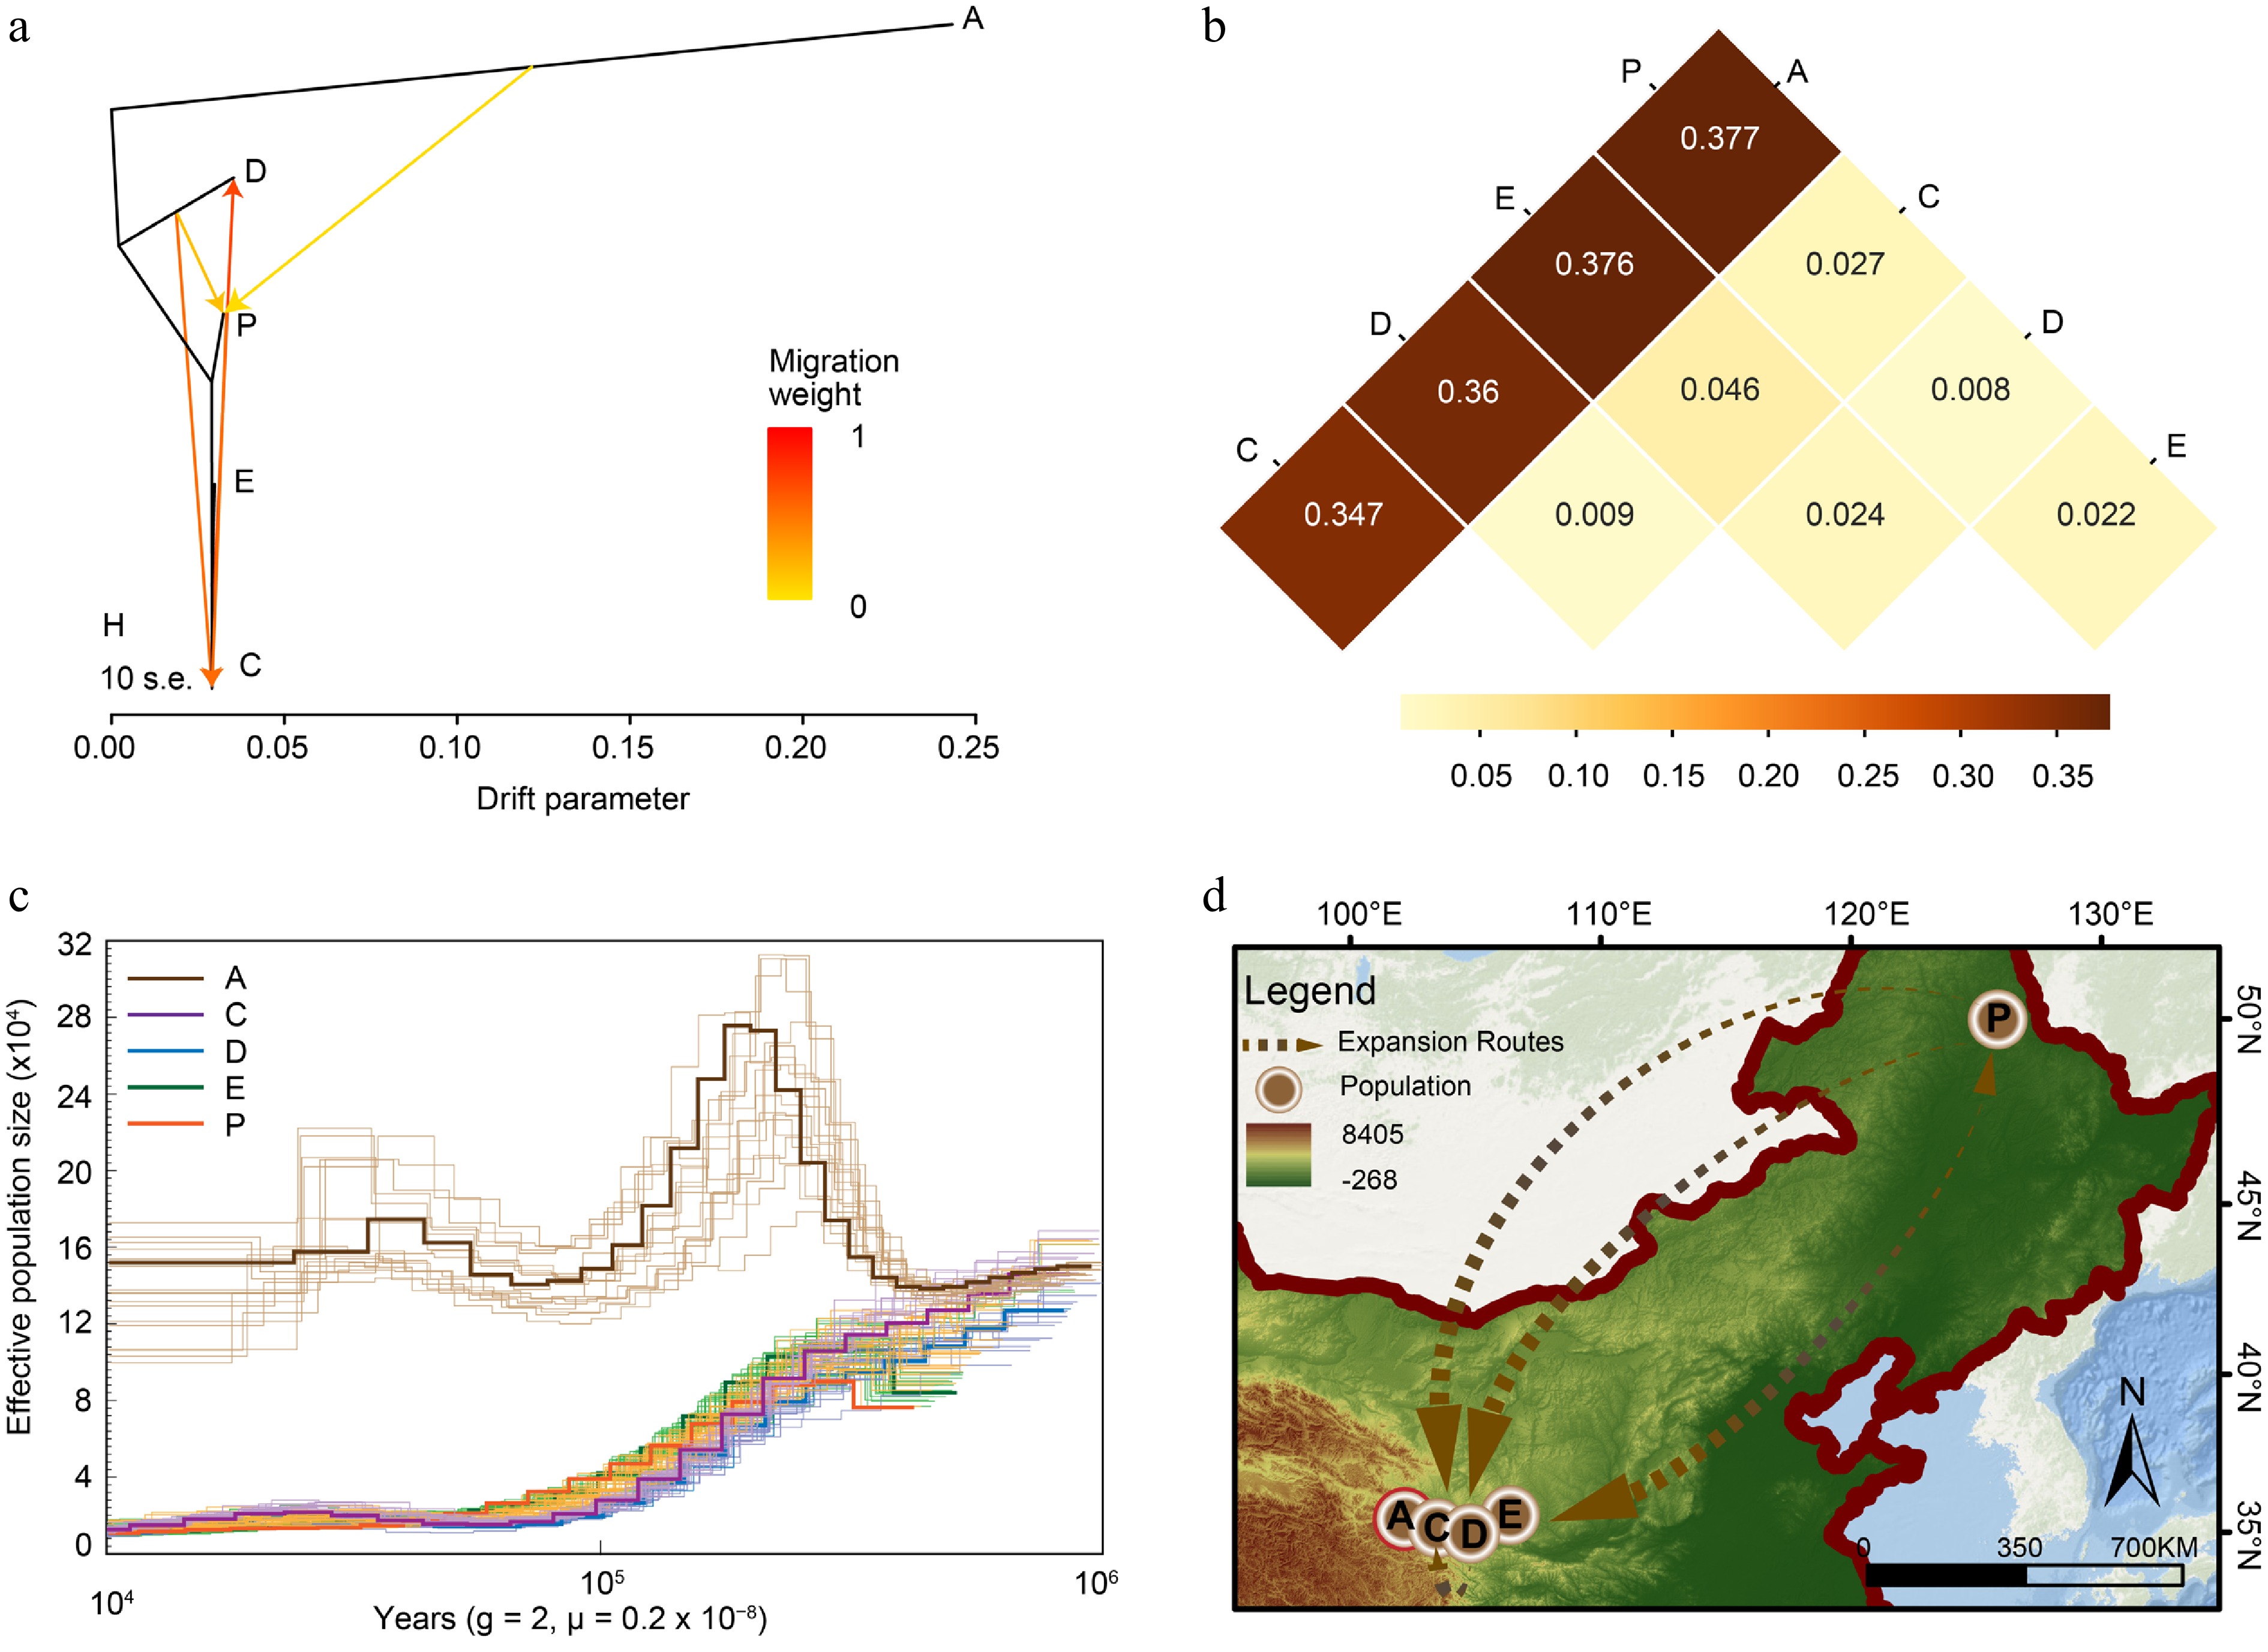
Figure 4.
Demographic history of Brachymystax lenok tsinlingensis. (a) Introgression among different populations of four migrations using TreeMix. (b) The fixation index (FST) between different populations, and the numbers in the squares represent FST values. (c) Pairwise Sequentially Markovian Coalescent (PSMC) analysis revealed the demographic history of the five geographic populations. (d) Postulated evolution center and expansion routes of B. lenok tsinlingensis in China. (Created with ArcMap 10.8; basemap sourced from the Geospatial Data Cloud,
www.gscloud.cn ).TreeMix analysis revealed distinct population divergence patterns and multiple significant migration events (Fig. 4a; Supplementary Figs S5–S7. The first three migration events indicated gene flow from population P to C, from A to D, and from E to A and P. In the fourth migration event, group A showed a long branch, suggesting a strong genetic drift and prolonged isolation, whereas C, D, E, and P were clustered tightly with several migration edges. Notably, the gene flow from P to D and E was especially pronounced.
Pairwise FST estimates (Fig. 4b) confirmed substantial genetic differentiation between group A and all other populations (~0.347–0.377), supporting its independent evolutionary trajectory and the phylogenetic results. In contrast, FST values among groups C, D, E, and P were low (< 0.046), indicating close genetic relationships. PSMC-based demographic reconstructions (Fig. 4c) showed a significant population expansion in group A between ~ 100,000 and 600,000 years ago, with a historically higher effective population size (Ne) compared with that in the other groups. In contrast, the C, D, E, and P groups showed similar demographic trajectories, with a continuous increase in Ne beginning around 20,000 years ago.
Reconstruction of the historical effective population size (Ne) using the PSMC model (Fig. 4c, d) revealed a notable population expansion in population A between 100,000 and 600,000 years ago, with consistently higher Ne values than those of other populations, suggesting a distinct demographic history. However, populations C, D, E, and P showed similar historical Ne trajectories, with a continuous increase beginning approximately 20,000 years ago.
Gene family expansion and population differentiation
-
Candidate genes located in putative selective regions of populations A and P were subjected to multi-database functional annotation and comparative analysis to further explore the potential functional differences between populations. We found 138 genes in the intersection of all databases (NR, TrEMBL, KOG, Pfam, GO, KEGG, and Swiss-Prot) in population A (Fig. 5a–c), whereas cross-annotation of population P revealed 199 genes consistently annotated across multiple databases (Fig. 5d–f). Chromosomal localization of these candidate genes revealed significant enrichment on chromosomes 1, 2, and 3 (Fig. 2e).
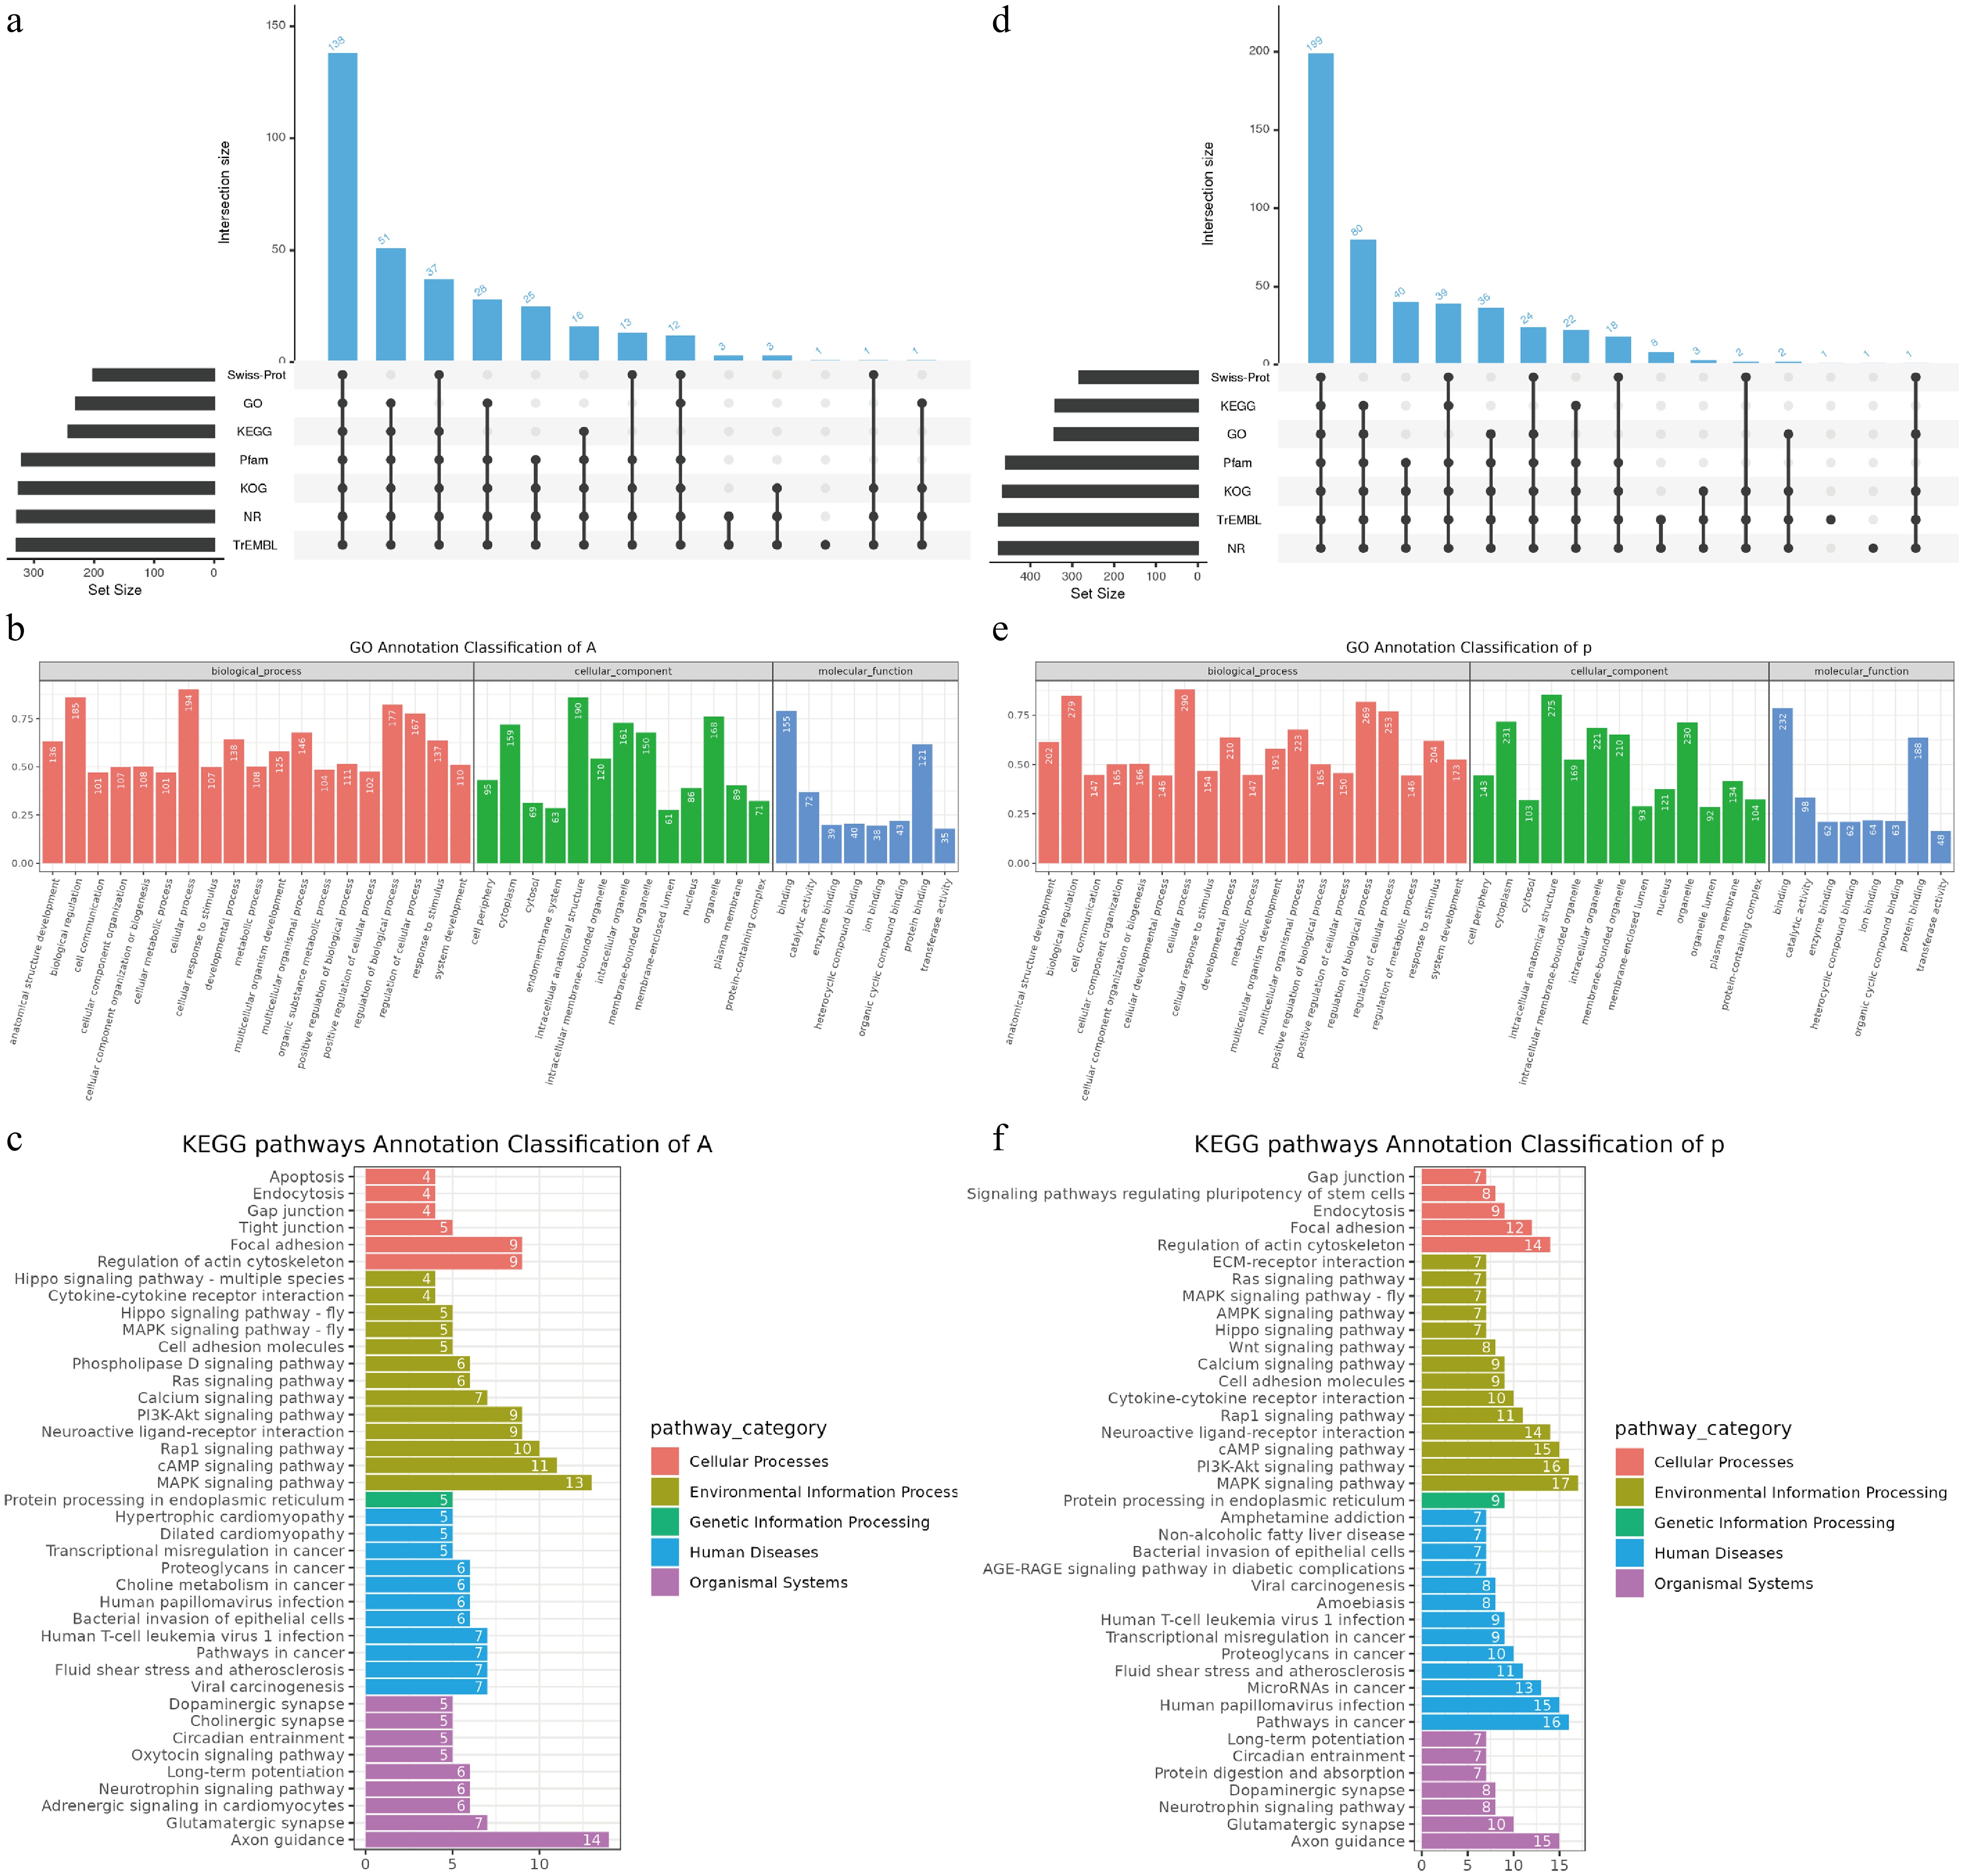
Figure 5.
Population-specific functional enrichment and gene annotation. The upset bar plots show (a) the functional, (b) GO, and (c) KEGG pathway annotation of population A, and (d)–(f) population P.
Gene Ontology (GO) annotation was performed separately for the two populations and summarized across three major functional categories to characterize the functional attributes of these candidate genes: Biological Process (BP), Cellular Component (CC), and Molecular Function (MF). In the BP category, population A genes were mainly enriched in cellular process (194) and biological regulation (185); in the MF category, population A genes were predominantly enriched in binding (155) and protein binding (121) (Fig. 5b); however, population P showed a greater number of genes enriched in these two categories (Fig. 5e). In the CC category, population A genes were primarily enriched in intracellular anatomical structure (190) and organelle (168), whereas population P genes were largely enriched in intracellular anatomical structure (275) and cytoplasm (231) (Fig. 5b, e). KEGG pathway enrichment analysis was conducted to investigate the potential roles of candidate genes in metabolic and signaling networks. The annotated pathways were classified according to the KEGG hierarchical system, covering functional modules such as Cellular Processes (CP), Environmental Information Processing (EIP), and Organismal Systems (OS). Population P had a greater number and diversity of enriched pathways compared with those of population A (Fig. 5c, f), particularly in the EIP, CP, and OS categories. Notably, population P genes were significantly enriched in signaling pathways regulating the pluripotency of stem cells (eight genes), suggesting potential roles in cell differentiation and developmental regulation. In addition, they were more widely distributed in the Human Diseases (HD) module, involving a total of 13 disease-related pathways (Fig. 5f), indicating enhanced capacities for environmental adaptation and stress response.
-
B. lenok tsinlingensis is a cold-water fish species endemic to riverine ecosystems in northwestern and northeastern China; it represents a glacial relict species that migrated southward during the Pleistocene[44]. Owing to its strict habitat requirements and limited population size, it is recognized as a flagship species for environmental monitoring and has attracted considerable attention from conservationists and the public[9,45]. However, these lineages occupy different geographic regions; their phylogeographic relationships and evolutionary history remain unresolved and warrant further investigation. The long-term implementation of artificial propagation and release (stock enhancement) programs provides a unique opportunity to assess the genetic impacts of such practices and to monitor germplasm stability using B. lenok tsinlingensis as a model. In this study, we assembled a high-quality chromosome-level reference genome and conducted population resequencing of 124 individuals across northwestern and northeastern China (Figs 1 and 2). This integrative genomic analysis elucidated the evolutionary history, population structure, and genetic diversity patterns of B. lenok tsinlingensis. Our findings provide valuable insights into the consequences of geographic isolation, stock enhancement, and potential gene flow in shaping the genomic landscape of this endemic species.
Genomic resources of B. lenok tsinlingensis
-
The assembly of a local reference genome is essential. Specifically, utilizing a local reference genome enhances mapping efficiency and improves genotyping accuracy, thereby effectively retaining a greater volume of higher-quality data[46,47]. Although the genome of the B. tsinlingensis was reported by Zhu et al.[37], which revealed distinctive GC content, codon usage bias, and a relatively slow evolutionary rate, the origin of their samples, collected from the Qinling Mountains in Shaanxi, remains unclear. Whether those populations were influenced by nearby industrial or anthropogenic activities remains uncertain. In contrast, the specimens used in the present study were obtained from a well-preserved mountainous region with no history of artificial breeding or release, ensuring minimal human interference. Compared with the previously published assembly, the genome assembled in this study showed improved quality. Genome completeness assessed using BUSCO increased by 1.25% (96.54% vs 95.29%). Further, the assembled chromosomes exhibited longer lengths (28,608,702–112,269,073 bp vs 23,778,729–111,498,818 bp) and a slightly lower GC content (42.61% vs 43.03%). Given these geographic, environmental, and quality distinctions, our genome assembly serves as an important complement to that of Zhu et al. [18], providing a genetically pure and ecologically representative resource for further studies on B. lenok tsinlingensis and other species (Fig. 2a).
Taxonomic status and genetic structure differentiation
-
Considering B. lenok tsinlingensis a subspecies of Brachymystax raises questions about the status of other (sub)species of B. lenok. However, whether B. lenok tsinlingensis represents a distinct subspecies remains contentious. Although Xing et al. redescribed B. tsinlingensis Li, 1966 as a valid species[48], this conflicts with the classification in FishBase, where it is still regarded as a subspecies. Based on genome-wide genetic analyses, our study tends to support the view that B. lenok tsinlingensis is a species complex, with the Zhangxian population (A) representing an independent lineage and the remaining populations forming another composite lineage. However, this inference is based primarily on genomic differentiation (e.g., FST = 0.347 – 0.377). Incorporating additional lines of evidence, such as morphological characteristics, ecological niche divergence, comparative analyses of phenotypic variation among populations (e.g., body size and reproductive strategies), and hybridization experiments to test reproductive isolation, would further strengthen and refine this taxonomic classification. This interpretation differs from previous studies that recognized B. lenok tsinlingensis as a valid single species based on the external morphology (e.g., the sharp snout phenotype) reported by Froufe et al.[49] and molecular studies based on mtDNA D-loop sequences[6]. Establishing its taxonomic status allows future research to focus on lineage identification and assess the extent of differentiation throughout the evolutionary history of the species.
Population A (Zhangxian) displays marked phylogenetic distinctiveness and is positioned closer to the root in the phylogenetic tree while exhibiting higher genetic diversity relative to that of other populations (Fig. 3a, e). As evidenced by the Tertiary relict organisms described by Qiu et al.50], a higher genetic diversity, together with population contraction and expansion, will lead to the formation of 'suture zones' in the geographic lineages of certain taxa. Thus, our findings support the interpretation that Population A represents an ancient independent lineage. Higher genetic diversity is typically associated with a larger effective population size (Ne) and a more stable ecological environment, whereas faster LD decay reflects more active gene exchange and potential for historical expansion[51].
In contrast, the Xunke-Sunwu population (P) showed the lowest nucleotide diversity. At K = 3, certain levels of internal genetic heterogeneity and admixture components were observed in Populations C (Wushan), D (Qinzhou), E (Zhangjiachuan), and P (Xunke-Sunwu County), indicating that it may have experienced past bottlenecks, population contraction, or anthropogenic interventions[52]. Alternatively, these patterns may indicate local interspecific hybridization, or they may indicate that historical migration events occurred in these regions[53,54]. Zhang et al.[55] also observed this phenomenon of lineage admixture; however, owing to limitations in sampling scale, they only recommended strictly prohibiting stock enhancement between the two neighboring regions of Gansu and Shaanxi. ADMIXTURE analysis assumes Hardy–Weinberg equilibrium and linkage equilibrium among loci. However, natural populations often deviate from these assumptions owing to factors such as population structure, genetic drift, selection, and non-random mating. To minimize these potential biases, the SNP dataset was filtered to remove low-quality loci, and the model was run under multiple K values before further analysis. Despite these precautions, some deviation may still occur in natural populations. Therefore, the inferred admixture proportions should be interpreted cautiously and considered together with other analyses, such as PCA and phylogenetic relationships, which provide complementary evidence for population structure. In contrast, the present study suggests that the scale of original stock enhancement should encompass the Heilongjiang population, as the extensive lineage mixing observed across geographical scales may be attributed to stock enhancement. These contrasting patterns indicate that different geographic populations may have undergone distinct historical processes and environmental selection pressures during their long-term evolution.
Inferred gene flow and evolutionary history
-
Geographical isolation and the implementation of stocking activities may have shaped the complex gene flow patterns and evolutionary histories observed among populations. Population A (Zhangxian) was located on a long branch in the phylogenetic tree and showed strong signals of genetic drift, supporting its status as a historically isolated and evolutionarily independent group[6]. The significantly higher FST values (~0.347–0.377) between population A and the other populations further confirmed its deeply divergent genetic position. Combined with the PSMC model (Fig. 4c), the historical effective population size of population A showed a significant expansion between 100,000 and 600,000 years ago and maintained a relatively high Ne, consistent with its observed high diversity and high recombination rate. Zhang et al., through mitochondrial D-loop gene analysis, found that B. lenok tsinlingensis (Zhangxian) also harbors unique haplotypes, which they attributed to the limited dispersal ability of the species and the obstruction of gene flow pathways in this region. This suggests that population A may have been less affected by bottleneck events during evolution, possesses richer genetic variation, and has remained in a relatively stable and isolated state over time[56].
In contrast, populations C, D, E, and P showed multidirectional gene flow events in TreeMix analysis, with particularly notable migration paths from population P to populations C, D, and E (Fig. 4d). This suggests that the Heilongjiang region may be an important source area for multiple artificial releases or natural dispersals. However, to quantitatively assess the impact of these activities on population genetic structure, the relative contributions of artificial selection (e.g., hatchery breeding) and natural dispersal to the observed patterns of gene flow need to be further disentangled. This pattern of gene flow contributed to hybridization and genetic contamination in the Gansu region (C, D, and E), resulting in lower FST values (< 0.046) among these populations and explaining their blurred genetic boundaries and high levels of admixture[57]. TreeMix captures relatively recent gene flow events among populations, whereas PSMC reconstructs long-term demographic history over deeper evolutionary timescales. The apparent discrepancy between the relatively stable effective population size (Ne) of the Heilongjiang population and its role as a source in recent gene flow events should be interpreted in the context of the temporal scale of gene flow. This suggests that the population may have maintained a relatively stable size while still contributing genetic material to other populations through episodic dispersal or secondary contact. Although this genetic introgression may increase genetic variability in the short term[58], it could also disrupt local adaptation[59], dilute region-specific genetic markers, and increase the risk of germplasm degradation.
Notably, the PSMC model results showed that the historical effective population sizes of populations C, D, E, and P began to increase continuously around 20,000 years ago, suggesting that they may have benefited from warming climates and habitat expansion following the Last Glacial Maximum, leading to population recovery and the accumulation of genetic diversity[51,60−62]. However, compared with population A, these populations appear to have been more affected by exogenous gene flow throughout history, resulting in more complex and dynamic genetic structures.
Adaptive genetic differentiation
-
Under distinct environmental conditions, many genes are likely subjected to different selective pressures and physiological demands during adaptive evolution, ultimately shaping divergent physiological and functional strategies[63]. Considering the differences in their habitats, such divergence may indicate ecological differentiation between the two populations at the functional genomic level. The GO annotation results further revealed functional differences between populations. Whether related to genes maintaining basic cellular activities, regulating the cell boundary and cytoplasmic homeostasis, or mediating metabolic activity and molecular recognition, population P consistently showed a greater number of enriched target genes across all three GO categories (Fig. 5c, e). Similar environment-driven genetic differentiation has been reported in Schizopygopsis younghusbandi[64], supporting the notion that these differences are influenced by environmental regulation. Considering the distinct habitats of the two populations, these adaptive changes (particularly those related to neural and metabolic processes) are likely to be further enhanced under harsher environmental conditions.
KEGG pathway enrichment results further highlighted that population A achieves adaptive evolution primarily by maintaining fundamental life processes (Fig. 5c), suggesting that it may be better suited to relatively stable ecosystems with constant resource availability. In contrast, the candidate genes in population P were more frequently involved in complex biological processes, such as cytoskeleton regulation, cell communication, immune response, and maintenance of pluripotency (Fig. 5f). This indicates that population P may possess stronger biological potential for coping with external environmental disturbances, regulating tissue development, and defending against infections, implying that it may experience more complex and fluctuating ecological pressures, such as frequent pathogen exposure, resource variability, or extreme environmental stress. This strong population-level selection pattern is consistent with findings in Schizothorax oconnori[63] and Glyptosternum maculatum[65]. Against this ecological backdrop, population P appears to have evolved a more plastic adaptive strategy by enhancing its capacity for detecting and responding to environmental signals.
Several limitations should be acknowledged in this study. For instance, although Zhu et al. (GCA_030435695.1) constructed a chromosome-level genome of B. tsinlingensis, owing to limitations in the origin of their samples, we did not include their genome for comparative analysis. This study was based on whole-genome resequencing data and did not account for the effects of structural variations. Further, our sampling sites only covered regions within China, with no specimens collected from Russia or Inner Mongolia because of logistical constraints. Consequently, comparing the genetic and evolutionary relationships among B. lenok tsinlingensis populations from other parts of the world was not possible. These aspects will be prioritized in follow-up studies.
-
The genetic characteristics of B. lenok tsinlingensis across different geographic populations reflect its complex evolutionary history, which is shaped by natural selection, geographic isolation, and anthropogenic interventions. B. lenok tsinlingensis constitutes a complex species whose lineage differentiation began during the glacial period, and all populations experienced a significant expansion event between 100,000 and 600,000 years ago. Population A may represent a more ancestral and stable genetic unit, and its marked genetic differentiation and independent population dynamics indicate a high conservation value. It should thus be prioritized for conservation and managed as a valuable broodstock resource. Population P may have undergone multiple rounds of artificial selection (e.g., in hatchery breeding), thereby developing greater biological potential to cope with environmental disturbances, regulate tissue development, and resist infections. In contrast, other populations may have been affected by genetic admixture resulting from both artificial propagation and natural dispersal. In these populations with mixed genetic backgrounds, continuous genetic monitoring is urgently needed to assess their long-term adaptive potential and genetic stability. Although artificial release has played a positive role in restoring population sizes and supporting fisheries, we caution against its potential genetic risks, particularly in cases involving the cross-basin propagation observed in this study. Therefore, short-term augmentation goals need to be balanced with long-term genetic sustainability.
In conclusion, this study provides a high-quality genomic resource and comprehensive population genetic assessment for B. lenok tsinlingensis, offering a theoretical foundation and technical support for future conservation strategies, broodstock selection, and propagation management. Moreover, the analytical framework established here can be broadly applied to other aquatic species subjected to artificial propagation interventions, thus contributing to their scientific advancement.
-
Not all the sampling sites were privately owned or protected, and field sampling did not involve protected species. The fish collection process complied with the guidelines of the Gansu Fisheries Research Institute. This study was approved by Gansu Key Laboratory of Cold Water Fishes Germplasm Resources and Genetics Breeding (B20200103-01; dated January 03, 2020). All animals and experiments were conducted in accordance with the 'Guidelines for Experimental Animals' of the Ministry of Science and Technology (Beijing, China).
-
The authors confirm contribution to the paper as follows: sample collection and preparation: Jiang C, Zhang Y, Wang T; bioinformatics analysis, draft manuscript preparation: Jiang C, Wang T; manuscript revision: Jiang C, Du Y, Wang T. All authors contributed to manuscript revision, reviewed the results and approved the final version of the manuscript.
-
The data of Brachymystax lenok tsinlingensis has been submitted to GenBank (www.ncbi.nlm.nih.gov/genbank/) under BioProject No. PRJNA1279617. The sequencing data from PacBio HiFi, NGS, Hi-C, and transcriptomic sequencing data (muscle, brain, gonads, liver, and heart) have been deposited in the NCBI Sequence Read Archive database (www.ncbi.nlm.nih.gov/sra) with accession group numbers SRR34077033–SRR34077040. The assembled genome and annotation of Brachymystax lenok tsinlingensis were deposited at Figshare (https://figshare.com/, Jiang, 2025).
-
Major Science and Technology Project of Gansu Province (Grant No. 25ZDNA006). Finance Special Project of Ministry of Agriculture and Rural Affairs (Grant No. HDC-2023-02). Gansu Province Innovation Base and Talent Plan Project (Grant No. 21JR7RA720). Gansu Province technology innovation guidance program (Grant No. 23CXNA0029). We acknowledge the contributions of all collaborators and their institutions.
-
The authors declare that they have no conflict of interest.
- Supplementary Table S1 Sample information of 124 Brachymystax lenok tsinlingensis individuals in this study.
- Supplementary Table S2 Sequencing data quality information of 124 Brachymystax lenok tsinlingensis individuals in this study.
- Supplementary Table S3 Parameters of genetic diversity within populations of 124 Brachymystax lenok tsinlingensis individuals in this study.
- Supplementary Table S4 Pairwise Fst values among Brachymystax lenok tsinlingensis populations.
- Supplementary Table S5 Summary of WGS genome sequencing data.
- Supplementary Table S6 Summary of HIFI genome sequencing data.
- Supplementary Table S7 Statistics information of Brachymystax lenok tsinlingensis genome assembly.
- Supplementary Table S8 Hi-C assembly results of Brachymystax lenok tsinlingensis genome.
- Supplementary Table S9 Statistics information of BUSCOs for Brachymystax lenok tsinlingensis genome.
- Supplementary Table S10 Statistics information of repeat element annotation for Brachymystax lenok tsinlingensis genome.
- Supplementary Table S11 Protein-coding gene annotation statistics for Brachymystax lenok tsinlingensis.
- Supplementary Table S12 Non-coding RNA annotation statistics of Brachymystax lenok tsinlingensis genome.
- Supplementary Table S13 Statistics information of gene functional annotation.
- Supplementary Table S14 Statistics information of protein-coding BUSCOs assessment for Brachymystax lenok tsinlingensis genome.
- Supplementary Fig. S1 Sequencing depth and cumulative coverage distribution of Illumina short reads mapped to the assembled genome.
- Supplementary Fig. S2 GC content versus sequencing depth distribution across the assembled genome.
- Supplementary Fig. S3 Comparative distribution of gene structural features between Brachymystax lenok tsinlingensis and closely related species.
- Supplementary Fig. S4 The upset bar plot showed that the functional annotation of the protein-coding genes in the genome of Brachymystax lenok tsinlingensis.
- Supplementary Fig. S5 Introgression among different populations of 1 migration using TreeMix.
- Supplementary Fig. S6 Introgression among different populations of 2 migration using TreeMix.
- Supplementary Fig. S7 Introgression among different populations of 3 migration using TreeMix.
- Copyright: © 2026 by the author(s). Published by Maximum Academic Press, Fayetteville, GA. This article is an open access article distributed under Creative Commons Attribution License (CC BY 4.0), visit https://creativecommons.org/licenses/by/4.0/.
-
About this article
Cite this article
Jiang C, Du Y, Zhang Y, Wang T. 2026. Chromosome-level genome assembly and population genomic analysis provide insights into the genetic diversity and adaptation of Brachymystax lenok tsinlingensis in China. Genomics Communications 3: e008 doi: 10.48130/gcomm-0026-0007 

Chromosome-level genome assembly and population genomic analysis provide insights into the genetic diversity and adaptation of Brachymystax lenok tsinlingensis in China
- Received: 23 January 2026
- Revised: 27 March 2026
- Accepted: 14 April 2026
- Published online: 24 April 2026
Abstract: Brachymystax lenok tsinlingensis, a cold-water fish endemic to China, has undergone a severe population decline because of habitat fragmentation and overfishing. We generated a high-quality 2.03 Gb reference genome of B. lenok tsinlingensis, a freshwater salmonid species within the genus Brachymystax, and anchored it to 40 autosomes. Universal single-copy orthologs (BUSCO) assessment yielded a completeness estimate of 96.54% for this assembly; further, we resequenced 124 individuals from five geographic populations across northwestern and northeastern China to systematically analyze the evolutionary history, population structure, and genetic diversity patterns of the species. The results revealed that B. lenok tsinlingensis constitutes a species complex whose lineage differentiation began during the Last Glacial Maximum, with the Zhangxian population showing pronounced genetic differentiation and exhibiting a more stable genetic structure. This suggests a more ancestral and genetically stable lineage that should be prioritized for conservation. The Heilongjiang Basin may serve as a major genetic source region owing to repeated artificial selection (e.g., in hatchery breeding) or natural dispersal. Moreover, the populations originating from this region harbor a higher diversity of gene families associated with environmental stress, developmental regulation, and immune response. In contrast, other populations may have been affected by genetic admixture resulting from both artificial propagation and natural dispersal. Overall, this study provides comprehensive insights into the genetic structure and population dynamics of B. lenok tsinlingensis and emphasizes the necessity of germplasm resource conservation. The evaluation framework established herein offers theoretical foundations and technical support for genetic monitoring of germplasm and management of other aquatic species affected by artificial propagation efforts.
-
Key words:
- Genome /
- Population /
- Genetic diversity and evolution /
- Brachymystax lenok tsinlingensis