


-
Gastrointestinal cancers (GICs) are malignant diseases directly damaging the digestive tract and digestive subsidiary organs including the stomach, bile duct system, pancreas, small intestine, colon, rectum, and anus. In 2021, there were approximately 5.26 million incidences of GIC and 3.70 million deaths from GIC worldwide[1]. Because of the aging of the population, changes in nutrition and lifestyle, genetics, environmental factors, and the inequality in cancer control, GICs have become more prominent cancers in China, contributing to a heavy burden of cancer for both sexes and it was one of the leading causes of mortality in 2020[2,3]. According to the Global Cancer Data (GLOBOCAN) in 2020, China accounted for 41% of global GIC incidence and 47% of global GIC deaths in men, and 35% of the incidence and 39% of deaths in women[2].
With the rapid increase in the prevalence of GICs worldwide, research on nutritional support therapy among GIC patients has gained more attention from researchers and clinicians. As a preferred means of nutritional support therapy (NST), oral nutritional supplements (ONS) are high-energy nutritional formulas aimed at enhancing nutritional status, promoting a healthy body composition, boosting immune function, and improving quality of life (QoL)[4,5]. Previous systematic reviews and meta-analyses of nutritional interventions showed the positive impact of ONS on nutritional status and clinical outcomes[6,7]. Current Chinese and international nutritional guidelines recommend providing ONS to malnourished cancer patients[5,8−11]. However, most studies have focused on ONS among GIC patients during the pre-operative periods or hospital stays[12−14].
Advanced progress in of cancer therapies, including techniques of surgery, chemotherapy, immunotherapy, radiation, and NST have shown positive treatment outcomes such as decreased anticancer drug resistance, a survival benefit, and improvements in QoL[15−17]. However, a large proportion of patients still experience a certain degree of malnutrition, which is attributed to operative trauma, perioperative diet control, and other factors[18]. These conditions result in impaired nutritional status, rapid weight loss, muscle wasting, and changes in body composition[18]. Evidence shows that malnutrition is associated with adverse outcomes, including tolerance of anticancer treatments, increased anticancer drug toxicity, a high incidence of morbidity and mortality, and a shortened survival period caused by dysregulation of the immune system[19−21].
Until now, little has been known regarding the efficacy of ONS on the clinical outcomes in GIC patients, especially postdischarge patients after surgery. To our best knowledge, only two recent randomized clinical trials have indicated that 3 months of ONS after discharge resulted in improved nutritional outcomes and attenuation of skeletal muscle loss in Chinese GIC patients at nutritional risk after surgery[12,22]. However, the clinical effects of short-term postdischarge ONS in GIC patients is unclear, given the limited evidence. In order to address this issue and provide clinical evidence, the aim of this study was to evaluate the impact of 3-week postdischarge tumor-specialized ONS on nutritional status, body composition, immune status, and inflammatory responses in malnourished GIC patients after surgery. The present research provides clinical insights to researchers and clinicians regarding nutritional support for malnourished patients at home.
-
The data of patients diagnosed with GICs were taken from a retrospective observational study delivered in real life. The study was conducted in accordance with the Declaration of Helsinki, and all procedures were approved by the Ethics Committee of Ningbo No. 2 Hospital (No. YJ-NBEY-KY-2023-038-01).
Among postoperative patients after hospital discharge, those who did not undergo chemotherapy participated in this ONS program during their first postoperative follow-up examination; those undergoing chemotherapy participated at the beginning of their first chemotherapy cycle, after completing medical nutrition counseling and enrolling in the ONS program. All patients were assessed and diagnosed with malnutrition using patient-generated subjective global assessments (PG-SGA: ≥ 4)[23] by a well-experienced clinical nutritionist during a counseling session, and they were suggested to get nutritional treatment. In total, 71 patients from December 2021 to December 2022 attended a nutrition counseling session.
Patients were included according to criteria as follows: (1) Patients aged 18 to 80 years at baseline; (2) a diagnosis of GIC by pathology followed by surgery; (3) patients at nutritional risk or with confirmed malnutrition; (4) those with insufficient dietary energy intake and who were willing willing to receive tumor-specialized ONS; and (5) those with tolerance of enteral nutrition. The exclusion criteria included the following: (1) Specific conditions such as patients with acute pancreatitis, digestive dysfunction or fructose intolerance; (2) patients with intestinal obstruction or gastrointestinal bleeding; (3) patients with severe heart or lung failure, or liver or kidney dysfunction; (4) those receiving any other nutritional treatment; (5) pregnant or lactating women; (6) patients with mental illness; (7) those who showed poor compliance and were unable to provide their dietary records; (8) patients participating in any interventional clinical trials within 4 weeks before registering for ONS; and (9) those with a history of any other cancer.
Tumor-specialized ONS
-
All patients were required to receive tumor-specialized ONS containing 1.36 kcal/mL and 200 mL/bottle with vitamins and minerals. One ONS dose contains 6 g protein, 8.4 g fat, and 7.8 g carbohydrate, contributing 18.0%, 55.0%, and 27.0%, respectively, to the total dietary energy per bottle. All patients were asked to take two bottles per day with their meals to reach the minimum dietary energy requirement of 500 kcal/day.
Evaluation of nutritional status
-
The nutritional status of patients was evaluated by the PG-SGA during a baseline counseling session before ONS and after 3 weeks of ONS. The evaluation period was determined by the first cycle of chemotherapy. Four parts, including dietary intake and portion, weight status, health status, and physical activity, were evaluated. Nutritional status, based on the total score of these four parts, was classified into three groups: (A) well-nourished, (B) moderately or suspected of being malnourished, and (C) severely malnourished[9].
Dietary intake evaluation at baseline
-
After patients were discharged from the hospital, completed medical nutrition counseling, and registered for the ONS program, all patients reported their daily dietary intakes at home. All patients' daily dietary intakes were assessed using the 24-h recall method combined with the food exchange method for evaluation of the baseline energy intake and nutritional status by a clinical nutritionist at outpatient counseling sessions. Adherence to and tolerance of ONS were evaluated as well. Therefore, all patients were recommended to have at least 400 mL/day (520 kcal/day), in line with China's nutrition and health guidelines for cancer patients (25−30 kcal/kg·day)[9].
Dietary intake evaluation at follow-up
-
According to the clinical nutritionist's guidance and instructions, all patients were requested to report their 3-day 24-h dietary recalls, randomly selected within a week. Patient's dietary intakes and portion size (with color photographs) and ONS were provided to the clinical nutritionist through the WeChat app for estimating dietary energy intake in order to receive sufficient ONS[24]. The dietary energy was assessed and estimated by a professional dietary app named DaYingJia[25].
Anthropometric measurements
-
While fasting, all patients underwent anthropometric measurements twice: After the nutritional counseling session and before ONS registration, and after 3 weeks of ONS. Body composition including height (m), body weight (BW, in kg), skeletal muscle mass (SMM, in kg), fat mass (FM, in kg), body fat percentage (PBF), and visceral fat area (VFA, in cm2), were examined in all patients, who were in light clothes and barefoot using Inbody 770 apparatus.
Body mass index (BMI), used as a measure of BW status, was calculated as weight in kg / (height in m)2. Patients were classified into four BMI categories according to the China Obesity Task Force (COTF) as follows: Underweight (< 18.5 kg/m2), normal weight (18.5–23.9 kg/m2), overweight (24.0–27.9 kg/m2), and obese (≥ 28.0 kg/m2)[26]. Appendicular skeletal muscle mass (ASM, in kg) was calculated using a formula, which has been validated in the Chinese population[27]. ASM = 0.193 × BW (kg) + 0.107 × height (m) − 4.157 × gender (1 = men; 2 = women) − 0.037 × age (years) − 2.631.
The ASM index (ASMI) was calculated as ASMI = ASM / (height in m)2. For the present study, sarcopenia was defined using the cut-off points of ASMI to evaluate muscle mass status according to guidelines for the clinical diagnosis and treatment of cancer-related sarcopenia in China: < 7 kg/m2 for males and < 5.5 kg/m2 for females[28].
Immunity and inflammatory parameters
-
Fasting blood samples were collected during GIC patients' regular checks in the early morning at two points: After the nutritional counseling session and before ONS registration, and after 3 weeks of ONS. Biomarker parameters including serum C-reactive protein (CRP, in mg/L), serum albumin (ALB, in g/L), serum lymphocytes (LY, ×109/L), serum neutrophil cell (NEUT, ×109/L), and serum platelet count (PLT, ×109/L) were assessed using standard methods in the laboratory department by the technician. The systemic immune–inflammation index (SII) was calculated to assess inflammation status, using the following formula: (PLT × NEUT) / LY[29]. The prognostic nutritional index (PNI), reflecting immune status, was calculated as serum albumin (g/L) + 5 × YL[30].
Statistical analysis
-
The descriptive analysis is presented as the mean and standard deviation (SD) or the median with interquartile ranges (IQRs) for continuous variables. Numbers and percentages were used to display category variables. The normality was tested using the Shapiro–Wilk test and histograms. The differences in mean or median values between the baseline and after 3 weeks of ONS were examined by Paired Student's t-test and the Wilcoxon–Whitney U-test, respectively.
The results were considered statistically significant at a two-tailed level of 0.05. The analysis was conducted using the STATA statistical software package version 17 (2017).
-
Out of 71 patients, 36 dropped out because of ONS intolerance, missing reports of dietary intakes, or gastrointestinal symptoms. In total, 35 eligible malnourished patients (80.0% men) diagnosed with GIC with a mean age of 62.3 years were included in this study (Table 1). Around 65.7% of all patients were diagnosed with gastric cancer, followed by sigmoid colon cancer (11.4%). Most patients were at tumor Stage III (51.4%), had a normal weight (74.3%), were at risk of sarcopenia (54.3%), and received chemotherapy (57.1%).
Table 1. Baseline characteristics of study patients (n = 35).
Total (n) % / SD Age (years) 62.3 9.6 Sex [n (%)] Male 28 80.0 Female 7 20.0 Primary diagnosis Stomach 23 65.7 Sigmoid colon 4 11.4 Ascending colon 1 2.9 Descending colon 1 2.9 Transverse colon 1 2.9 Rectum 3 8.6 Duodenum 2 5.7 Stage I 5 14.3 II 6 17.1 III 18 51.4 IV 6 17.1 Chemotherapy No 15 42.9 Yes 20 57.1 BW status Underweight 8 22.9 Normal weight 26 74.3 Overweight 1 2.9 At risk of sarcopenia Low ASMI 19 54.3 Normal ASMI 16 45.7 Nutritional status by PG-SCAa A 1 2.9 B 14 40.0 C 20 57.1 ASMI: appendicular skeletal muscle mass index; PG-SCA: patient-generated subjective global assessment score; SD: standard deviation. Data are presented as the mean and SD or the median (interquartile range: 25%−75%). a A: well-nourished; B: moderately or suspected of being malnourished; C: severely malnourished. Effects of ONS on PG-SGA scores
-
The nutritional status evaluated by PG-SGA was significantly improved after 3 weeks of ONS (Fig. 1). At baseline, 57.1% and 40.0% of all patients were severely malnourished, and moderately malnourished or at risk of malnutrition, respectively. About 17.1% of all patients were well-nourished, and only 17.1% of the patients remained severely malnourished after 3 weeks of ONS (p < 0.001 for both). All patients with a mean score of 9 at the baseline reached 5.6 after 3 weeks of ONS (p < 0.001). Stratified by muscle mass status, nutritional status significantly improved in both groups (low ASMI and normal ASMI). The median values of PG-SGA in the low ASMI and normal ASMI groups were 10.4 and 8.0 at baseline, and 6.0 and 4.5 after 3 weeks of ONS, respectively (low ASMI: p < 0.001; normal ASMI: p = 0.006).
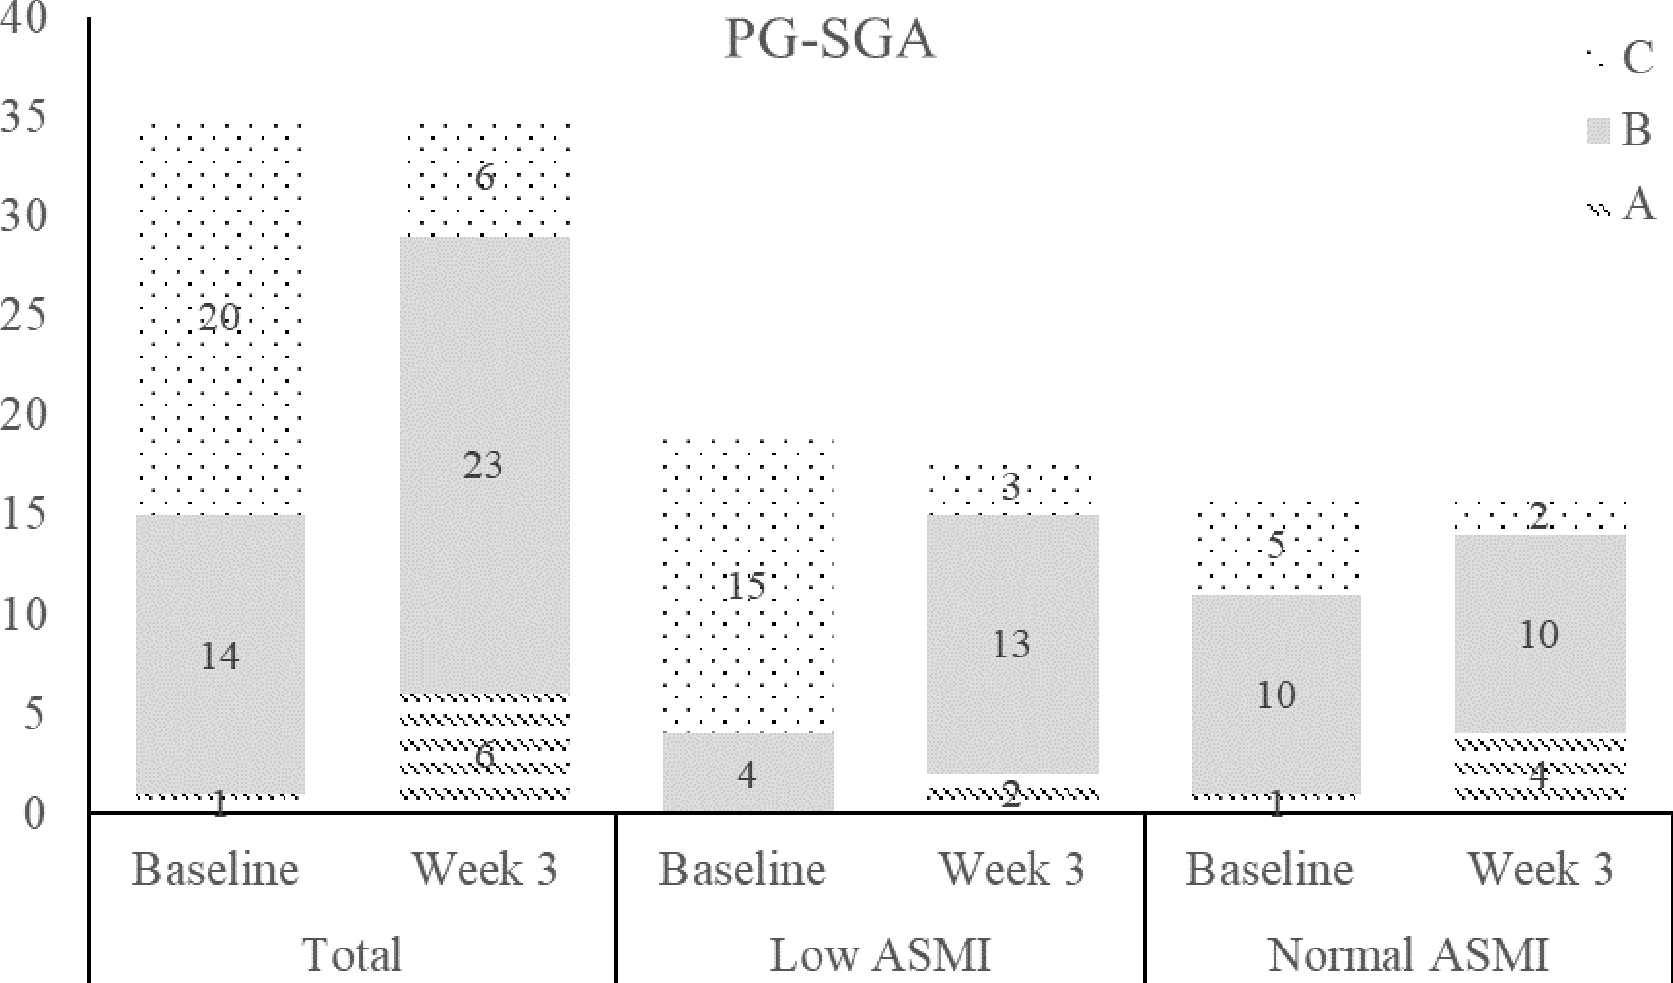
Figure 1.
Number of patients according to nutritional status evaluated by the PG-SGA at baseline and Week 3: (A) well-nourished; (B) moderately or suspected of being malnourished; (C) severely malnourished. ASMI: appendicular skeletal muscle mass.
Effects of ONS on BW and body composition
-
The results showed a slight increase in BW, BMI, FM, SMM, and ASM, but a decrease in total body water, although no statistically significant difference was observed between baseline and Week 3 (Table 2). Regarding muscle mass status, although there was a greater decrease in VFA in the low ASMI group, a better improvement in body composition was found in the normal ASMI group after 3 weeks of ONS (Table 3). However, no statistically significant difference between the two groups was observed.
Table 2. Comparison of anthropometry, body composition and inflammatory parameters at baseline and after 3-week oral nutritional supplements.
Baseline Week 3 Change p-Valuea Bodyweight (kg) 55.2 (7.0) 55.6 (7.3) 0.4 0.818 Body mass index (kg/m2) 20.0 (2.0) 20.1 (2.1) 0.1 0.909 Total body water (L) 32.8 (5.3) 32.2 (5.2) −0.6 0.646 Skeletal muscle mass (kg) 23.5 (4.1) 23.6 (4.1) 0.1 0.924 ASM (kg) 18.5 (3.0) 18.7 (2.9) 0.2 0.749 Fat mass (kg) 10.3 (8.2, 14.0) 11.1 (9.2, 14.3) 0.8 0.856 Body fat (%) 19.3 (14.4, 23.6) 19.5 (17.1, 25.7) 0.2 0.589 Visceral fat area (cm2) 53.1 (44.1, 68.0) 53.8 (44.4, 68.6) 0.7 0.819 C-reactive protein (mg/L) 1.7 (0.7, 3.3) 1.9 (0.9, 3.9) 0.2 0.727 Albumin (g/L) 41.0 (38.8, 43.0) 40.8 (38.9, 42.3) −0.2 0.589 SII 291.8
(192.5, 447.2)278.6
(221.7, 351.3)−13.2 0.574 PNI 49.00 (45.9, 51.2) 47.4 (46.4, 49.5) −1.6 0.570 ASM: appendicular skeletal muscle mass; SII: systemic immune–inflammation index; PNI: prognostic nutritional index. Data are presented as the mean (standard deviation) or median (interquartile range: 25%−75%). a p-Values were examined by Paired Student's t-test and the Wilcoxon–Whitney U- test between the baseline and Week 3 of ONS. Table 3. Comparison of anthropometry and body composition at baseline and Week 3 after tumor-specialized ONS, stratified by sarcopenia status and chemotherapy status.
Low ASMI Normal ASMI Baseline Week 3 Change p-Valuea Baseline Week 3 Change p-Valuea Total Bodyweight (kg) 51.0 (48.9, 56.7) 51.3 (48.1, 55.7) 0.3 0.761 58.6 (55.3, 66.1) 60.0 (57.0, 66.8) 1.4 0.577 BMI (kg/m2) 19.0 (17.5, 19.6) 18.3 (17.8, 19.4) −0.7 0.693 21.9 (20.3, 22.6) 21.9 (20.4, 22.3) 0.0 0.759 Total body water (L) 31.9 (29.9, 34.9) 30.6 (28.4, 33.4) −1.3 0.459 34.0 (31.3, 36.9) 34.5 (31.4, 36.8) 0.5 0.751 SMM (kg) 22.2 (21.5, 25.8) 22.2 (20.7, 24.5) 0.0 0.750 24.8 (22.1, 26.9) 25.4 (23.1, 26.9) 0.6 0.679 Fat mass (kg) 9.6 (7.0, 10.7) 9.6 (7.9, 10.3) 0.0 0.988 13.6 (10.3, 15.8) 13.0 (11.1,17.1) −0.4 0.627 Body fat (%) 19.0 (13.7, 20.7) 18.4 (16.5, 20.0) −0.6 0.855 22.6 (17.1, 27.7) 21.8 (18.3, 26.6) −0.8 0.665 Visceral fat area (cm2) 46.3 (39.1,53.1) 45.0 (34.7, 53.2) −1.3 0.915 65.5 (53.5, 75.0) 65.1 (55.0,80.7) −0.4 0.901 No chemotherapy Bodyweight (kg) 50.4 (49.4, 59.2) 49.8 (48.2, 54.5) −0.6 0.563 57.8 (56.0, 58.8) 58.5 (57.0, 61.0) 0.7 0.515 BMI (kg/m2) 19.3 (17.8, 20.1) 18.9 (17.6, 19.9) −0.4 0.657 21.9 (20.6, 22.3) 20.7 (20.1, 22.3) −1.2 1.000 Total body water (L) 30.1 (29.9, 34.9) 30.1 (28.9, 30.6) 0.0 0.464 32.6 (29.1, 34.3) 34.5 (29.9, 36.9) 1.9 0.569 SMM (kg) 21.6 (21.5, 25.7) 21.9 (21.0, 22.2) 0.3 0.688 23.3 (21.4, 25.2) 25.4 (21.9, 26.9) 2.1 0.570 Fat mass (kg) 9.6 (8.2, 11.7) 8.7 (8.0, 15.3) −0.9 0.689 13.6 (12.4, 14.0) 12.4 (11.1, 13.8) −1.2 0.515 Body fat (%) 19.1(14.4, 19.6) 17.4 (16.6, 25.6) −1.7 0.859 23.6 (21.1, 26.1) 20.9 (17.6, 25.3) −2.7 0.570 Visceral fat area (cm2) 46.5 (40.9, 54.8) 42.5 (36.8, 80.8) −4.0 0.657 66.0 (58.8, 73.4) 58.0 (51.5, 71.5) −8.0 0.465 Chemotherapy Bodyweight (kg) 51.7 (48.9, 53.4) 52.6 (47.5, 55.7) −0.9 0.624 60.2 (54.5, 67.5) 61.5 (55.0, 67.6) 1.3 0.597 BMI (kg/m2) 18.4 (17.5, 19.0) 18.2 (17.8, 19.1) −0.2 0.935 21.8 (20.0, 23.2) 22.0 (20.4, 23.7) 0.2 0.503 Total body water (L) 32.2 (28.4, 35.2) 32.2 (28.0, 34.2) 0.0 0.965 34.3 (32.9, 36.9) 35.3 (31.4, 36.8) 1.0 0.967 SMM (kg) 23.1 (22.2, 25.8) 23.7 (20.1, 25.4) 0.6 0.838 24.9 (22.8, 27.3) 25.9 (23.1, 27.2) 1.0 0.805 Fat mass (kg) 9.8 (6.5, 10.3) 9.7 (9.1, 10.2) −0.1 0.902 13.5 (9.2, 16.2) 14.7 (11.0, 17.1) 1.2 0.438 Body fat (%) 17.2 (13.3, 20.7) 18.7 (13.7, 20.0) 1.5 0.838 22.4 (15.8, 29.4) 24.7 (19.1, 28.4) 2.3 0.342 Visceral fat area (cm2) 45.4 (33.2, 53.1) 45.9 (34.7, 53.0) 0.5 0.806 65.0 (53.0, 82.5) 67.5 (55.2, 88.5) 2.5 0.439 SMM: skeletal muscle mass; ASMI: appendicular skeletal muscle mass index. Data are presented as the median with interquartile range (25%−75%). a p-Values were examined by the Wilcoxon–Whitney U-test between baseline and after 3 weeks of ONS. After subgroup analysis by chemotherapy status and muscle status, body composition in patients without chemotherapy improved more than in patients receiving chemotherapy, especially for patients with a normal ASMI (Table 3). In the subgroup of patients who did not receive chemotherapy, a slight increase in SMM was observed, along with decreases in BMI, FM, PBF, and VFA. In contrast, in the subgroup of patients who received chemotherapy, minor increases in SMM, PBF, and VFA were found. However, no statistically significant differences were observed between the baseline and Week 3.
Effects of ONS on immunity status and inflammatory responses
-
Slight changes in immunity and inflammatory parameters were observed in all patients. Compared with the baseline values, the median CRP increased slightly, whereas the other parameters (ALB, SII, and PNI) decreased in all patients. Greater decreases in ALB, SII, and PNI were found in the patients with a low ASMI (Table 4). In addition, an increase in CRP was observed in patients with a low ASMI, whereas a decrease was found in those with a normal ASMI.
Table 4. Comparison of immune and inflammatory parameters at baseline and after 3 weeks of ONS, stratified by sarcopenia status and chemotherapy status.
Low ASMI Normal ASMI Baseline Week 3 Change p-Valuea Baseline Week 3 Change p-Valuea Total CRP (mg/L) 1.8 (0.64, 8.6) 1.9 (1.3, 8.0) 0.1 0.498 1.7 (0.72,3.3) 1.2 (0.63, 3.9) −0.5 0.872 ALB (g/L) 40.9 (39.0, 44.2) 39.7 (38.1, 40.7) −1.2 0.355 41.3 (38.8, 42.7) 41.3 (40.8, 42.8) 0.0 0.752 SII 291.4 (192.5, 386.7) 264.7 (189.8, 385.9) −26.7 0.786 315.3 (221.9, 447.2) 292.3 (228.6, 351.3) −22.9 0.631 PNI 47.9 (46.5, 49.5) 47.0 (45.3, 48.4) −1.0 0.173 49.5 (45.5, 51.2) 49.3 (47.4, 52.1) −0.2 0.716 No chemotherapy CRP (mg/L) 1.9 (0.69, 14.9) 1.9 (0.48, 8.0) 0.0 0.655 2.7 (0.51, 2.8) 2.4 (0.43, 5.7) −0.3 0.584 ALB (g/L) 39.2 (38.4, 40.9) 38.7 (36.9, 39.2) −0.5 0.454 42.7 (38.7, 42.7) 42.1 (39.8, 43.1) −0.6 0.855 SII 215.3 (159.5, 363.7) 275.7 (210.7, 359.7) 60.4 0.670 405.7 (221.9, 622.2) 308.3 (212.3, 353.2) −97.5 0.685 PNI 46.7 (45.9, 47.9) 45.7 (43.9, 47.0) −1.1 0.336 49.7 (49.2, 51.2) 49.8 (47.4, 52.1) 0.1 0.927 Chemotherapy CRP (mg/L) 1.6 (0.58, 2.3) 2.2 (1.4, 8.0) 0.6 0.247 1.6 (0.96, 3.3) 1.2 (0.75, 3.1) −0.4 0.665 ALB (g/L) 44.2 (39.6, 45.5) 40.4 (38.8, 41.7) −3.8 0.297 41 (40.1, 41.7) 41.3 (40.8, 42.3) 0.3 0.596 SII 370.0 (254.1, 497.7) 261.7 (175.4, 450.2) −108.3 0.488 291.8 (248.6, 402.7) 280.3 (235.5, 323.2) −11.5 0.630 PNI 49.5 (47.6, 52.0) 47.4 (46.3, 49.4) −2.1 0.118 48.1 (45.5, 50.2) 48.3 (47.3, 52.4) 0.2 0.711 CRP: C-reactive protein; ALB: albumin; SII: the systemic immune-inflammation index; PNI: prognostic nutritional index. Data are presented as the median with interquartile range (25%−75%). a p-Values were examined by the Wilcoxon–Whitney U-test between baseline and after 3 weeks of ONS. In the nonchemotherapy group, patients with a low ASMI had greater decreases in ALB (−3.8), SII (−108.3), and PNI (−2.1), along with a greater increase in CRP (0.6) compared with the other subgroups. In addition, a large increase in median SII (60.4) was found among those with a low ASMI who did not undergo chemotherapy. In contrast, in the chemotherapy group, patients with a normal ASMI showed a relative decrease in CRP (−0.4) along with slight increases in ALB (0.3) and PNI (0.2). However, all the changes did not reach statistical significance among all the groups.
-
This was a retrospective observational study of short-term postdischarge ONS on clinical outcomes in malnourished GIC patients after surgery in a real-life clinical setting in Zhejiang Province, China. Extensive research interest in clinical nutrition for cancer patients has contributed to the emerging literature of this modern field. This study demonstrated that a 3-week postdischarge ONS intervention resulted in improved nutritional status, a weak increase in BW, reduced loss of SMM, maintenance of immune status, and prevention of worsening inflammation in malnourished GIC patients after surgery. Our findings have strong clinical implications for clinicians, supporting the use of postdischarge ONS to improve nutritional status and clinical outcomes in malnourished patients after GIC surgery. In addition, our findings provide clinical evidence to researchers about adjusting ONS patterns and the optimal ONS intervention period.
ONS, considered as a preferred NST, plays an important role in improving nutritional status and clinical outcomes[5,31]. Despite great progress in NSP and the techniques of surgery, chemotherapy, and rehabilitation, malnutrition is a common condition after cancer surgery and contributes to negative clinical outcomes, especially after hospital discharge[32], which is associated with a high incidence of GIC complications, morbidity, and mortality, and a shorter survival time and a lower survival rate[19−21]. Although evidence is limited, previous studies suggested that ONS can improve nutritional status and clinical outcomes among patients after hospital discharge[12,22,33].
In our study, all the patients receiving 3 weeks of ONS were observed to improve their nutritional status when using the PG-SGA for evaluation. The majority of postoperative and discharged patients were identified as severely malnourished, shifting to moderately or suspected of being malnourished and well-nourished after 3 weeks if ONS, particularly in patients with a low ASMI, which is in line with recent ONS intervention studies[34−36].
Most studies have used traditional nutritional parameters such as BW, BMI, and muscle mass to evaluate the efficacy of ONS in clinical practice among cancer patients[32,37]. Some reports have shown the positive impacts of ONS on reducing BW loss and maintaining SMM after cancer surgery[12,22]. Our results for all GIC patients were similar to the findings from one previous 8-week ONS intervention in pancreatic and bile duct cancer patients[34], although those changes did not reach statistically significant levels. In addition, slight increases in FM, PBF, and VFA were found in GIC patients, especially for those with a low ASMI. Besides the traditional nutritional parameters, our study used nutritional biomarkers and parameters of immune status and inflammatory responses to evaluate the impacts of ONS. In this present study, more positive effects were observed in patients with a normal ASMI, including slight decreases in serum CRP and SII. However, all the changes in immune and inflammatory parameters remained within the normal range. Therefore, our findings highlight that short-term postdischarge ONS may have maintenance effects on BW, muscle mass, and immune–inflammatory status among these malnourished GIC patients after surgery.
Evidence shows that chemotherapy produces unwanted side-effects such as appetite loss, nausea, fatigue, depressed mood, hyperglycemia, sarcopenia, and infections, although it has contributed to improved survival among cancer patients[38]. With respect to prognostic gain after a nutritional intervention during chemotherapy, there are limited data regarding the effect of postdischarge ONS on clinical outcomes after cancer surgery. Few studies have investigated the impacts of postdischarge ONS on nutritional outcomes, immunity status, and inflammatory responses, and even fewer compared patients who received chemotherapy with those who did not receive chemotherapy. Our results revealed that 3 weeks of ONS improved SMM relatively more among patients with a normal ASMI who were not receiving chemotherapy. Nevertheless, ONS has shown less of an increase in SMM among patients who were not receiving chemotherapy, especially for those with a normal ASMI. One systematic review concluded that cancer patients with a low muscle mass are more likely to be associated with chemotherapy-induced adverse outcomes such as sarcopenia; increased anticancer drug toxicity, which can result in tumor progression and growth; and a lower survival rate[39]. In addition, several studies explained that chemotherapy regimens can cause muscle weakness and muscle loss caused by a developed state of oxidative stress[39−41]. We found that chemotherapy promoted a slight rise in BW, FM, and VFA after 3 weeks of ONS. Evidence shows that cancer patients undergoing chemotherapy often experience increases in BW and FM, including VFA[42], which is attributed to ONS providing nutrition and dietary energy to maintain or increase FM in advance instead of SMM[43]. Therefore, increased FM and VFA might show initial progress in terms of clinical outcomes for cancer patients.
Muscle mass plays an essential role in metabolism, supporting regulation of the immune–inflammatory response[44]. Our results show, on the one hand, that relatively greater positive effects on immune status and inflammatory response were found among GIC patients who were not receiving chemotherapy, especially those with a normal ASMI. On the other hand, relatively worse effects were observed among GIC patients receiving chemotherapy, especially those with a low ASMI. Chemotherapy drugs such as doxorubicin and etoposide lead to an increase in FM by impacting SMM loss because of muscle metabolism through promoting protein degradation and inhibiting protein synthesis[41]. The progression of chemotherapy-induced changes triggers systemic inflammation via activation of inflammatory cytokines (interleukin [IL]-1β, IL-6, and tumor necrosis factor [TNF]-α)[41]. A combination of inflammation and malnutrition is associated with a decrease in serum ALB concentration by lowering its rate of synthesis[45]. However, no statistically significant impact on the indicators of immune status and inflammatory response by ONS was seen in our study, which indicated that ONS maintained the concentration of ALB and CRP, and prevented the deterioration of immunity and inflammation.
Notably, a higher median value of SII was found only in patients with a low ASMI in the no-chemotherapy subgroup. The potential reasons may be attributed to the small sample size and the short-term ONS intervention. Although our findings provide insights into the clinical implications of short-term postdischarge ONS, more likely, it has a preventive effect on the maintenance of BW, improvements in muscle mass, and maintaining a stable immunity status and inflammatory responses among malnourished GIC patients not receiving chemotherapy. Among the high-risk patients with a low ASMI who received chemotherapy, additional support besides ONS is required after postoperative discharge from the hospital. However, the specific mechanisms have not yet been well understood. Therefore, future research in this field should investigate the impact of ONS interventions together with resistance exercises on clinical outcomes, including muscle-related factors and immune–inflammation parameters among malnourished patients with GICs after surgery over a period longer than two cycles of chemotherapy for providing a comprehensive understanding.
The present study has several limitations. First, this retrospective observational study collected clinical data from patients undergoing standard care in a real-life setting. Causality between ONS and nutritional status, immune status, and inflammatory responses may not be well inferred because of the nature of the study design. As this was a single-arm retrospective study without a control group, it is impossible to conclude that the improvement in nutritional status and changes in clinical outcomes were affected solely by ONS. In addition, the effects of ONS could be influenced by regular dietary intakes and other postdischarge factors. Nevertheless, each method has inevitable limitations. Because dietary intakes were assessed using 24-h recall, our real-world data may still provide evidence of the potential impacts of ONS. Ultimately, a future controlled trial is required to confirm our findings. However, studies from real-world data provide essential evidence to guide randomized clinical trials and clinical practice[46]. Second, this study was conducted at a single center with a small sample size of eligible patients. Consequently, our findings may restrict its generalizability to Chinese GIC patients in the whole of China. Third, the small sample size resulting from our focus on specific cancers might affect the precise clinical outcomes. This preliminary retrospective observational study was conducted as the basis for future clinical trials. Thus, a large sample size of cancer patients needs to be involved with regards to muscle and inflammation-related factors. Moreover, self-reported dietary intakes relied on the patients' memory and psychological bias, which might misestimate the dietary energy intake. Last, the short-term intervention period may have led to no statistical significance in our results. However, short-term ONS can provide evidence of the clinical significance, showing that short-term ONS has weakly preventive effects on clinical outcomes among postdischarge GIC patients after surgery. Therefore, a period of more than two cycles of chemotherapy is required to verify the effects of postdischarge ONS on clinical outcomes.
-
Three weeks of postdischarge ONS, provided to GIC patients after surgery, improved their nutritional status and decreased the percentage of severely malnourished patients. This study indicated that a 3-week ONS intervention had clinical benefits in preventing weight loss, improving muscle mass, maintaining stable immunity, and controlling inflammatory responses among GIC patients, after surgery, especially for patients with a normal ASMI. However, our findings highlight that additional nutritional and clinical support is required for high-risk GIC patients with a low ASMI receiving chemotherapy, after postoperative discharge from the hospital. The findings' clinical implications can provide insight into ONS for the researchers and clinicians in clinical practice.
This study was supported by Natural Science Foundation of Ningbo (No. 2024J405), the HwaMei Key Research Foundation of Ningbo No.2 Hospital (No. 2024HMZD17), the HwaMei Clinical Research Foundation of Ningbo No.2 Hospital (No. 2022HMLC10), the HwaMei Research Foundation of Ningbo No.2 Hospital (No. 2021HMKY35), and Ningbo Leading Medical Health Discipline (No. 2022-B11). All authors thank all physicians and nurses for their great contribution. We thank Dr. Richard Rankin for English proofreading of the manuscript.
-
The study was conducted in accordance with the Declaration of Helsinki, and all procedures were approved by the Ethics Committee of Ningbo No. 2 Hospital; identification number: YJ-NBEY-KY-2023-038-01, approval date: March 20, 2023.
-
The authors confirm their contributions to the paper as follows: methodology, writing − original draft: Yu H, Lin Y; funding acquisition: Yu H, Dai XY; formal analysis: Hu ZB, Lin Y; data curation: Chen MM, Dai XY; project administration: Chen MM; conceptualization, writing − review & editing, supervision: Lin Y. All authors reviewed the results and approved the final version of the manuscript.
-
The data are not publicly available because of privacy or ethical restrictions. If there is a reasonable request, the data can be obtained from the corresponding authors.
-
The authors declare that they have no conflict of interest.
-
# Authors contributed equally: Hua Yu, Yi Lin
- Copyright: © 2026 by the author(s). Published by Maximum Academic Press, Fayetteville, GA. This article is an open access article distributed under Creative Commons Attribution License (CC BY 4.0), visit https://creativecommons.org/licenses/by/4.0/.
-
About this article
Cite this article
Yu H, Hu ZB, Chen MM, Dai XY, Lin Y. 2026. Effects of postdischarge oral nutrition supplements on body composition, immune status, and inflammatory responses in malnourished patients with gastrointestinal cancer after surgery. Gastrointestinal Tumors 13: e005 doi: 10.48130/git-0026-0003 

Effects of postdischarge oral nutrition supplements on body composition, immune status, and inflammatory responses in malnourished patients with gastrointestinal cancer after surgery
- Received: 21 September 2025
- Revised: 29 November 2025
- Accepted: 18 December 2025
- Published online: 04 March 2026
Abstract: This study aimed to investigate the effects of 3-week postdischarge oral nutrition supplements (ONS) on nutritional status, body weight (BW), body composition, immune status, and inflammatory responses in malnourished gastrointestinal cancer (GIC) patients after surgery. A retrospective observational study was carried out in a real-life clinical setting from December 2021 to December 2022. Malnourished GIC patients were recommended to receive ONS for up to 3 weeks. Nutritional status was evaluated by a patient-generated subjective global assessment. The changes in the clinical outcomes of BW, body composition, and the status of immunity and inflammation were compared between Week 3 and the baseline, stratified by appendicular skeletal muscle mass index (ASMI) and chemotherapy. Among 35 GIC patients, ONS improved the nutritional status of severe malnutrition from 57.1% at baseline to 17.1% at Week 3. Slight increases in BW and skeletal muscle mass were observed among patients with a normal ASMI. Slight increases in fat mass and visceral fat area were found among patients receiving chemotherapy. This ONS program maintained stable immunity and a controlled inflammatory status (C-reactive protein, prognostic nutritional index, and systemic immune–inflammation) among patients, with greater stability observed among those with a normal ASMI. However, these changes did not reach statistical significance. In summary, postdischarge ONS improved nutritional status in malnourished GIC patients after surgery. These findings suggested that short-term postdischarge ONS may contribute to initial progress via improved muscle mass, stabilized immunity, and controlled inflammation, particularly in patients not receiving chemotherapy.
-
Key words:
- Malnutrition /
- Skeletal muscle mass /
- Oral nutritional supplements /
- Immunity /
- Inflammation /
- Gastrointestinal cancer /
- Chemotherapy /
- Body weight