


-
Biliary tract cancers (BTCs), which include cholangiocarcinoma (CHOL) and gallbladder carcinoma (GBC) based on anatomical location, have shown a steadily increasing incidence in recent years[1]. These malignancies are often insidious in onset, with the majority of patients diagnosed at an advanced stage[2]. Their aggressive biology, marked molecular heterogeneity, and strong drug resistance contribute to exceptionally challenging treatment and very low five-year survival rates[3].
In recent years, immune checkpoint inhibitors (ICIs) have represented a major breakthrough in BTC treatment. The phase 3 randomized controlled trial TOPAZ-1 provided the first key evidence for a new combination therapy[4]. It showed that adding durvalumab to standard chemotherapy (gemcitabine and cisplatin) significantly improved patient outcomes. Compared to chemotherapy alone, the combination therapy led to a median overall survival (OS) of 12.9 months vs 11.3 months. Progression-free survival (PFS) was also better, at 7.2 months compared to 5.7 months. Additionally, the objective response rate (ORR) increased from 19% to 27%. A second major trial, the similarly designed phase 3 KEYNOTE-966 study was subsequently conducted[5]. It successfully met its primary endpoint by demonstrating that adding pembrolizumab to chemotherapy extended median OS. The improvement was from 10.9 to 12.7 months. However, the addition of pembrolizumab did not improve other key outcomes. PFS remained similar (6.5 months vs 5.6 months), and the ORR was identical in both groups at 29%. Moreover, the absolute survival benefit in both trials remained modest, and more than 70% of patients derived no response to the combination therapy.
A key strategy for improving therapeutic efficacy involves selecting optimal patient subgroups or excluding less responsive ones using molecular biomarkers. However, the KEYNOTE-966 trial indicated that the classical immunotherapy biomarker PD-L1 expression showed no clear correlation with survival benefit[5]. Furthermore, the relationship between tumor mutational burden (TMB) and immunotherapy efficacy in BTCs remains controversial[6], and microsatellite instability (MSI) is rare in this cancer type[7]. Nevertheless, specific genetic alterations may critically influence immunotherapy outcomes. A phase II study of first-line camrelizumab combined with gemcitabine/oxaliplatin (GEMOX) in advanced BTCs reported an ORR of 54% and a median OS of 12.1 months[6]. Subsequent analysis identified an 11-gene mutational signature that stratified BTC into 'mutant' and 'wild-type' subgroups, with significantly worse immunotherapy outcomes observed in the mutant group[8]. Another recent retrospective study of 125 advanced BTC patients treated with first-line anti-PD-1/PD-L1 plus chemotherapy found that responders had higher frequencies of TP53, BRCA2, and cytokine-pathway mutations, whereas KRAS and ARID1A mutations were associated with poorer efficacy. Combining CXCL9 and CTLA4 expression levels further improved prognostic stratification[9]. However, these findings explain only a fraction of treatment outcomes, likely because concurrent mutations exert additional effects.
Co-occurring mutations further enhance molecular heterogeneity in malignancies. In non-small cell lung cancer (NSCLC), for example, concurrent TP53 and STK11 mutations subdivide KRAS-mutant NSCLC into two immunologically distinct subtypes. The KRAS/TP53 group shows activated immune-cell infiltration and elevated PD-L1 expression, whereas the KRAS/STK11 group exhibits the opposite profile[10]. Accordingly, KRAS/TP53 NSCLC benefits more from immunotherapy[11], while KRAS/STK11 tumors not only respond poorly but may also experience reduced survival[12,13]. The impact of co-mutations on the immune microenvironment and tumor progression has also been reported in other cancers, including colorectal[14], pancreatic[15], breast[16], and prostate cancers[17], and extends to targeted therapies such as anti-EGFR tyrosine kinase inhibitors (TKIs)[18], anti-HER2 monoclonal antibodies[19], and Poly ADP-ribose polymerase (PARP) inhibitors[17]. However, most studies have focused on co-mutations in a limited set of classic oncogenes and tumor suppressor genes, leaving the clinical implications of other concurrent mutations largely unexplored.
The effect of co-mutations on immunochemotherapy (ICT) outcomes in advanced BTCs remains unclear. This study aims to define the landscape and characteristics of co-mutations in BTCs, identify co-mutation patterns associated with ICT response, and integrate prognostically significant single mutations to establish a novel genomic classification system for BTCs. By leveraging the molecular features of each subtype, we propose tailored treatment strategies. These insights are expected to improve therapeutic outcomes for patients with advanced BTCs.
-
This study included two cohorts. A large discovery cohort of 2,378 patients with advanced BTC and known MSI status was used to characterize co-mutation profiles and molecular features. These were routine clinical cases collected from multiple centers between January 2018 and April 2023. A smaller ICT cohort with complete outcome data was assembled for efficacy and prognostic analysis, including 34 patients from the phase II clinical trial NCT03486678 who received first-line camrelizumab plus GEMOX[8], and 25 real-world patients who received similar ICT. Objective responses were assessed per RECIST 1.1, and OS was defined as the time from treatment initiation to death from any cause. All patients had pathologically confirmed BTC, no prior antitumor therapy before sampling, and sufficient qualified tissue for sequencing. Exclusion criteria included a history of other malignancies, multiple primary tumors, and combined hepatocellular-cholangiocarcinoma. Genomic data are available in the Genome Sequence Archive for Humans (
https://ngdc.cncb.ac.cn/gsa-human ) under project PRJCA031321, and dataset HRA008984. The study was conducted in accordance with the Declaration of Helsinki and approved by the Ethics Committee of the First Affiliated Hospital of Nanjing Medical University. Written informed consent was obtained from all participants.Sequencing and genomic analysis
-
Targeted sequencing was performed in laboratories accredited by the Clinical Laboratory Improvement Amendments (CLIA) and the College of American Pathologists (CAP), using clinically validated gene panels[8,20] (Supplementary Table S1). Detailed sequencing and variant-calling methods have been described previously[20]. MSI status was determined with an in-house Python pipeline[21]. This study focused on somatic non-synonymous variants (SNVs) that are known or predicted to be functional[22]. TMB was defined as the total number of such SNVs[23]. The Between-Within (Bewith) method was used to analyze co-mutations and mutually exclusive mutations[24]. The former is defined as a set of genes that are mutated concurrently in the same tumor sample at a frequency significantly higher than expected by chance, while the latter is defined as a set of genes that are rarely or never concurrently mutated in the same tumor sample. The total number of co-mutations present in each sample was defined as the co-mutation burden.
PD-L1 assay
-
PD-L1 expression was assessed by immunohistochemistry using the Dako PD-L1 IHC 22C3 pharmDx kit and Autostainer Link 48 system (Agilent Technologies). Expression levels were evaluated using the Tumor Proportion Score (TPS), with positivity defined as TPS ≥ 1%.
Statistical analysis
-
Group comparisons were performed using the χ2 test, Fisher's exact test, Student's t-test, or Wilcoxon/Mann–Whitney test, as appropriate. Receiver operating characteristic (ROC) curves and area under the curve (AUC) were used to evaluate the diagnostic value of co-mutational load for MSI. Survival probabilities were estimated using Kaplan–Meier curves and compared with the log-rank test. Multivariate analysis used Cox proportional hazards regression. Least absolute shrinkage and selection operator (LASSO) regression was applied to identify gene co-mutations or single mutations with the strongest prognostic impact. Statistical significance was set at p < 0.05 (two-tailed). Analyses were conducted using SPSS 23.0, R 4.3.2, and relevant Bioconductor packages.
-
In the discovery cohort of 2,378 patients (Supplementary Table S2), CHOL was predominant (1,702 cases, 71.6%), while GBC accounted for 676 cases (28.4%). Younger patients (< 65 years) were more common (1,462, 61.5%), and 916 (38.5%) were ≥ 65 years. The male-to-female ratio was nearly balanced (1,253 males, 52.7%; 1,125 females, 47.3%). MSI tumors were identified in only 54 patients (2.3%). In the ICT cohort (Supplementary Table S3), CHOL again predominated (62.7%), younger patients were the majority (62.7%), and males outnumbered females (61% vs 39%). MSI status was available for 48 patients, of whom three were MSI (5.1%). A total of 46 patients (78%) received first-line ICT, and 13 (22%) were treated in the second-line setting.
Co-mutation characteristics
-
We first characterized co-mutation patterns in the discovery cohort. TP53 and KRAS mutations were highly prevalent (Fig. 1a), likely reflecting the advanced stage of the cohort. TP53 displayed frequent co-mutations and mutual exclusivity, while KRAS showed the highest number of mutually exclusive events. TGFBR2, ARID1A, ARID1B, KMT2C, LRP1B, PIK3CA, KMT2D, and PBRM1 were each enriched for co-mutations (Fig. 1b). At the pathway level, RTK-RAS alterations were significantly co-occurrent with TGF-beta mutations but mutually exclusive with PI3K and TP53 pathway lesions; alterations in other pathways tended to co-occur (Fig. 1b).
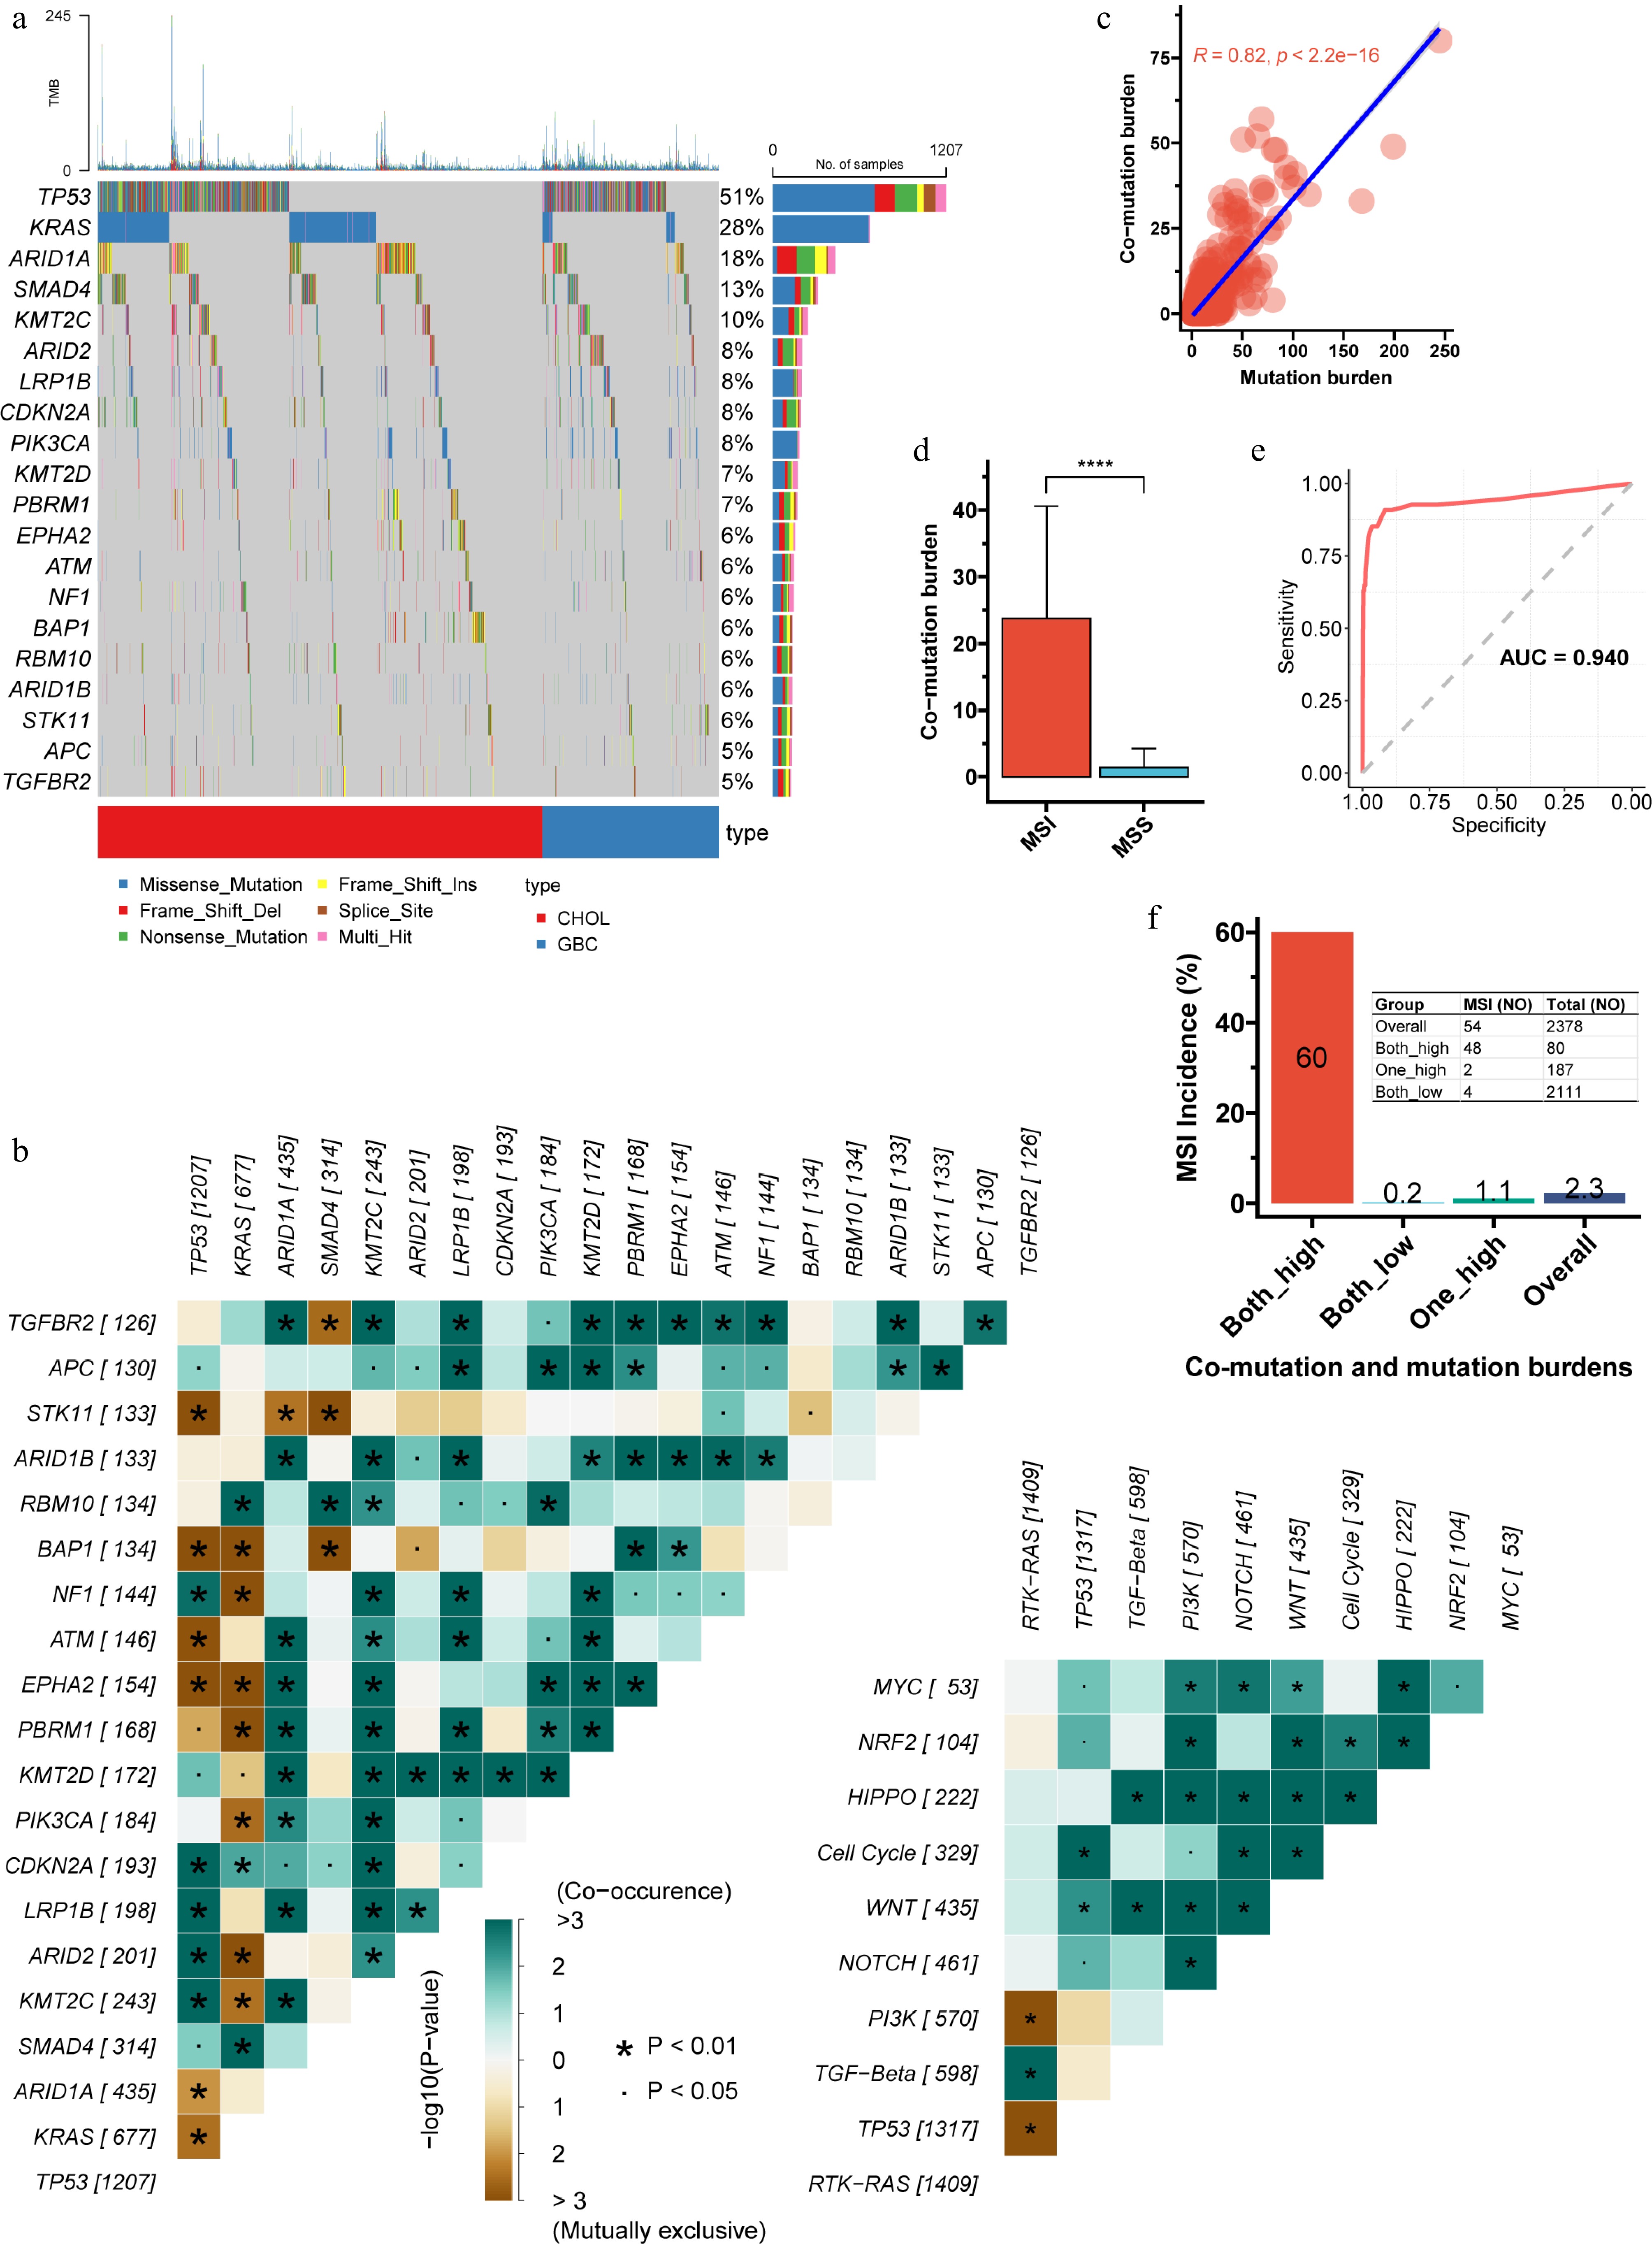
Figure 1.
Characteristics of co-mutations in the discovery cohort. (a) Waterfall plot illustrating the frequency and distribution of the top 20 most frequent mutations. (b) Analysis of mutual exclusivity and co-occurrence among the top 20 mutations, including their relationships within 10 major oncogenic signaling pathways. TP53 displayed frequent co-mutations and mutual exclusivity, while KRAS showed the highest number of mutually exclusive events. (c) Pearson correlation between co-mutation burden and total mutation burden (p < 2.2e-16). (d), Comparison of co-mutation burden between microsatellite-instable (MSI) and microsatellite-stable (MSS) tumors. (e), Receiver operating characteristic (ROC) curve and area under the curve (AUC) for predicting MSI status based on co-mutation burden (the Youden index is 4.5). (f) Using the Youden index derived from the ROC curve, both co-mutation and total mutation burdens were dichotomized into high and low groups. The incidence of MSI across the resulting combined subgroups is shown. The double-high group had an MSI frequency of 60%, significantly higher than the 1.1% observed when only one metric was high. CHOL, cholangiocarcinoma; GBC, gallbladder cancer; ROC, receiver operating characteristic; AUC, area under the curve.
Co-mutation burden was strongly correlated with TMB (R = 0.82, p < 0.001; Fig. 1c). MSI-high tumors had a significantly higher co-mutation load than MSS tumors (Fig. 1d), and co-mutation burden alone predicted MSI status with an AUC of 0.940 (Fig. 1e). Using the Youden index to dichotomize co-mutation burden and TMB, the double-high group had an MSI frequency of 60%, significantly higher than the 1.1% observed when only one metric was high (Fig. 1f).
Characteristics of co-occurring actionable alterations
-
BTCs are characterized by a high prevalence of actionable alterations[25], yet the patterns of co-occurrence and mutual exclusivity among these mutations remain poorly understood. In our discovery cohort, 68% of tumors harbored at least one actionable lesion; the five most frequent were KRAS mutation, PIK3CA mutation, ATM mutation, NF1 mutation, and ERBB2 amplification (Fig. 2a). The actionable landscapes of CHOL and GBC differed significantly: KRAS and IDH1/IDH2 mutations and FGFR2 fusions/rearrangements were enriched in CHOL, whereas ERBB2 amplification/mutation and PIK3CA or ATM mutations were more common in GBC (Fig. 2b). We therefore analyzed mutational interactions separately in CHOL and GBC. In CHOL, KRAS mutation showed negative selection, being significantly mutually exclusive with most other actionable alterations (Fig. 2c). In contrast, GBC was characterized by PIK3CA mutations co-occurring with multiple other actionable lesions (Fig. 2d), which may inform precision therapy strategies.

Figure 2.
Actionable alterations and their mutual exclusivity and co-occurrence patterns. (a) Waterfall plot displaying the frequency and spectrum of actionable alterations. (b) Comparison of actionable alteration frequencies between CHOL and GBC. The actionable landscapes of CHOL and GBC differed significantly. Patterns of mutual exclusivity and co-occurrence among actionable alterations in (c) CHOL, and (d) GBC, respectively. In CHOL, KRAS mutation showed negative selection, being significantly mutually exclusive with most other actionable alterations. In contrast, GBC was characterized by PIK3CA and IDH2 mutations co-occurring with multiple other actionable lesions. AMPL, amplification; FS, fusion; RA, rearrangement.
Drugs targeting ERBB2 amplification and FGFR2 fusion/rearrangement have been approved for BTCs[26,27]; however, patients with ERBB2 or FGFR2 mutations often receive these agents with reduced efficacy. Co-mutation profiling revealed that ERBB2-amplified tumors had a significantly higher rate of concurrent TP53 mutations than ERBB2-mutant tumors (81.0% vs 61.4%, p < 0.001; Supplementary Fig. S1a, S1b), while co-occurrence of other gene mutations was significantly lower (Supplementary Fig. S1c). In FGFR2 fusion/rearrangement tumors, BAP1 was the most frequent co-alteration, occurring more often than in FGFR2-mutant cases (35.9% vs 12.8%; Supplementary Fig. S1d–S1f). In contrast, FGFR2-mutant tumors most commonly had concurrent TP53 mutations (43.6%; Supplementary Fig. S1e), and the prevalence of TP53 and other gene mutations was significantly higher than in the fusion/rearrangement subgroup (Supplementary Fig. S1f). This data suggests that ERBB2 and FGFR2 mutations are associated with a more complex co-mutational landscape than amplifications or rearrangements, potentially explaining the reduced response to targeted therapies.
Co-mutations associated with prognosis
-
We next evaluated the relationship between co-mutations and prognosis in the ICT cohort. Univariate Cox regression identified 79 deleterious co-mutations (DCMs) significantly associated with shortened OS (p < 0.05; Supplementary Table S4, Fig. 3a). LASSO regression refined these to the 16 most influential events (Supplementary Table S5, Fig. 3b). Patients with any of these high-risk DCMs had a median OS of only 5.6 months, significantly worse than the 11.8 months in those without (HR = 8.44, 95% CI: 3.97–17.93; Fig. 3c). Multivariate Cox analysis adjusted for patient source (trial vs real-world), tumor subtype (CHOL vs GBC), age (≥ 65 vs < 65 years), sex (male vs female), and treatment line (first-line vs second-line), confirmed that DCMs were an independent predictor of poor OS (HR = 9.60, 95% CI: 4.21–21.85, p < 0.001; Fig. 3d). Among 33 patients with response data, the ORR was only 25% in the DCM subgroup, significantly lower than the 58.6% in those without DCMs (Fig. 3e).

Figure 3.
Prognostic impact of co-mutations. (a) Univariate Cox regression analysis identifying co-mutations significantly associated with prognosis (top 20 shown). (b) Selection of detrimental co-mutations (DCMs) with the strongest prognostic influence using LASSO regression. (c) Kaplan-Meier survival curves comparing patients with versus without DCMs. (d) Multivariate Cox regression evaluating the independent prognostic value of DCMs confirmed that DCMs were an independent predictor of poor OS. (e) Objective response rate (ORR) among 33 patients with available treatment-response data, stratified by the presence of DCMs. The ORR was only 25% in the DCM subgroup, significantly lower than the 58.6% in those without DCMs. mOS, median overall survival; HR, hazard ratio; CI, confidence interval; RW, real-world; 1st, first-line; 2nd, second-line. LASSO: Least absolute shrinkage and selection operator.
Using a similar approach, we refined 10 deleterious single mutations (DSMs; p < 0.05; Supplementary Table S6, Fig. S2a) to the six with the strongest impact (Supplementary Table S7, Fig. S2b). Intersection of genes involved in DCMs and these high-risk DSMs yielded five shared genes: ARID1A, MED12, TNFAIP3, PTEN, and SMO (Supplementary Fig. S2c). For DCMs involving these genes, their adverse prognostic effect was partly attributable to the single mutations. For all other co-mutation pairs, neither single mutation alone influenced outcome, but their combination was prognostically significant (Supplementary Fig. S2d). Whether this reflects biological interaction requires further investigation.
A novel classification system based on DSMs and DCMs
-
We observed a strong dose-response relationship between the number of DSMs and outcomes: more mutations correlated with worse prognosis. No sample had more than two such mutations, suggesting a potent cumulative effect (Fig. 4a). Based on this, we developed a novel genomic classification for BTCs integrating DSMs and DCMs: single-hit (SH) subtype (one DSM only); multi-hit (MH) subtype (≥ 1 DSM and/or ≥ 1 DCM); and wild-type (WT) subtype (neither).

Figure 4.
Genomic subtyping based on integrated DSMs and DCMs. (a) Survival analysis stratified by the number of detrimental single mutations (DSMs). A strong dose-response relationship was observed between the number of DSMs and outcome. (b) Survival analysis according to the proposed genomic subtypes. Outcomes differed significantly among the three groups: WT tumors had the best survival, SH intermediate, and MH the worst. (c) Stratified analysis confirmed that MH status remained a robust adverse factor across all clinically relevant subgroups. (d) ORR across genomic subtypes. WT, wild-type; SH, single-hit; MH, multi-hit.
Outcomes differed significantly among the three groups: WT tumors had the best survival, SH intermediate, and MH the worst (Fig. 4b). Stratified analysis confirmed that MH status remained a robust adverse factor across all clinically relevant subgroups (Fig. 4c). ORR mirrored survival: 66.7% for WT, 42.9% for SH, and only 20% for MH tumors (Fig. 4d).
Dissection of the MH category (Supplementary Fig. S3a) showed that most cases (61.5%) had only DCMs, 30.8% had both DSMs and DCMs, and one patient (7.7%) had two DSMs. Survival did not differ among these patterns (Supplementary Fig. S3b).
Characteristics of the three newly defined subtypes
-
We next assessed the frequency and characteristics of the three subtypes in the large cohort. Among 2,378 patients, 10.6% were MH, 17.6% SH, and 71.8% WT (Fig. 5a). The MH group comprised 80.6% with only DCMs, 15.4% with both DCMs and DSMs, and only 10 cases (4%) with > 1 DSMs and no DCMs (Fig. 5b).
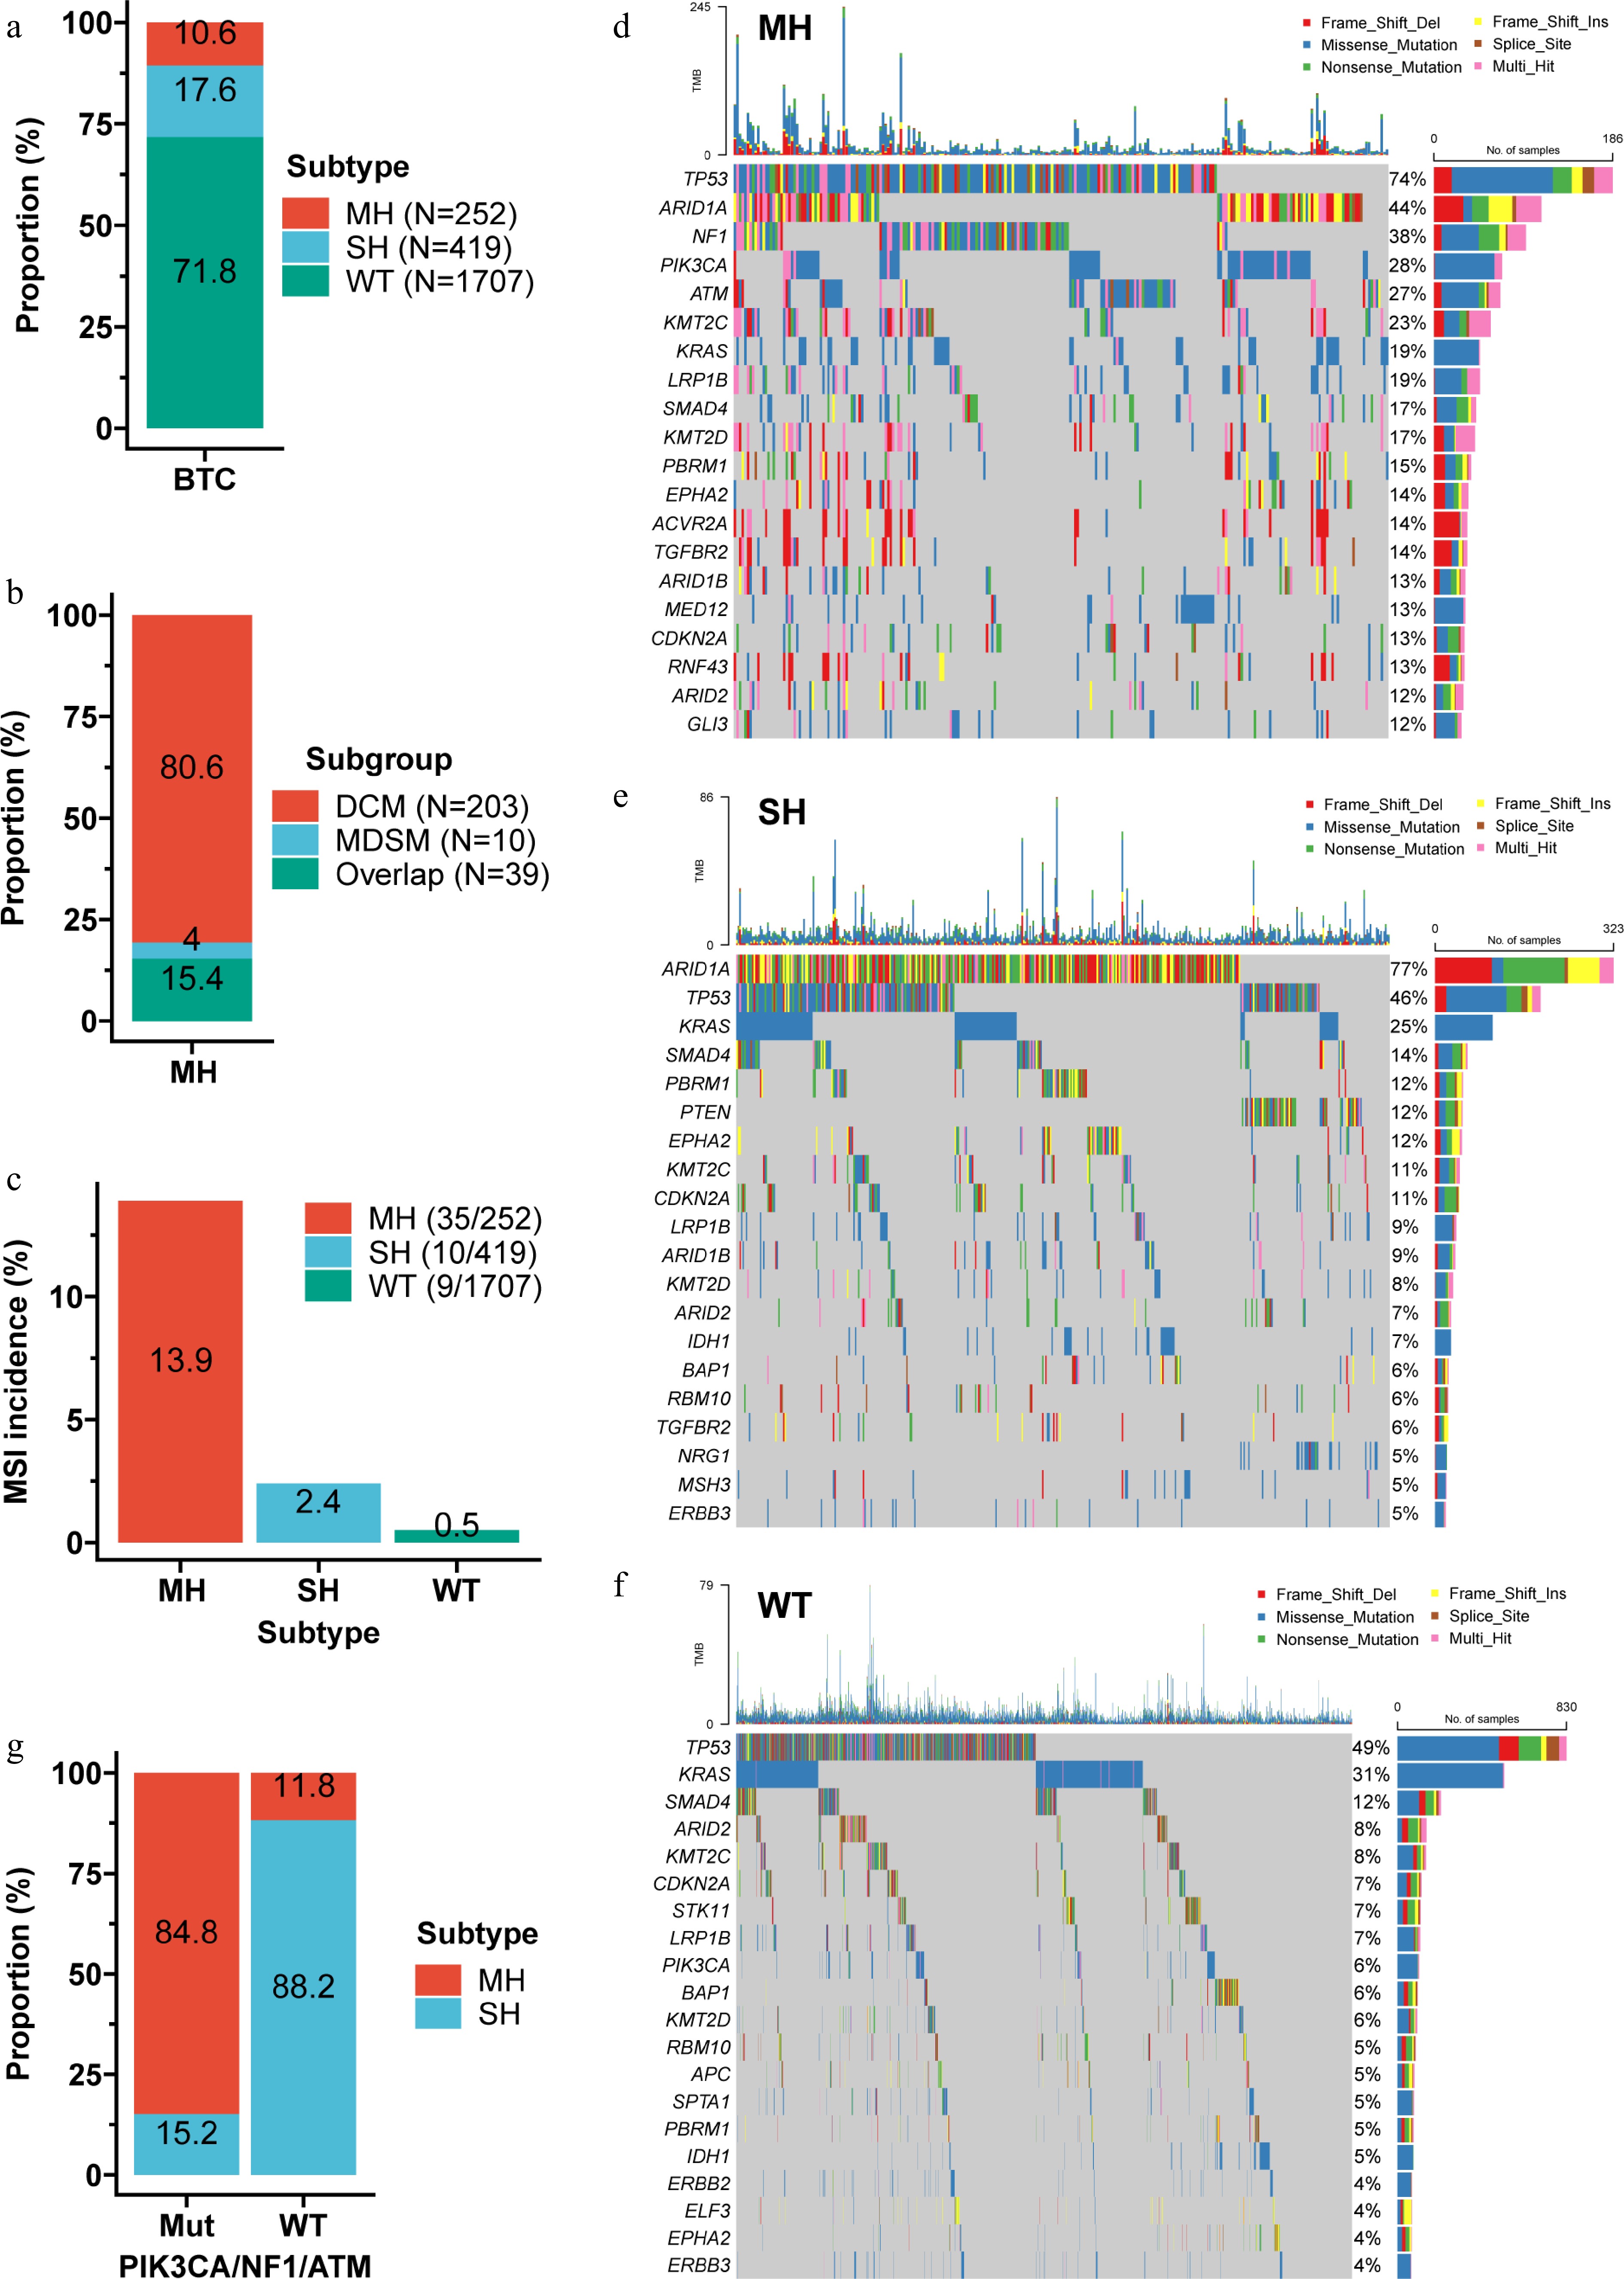
Figure 5.
Characteristics of the genomic subtypes. (a) Distribution of the three subtypes within the discovery cohort. (b) Composition of the MH subtype. (c) Prevalence of MSI across the three subtypes. MH tumors had the highest MSI rate (13.9%), followed by SH (2.4%), and WT (0.5%). Waterfall plots showing the top 20 mutations in the MH (d), SH (e), and WT (f) subtypes. (g) Proportion of MH and SH subtypes among tumors with PIK3CA/NF1/ATM mutations versus wild-type. Combining mutation status of PIK3CA, NF1, and ATM correctly distinguished > 84% of MH from SH cases. MDSM, multiple DSMs.
Despite having the worst prognosis, MH tumors had the highest MSI rate (13.9%), followed by SH (2.4%) and WT (0.5%) (Fig. 5c). In the ICT cohort, only three patients were MSI: one MH and one SH died at 6 months, while the WT patient was alive at last follow-up (Supplementary Fig. S4a), suggesting that deleterious mutations may diminish ICT benefit even in MSI tumors. Among MSS patients, the three subtypes still stratified outcomes significantly (Supplementary Fig. S4b).
Mutational landscapes differed markedly among subtypes (Fig. 5d–f). TP53 was most frequent in MH (74%), ARID1A in SH (77%), and KRAS in WT (31%). Most genes were mutated at higher rates in MH than in SH, or WT (Supplementary Fig. S5a, b). Notably, PIK3CA, NF1, and ATM were more frequently mutated in MH than in SH; combining mutation status of these three genes correctly distinguished > 84% of MH from SH cases (Fig. 5g). These features facilitate clinical implementation of the classification.
Enrichment analysis of differentially mutated genes among the three subtypes
-
To explore the biological significance of characteristic mutations in each subtype, we compared mutation frequencies pairwise among the three subtypes (Supplementary Tables S8–S10, Fig. S5), and performed enrichment analysis of significantly differential mutations using the Kyoto Encyclopedia of Genes and Genomes (KEGG) pathways, Reactome Pathways, and biological processes of Genome Ontology (GO) (Supplementary Tables S11–S13). Compared with WT, mutations enriched in the MH subtype were associated with signaling pathways related to drug resistance (e.g., platinum drug resistance), immune dysregulation (e.g., human T-cell leukemia virus 1 infection), and proliferative activity (e.g., ERBB2 signaling) (Supplementary Fig. S6a, S6b). Furthermore, compared with both WT and SH, MH-enriched mutations were linked to biological functions such as epigenetic regulation (e.g., chromatin remodeling), growth and development (e.g., developmental growth), and angiogenesis (e.g., blood vessel morphogenesis) (Supplementary Fig. S6c, S6d). SH-enriched mutations were associated with homologous recombination deficiency and cell cycle regulation compared with WT (Supplementary Fig. S6e, S6f). These findings suggest potential avenues for personalized therapy in MH and SH subtypes.
Mutation signatures in the three subtypes
-
By comparing against the Catalogue of Somatic Mutations in Cancer (COSMIC) signature database, we found that the MH subtype was dominated by defective DNA mismatch repair (cosine similarity = 0.921) and APOBEC cytidine deaminase activity (C > T; 0.699) (Supplementary Fig. S7a, S7b). The SH subtype also showed the mismatch repair signature (0.885) and an additional signature not currently in COSMIC (0.643) (Supplementary Fig. S7c, S7d). The WT subtype carried a broader range of signatures, including spontaneous/enzymatic deamination of 5-methylcytosine (0.895), APOBEC (0.781), alkylating agent exposure (0.465), and prior platinum chemotherapy (0.682) (Supplementary Fig. S7e, S7f). Consistent with this, APOBEC-enriched samples were most common in the MH subtype (40.5%), followed by SH (29.9%) and WT (28.2%) (Supplementary Fig. S8a−S8d). These findings further highlighting mutational heterogeneity among subtypes.
Actionable targets in the three subtypes
-
We examined differences in actionable targets among the subtypes. Up to 92.5% of MH tumors harbored ≥ 1 actionable alteration; the most frequent were NF1 (38.1%), PIK3CA (28.2%), and ATM (27.4%) mutations (Fig. 6a). Most actionable alterations occurred significantly more often in MH than in SH or WT, including mutations in ATM, BRCA1, BRCA2, ERBB2, FGFR1, FGFR2, MAP2K1, NF1, PIK3CA, and ERBB2 amplification. Conversely, FGFR2 fusions/rearrangements, IDH1 mutation, KRAS mutation, and MDM2 amplification were less common in MH (Table 1).
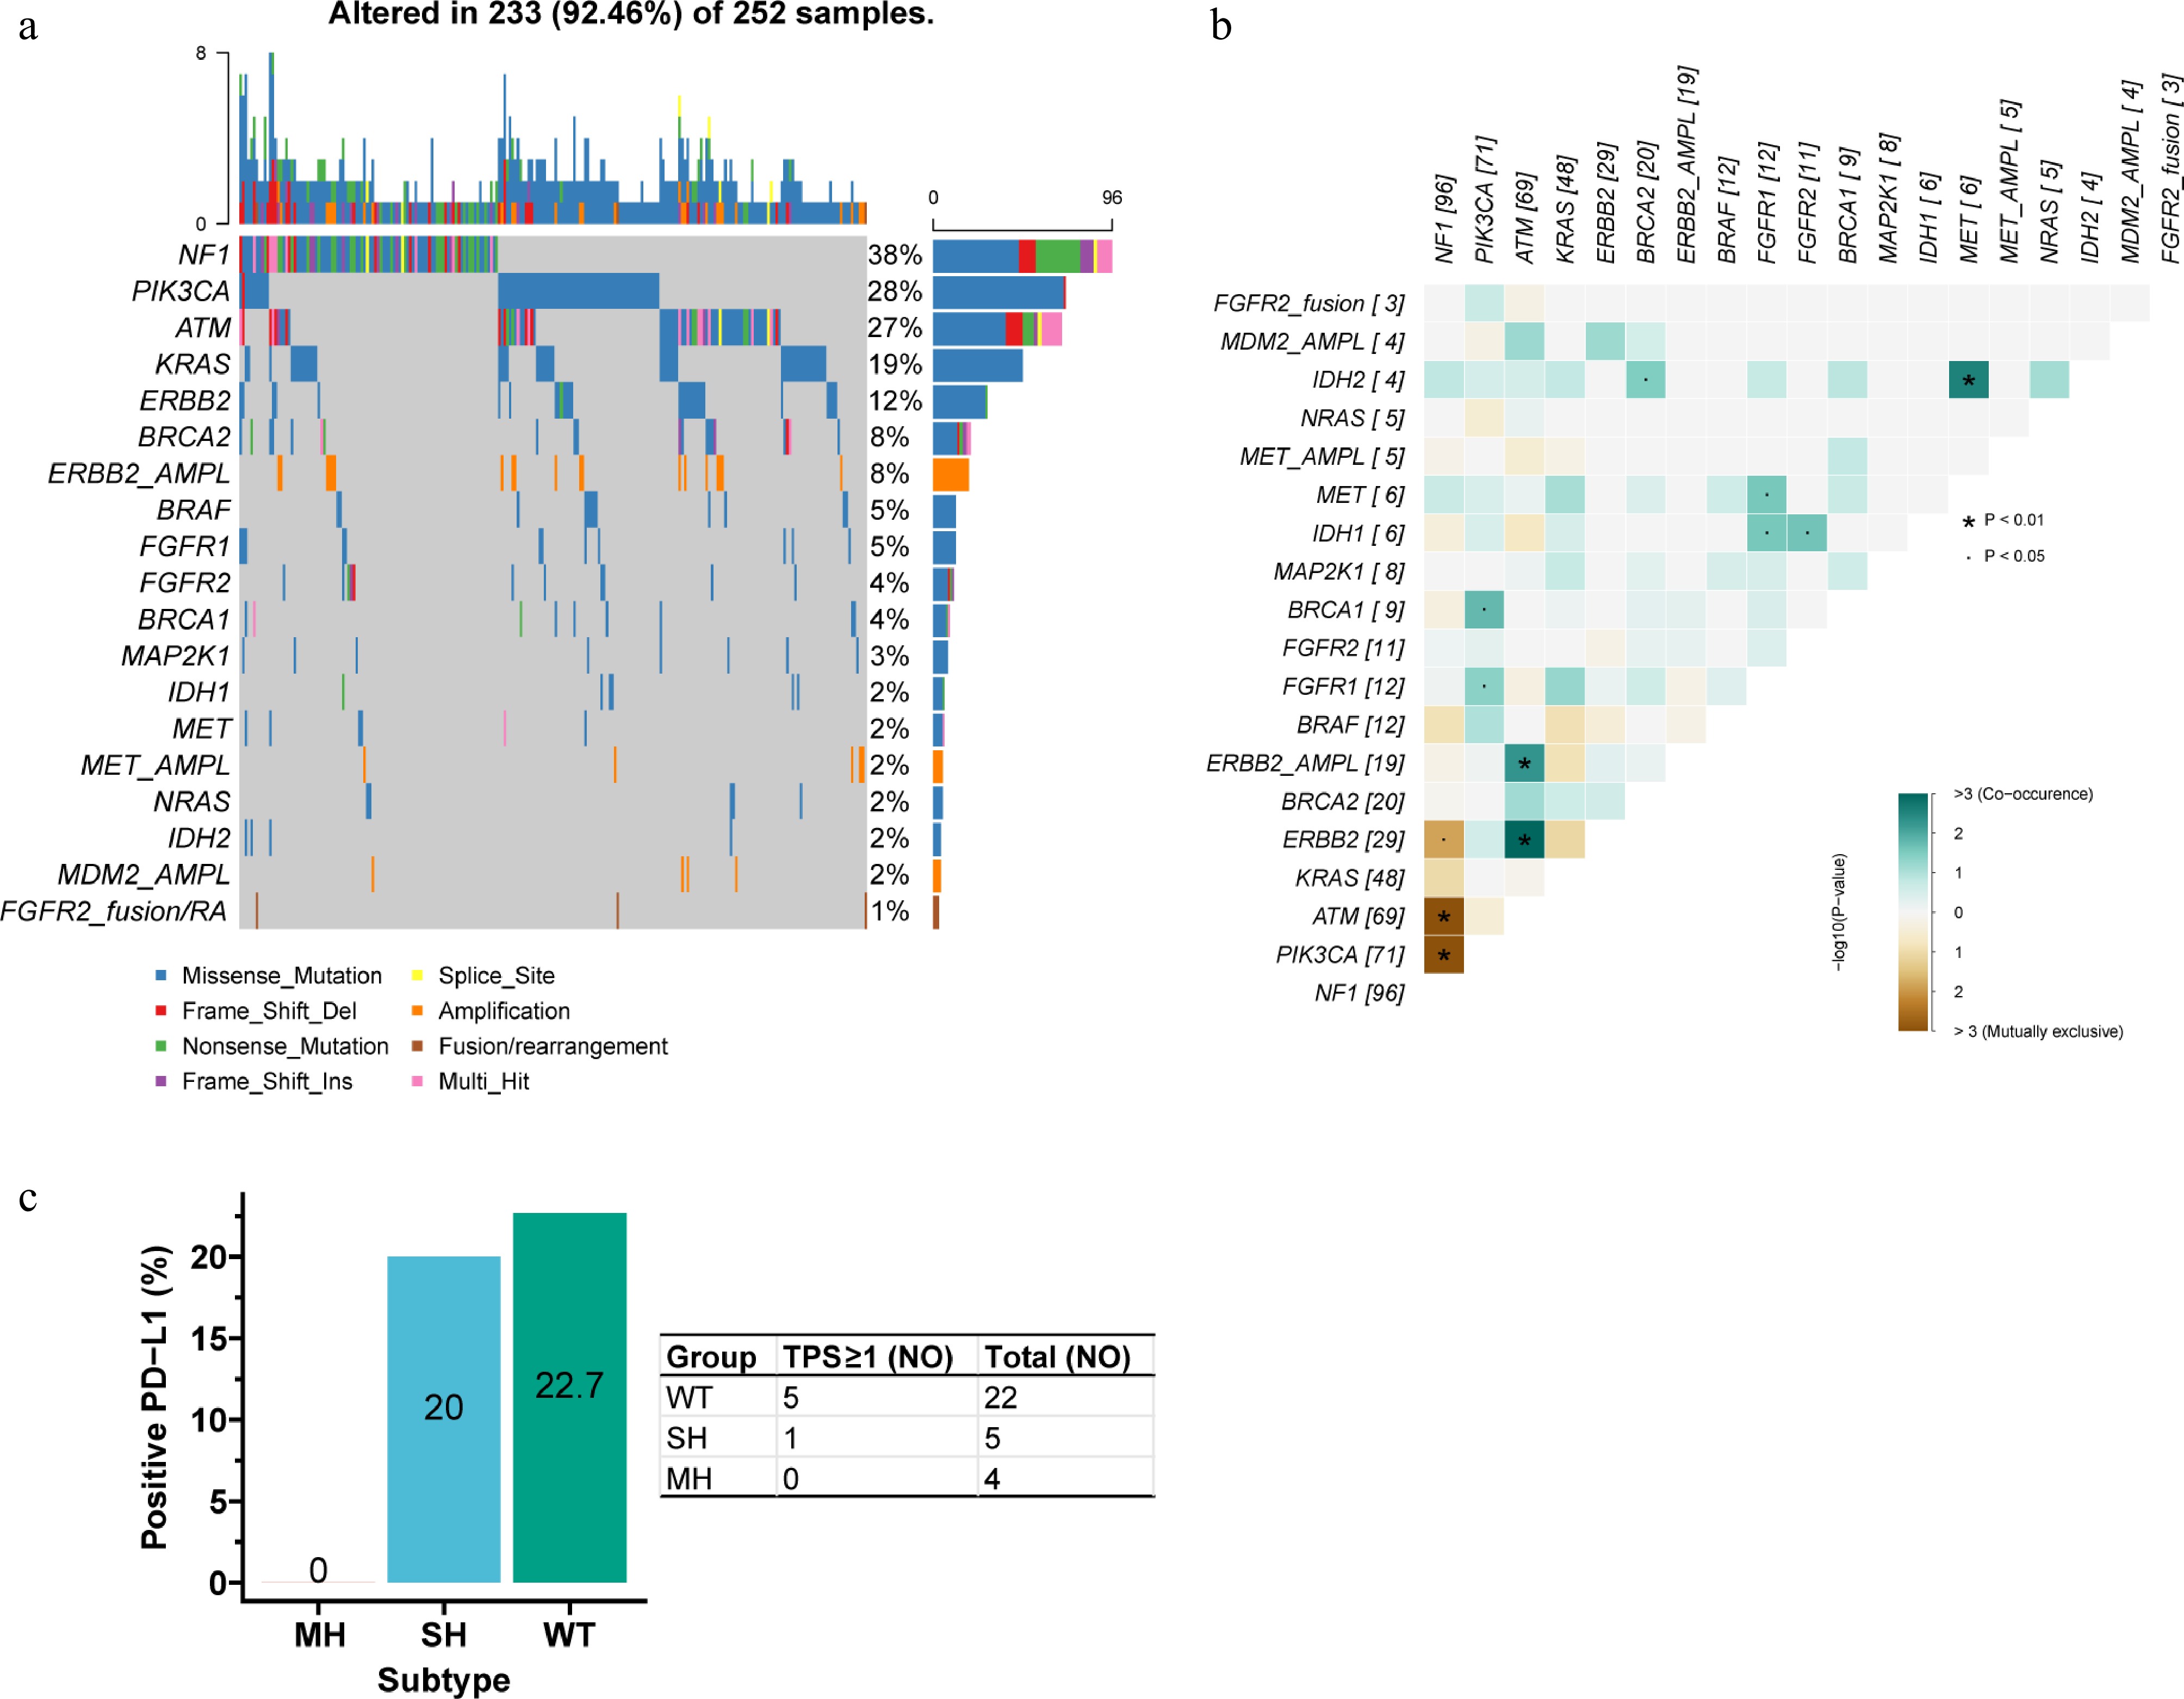
Figure 6.
Actionable alterations in the MH subtype. (a) Waterfall plot of actionable alterations. (b) Mutual exclusivity and co-occurrence among actionable alterations. NF1 mutation was mutually exclusive with ERBB2, ATM, and PIK3CA mutations. ATM mutation/amplification co-occurred with ERBB2 mutation/amplification, and IDH2 mutation co-occurred with MET mutation. (c) PD-L1 positivity rates across the three subtypes. The positivity rate (TPS ≥ 1) was 0% in MH, markedly lower than in SH (20.0%), and WT (22.7%).
Table 1. Actionable alterations among subtypes.
Gene Genotype Subtype p-Value WT (%) SH (%) MH (%) ATM WT 1,650 (96.7) 399 (95.2) 183 (72.6) < 0.001 Mut 57 (3.3) 20 (4.8) 69 (27.4) BRAF WT 1,659 (97.2) 401 (95.7) 240 (95.2) 0.117 Mut 48 (2.8) 18 (4.3) 12 (4.8) BRCA1* WT 1,698 (99.5) 414 (98.8) 243 (96.4) < 0.001 Mut 9 (0.5) 5 (1.2) 9 (3.6) BRCA2 WT 1,663 (97.4) 399 (95.2) 232 (92.1) < 0.001 Mut 44 (2.6) 20 (4.8) 20 (7.9) ERBB2 Norm 1,594 (93.4) 406 (96.9) 231 (91.7) 0.009 AMPL 113 (6.6) 13 (3.1) 21 (8.3) ERBB2 WT 1,636 (95.8) 405 (96.7) 223 (88.5) < 0.001 Mut 71 (4.2) 14 (3.3) 29 (11.5) FGFR1* WT 1,699 (99.5) 415 (99.0) 240 (95.2) < 0.001 Mut 8 (0.5) 4 (1.0) 12 (4.8) FGFR2* WT 1,684 (98.7) 414 (98.8) 241 (95.6) 0.006 Mut 23 (1.3) 5 (1.2) 11 (4.4) FGFR2* Norm 1,699 (99.5) 416 (99.3) 252 (100.0) 0.411 AMPL 8 (0.5) 3 (0.7) 0 (0.0) FGFR2 Norm 1,652 (96.8) 413 (98.6) 249 (98.8) 0.038 FS/RA 55 (3.2) 6 (1.4) 3 (1.2) IDH1 WT 1,630 (95.5) 390 (93.1) 246 (97.6) 0.021 Mut 77 (4.5) 29 (6.9) 6 (2.4) IDH2* WT 1,684 (98.7) 416 (99.3) 248 (98.4) 0.572 Mut 23 (1.3) 3 (0.7) 4 (1.6) KRAS WT 1,182 (69.2) 315 (75.2) 204 (81.0) < 0.001 Mut 525 (30.8) 104 (24.8) 48 (19.0) MAP2K1* WT 1,695 (99.3) 415 (99.0) 244 (96.8) 0.004 Mut 12 (0.7) 4 (1.0) 8 (3.2) MDM2 Norm 1,597 (93.6) 400 (95.5) 248 (98.4) 0.004 AMPL 110 (6.4) 19 (4.5) 4 (1.6) MET* WT 1,690 (99.0) 413 (98.6) 246 (97.6) 0.154 Mut 17 (1.0) 6 (1.4) 6 (2.4) MET Norm 1,671 (97.9) 409 (97.6) 247 (98.0) 0.924 AMPL 36 (2.1) 10 (2.4) 5 (2.0) NF1 WT 1,671 (97.9) 407 (97.1) 156 (61.9) < 0.001 Mut 36 (2.1) 12 (2.9) 96 (38.1) NRAS WT 1,670 (97.8) 409 (97.6) 247 (98.0) 0.937 Mut 37 (2.2) 10 (2.4) 5 (2.0) PIK3CA WT 1,601 (93.8) 412 (98.3) 181 (71.8) < 0.001 Mut 106 (6.2) 7 (1.7) 71 (28.2) *Fisher's exact test. WT: wildtype; Mut: mutation; SH: single-hit; MH: Multi-hit; AMPL: amplification; Norm: normal. Interaction analysis within MH tumors showed that NF1 mutation was mutually exclusive with ERBB2, ATM, and PIK3CA mutations. ATM mutation/amplification co-occurred with ERBB2 mutation/amplification, and IDH2 mutation co-occurred with MET mutation (Fig. 6b). Among 31 samples with PD-L1 data, the positivity rate (TPS ≥ 1) was 0% in MH, markedly lower than in SH (20.0%) and WT (22.7%) (Fig. 6c).
These findings suggest that although MH tumors are poorly suited to ICT, they harbor numerous actionable targets, indicating that matched targeted therapy may be a superior approach, though overlapping interactions among alterations must be considered.
-
This study provides a comprehensive analysis of co-mutation patterns in advanced BTCs and their impact on ICT outcomes. We identified 16 DCMs strongly associated with poor survival and response, and integrated these with DSMs to establish a novel genomic classification system for BTCs. The classification, including WT, SH, and MH subtypes effectively stratified patients into distinct prognostic subgroups with significant differences in OS and ORR. These results highlight the critical role of co-mutational landscapes in shaping therapeutic efficacy and prognosis in BTC.
The high prevalence of TP53 and KRAS mutations in our cohort aligns with previous reports in advanced BTCs[25,28]. Beyond single-gene alterations, we found that specific co-mutation patterns, such as those involving TGFBR2, ARID1A, and PIK3CA, are enriched and may drive aggressive tumor behavior. Co-mutation burden was highly correlated with TMB. It was also predictive of MSI status. These findings suggest that co-mutation analysis could serve as a proxy for genomic instability. This approach may help identify patients who are likely to benefit from immunotherapy[29,30].
Actionable alteration interactions differed between CHOL and GBC: KRAS mutations were subject to negative selection in CHOL, whereas PIK3CA mutations in GBC co-occurred with other targetable lesions. This implies that KRAS-mutant CHOL may be manageable with KRAS-targeted therapy alone, while PIK3CA-mutant GBC may require combination targeted inhibition. Moreover, ERBB2- and FGFR2-mutant tumors harbored more complex co-mutational backgrounds than amplified/rearranged cases, possibly explaining the attenuated efficacy of targeted therapies[31,32]. This underscores the need for comprehensive genomic profiling beyond single-gene testing.
The adverse effect of DCMs on ICT outcomes was independent of clinicopathological variables, reinforcing the prognostic value of molecular stratification. Certain co-mutations were associated with poor prognosis. Interestingly, neither single gene mutation alone was significant. This suggests a synergistic biological effect between the genes. Similar phenomena have been observed in other malignancies, such as NSCLC[33] and colorectal cancer[14]. For instance, KRAS/STK11 co-mutations in NSCLC define an immunotherapy-resistant subtype12, analogous to our MH subtype in BTCs.
The proposed classification is both prognostic and biologically informative. The MH subtype had a high frequency of MSI. Despite this, tumors of this subtype derived only limited benefit from ICT. This suggests that deleterious mutations in these tumors may override the immunogenicity typically associated with MSI[34]. This has important clinical implications, as MSI status alone may be insufficient to guide immunotherapy in BTCs.
Enrichment analysis linked the MH subtype to pathways involved in drug resistance, immune evasion, and proliferation, providing mechanistic insights into its poor prognosis. The high frequency of actionable mutations in MH tumors (e.g., in NF1, PIK3CA, ATM, ERBB2, and BRCA1/2) suggests opportunities for targeted combination therapies[35,36]. For example, PARP inhibitors may be explored in BRCA-mutant cases[37], while MEK or PI3K inhibitors could be considered for tumors with NF1 or PIK3CA mutations[38,39].
Mutational signature analysis further distinguished the three subtypes. The MH subtype was predominantly characterized by two specific signatures: DNA mismatch repair deficiency, and APOBEC activity. These signatures have been linked to hypermutation and immunotherapy response in other cancers[40,41]. However, in the MH subtype of BTCs, these features were associated with poor outcomes, underscoring the unique molecular context of this disease.
Several limitations should be noted. The ICT cohort was relatively small, and validation in larger prospective cohorts is needed. The biological mechanisms through which co-mutations influence the tumor microenvironment and treatment response remain to be elucidated. Functional studies and multi-omics approaches are required to uncover underlying pathways.
-
In summary, we have developed a practical and biologically relevant genomic classification system for BTCs based on co-mutation and single-mutation profiles. This framework may help guide patient selection for immunotherapy and identify new therapeutic targets for poor-prognosis subtypes. Future studies should validate this classification and explore subtype-specific treatment strategies.
This work was supported by The Natural Science Foundation of Jiangsu Province (BK20231252), Key Medical Research Projects of Jiangsu Provincial Health Commission (K2023026), Medical Education Collaborative Innovation Fund from Jiangsu University (JDY2022003), Beijing Xisike Zhaoyang Research Foundation (Y-Young2021-01074), and Beijing Xisike Clinical Oncology Research Foundation (Y-HR2019-0367).
-
The study was conducted in accordance with the Declaration of Helsinki, and all procedures were approved by the Institutional Review Board of the First Affiliated Hospital of Nanjing Medical University.
-
The authors confirm their contribution to the paper as follows: study conception and design: Zhu W, Li X, Chen X, Wang D; data collection: Chen S, Wang F, Wang D; analysis and interpretation of results: Zhu W, Li X, Chen X, Wang D; draft manuscript preparation: Zhu W, Chen X, Wang D; All authors reviewed the results and approved the final version of the manuscript.
-
Genome data is available in the Genome Sequence Archive for Humans (https://ngdc.cncb.ac.cn/gsa-human) under the HRA008984 dataset and the PRJCA031321 project.
-
The authors declare that they have no conflict of interest.
- Supplementary Table S1 Targeted sequencing panels for somatic variant detection.
- Supplementary Table S2 Patient characteristics in the large discovery cohort.
- Supplementary Table S3 Patient characteristics in the immunochemotherapy cohort.
- Supplementary Table S4 Deleterious co-mutations identified in univariate Cox regression.
- Supplementary Table S5 The co-mutation with the greatest impact on overall survival in LASSO regression.
- Supplementary Table S6 Deleterious single mutations identified in univariate Cox regression.
- Supplementary Table S7 The single mutation with the greatest impact on overall survival in LASSO regression.
- Supplementary Table S8 The mutation frequency compared between MH and WT types.
- Supplementary Table S9 The mutation frequency compared between MH and SH types.
- Supplementary Table S10 The mutation frequency compared between SH and WT types.
- Supplementary Table S11 Enrichment analysis of differential mutations between the MH and WT subtypes.
- Supplementary Table S12 Enrichment analysis of differential mutations between the MH and SH subtypes.
- Supplementary Table S13 Enrichment analysis of differential mutations between the SH and WT subtypes.
- Supplementary Fig. S1 Co-mutation profiles associated with specific ERBB2 and FGFR2 alterations.
- Supplementary Fig. S2 Identification of DSMs and their overlap with DCMs.
- Supplementary Fig. S3 Subgroups of DCMs and their prognostic significance.
- Supplementary Fig. S4 Prognostic value of the genomic subtypes stratified by MSI status.
- Supplementary Fig. S5 Mutation frequency comparisons among genomic subtypes.
- Supplementary Fig. S6 Enrichment analysis of mutated genes across genomic subtypes.
- Supplementary Fig. S7 Mutational signatures in the genomic subtypes.
- Supplementary Fig. S8 APOBEC mutagenesis enrichment analysis.
- Copyright: © 2026 by the author(s). Published by Maximum Academic Press, Fayetteville, GA. This article is an open access article distributed under Creative Commons Attribution License (CC BY 4.0), visit https://creativecommons.org/licenses/by/4.0/.
-
About this article
Cite this article
Zhu W, Li X, Che S, Wang F, Chen X, et al. 2026. Integrated co-mutation profiling reveals a novel genomic classification for prognostication and tailored therapy in biliary tract cancer. Gastrointestinal Tumors 13: e003 doi: 10.48130/git-0026-0005 

Integrated co-mutation profiling reveals a novel genomic classification for prognostication and tailored therapy in biliary tract cancer
- Received: 11 February 2026
- Revised: 14 February 2026
- Accepted: 25 February 2026
- Published online: 26 February 2026
Abstract: Biliary tract cancers (BTCs) exhibit substantial genomic heterogeneity, which is further compounded by the presence of co-mutations, thereby increasing therapeutic complexity. Utilizing a large discovery cohort of 2,378 patients and an independent immunochemotherapy (ICT) cohort of 59 patients, this study investigates the patterns of co-mutation in BTCs and their clinical implications. We identified co-mutation features with potential relevance for guiding targeted therapeutic strategies. Furthermore, we delineated deleterious co-mutations (DCMs) and deleterious single mutations (DSMs) associated with adverse clinical outcomes. By integrating DCMs and DSMs, we classified BTCs into three genomic subtypes: wild-type (WT), single-hit (SH), and multi-hit (MH). The MH subtype is characterized by a high co-mutation burden and specific mutational signatures. Despite having a high prevalence of microsatellite instability and abundant actionable alterations, this subtype shows a significantly worse response to ICT. It is also associated with shorter overall survival. In contrast, the WT subtype exhibits the best outcomes. Our findings provide a molecular framework for stratifying BTC patients. MH tumors might be prioritized for genotype-matched targeted therapy, although direct comparative evidence is still lacking.
-
Key words:
- Biliary tract cancers /
- Classification /
- Co-mutation /
- Immunotherapy /
- Targeted therapy