













-
Marine mussels in Mytiloidea Rafinesque, 1815, are widely distributed across oceans worldwide and occupy a wide range of habitats, including intertidal zones, freshwater environments, and deep-sea ecosystems[1,2]. Most mussels attach to hard substrates like rocks, nets, and biological reefs, whereas others burrow into holes of rocks and coral reefs (Owada, 2007). Several mussels, including Septifer bilocularis (Linnaeus, 1758), Mytilisepta virgata (Wiegmann, 1837), and Xenostrobus securis (Lamarck, 1819), have been regarded as important biomonitors and indicators of environmental change because of their capacity to accumulate various pollutants, such as heavy metals, radionuclides, and microplastics[3−5]. Nevertheless, owing to their wide environmental tolerance, some species have become invasive and have expanded their original geographical distribution, which has further complicated their taxonomic identification[6].
Mussels are thought to have evolved from a Paleozoic modiolopsid lineage[7]. The taxonomy of the group has been continuously refined over time, especially following the development and application of molecular methods. The major classifications are summarized in Supplementary Table S1. Most researchers support the idea that Mytiloidea includes a single family Mytilidae, which has been divided into 4–13 subfamilies[8−12]. However, Mytiloidea was sometimes classified into multiple families, with each further subdivided into several subfamilies[13−16].
The taxonomic and phylogenetic relationship in Mytiloidea still remains contentious, partly because molecular data are still limited for some species. First, studies using different datasets or analytical criteria have often reached inconsistent conclusions. For example, the monophyly of some subfamilies, including Mytilinae[17,18] and Modiolinae[1,19], remains unresolved. In addition, the taxonomic placement of some species and genera is also debated. The genus Mytilisepta, for instance, was assigned to the Brachidontinae on the basis of partial single-copy orthologous genes from the transcriptome[20] but was later placed in the Mytilinae according to an analysis of the cox1, 16S rRNA (16S), 18S, 28S, and H3 genes[19]. Subsequently, Morton et al.[21] established a new subfamily, Mytiliseptiferinae B. Morton, 2020 (later changed to Mytiliseptinae, as recorded in World Register of Marine Species [WoRMS]), for Mytilisepta, combining the morphological and molecular (cox1, 18S, 28S, and H3) evidence.
Shell morphology in mussels is strongly affected by the environmental conditions and developmental stages[2]. In addition, convergent evolution is common among mussels[22], leading to unreliable morphological identification results. Brachidontinae species are generally small and variable in their morphological characteristics, particularly those belonging to the genus Brachidontes Swainson, 1840[23−25], which has a large number of homonyms. Dentimodiolus subsulcatus (Dunker, 1857) and Dentimodiolus striatulus (Hanley, 1843) were previously assigned to Brachidontes on the basis of their morphological characteristics[26], and both species have numerous synonyms[27]. These taxonomic issues also pose challenges for phylogenetic analysis. Additionally, cryptic species within Brachidontes further complicate morphological identification and hinder taxonomic refinement[28,29].
Typical animal mtDNA exhibits high mutation rates, limited noncoding regions, and rapid evolutionary rates. These result in substantial variation among closely related species, making mtDNA useful for identifying species[30]. Mitogenomes provide extensive molecular information and therefore offer more objective and reliable evidence for reconstructing phylogenetic relationships within Mytiloidea[31,32]. Meanwhile, the gene composition and arrangement of the mitogenome is closely related to phylogeny[33]. However, some Mytiloidea species exhibit doubly uniparental inheritance (DUI), wherein both oocytes and sperm can transmit mitochondrial genes to their offspring[34], which also influences phylogenetic reconstruction[35].
In this study, we sequenced the complete mitogenomes of nine species from Brachidontinae, Mytilinae, Mytiliseptinae, and Septiferinae, i.e. Trichomya hirsuta, Septifer excisus (Wiegmann, 1837), Brachidontes sp., D. striatulus, D. subsulcatus, Brachidontes mutabilis (A. Gould, 1861), Brachidontes variabilis (Krauss, 1848), M. virgata, and S. bilocularis. Among them, the mitogenomes of the first five species were obtained for the first time. Additionally, nuclear and mitochondrial gene fragments were also sequenced for phylogenetic analysis. This study aimed to (1) elucidate the monophyly of subfamilies such as Brachidontinae and Mytilinae, and (2) clarify the taxonomic status of some genera and subfamilies, thereby contributing to the refinement of the classification of Mytiloidea.
-
Specimens of Mytiloidea were collected from coastal China from 2016 to 2024 (Supplementary Fig. S1, Supplementary Table S2). Species were initially identified on the basis of their morphological characteristics[13,26,36] (Supplementary Fig. S2). All specimens were preserved in 95% ethanol and deposited in the Laboratory of Marine Organism Taxonomy and Phylogeny, Institute of Oceanology, Chinese Academy of Sciences, Qingdao, China. All individuals were subjected to both morphological characterization and molecular sequencing. Total genomic DNA was extracted from the adductor muscle using a TIANamp Marine Animals DNA Kit (DP324-03, Tiangen Biotech Co., Ltd., Beijing, China), following the manufacturer's instructions.
Polymerase chain reaction
-
Five short gene fragments, including two mitochondrial genes (cox1 and 16S) and three nuclear genes (18S, 28S, and H3), were chosen for analysis in this study. The polymerase chain reaction (PCR) mixture had a total volume of 25 µL, containing 1 µL of each primer, 1.0 µL of the template DNA, 12.5 µL of 2× Hieff® PCR Master Mix (with Dye) (Yeasen Biotechnology (Shanghai) Co., Ltd.), and 9.5 µL of double-distilled water (ddH2O). The PCR amplification conditions were as follows: 95 °C for 5 min, 95 °C for 30 s, 48–56 °C for 1 min, 72 °C for 1 min) × 34, and 72 °C for 10 min. The primer sequences and the annealing temperatures, with their literature sources, are shown in Supplementary Table S3. The purity of the PCR products was tested by agarose gel electrophoresis, and the products were sequenced on the Applied Biosystems 3730xl Genetic Analyzer (Sangon Biotech [Shanghai] Co., Ltd.).
Sequencing, assembly and annotation for mitogenomes
-
The genomic library for each species was constructed by Genepioneer Biotechnologies Co., Ltd (Nanjing, China) and OneMore Technology Co., Ltd. (Wuhan, China) using the NovaSeq 6000 platform (Illumina). Raw data were generated with 2 × 150-bp paired-end reads, and adapters were removed using Adapter Removal v.2[37]. De novo assembly was performed with A5-miseq v20150522[38] and SPAdes v3.9.0[39]. Functional annotation of the complete mitogenome sequences was carried out with the MITOS2 tool from Galaxy web server (
https://usegalaxy.org/ )[40], with the genetic code set to '5 Invertebrate'. The boundaries of protein-coding genes (PCGs) were identified using ORF Finder (www.ncbi.nlm.nih.gov/orffinder ) and then manually corrected by comparison with homologous genes from related species within the same family. Transfer RNA (tRNA) genes were initially predicted using ARWEN[41], with invertebrate mitochondrial codons and the default search patterns. The two ribosomal RNA (rRNA) genes were identified by comparing their sequences with previously reported rRNA sequences from Mytiloidea. Features of the circular mitochondrial genomes were visualized using Proksee (https://Proksee.ca )[42].Genome composition and codon usage
-
The nucleotide base composition was analyzed using MEGA 7.0[43]. The relative synonymous codon usage (RSCU) was estimated with PhyloSuite v1.2.3[44]. The composition's skew values were calculated using the formulas AT skew = (A − T) / (A + T) and GC skew = (G − C) / (G + C), where A, T, G, and C represent the frequencies of the respective nucleotide bases.
Phylogenetic analysis and gene arrangement
-
The taxonomic classification, source data, and GenBank accession numbers for all the sequences involved in the phylogenetic analysis are listed in Table 1. Phylogenetic analysis was conducted using PhyloSuite v1.2.3[44]. The PCGs and RNAs extracted from the mitogenomes, as well as the gene fragments obtained through sequencing, were aligned separately using Multiple Alignment Using Fast Fourier Transformation (MAFFT). The invertebrate mitochondrial genetic code was applied for PCG alignment, and the normal mode was used for rRNA alignment. The initial alignments were processed with Gblocks to retain only sites with a clear positional homology. TrimAl was used to trim rRNAs.
Table 1. Taxonomic information and GenBank accession numbers of the mitogenomes used in this study.
Family Subfamily Genus Species Accession number Mytilidae Brachidontinae Brachidontes variabilis PP803426 PP625989 exustus KM233636 mutabilis PP737799 MK721541 pharaonis ON464164 ON464163 sp. PQ474241 Geukensia demissa MN449488 MN449487 Mytilinae Gregariella coralliophaga MK721545 Crenomytilus grayanus MK721543 Mytilus californianus GQ527172 coruscus OR453541 trossulus GU936626 AY823625 edulis HM489874 MF407676 chilensis KT966847 KP100300 galloprovincialis FJ890849 FJ890950 Trichomya hirsuta PQ276587 Dentimodiolus striatulus PP781934 PQ467909 subsulcatus PQ645166 Crenellinae Arcuatula senhousia MW727510 GU001953 GU001954 Mytella strigata OR666116 MT800514 Perna perna KM655841 OK576479 PP059121 viridis JQ970425 canaliculus MW727514 Mytiliseptinae Mytilisepta keenae MK721542 virgata PP436910 KX094521 ON193524 Perumytilus perpuratus MH330331 MH3303333 Semimytilus algosus MT026713 Septiferinae Septifer bilocularis PP436911 MK721549 excisus PQ397790 Modiolidae Bathymodiolinae Bathymodiolus septemdierum AP014562 japonicus AP014560 marisindicus MT916745 azoricus MT916742 Gigantidas platifrons AP014561 haimaensis MT916746 childressi MT916744 vrijenhoeki ON128253 Modiolinae Modiolus modiolus KX821782 nipponicus MK721547 modulaides OL853493 PP135062 auriculatus PP135063 comptus MN602036 Limnoperninae Limnoperna fortunei KP756907 Xenostrobinae Xenostrobus securis ON128254 Vignadula atrata ON153190 OM001008 Botulinae Leiosolenus hanleyanus PP708086 Margaritidae − Pinctada maxima GQ452847 Pinnidae − Pinna rudis LC634517 Arcidae − Barbatia decussata MW629559 Sequences obtained in this study are marked in bold. The saturation of nucleotide substitutions was detected by Data Analysis in Molecular Biology and Evolution (DAMBE)[45]. The analysis was performed on all sites, with gaps treated as unknown data. Subsets containing 4, 8, 16, and 32 operational taxonomic units (OTUs) were randomly sampled 60 times, and the saturation test was conducted for each subset. The sequences extracted from the mitogenomes were concatenated to form the mitochondrial matrix (the MT matrix), which excluded nucleotide substitution saturation sites (the third codon). The five gene fragments (cox1, 16S, 18S, 28S and H3) obtained by sequencing were also concatenated to create the gene fragment matrix (the GF matrix).
Phylogenetic trees were reconstructed on the basis of nucleotide sequences and amino acid sequences using maximum likelihood (ML) and Bayesian inference (BI) methods, respectively. The partitions and evolutionary models used for the phylogenetic analysis are shown in Supplementary Table S4. The MT matrix was used to infer phylogenetic relationships among 67 Mytiloidea species. Pinctada maxima (Jameson, 1901), Pinna rudis Linnaeus, 1758, and Barbatia decussata (G. B. Sowerby I, 1833) were designated as the outgroups. The ML analysis was conducted in IQ-TREE using the ultrafast bootstrap approach with 1,000 nonparametric bootstrapping replicates. A 50% majority-rule consensus tree was generated by running 1 million generations using MrBayes v3.2[46]. The average standard deviation of split frequencies was below 0.01, and the first 25% of the samples were discarded as burn-in. Additionally, the GF matrix was utilized to construct a Bayesian tree, with additional sequences downloaded from GenBank (listed in Supplementary Table S5). Magallana angulata, Pinna muricata, and Barbatia trapezina were selected as outgroups. The resulting phylogenetic trees were visualized via iTOL (
https://itol.embl.de/ ).To infer potential gene rearrangements among Septiferinae, Mytilinae, Brachidontinae, and Mytiliseptinae, comparisons of their mitogenomes were performed using the Common Interval Rearrangement Explorer (CREx) tool[47]. Among the genera involved in this study, marked differences in gene arrangement were observed only between two species of Mytilisepta, namely M. virgata and M. keenae (Nomura, 1936). Therefore, an additional CREx analysis was performed for these two species. Kimura 2-parameter (K2p) distances were calculated with cox1 sequences extracted from the mitogenomes of Brachidontinae species by MEGA v7.0[43]. According to the results of substitution saturation, the third codons of the cox1 dataset were excluded before estimating the genetic distance. The Assemble Species by Automatic Partitioning (ASAP)[48] and Poisson Tree Processes (PTP) tools[49] were used to delimit species with complete cox1 and 16S sequences extracted from Brachidontes species.
Estimation of divergence times
-
MCMCtree[50] was used for estimation of the divergence times with the correlated rates clock. The General Time Reversible (GTR) model, selected by ModelFinder[51], was applied in the analysis. Three Mytiloidea fossil calibration points were selected for estimating the divergence time. The fossil time of Arcuatula senhousia (W. H. Benson, 1842) (0.78–2.59 million years ago [Mya])[52] and Modiolus sp. (393–408 Mya) recorded in the Paleobiology Database (
http://paleodb.org ) were used as calibration constraints. The root of Mytiloidea was constrained to 419–427 Mya[53]. Each Markov chain was run for 30 million generations twice and sampled every 5,000 generations, with the first 25% discarded as burn-in. The effective sample size (ESS) of all parameters was over 200, as confirmed by Tracer v1.6[54]. Figtree v1.4.3 was used to generate and visualize the time tree. -
The mitogenomes of Trichomya hirsuta, M. virgata, S. bilocularis, S. excisus, B. mutabilis, B. variabilis, D. striatulus, D. subsulcatus, and Brachidontes sp. were all double-stranded circular molecules, ranging from 14,714 to 19,454 bp (Supplementary Fig. S3, Supplementary Table S6). As observed in many other bivalves, the noncoding regions varied in length among these mitogenomes. All the functional genes were encoded on the heavy chain (Supplementary Tables S7−S16). B. mutabilis, B. variabilis, D. striatulus, and D. subsulcatus contained 12 PCGs (atp6, cox1, cox2, cox3, cytb, nad1, nad2, nad3, nad4, nad4l, nad5, and nad6), 22 tRNAs, and 2 rRNAs (12S and 16S), whereas T. hirsuta, S. excisus, S. bilocularis, and Brachidontes sp. contained an additional PCG, atp8. Several tRNAs had one or more copies. For example, T. hirsuta and Brachidontes species contained two copies of trnM, trnL, and trnS. Moreover, tRNA copy numbers differed even between species of the same genus, as shown by M. virgata and M. keenae. M. virgata contained two copies of trnS and one copy of trnM, whereas M. keenae had only one copy of trnS and two copies of trnM. All the mitogenomes exhibited (A + T)-biased composition, ranging from 60.45% to 69.28%. Overall, the nucleotide composition exhibited a negative AT-skew and a positive GC-skew. Similar patterns were also observed in the PCGs and tRNA genes of all mitogenomes. For rRNAs, most mitogenomes showed a negative AT-skew and a positive GC-skew, except for D. striatulus and D. subsulcatus, which showed a positive AT-skew of 0.009, 0.004, and 0.002 for D. striatulus 1, D. striatulus 2, and D. subsulcatus, respectively. Among the PCGs, seven genes used GTG or TTG as the start codons, whereas the remaining PCGs used ATN. TAA and TAG were the most frequently used stop codons. No more than two PCGs used the incomplete stop codons, TA- or T--.
The usage frequency of each amino acid varied among the 10 mitogenomes, with phenylalanine (Phe), valine (Val), glycine (Gly), and leucine (Leu)2 being the most commonly used (Supplementary Fig. S4). Among the 22 amino acids, nine (Pro, threonine [Thr], Leu1, arginine [Arg], alanine [Ala], serine [Ser]1, Ser2, Val, and Gly) were encoded by four codons, whereas the remaining are encoded by two codons (Supplementary Fig. S5). In addition, the average number of codons used for the same amino acids varied among these 10 mitogenomes. For example, the RSCU of AAA-lysine (Lys) was 1.01 in D. striatulus and 0.89 in T. hirsuta. Differences in RSCU values were also observed among species of the same genus. For instance, within Brachidontes, the RSCU values of GGU-Gly in Brachidontes sp., B. variabilis, and B. mutabilis were 1.81, 2.22, and 1.79, respectively.
The detection of substitution saturation (Supplementary Table S17) revealed that the observed saturation index (Iss) of PCGs is significantly higher than the critical index (Iss.c), indicating substantial saturation in these sequences. In contrast, the rRNA sequences showed no evidence of substitution saturation.
Phylogenetic relationships
-
The MT matrix was used to construct phylogenetic trees by the ML and BI methods, with the nucleotide sequence set of each species comprising 11,224 bp. The BI and IQ trees of both the nucleotide and amino acid datasets exhibited identical topologies, and all branches of both trees were well supported (Fig. 1 and Supplementary Fig. S6). Mytiloidea was divided into two major clades (Clade 1 and Clade 2). Clade 1 comprised species from five subfamilies (Mytilinae, Crenellinae, Septiferinae, Brachidontinae, and Mytiliseptinae), whereas Clade 2 consisted of Bathymodiolinae, Modiolinae, Xenostrobinae, and Limnoperninae. Within Clade 1, Mytilinae formed a well-supported monophyletic group (posterior probability [PP] = 1, bootstrap [BS] = 100). Septiferinae species were recovered as sister to the clade comprising Mytilinae and Crenellinae, and were positioned at the base of Clade 1a. Notably, Mytiliseptinae species were nested within Brachidontinae, thereby rendering Brachidontinae nonmonophyletic. In Mytilinae, Mytilus species first clustered with Crenomytilus grayanus (Dunker, 1853) (PP = 1, BS = 100) then grouped with Thirsuta (PP = 0.64, BS = 72). D. striatulus and D. subsulcatus further clustered with [(Mytilus + Crenomytilus) + Trichomya]. Moreover, the two mitochondrial inheritance types of the same species did not cluster together, as observed in Mytilus galloprovincialis, M. edulis, and M. chilensis. In Brachidontinae, except for Geukensia demissa (Dillwyn, 1817), the other species were divided into two clades (Clade A and B). Clade A included B. mutabilis, B. sp., B. pharaonis (P. Fischer, 1870), and B. variabilis, whereas Clade B included only B. exustus (Linnaeus, 1758). In Clade A, B. mutabilis (MK721541) was first positioned as sister to B. sp. and then grouped with B. mutabilis (PP737799) sequenced in this study. Meanwhile, B. exustus in Clade B clustered with Perna perna (Linnaeus, 1758), rather than with the other species of Brachidontes. Within Clade 2, Bathymodiolinae was sister to Modiolinae, and both subfamilies were monophyletic. Xenostrobinae was also recovered as a monophyletic group.
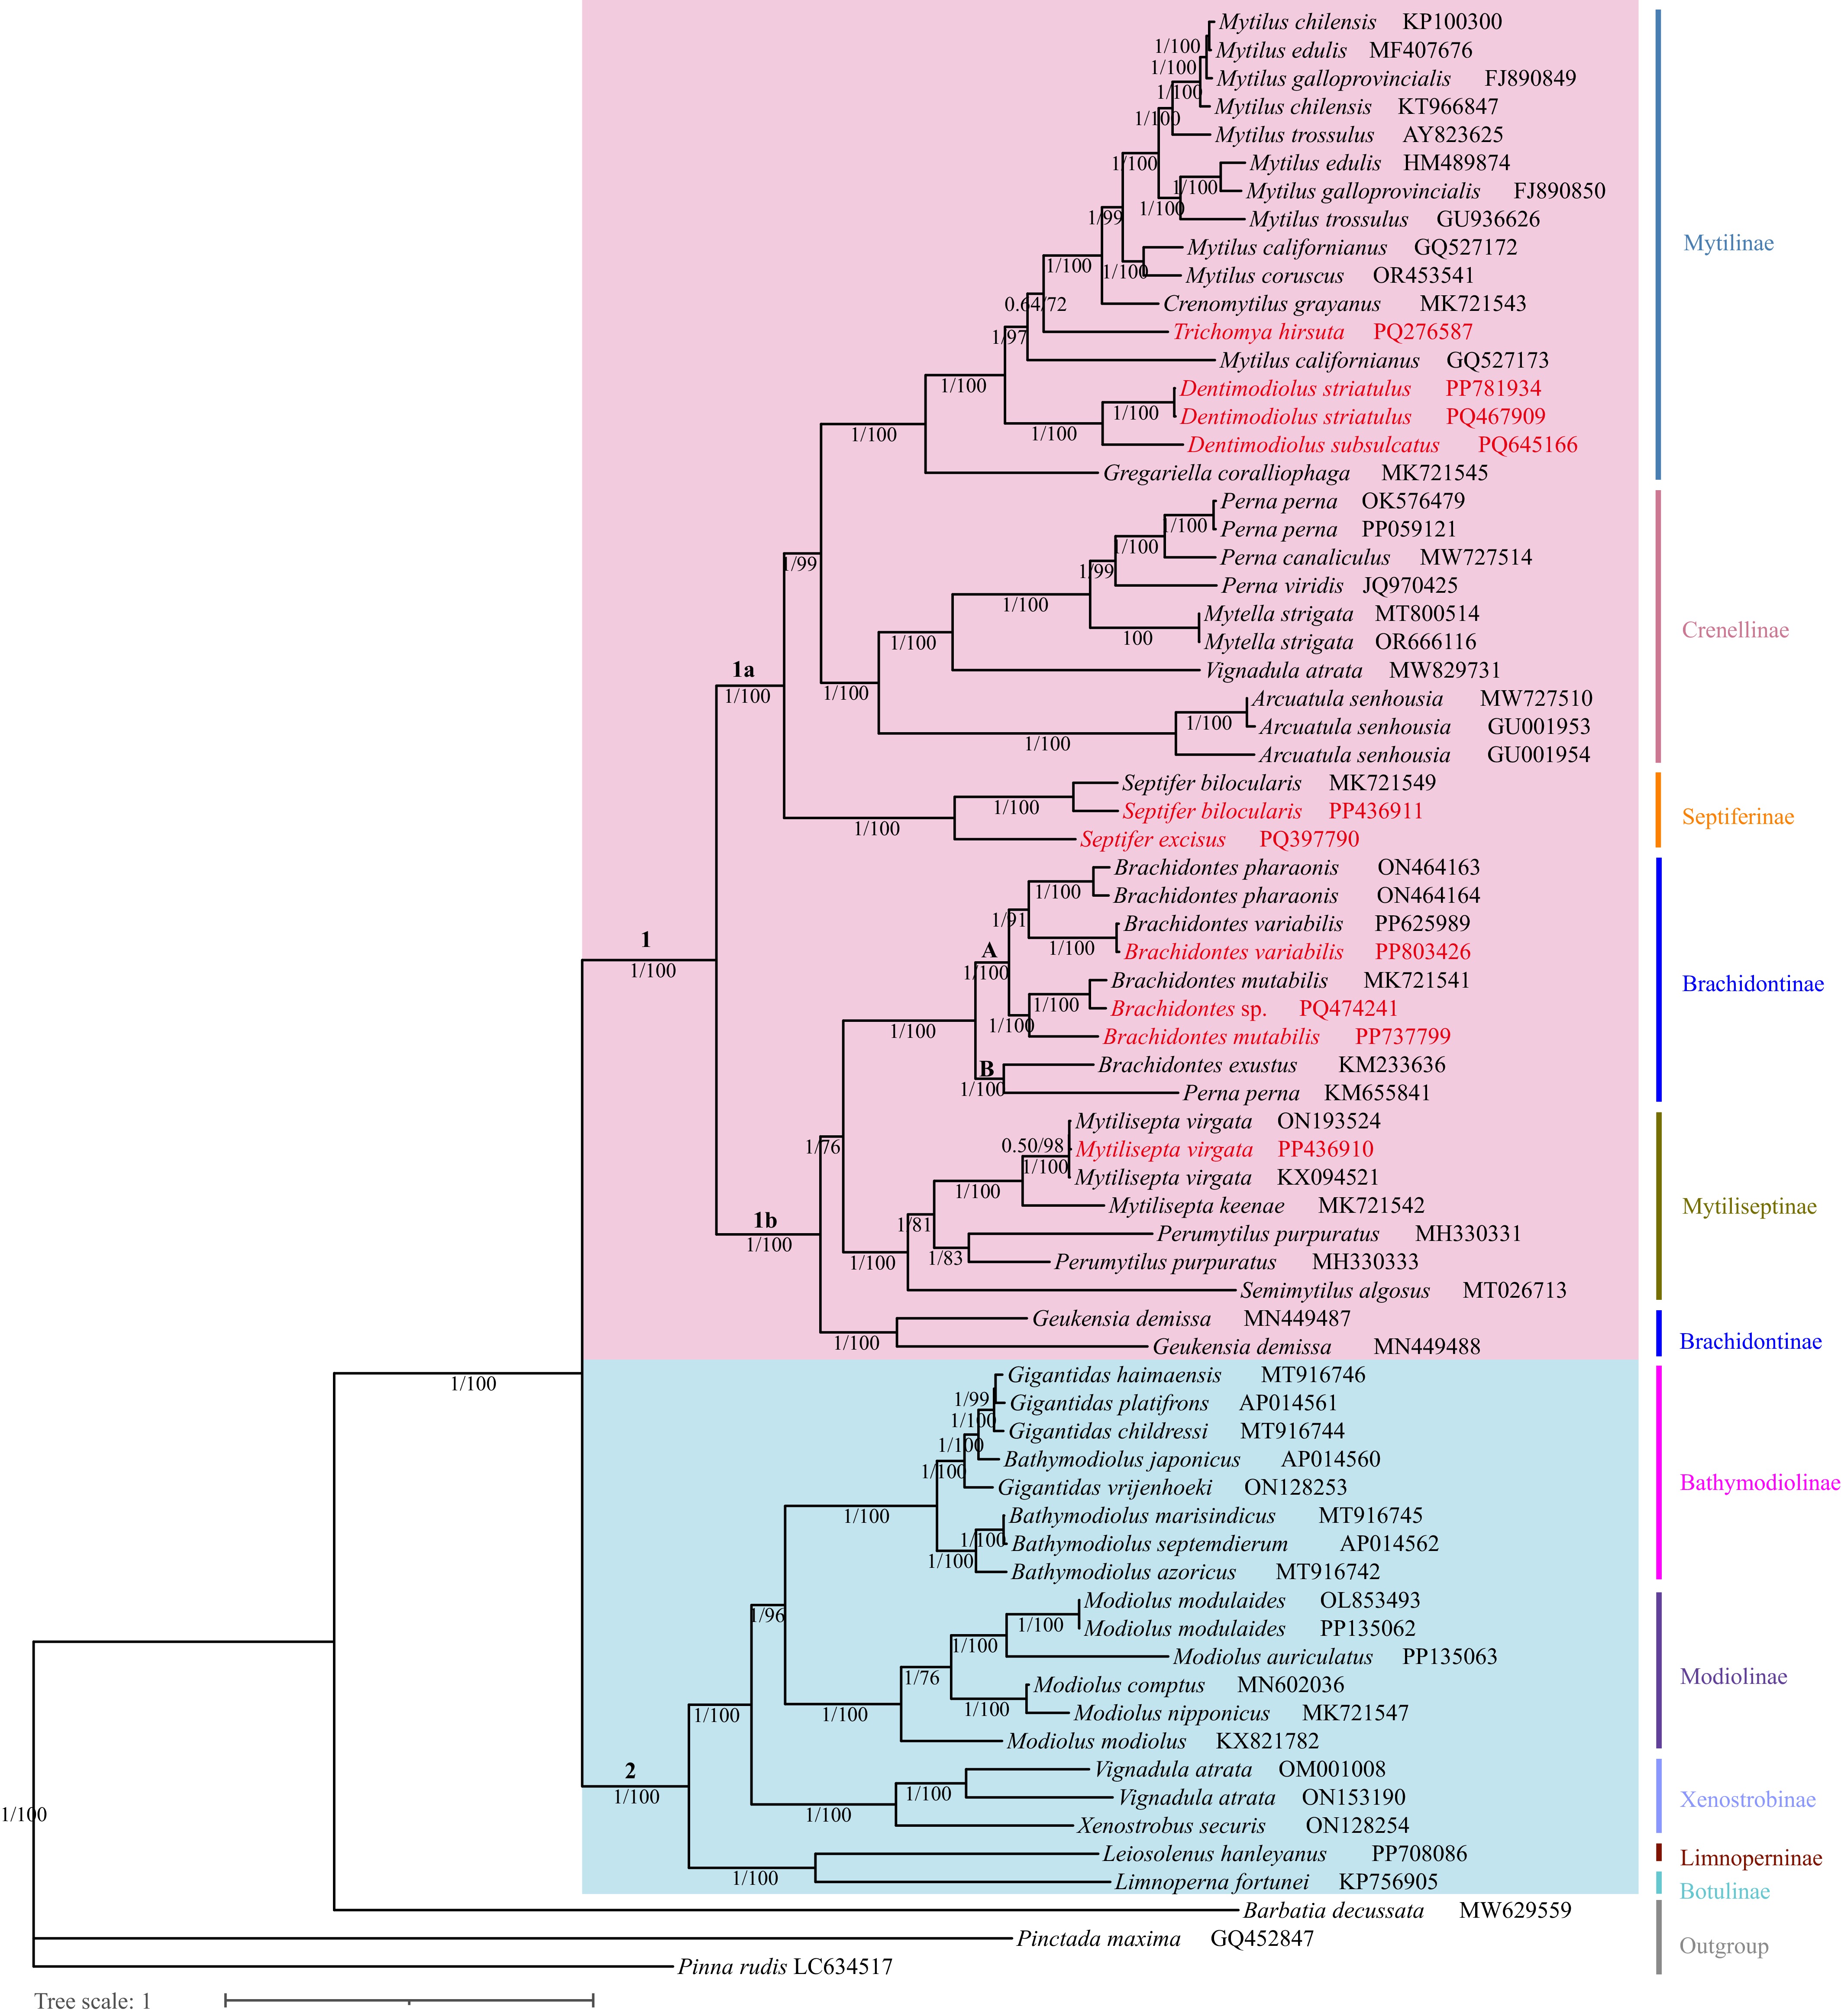
Figure 1.
The phylogenetic tree based on the mitogenomes of Mytiloidea. The mitogenomes newly sequenced in this study are marked in red. Posterior probability (PP) / bootstrap (BS) are shown at nodes. The bold letters represent different clades.
The topology of the tree based on the GF matrix (3,730 bp) was generally similar to that based on the MT matrix (Fig. 2). Mytiloidea was divided into two clades. One contained Mytilinae, Crenellinae, Septiferinae, Brachidontinae, and Mytiliseptinae, and the other contained Bathymodiolinae, Modiolinae, Xenostrobinae, and Botulinae. In Clade 1, Brachidontinae was monophyletic, with Mytiliseptinae positioned as its sister group, which differed from the topology of the MT-based tree. Brachidontes species were also divided into two clades. B. variabilis, B. pharaonis (Fischer, 1876), Brachidontes sp., B. mutabilis, and B. ustulatus (Lamarck, 1819) were grouped in Clade M, whereas B. rodriguezii (d'Orbigny, 1842) formed an independent clade, namely Clade N. Unexpectedly, B. erosus (Lamarck, 1819) did not cluster with other Brachidontes species, but instead formed a sister group with G. demissa. A similar pattern was also observed in Modiolus sp. (A and B), which clustered with Dentimodiolus species. In Clade 2, Bathymodiolinae clustered with the long-branched Xenostrobinae, rather than as a sister group of Modiolinae, as observed in the MT-based tree (Fig. 1).
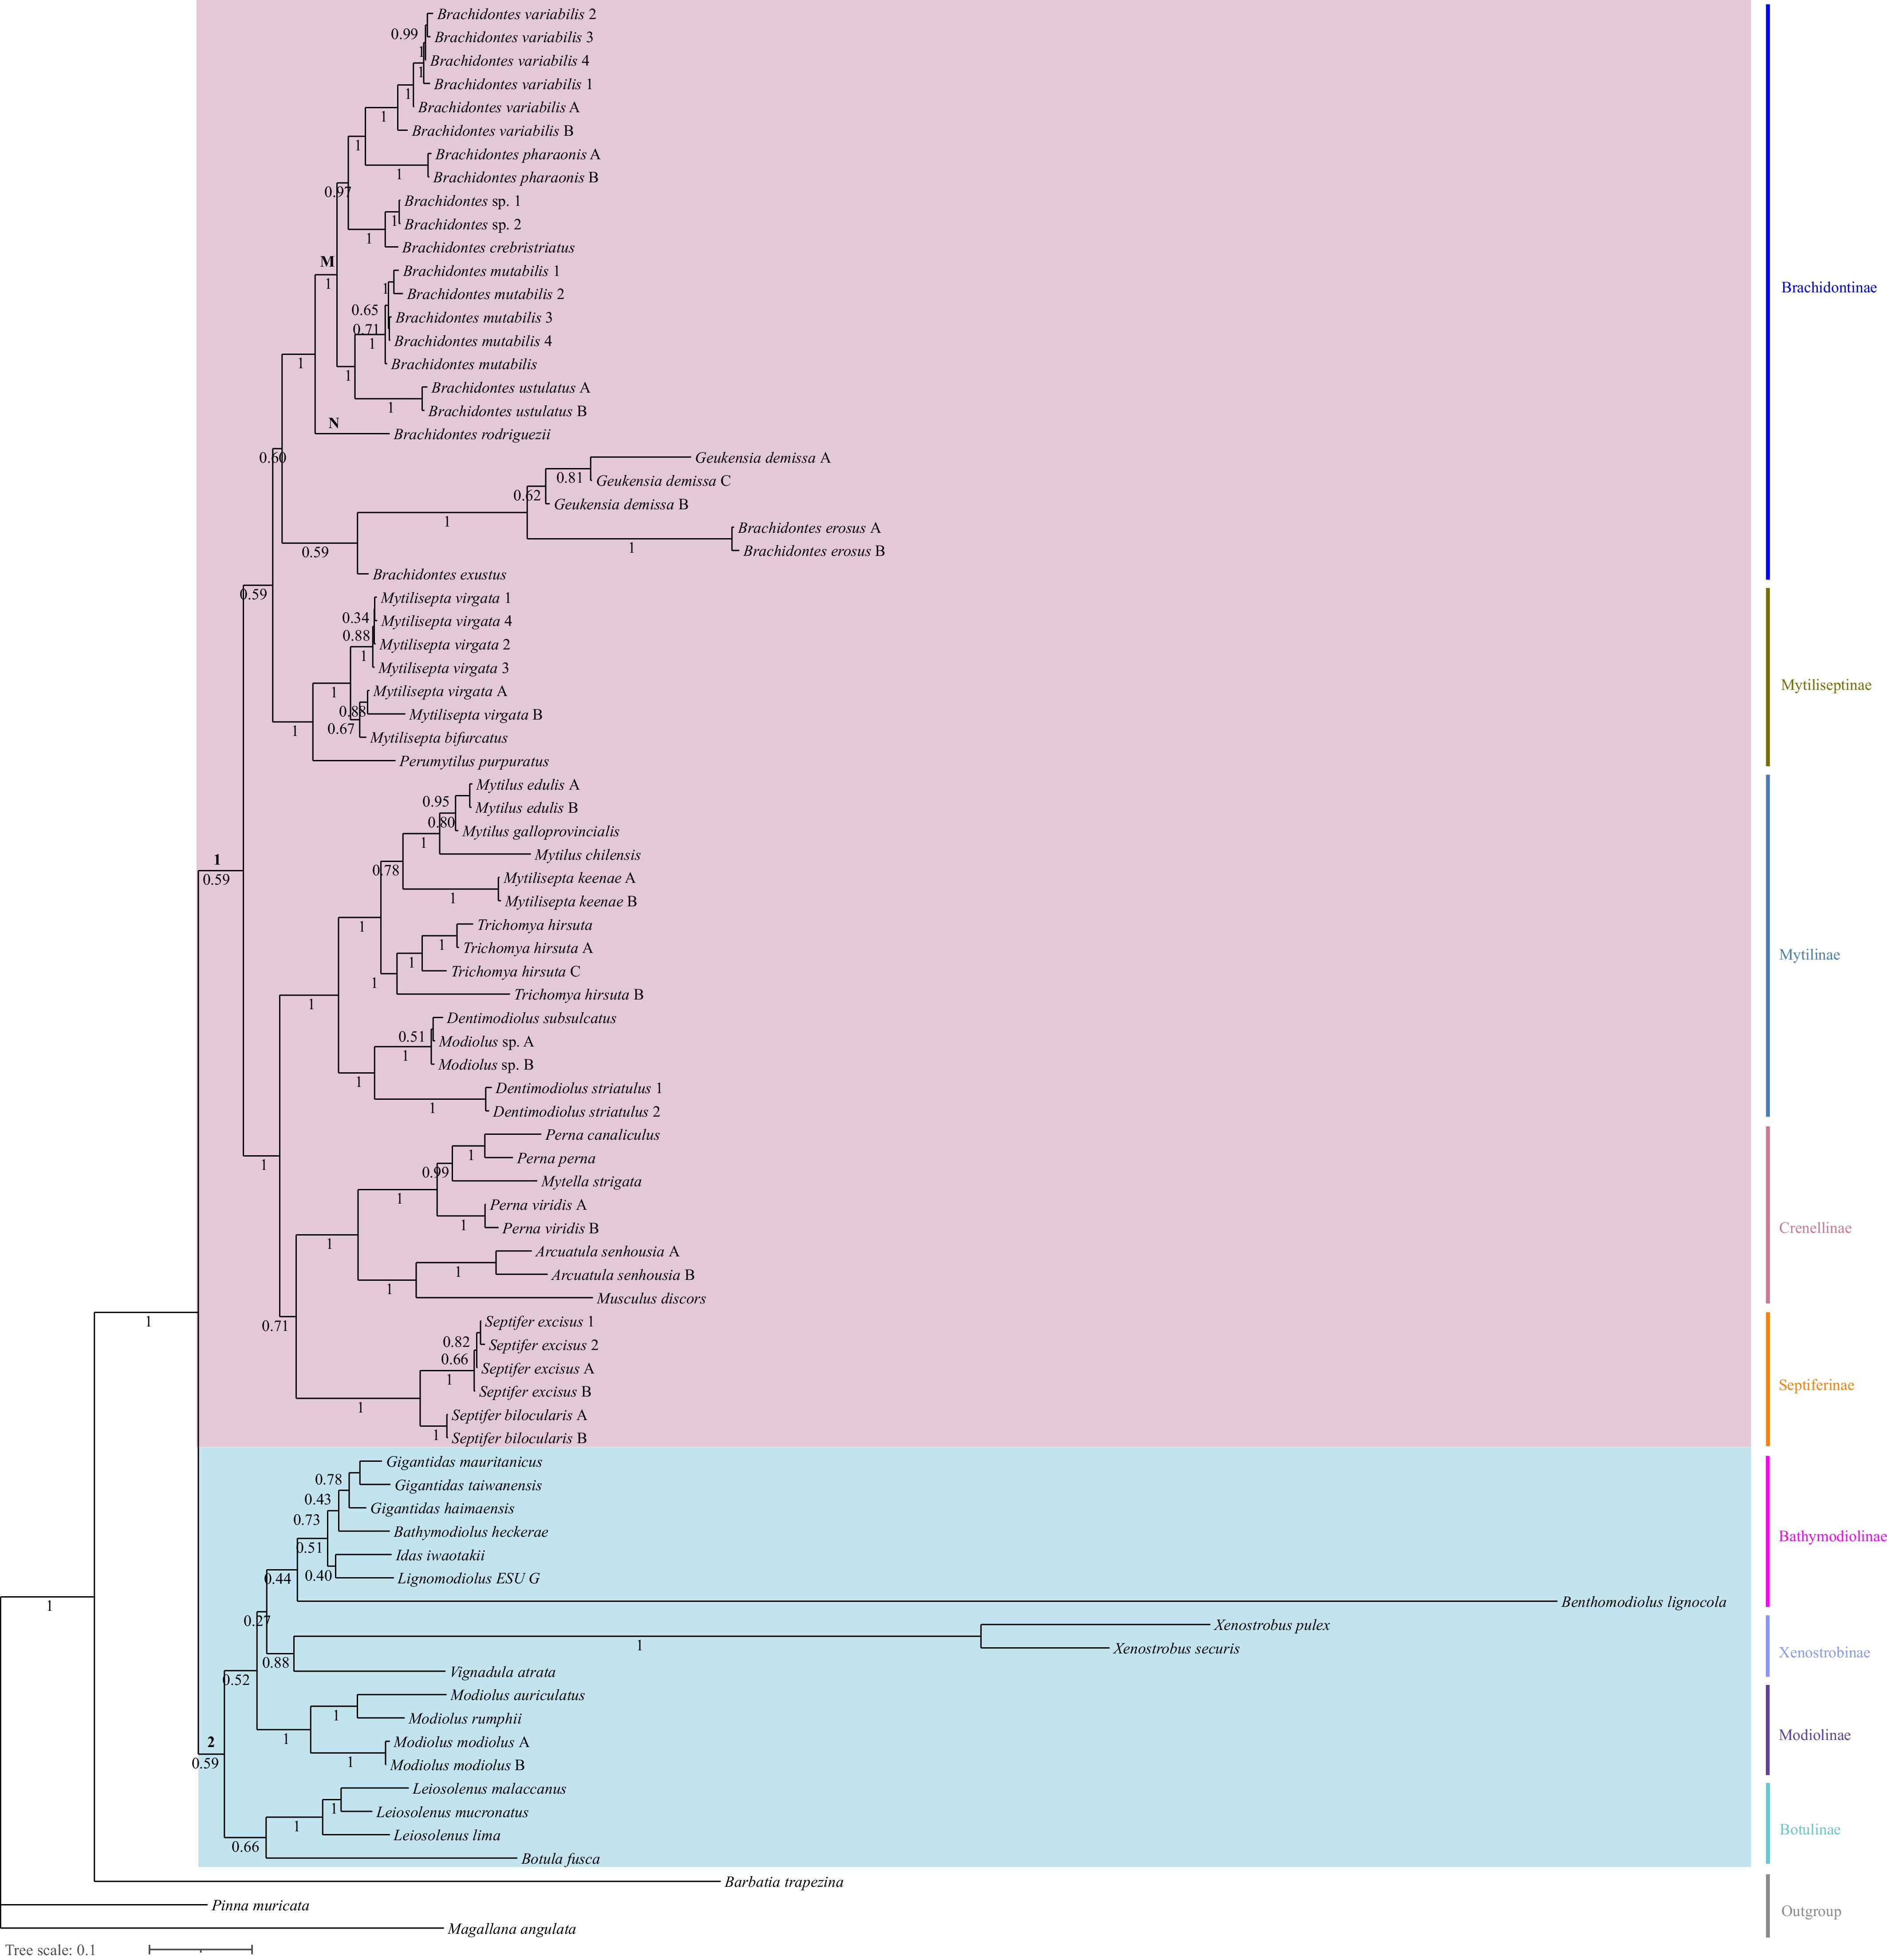
Figure 2.
The Bayesian tree based on multiple fragments. The posterior probabilities are under the branches. The bold letters represent different clades.
Species delimitation analysis based on cox1 and 16S using ASAP and PTP (Fig. 3) indicated that Brachidontes sp. and B. mutabilis (MK721541) belonged to the same species. In constrast, B. mutabilis (MK721541) and B. mutabilis (PP803426) were defined as two different species.
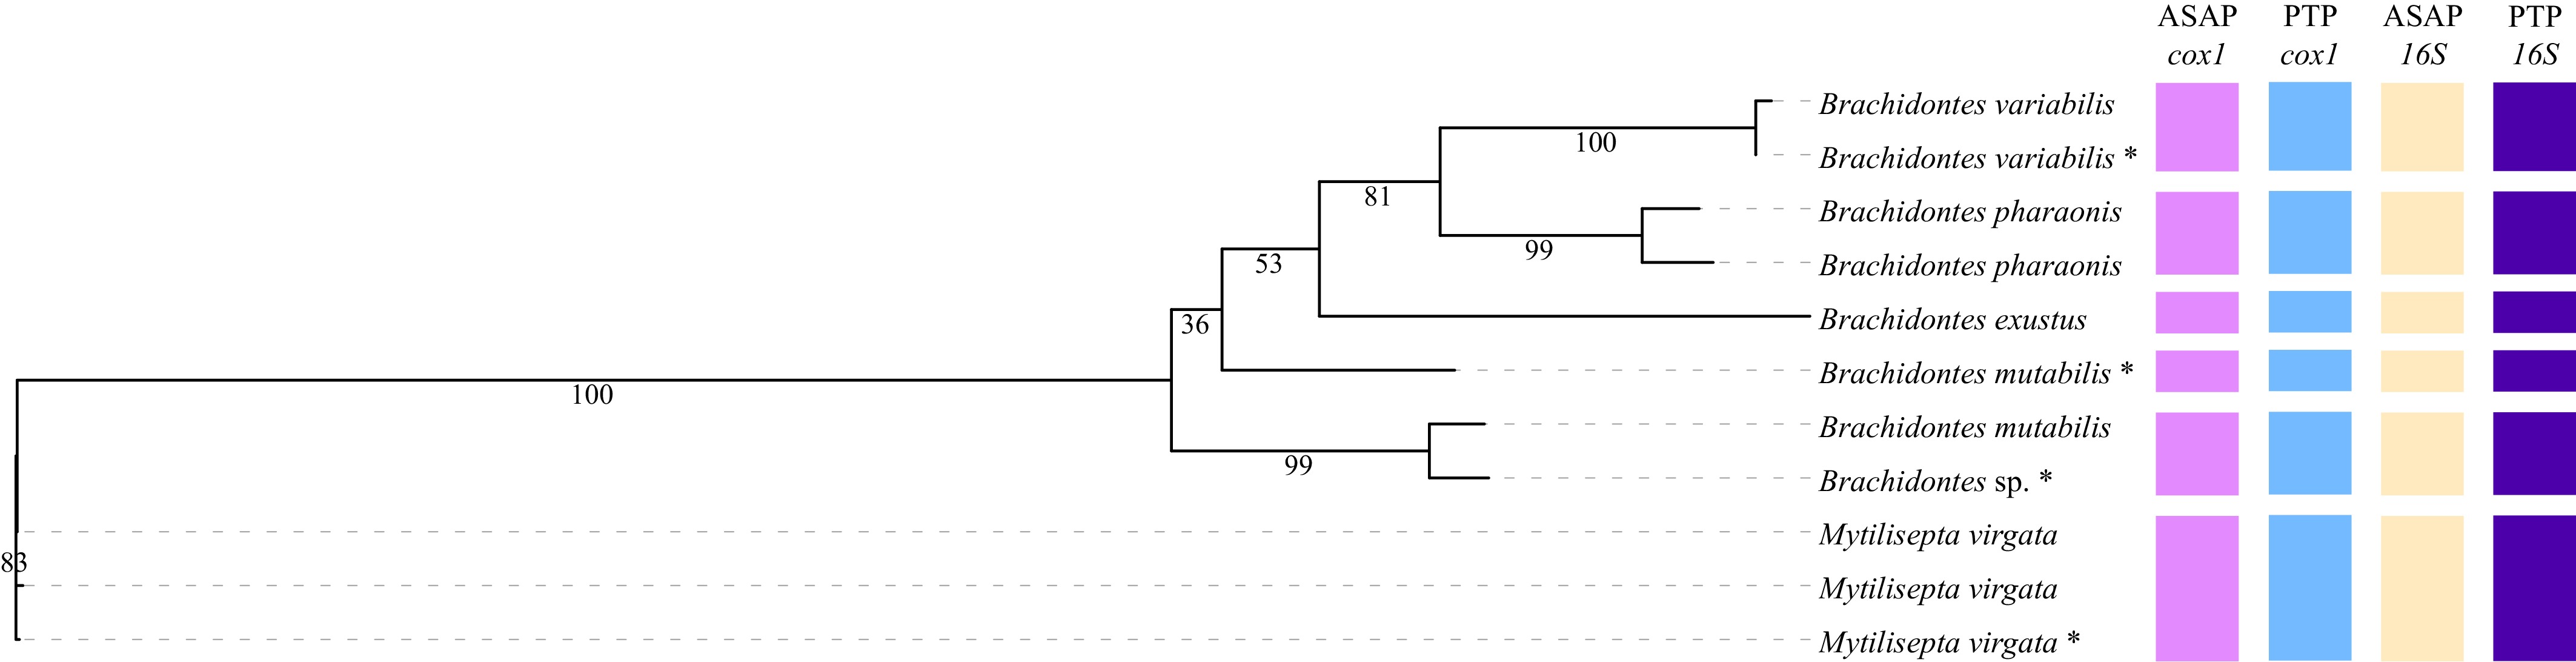
Figure 3.
Species delimited by ASAP and PTP on the basis of complete cox1 and 16S sequences. The posterior probabilities are under the branches. The mitogenomes newly sequenced in this study are marked with *.
Gene order and rearrangements
-
The composition and order of functional genes differ among Mytiloidea species (Fig. 4). Most gene orders are also largely inconsistent with the putative ancestral molluscan gene arrangement (Supplementary Fig. S7), with conserved gene blocks mainly observed in Septiferinae. Differences in the order of PCGs are detected even among species within the same subfamily, and the order of tRNAs shows greater variation. At the genus level, S. bilocularis and S. excisus display totally different positions for trnA, trnR, trnK, trnE, and 12S, whereas Brachidontes species exhibit nad6 and trnD translocations. Variation is further evident at the intraspecific level. For example, the mitogenomes of S. bilocularis show inconsistent trnM copy numbers, and species with DUI, like Perumytilus purpuratus (Lamarck, 1819) and G. demissa, do not show conserved gene orders. Despite this variability, the trnP–trnE–trnC–nad3 block remains a shared feature among Brachidontinae, Mytiliseptinae, and Bathymodiolinae. CREx analysis showed that three tandem duplication random losses (TDRLs) may have contributed to the gene rearrangement from Mytilisepta virgata to M. keenae (Fig. 5).
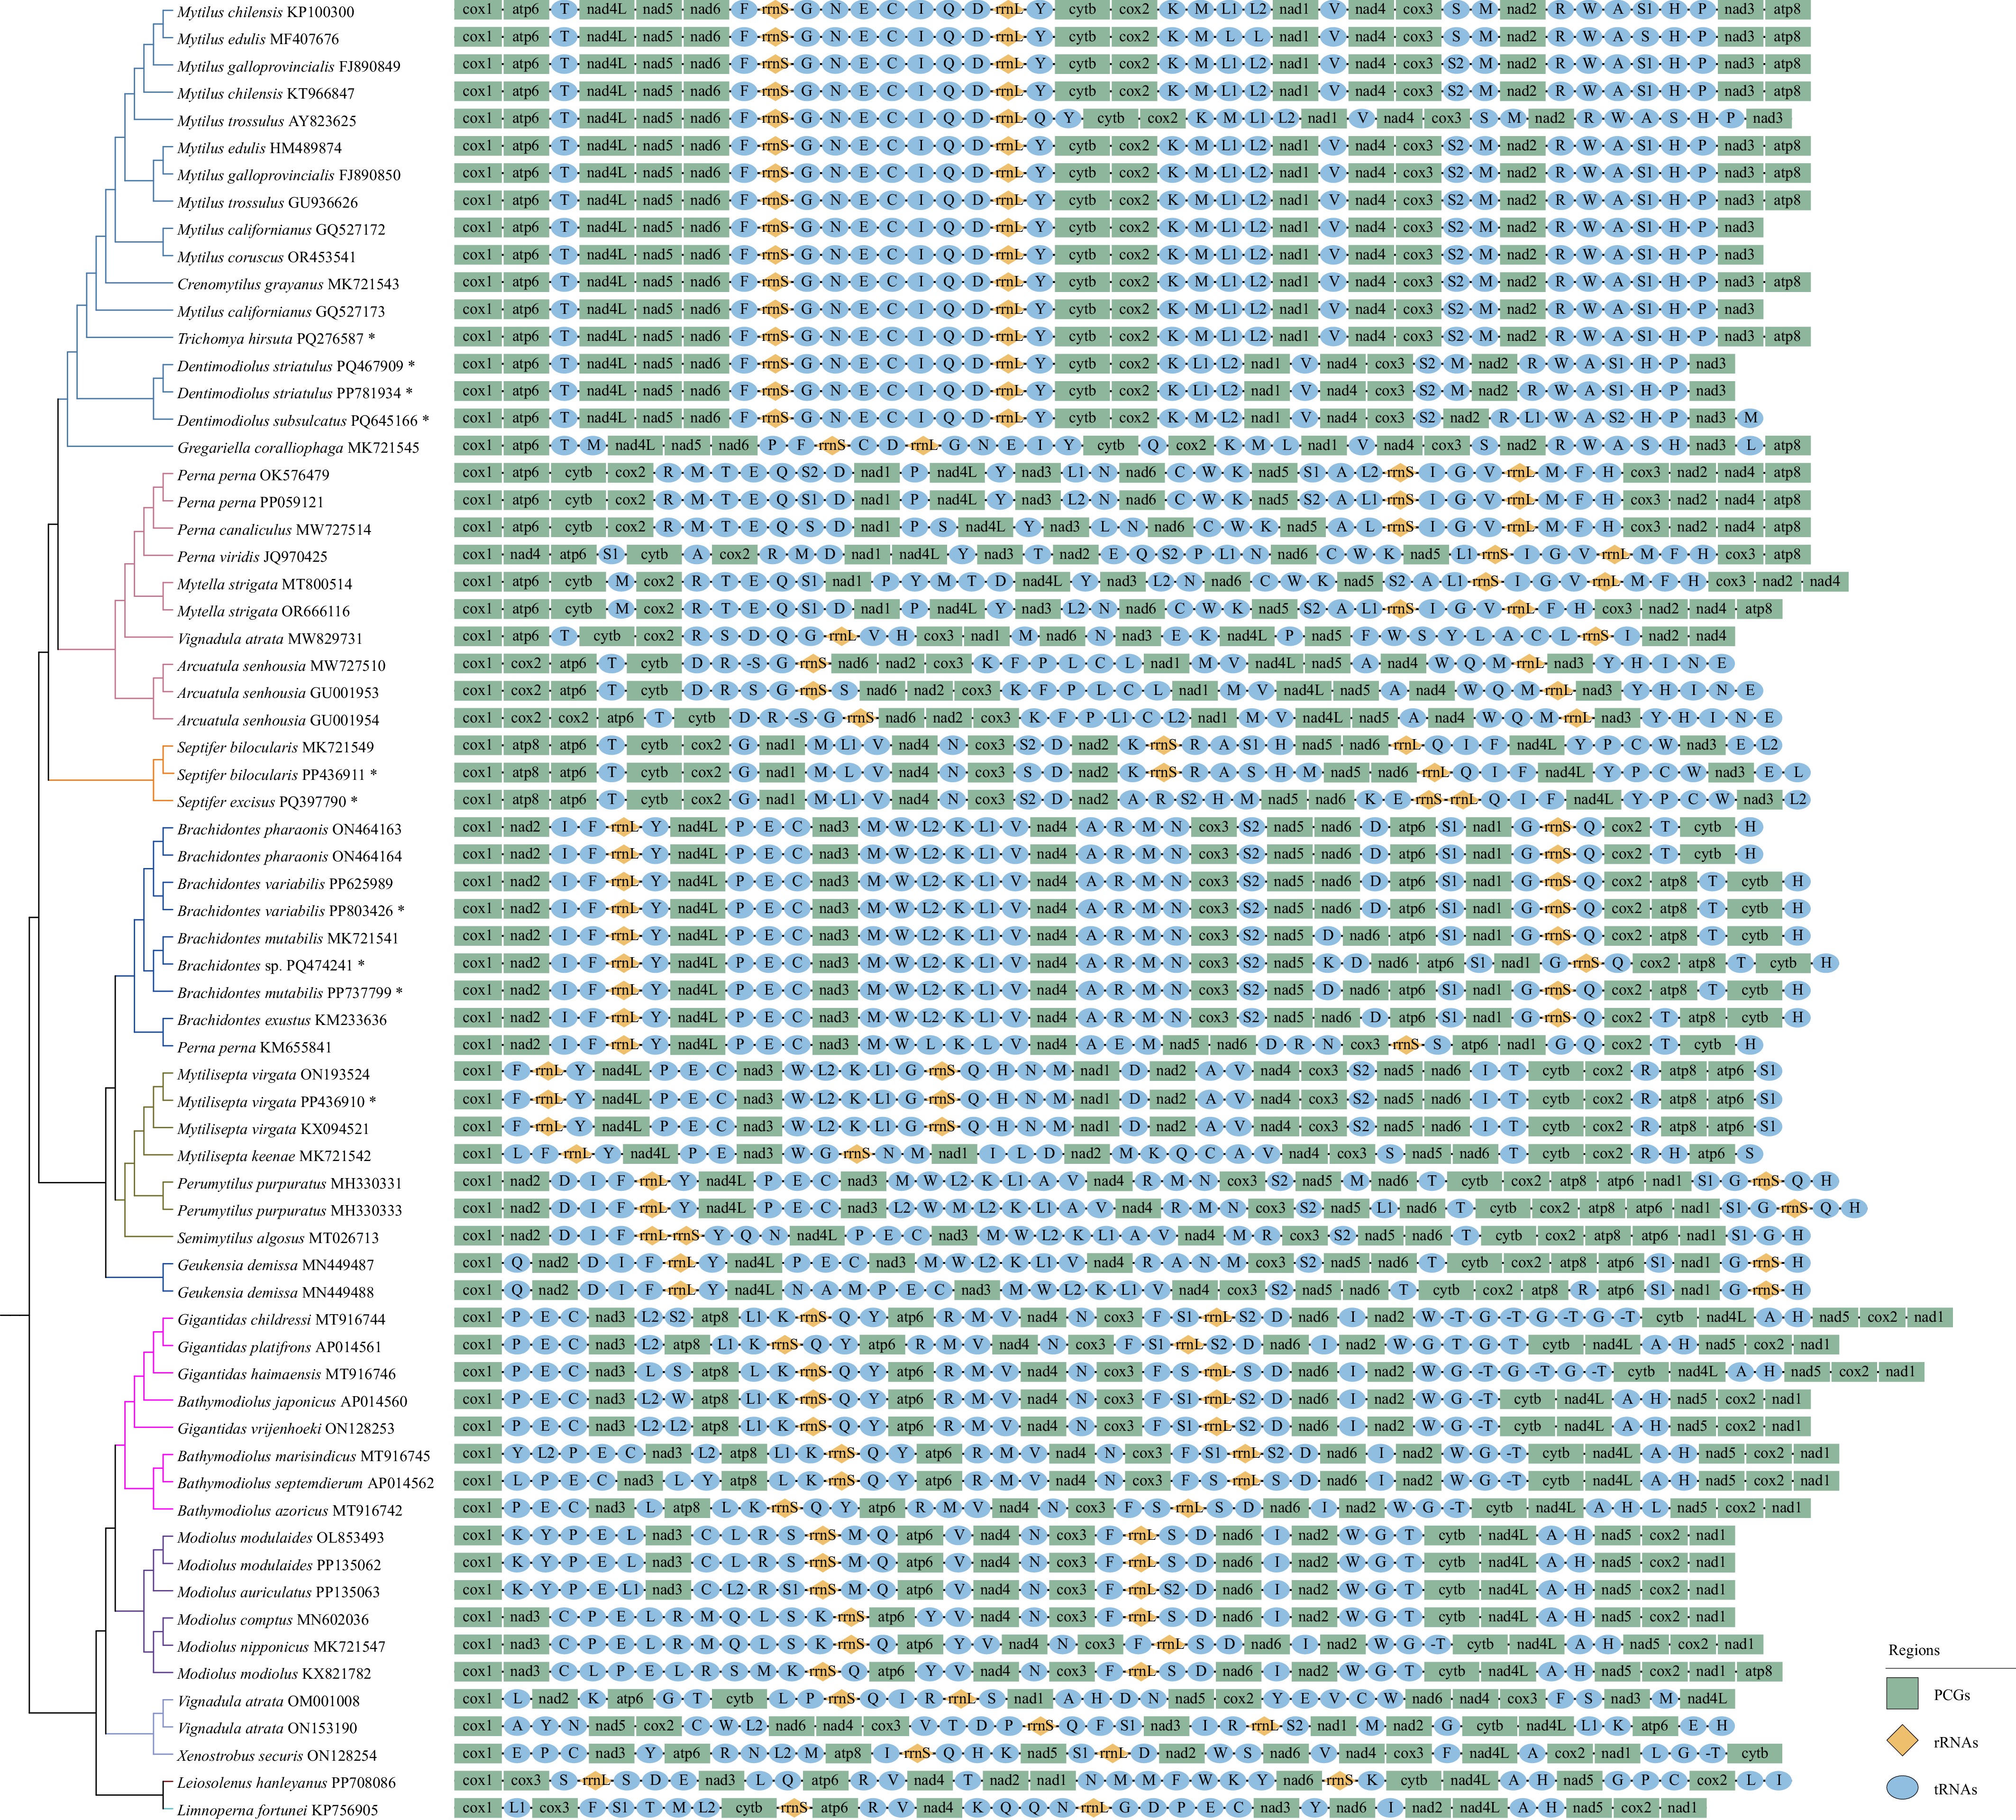
Figure 4.
The gene arrangements of the Mytiloidea mitogenomes. The mitogenomes newly sequenced in this study are marked with *. Different colored branches represent different subfamilies, consistent with the phylogenetic tree.
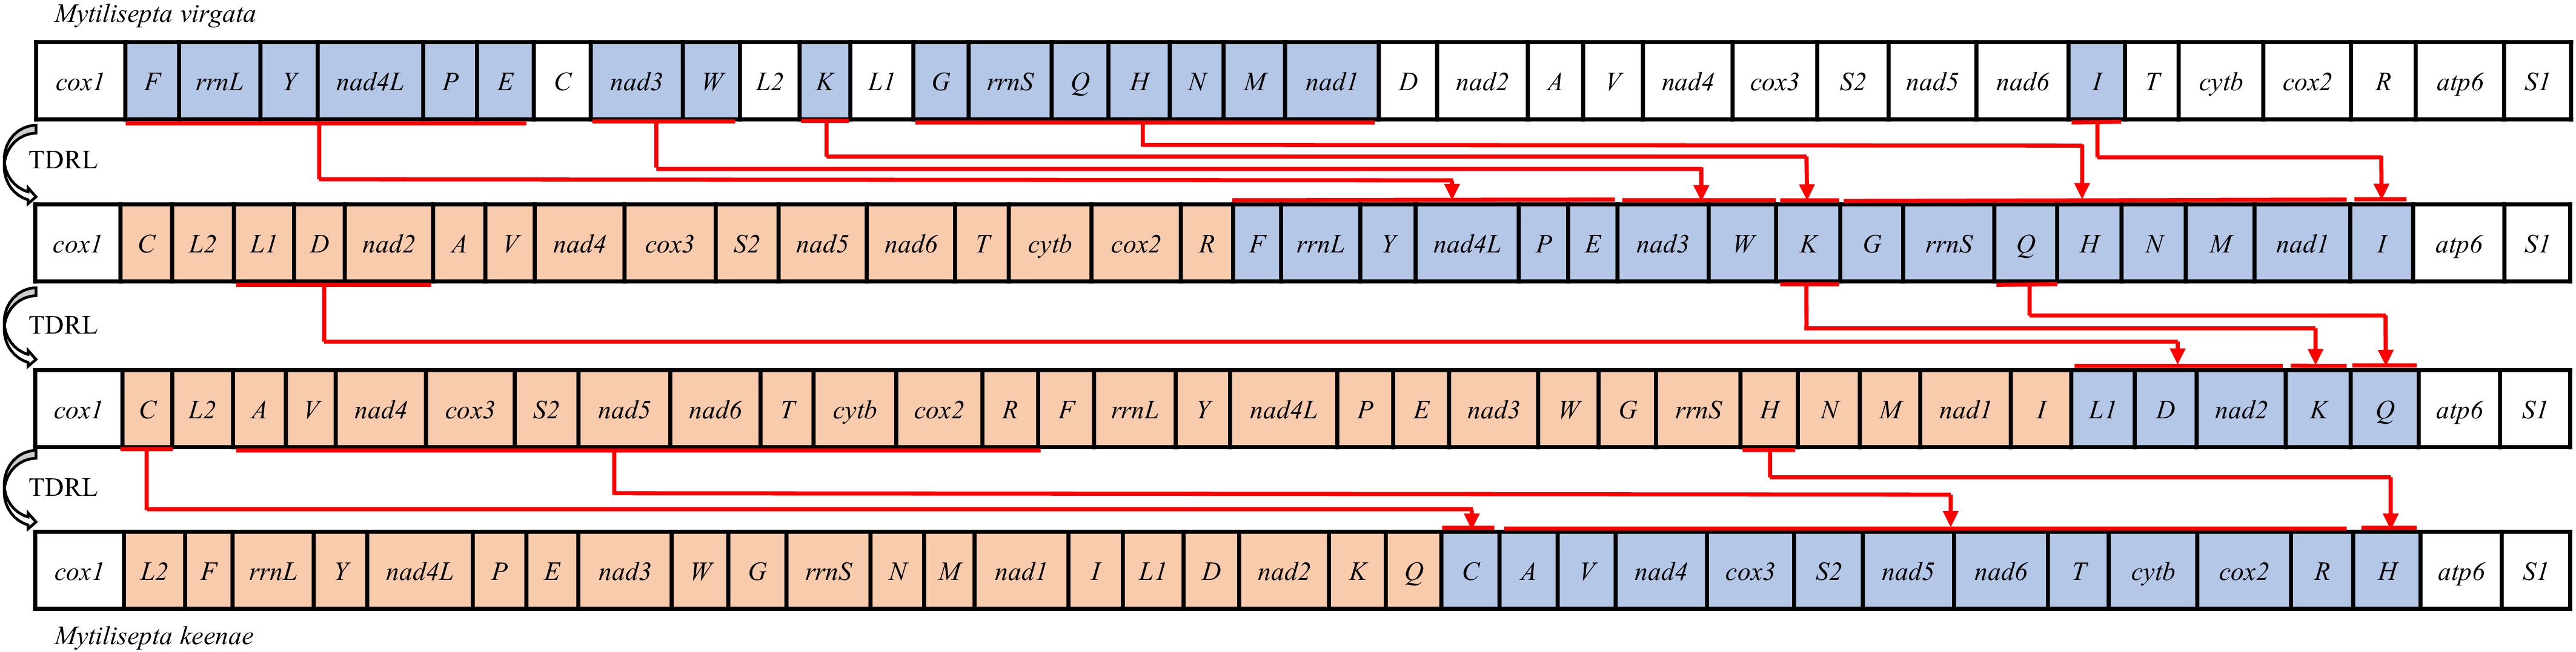
Figure 5.
Putative gene rearrangement events from Mytilisepta virgata to Mytilisepta keenae. The tandem duplication random loss (TDRL) events are represented by red lines and different colors.
The divergence time
-
The two clades (Clade 1 and Clade 2) were estimated to have diverged at 426.83 Mya in the late Silurian (Fig. 6). Clade 1 formed at 372.59 Mya during the Devonian, and Clade 2 formed at 418.24 Mya in the early Devonian. In Clade 1a, Mytilinae emerged at 252.37 Mya in the early Triassic, and T. hirsuta diverged at 171.55 Mya during the Jurassic. The divergence between Dentimodiolus and (Mytilus + Crenimytilus + Trichomya) occurred about 196.3 Mya during the Jurassic, and D. striatulus and D. subsulcatus split at 92.33 Mya in the Cretaceous. Septiferinae and (Mytilinae + Crenellinae) were estimated to have diverged at 338.98 Mya in the early Carboniferous. The split between S. bilocularis and S. excisus was dated to 179.05 Mya in the Jurassic, and the two S. bilocularis diverged at 49.77 Mya.
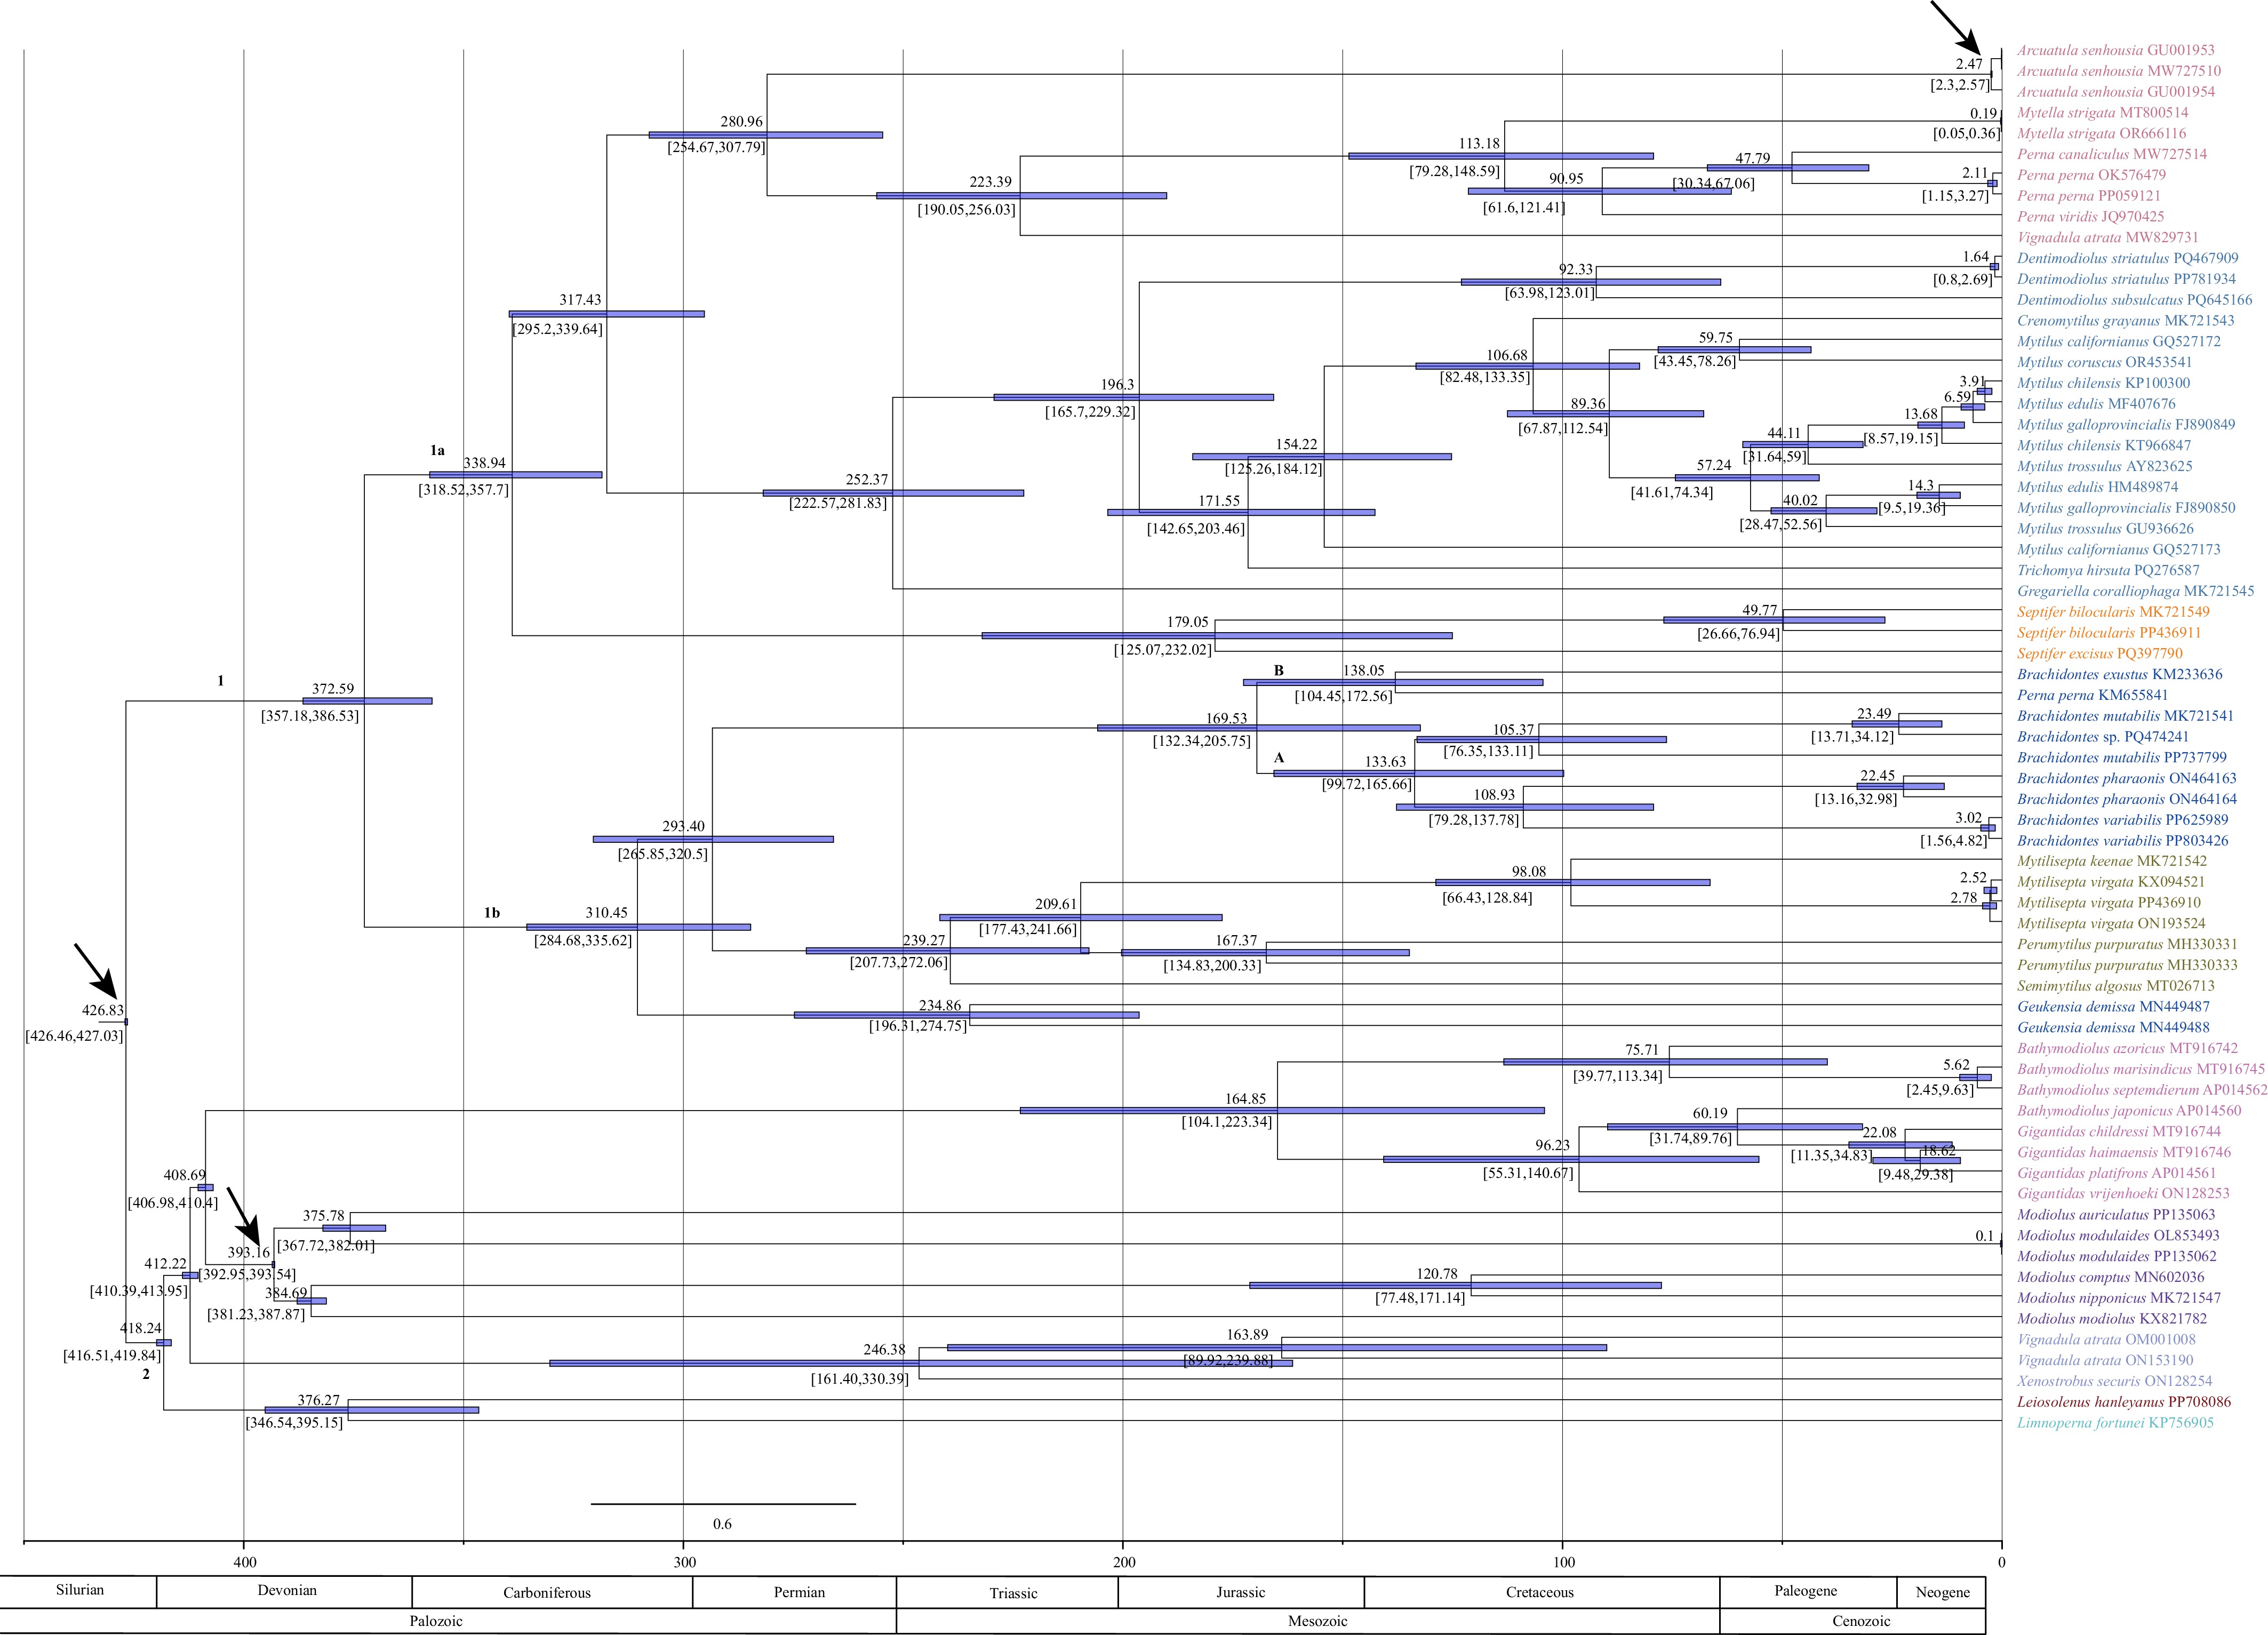
Figure 6.
Divergence times of Mytilidae. The mean divergence times (in Mya) are labeled on the nodes. The number ranges in parentheses under the purple rectangles indicate the 95% highest posterior density (HPD) intervals for the divergence times. Calibration points are marked by arrows. Different colors represent different subfamilies consistent with Fig. 1. The bold letters represent different clades.
In Clade 1b, Brachidontinae, excluding Geukensia, and Mytiliseptinae were estimated to have diverged at 293.4 Mya in the early Permian. Clade A and Clade B of Brachidontes were inferred to have split in the middle Jurassic (169.53 Mya). B. mutabilis (this study) diverged from B. mutabilis (MK721541) and B. sp. at 105.37 Mya in the middle Cretaceous. During the same period, the split between Mytilisepta keenae and M. virgata took place (98.08 Mya).
In Clade 2, the diversification of major lineages occurred primarily during the Devonian. Bathymodiolinae and Xenostrobinae split from Modiolinae at 408.69 Mya in the early Devonian, and Modiolinae emerged at 393.16 Mya. Later in the same period, the divergence between Leiosolenus hanleyanus and Limnoperna fortunei was estimated at 376.27 Mya.
-
The gene composition of the newly sequenced mitogenomes is consistent with that reported in previous studies of bivalve mollusks[55,56]. Although the atp8 gene was not annotated in some mitogenomes, the absence of or difficulty in identifying this gene has been frequently reported in bivalves[56]. Because of its variable length and amino acid composition, the lack of the typical N-terminal 'MPQL' signature and its potential transfer to the nucleus[57], atp8 remains difficult to annotate in some mytilids. Previous studies have suggested that atp8 may be present in all Mytiloidea species[58,59], although it may occur as a pseudogene in some taxa[56]. Apart from the presence of this gene, our results showed substantial variation in gene order and tRNA copy numbers, even among species within the same genus, which is similar to that observed in other bivalve mollusks[18]. Such structural variation offers great evidence for phylogenetic inference.
Phylogeny and taxonomy
-
Mytiloidea is divided into two clades (Clade 1 [Mytilidae] and Clade 2 [Modiolidae]), as some studies have indicated[16,18,59]. Both families are monophyletic. However, the monophyly of Brachidontinae and the phylogenetic positions of Xenostrobinae and Bathymodiolinae are inconsistent between the two phylogenetic trees. These inconsistencies may be partly explained by the limited sampling of taxa and characteristics, which can reduce the accuracy and stability of phylogenetic inference. Furthermore, long-branch attraction within these groups may have contributed to the conflicting relationships[60]. Besides the methodological factors, biological processes such as hybridization may also influence phylogenetic relationships[61]. Introgression, including cytoplasmic genome capture, could be another potential source of discordance among phylogenetic signals[62]. To reduce these uncertainties, future studies should integrate broader taxon sampling, additional molecular data, and more detailed morphological evidence.
Although our analysis supports the monophyly of Mytilinae and Modiolinae, the phylogenetic relationships of these subfamilies remain controversial. For Mytilinae, previous studies based on nuclear markers, including 28S, 18S, and H3, have also recovered it as a monophyletic group[17]. In contrast, mitogenomic analyses have suggested that Mytilinae is polyphyletic, though supporting the monophyly of Brachidontinae[18]. A similar inconsistency has been reported for Modiolinae. Although Modiolinae was recovered as monophyletic here, previous studies using 18S[1] or combined gene fragments[19] identified the subfamily as polyphyletic. Notably, specimens originally labeled as Modiolus sp. A and B clustered as a sister group to Dentimodiolus. However, comparisons of cox1 sequences indicated that these specimens should be assigned to D. subsulcatus. Meanwhile, D. striatulus and D. subsulcatus were more closely related to Mytilinae species and their gene orders are more similar to that of Mytilinae. Their subterminal umbones and striations further corroborate the placement of both species in Dentimodiolus within Mytilinae[63].
In Mytilinae, T. hirsuta was sister to Mytilus species, which was also revealed by some studies[19,21,27]. Although T. hirsuta was historically placed under Brachidontes within Brachidontinae[64], it differs from typical Brachidontes species in several shell characteristics. For example, T. hirsuta has a more pointed umbo, and its shell is covered with dense, fine yellow hairs, which are different from the typical descriptions of Brachidontes. Therefore, we suggest that T. hirsuta should be put back in its former genus, Trichomya. Regarding the placement of Perna, many studies have assigned P. viridis and P. canaliculus to Mytilinae[18,19,21]. However, our results, together with previous evidence from both mitochondrial and nuclear datasets[18,19,63], indicate a close relationship between Perna and Crenellinae. In addition, the PCG arrangement of Perna species is consistent with that of other Crenellinae species, further supporting this relationship. We therefore contend that Perna belongs to the Crenellinae. Additionally, we observed that in some Mytilus species, F- and M-type mitochondrial lineages exhibit a sex-joining pattern, whereas in Geukensia demissa (Brachidontinae), the pattern is taxon-joining, consistent with Hoeh et al. (1996)[35].
Brachidontes is divided into two branches, consistent with some studies[18,19,63]. The unexpected clustering of B. erosus with G. demissa may be related to the relatively short gene fragments used in the analysis, each approximately 300 bp in length, and the limited number of molecular markers included (only cox1, 16S, and H3). Other unusual phylogenetic relationships were also observed. For instance, Brachidontes sp. was recovered as sister to B. mutabilis (MK721541) rather than the other B. mutabilis (PP737799) according to the mitogenomes. Comparisons of cox1 and 16S sequences from GenBank revealed that MK721541 had low similarity to verified B. mutabilis sequences, suggesting that this record may have been misidentified. Similarly, the specimen labeled as B. exustus in the Bayesian tree was confirmed to be G. demissa.
For the undetermined Brachidontes species, its triangular shell shape, fine and dense radial ribs, granular hinged teeth, the short ligament, and the position of the umbo support its placement within Brachidontes[23]. However, its morphological characters does not match any known congeners. Therefore, we identify this taxon as a new species of Brachidontes. However, owing to the poor preservation of soft tissues and the limited number of available specimens, this study does not include a detailed morphological description of the new species.
Species delimitation analysis using ASAP and PTP further indicates that Brachidontes sp. and the sequence identified as B. mutabilis (MK721541) likely belong to the same species, whereas MK721541 and our verified B. mutabilis (PP803426) were delimited as different species. Moreover, the genetic distance of cox1 in these two mitochondrial genomes was significantly smaller than the interspecific distance in this subfamily (Supplementary Table S18). Additionally, the B. mutabilis specimens examined in this study show a purplish-brown shell surface and a purple inner surface, irregular growth lines, a thick shell, and thicker radial ribs, which are in accordance with previous descriptions[65]. In contrast, Brachidontes sp. is characterized as having thinner radial ribs, regular growth lines, and a distinct purple pattern, differing from typical B. mutabilis. On the basis of this dual evidence, we suspect that the specimen associated with MK721541 was misidentified.
The relationship among Septiferinae, Brachidontinae, and Mytiliseptinae, is inconsistent across previous studies. As described by Morton et al. (2020)[21], both Septifer species and M. virgata have the septum and anterior adductor muscle located on the septum, which is absent in Brachidontes species (Supplementary Fig. S8). Additionally, the radial ribs of S. bilocularis are significantly finer than those of M. virgata, and the two species also differ in shell width and height. Consequently, our findings align with Morton et al. (2020)[21] and support the establishment of Mytiliseptinae to accommodate this genus.
Estimation of divergence time
-
Most mytilids diverged during the Mesozoic period. The divergence time of the two clades of Mytiloidea in the Silurian aligns with some previous studies[53]. Earlier studies suggested that Modiolinae (Modiolidae) may represent the ancestor of mytilids[1,14], although fossil evidence has indicated that mytilids may be traced back to the Silurian period[66]. By contrast, mitogenomic evidence indicated that Mytiloidea first appeared in the early Devonian rather than the Silurian[18]. In addition, analysis based on combined molecular datasets estimated the origin of Mytiloidea at 413.5–423.3 Mya, spanning the late Silurian to the early Devonian[19]. Our estimation indicates that the most recent common ancestor of modioliforms was earlier than that of mytiliforms, supporting the hypothesis that Modiolidae represents an ancestral lineage within Mytiloidea. In Clade 1, the divergence time of Clade 1a and Clade 1b is consistent with the finding of Lee et al. (2019)[18]. Throughout the Mesozoic, the Pacific subduction influenced the tectonic evolution of southern China and contributed to the formation of an Andean-type orogenic belt[67,68]. Associated tectonic processes produced numerous rift basins and reactivated pre-existing faults[69], creating diverse habitats and ecological niches that laid the environmental foundation for species differentiation and speciation.
-
This study provides an integrated analysis of Mytiloidea based on mitogenomic data, gene fragments, and morphological evidence. By integrating mitogenomes with multiple gene fragments, we confirmed the monophyly of both Mytilinae and Crenellinae. Our findings provided strong evidence for some taxonomic refinements, including the reassignment of T. hirsuta to the genus Trichomya, the placement of Perna in the Crenellinae, and the clarification of the taxonomic status of Dentimodiolus species. Furthermore, the inconsistent phylogenetic relationships of Brachidontinae between the two trees may be attributed to long-branch attraction, limited sampling, or potential hybridization. Consequently, more molecular and morphological data are essential to resolve these remaining phylogenetic discrepancies.
We would like to thank Binlan Liang from Guangxi Academy of Oceanography for her assistance with sampling.
-
Not applicable.
-
The authors confirm contribution to the paper as follows: study conception and design: Ma P, Zhang Z; data collection: Zhu Y, Zuo C, Teng F; analysis and interpretation of the results: Zhu Y, Zhang Y; draft manuscript preparation: Zhu Y, Ma P, Zhang Z. All authors reviewed the results and approved the final version of the manuscript.
-
All data generated or analyzed during this study are included in this published article (Table 1 and Supplementary Table S4).
-
The authors declare that they have no conflict of interest.
-
This accompanies this paper online at: https://doi.org/10.48130/jzser-0026-0004.
- Supplementary Table S1 Different taxonomic systems for Mytilidae.
- Supplementary Table S2 Information about the samples obtained.
- Supplementary Table S3 Primer sequences and annealing temperatures used in this study.
- Supplementary Table S4 Partitions and evolutionary models used in this study.
- Supplementary Table S5 List of sequences used in this study.
- Supplementary Table S6 Structural features of Mytilidae mitogenomes obtained in this study.
- Supplementary Table S7 Annotation of mitogenome of Trichomya hirsuta.
- Supplementary Table S8 Annotation of mitogenome of Mytilisepta virgata.
- Supplementary Table S9 Annotation of mitogenome of Septifer excisus.
- Supplementary Table S10 Annotation of mitogenome of Septifer bilocularis.
- Supplementary Table S11 Annotation of mitogenome of Brachidontes sp.
- Supplementary Table S12 Annotation of mitogenome of Brachidontes mutabilis.
- Supplementary Table S13 Annotation of mitogenome of Brachidontes variabilis.
- Supplementary Table S14 Annotation of mitogenome of Dentimodiolus striatulus 1.
- Supplementary Table S15 Annotation of mitogenome of Dentimodiolus striatulus 2.
- Supplementary Table S16 Annotation of mitogenome of Dentimodiolus subsulcatus.
- Supplementary Table S17 Test of substitution saturation of PCGs and RNAs.
- Supplementary Table S18 K2p distance among cox1 sequences from Brachidontinae species.
- Supplementary Fig. S1 Distribution map of the nine Mytilidae species from costal China.
- Supplementary Fig. S2 Shells of the ten specimens.
- Supplementary Fig. S3 Complete mitogenome maps of the nine Mytiloidea species.
- Supplementary Fig. S4 Amino acid counts of the ten mitogenomes.
- Supplementary Fig. S5 Relative synonymous codon usage (RSCU) of the ten mitogenomes.
- Supplementary Fig. S6 The phylogenetic tree based on mitochondrial amino acid sequences of Mytiloidea.
- Supplementary Fig. S7 Comparison of mitochondrial gene order among Septiferinae, Mytilinae, Brachidontinae, Mytiliseptinae, and Molluscan ancestral gene order.
- Supplementary Fig. S8 Hinge of Mytilisepta virgata (a), Septifer excisus (b), and Brachidontes variabilis (c, d).
- Copyright © 2026 by the author(s). Journal of Zoological Systematics and Evolutionary Research published by Maximum Academic Press on behalf of John Wiley & Sons Ltd. This is an open access article under the terms of the Creative Commons Attribution License, which permits use, distribution and reproduction in any medium, provided the original work is properly cited.
-
About this article
Cite this article
Zhu Y, Ma P, Zuo C, Teng F, Zhang Y, et al. 2026. Comparative mitogenomic analysis and phylogeny of Mytiloidea. Journal of Zoological Systematics and Evolutionary Research 2026: e004 doi: 10.48130/jzser-0026-0004 

Comparative mitogenomic analysis and phylogeny of Mytiloidea
- Received: 19 April 2026
- Revised: 16 June 2026
- Accepted: 03 July 2026
- Published online: 30 July 2026
Journal of Zoological Systematics and Evolutionary Research
2026,
Article number: e004 (2026)
|
Cite this article
Abstract: Marine mussels in Mytiloidea Rafinesque, 1815, are ecologically and commercially significant, but their phylogenetic relationships and taxonomic classification remain controversial. In this study, we aimed to clarify the phylogenetic relationships within Mytiloidea and provide new molecular evidence for the taxonomy of problematic taxa. Complete mitochondrial genomes and five gene fragments, including cox1, 16S rRNA, 18S rRNA, 28S rRNA, and the histone H3 gene, were newly obtained for nine species representing four subfamilies: Mytilinae, Brachidontinae, Septiferinae, and Mytiliseptinae. All mitogenomes are double-stranded circular molecules characterized by a high A + T content and significantly variable gene arrangements. Phylogenetic analysis recovered Mytiloidea as two major clades. The monophyly of Mytilinae and Crenellinae were well supported, based on nuclear and mitochondrial gene fragments, and further analysis is required to determine the monophyly of Brachidontinae. Our results support the placement of Perna within the Crenellinae and provide molecular evidence for revising the taxonomic status of Trichomya hirsuta and Dentimodiolus species. The estimation of divergence time suggested that Mytiloidea originated during the Silurian, with major subfamily divergences occurring during the Mesozoic. Overall, this study provides new molecular evidence and advances the understanding of the complex phylogenetic relationships within Mytiloidea.
-
Key words:
- Mitochondrial genome /
- Mytiloidea /
- Phylogeny /
- Nuclear gene, Mitochondrial gene