


-
When exposed to external stress, organisms activate a conserved self-protective mechanism termed the heat shock response (HSR). This process induces transcriptional reprogramming, leading to differential expression of stress-related genes and selective upregulation of specific molecular chaperones[1]. Among these, heat shock proteins (HSPs)—first identified in Drosophila melanogaster in the pioneering work of Ferruccio Ritossa[2]—play central roles in mitigating cellular damage. HSPs are classified into five major families according to their molecular weight: HSP110, HSP90, HSP70, HSP60, and small HSPs (sHSPs)[3]. Among them, HSP70 is one of the earliest discovered and most extensively studied families, serving as a paradigm for understanding molecular adaptation to stress[4−8]. Members of the HSP70 family are highly conserved in structure and function across the HSP superfamily. Each HSP70 protein typically consists of a conserved nucleotide-binding domain (NBD, ~44 kDa), a substrate-binding domain (SBD, ~18 kDa), and a variable C-terminal lid region (~10 kDa)[9−13].
Genome-wide identification and characterization of the HSP70 gene family have been reported in numerous plant species, including rice (Oryza sativa)[14], poplar (Populus spp.)[15], barley (Hordeum vulgare)[16], soybean (Glycine max)[17], sorghum (Sorghum bicolor)[18], tomato (Solanum lycopersicum)[19], and cucumber (Cucumis sativus)[20]. HSP70 genes play pivotal roles in plants' growth and development. Furthermore, HSP70 proteins are critically involved in plants' responses to diverse abiotic and biotic stresses, such as cold and heat stress, salinity, reactive oxygen species (ROS), heavy metals, toxins, nutrient deficiency, wounding, and microbial infection[21]. Overexpression of HSP70-1 in Arabidopsis thaliana confers increased sensitivity to gamma radiation while enhancing tolerance to salt, cadmium (Cd), and arsenic (As), without impairing the plant's capacity to sense or respond to these metals[22]. In tomato, HSP70 enhances BAG9-mediated thermotolerance by stabilizing the photosynthetic apparatus and improving the efficiency of the antioxidant system[23].
Pinellia ternata has a long history of medicinal use and is recognized as one of the traditional Chinese herbal medicines[24]. It was first documented in the Herbal Classic of Shen Nong and is known for its diverse pharmacological effects, including anti-inflammatory, sedative-hypnotic, anticancer, antiasthma, and cough suppressant properties. This herb is widely utilized in clinical practice. To date, the genome of P. ternata has been published[25], but the HSP70 gene family in this medicinal plant remains uncharacterized, with key knowledge gaps including its evolutionary relationships with closely related medicinal species, codon usage mechanisms, tissue expression patterns, and response to abiotic stress. In this study, we focused on heat and cold stress, which are major environmental constraints affecting the cultivation of P. ternata, to perform genome-wide identification of the PtHSP70 gene family, and systematically analyzed its physicochemical properties, gene structure, chromosomal location, phylogenetic relationships, cis-acting elements, codon bias, and expression patterns under stress conditions. Our results provide a basis for the evolutionary and functional characterization of the HSP70 gene families in P. ternata.
-
In this study, P. ternata plants collected from Tian Shui, China, were grown in soil-filled pots in a controlled environment (growth chambers) of a 16/8 h light/dark photoperiod, with day/night temperatures of 24/18 °C and 60%–65% relative humidity. After approximately 20 d of growth, separate groups of seedlings were subjected to either cold stress (8 °C) or heat stress (35 °C), maintaining the same photoperiod and humidity conditions. Leaf samples were harvested at 0, 1, 3, 6, 9, 12, and 24 h after stress initiation, immediately frozen in liquid nitrogen, and stored at −80 °C for subsequent RNA extraction. Additional leaf samples were collected on Days 1, 3, 6, and 9 for physiological analyses. The seedlings were sprayed with 100 μM methyl jasmonate (MeJA), 100 μM abscisic acid (ABA), and water (control, CK) for 1 h, then leaf samples were harvested with three biological replicates per condition. Subsequently, transcriptome sequencing was performed, and the expression levels under different hormone conditions were analyzed and visualized using TBtools.
Gas exchange parameters
-
A portable gas exchange system (CIRAS-3, PP Systems; light intensity: 1,200 μmol·m−2·s−1) was used to determine photosynthetic gas exchange parameters, including photosynthetic rate (Pn), transpiration rate (Tr), intercellular CO2 concentration (Ci), stomatal conductance (Gs), and water use efficiency (WUE). Chlorophyll fluorescence parameters were measured once the photosynthetic rate had stabilized, including the effective quantum yield of Photosystem II (PSII) (ΦPSII), nonphotochemical quenching (NPQ), photochemical quenching (qP), and the electron transport rate (ETR).
Photosynthetic pigments, antioxidant enzymes activity, and proline, glutathione, and malondialdehyde contents
-
Photosynthetic pigments were extracted with 95% ethanol, and the contents of chlorophyll a, chlorophyll b, and total chlorophyll were determined using the spectrophotometric method. The calculation formulas are as follows: Chlorophyll a = 13.95 × A665 − 6.88 × A649; Chlorophyll b = 24.96 × A649 − 7.32 × A665; Total chlorophyll = Chlorophyll a + Chlorophyll b[26]. Proline (PRO) content, malondialdehyde (MDA) content, glutathione (GSH) content, and peroxidase (POD) activity were determined using commercial assay kits from Nanjing Jian Cheng Bioengineering Institute (Nanjing, China), following the manufacturer's instructions. Superoxide dismutase (SOD) activity was measured by its inhibition of nitroblue tetrazolium (NBT) reduction in a photochemical superoxide-generating system[27]. Catalase (CAT) activity was measured using the ultraviolet absorption method[28].
Identification and physicochemical property analysis of the HSP70 gene family
-
The amino acid sequences of the A. thaliana HSP70 gene family (18 sequences) were retrieved from the Arabidopsis Information Resource (TAIR;
www.arabidopsis.org/search/genes , accessed on 25 June 2025). This sequence was used as a query to perform a BLASTP search (E-value ≤ 1e−5) against the P. ternata genome database[25], yielding a preliminary set of HSP70 homologs. These candidates were further validated by searching against the HSP70 hidden Markov model (HMM) profile (PF00012) using the HMMER tool (E-value ≤ 1e−5) implemented in TBTools, resulting in the identification of 21 HSP70 proteins in P. ternata. The physicochemical properties of these proteins were analyzed using the ProtParam tool on ExPasy (https://web.expasy.org/protparam ). Secondary structure prediction was performed using SOPMA (https://npsa-prabi.ibcp.fr ). Subcellular localization was predicted using the Cell-PLoc 2.0 server (www.csbio.sjtu.edu.cn/bioinf/Cell-PLoc-2 , accessed on 25 June 2025). Conserved motifs were identified by submitting the full-length amino acid sequences to the MEME suite (E-value ≤ 1e−5;https://meme-suite.org/meme , accessed on 25 June 2025), with the maximum number of motifs set to 15. Phosphorylation sites were predicted using NetPhos 3.1 (https://services.healthtech.dtu.dk/service.php?NetPhos-3.1 ). Gene structure information for the HSP70 genes was extracted from the P. ternata genome annotation, and exon–intron structures were visualized using TBTools.Evolutionary analysis of PtHSP70 genes
-
Phylogenetic analysis was performed using the neighbor-joining (NJ) method implemented in MEGA11 (
www.megasoftware.net ), with 1,000 bootstrap replicates to evaluate branch support. A phylogenetic tree was constructed, based on the HSP70 protein sequences from A. thaliana (At), rice (Os), and P. ternata (Pt), and then visualized and optimized by the online tool iTOL (https://itol.embl.de ).Cis-acting elements and chromosomal location analysis of PtHSP70 genes
-
Genomic data were retrieved from the P. ternata genome resource. The 2-kb promoter regions upstream of the translation start site (ATG) of each PtHSP70 gene were extracted using TBTools. Putative cis-regulatory elements in these promoter sequences were identified using the Plant CARE database (
http://bioinformatics.psb.ugent.be/webtools/plantcare/html , accessed on 25 June 2025). Chromosomal positions of the PtHSP70 genes were visualized using the chromosome mapping module of TBTools, based on the GFF3 genome annotation file.Collinearity analysis of PtHSP70 genes
-
The MCScan X module of TBtools software was used to analyze the gene duplication events of PtHSP70s in P. ternata and the collinearity between P. ternata and other species (Pistia stratiotes, Arabidopsis thaliana, Colocasia esculenta, and Pinellia pedatisecta). Genomic data for C. esculenta, P. pedatisecta, and P. stratiotes were obtained from the China National GeneBank DataBase (CNGD) with the accession numbers CNP0001082, CNP0003127, and CNP00022.
Codon usage preference parameter analysis
-
After sorting and screening the sequences, Codon W and CUSP were used to analyze and obtain the following parameters: (1) relative synonymous codon usage (RSCU) and synonymous codon position; (2) the content of T, C, A, and G at synonymous third codon positions (T3s, C3s, A3s, G3s), the content of C and G at the third position of synonymous codons (GC3s, %), and the total content of C and G of the entire gene (GC, %); (3) the number of synonymous amino acids (Lsym), the length of amino acid sequences (Laa), the average hydrophilicity value (Gravy value), and the aromatic amino acid frequency (Aromo value); (4) the codon adaptation index (CAI), the codon bias index (CBI), the frequency of optical codons (FOP), the effective number of codons (ENC), and other parameters. Origin was used to perform correlation analysis on the abovementioned parameters, and ChiPlot (
www.chiplot.online ) was used to draw a graph of the results.ENC plot analysis, parity rule 2 plot analysis, and neutral plot analysis of codons
-
We used ENC as the ordinate and GC3 as the abscissa to draw a scatter plot to obtain the ENC plot. The theoretical ENC was calculated using the following formula: ENC =2 + GC3 + 29/[GC32 + (1 − GC3)2]. We drewa standard curve with the theoretical ENC as the ordinate (the y-axis) and GC3 as the abscissa (the x-axis). We performed a quantitative analysis of A, T, C, and G at the third position of each codon, and then used G3/(G3 + C3) as the x-axis and A3/(A3 + T3) as the y-axis to get the PR2-plot (parity rule 2-plot) diagram. Then we drew two reference lines of x = 0.5 and y = 0.5 to analyze the difference in the usage of each codon base. We then drew a scatter plot with GC12 as the ordinate and GC3 as the abscissa to obtain a neutral plot, then drew the y = x function curve as a reference line for subsequent analysis. Excel was used to fit the relevant points and obtain the correlation coefficient, regression coefficient, and fitting function. GraphPad was used for all drawings.
Determination of the optimal codons
-
First, the genes were sorted from high to low on the basis of their ENC. Five percent of the genes with extremely low and extremely high ENC values were grouped into two datasets (high expression and low expression). To determine the optimal codons, the two datasets were compared with the RSCU values of codons in the databases. If the difference (ΔRSCU) was ≥ 0.3 and RSCU > 1 in high-bias genes and < 1 in low-bias genes, then the optimal codons were defined.
Analysis of the tissue-specific expression of the PtHSP70 gene
-
Published RNA sequencing (RNA-seq) data of P. ternata[25] were obtained from the National Genomics Data Center (NGDC) website (
https://ngdc.cncb.ac.cn) . The dataset encompasses transcriptomic profiles from multiple tissues, including leaves, petioles, flowers, tubers, and roots. Gene expression levels were quantified as transcripts per million (TPM) and subsequently visualized in the form of heatmaps using the heatmap package in R.Expression analysis of HSP70 under either cold or heat stress
-
The total RNA of P. ternata leaves was extracted using a Plant RNA kit (Beijing Tian Gen, China) in accordance with the manufacturer's instructions. Subsequently, cDNA was synthesized using the first-strand cDNA Fast Synthesis Kit (Beijing Tian Gen, China). The gene-specific primers were synthesized by Sangon Biotechnology Co., Ltd (Shanghai, China). Real-time polymerase chain reaction (PCR) was performed using 2 × Q3 SYBR qPCR Master Mix (TOLOBIO, China). The quantitative PCR (qPCR) reactions were conducted on qTO WER equipment (Analytik Jena, Germany). A two-step experimental run protocol was used: (1) A denaturation program (30 s at 95 °C) and (2) an amplification and quantification program repeated 40 times (denaturing at 95 °C for 10 s, annealing and elongating at 60 °C for 30 s). The ribosomal 18S gene was used as the internal control[29]. All reactions were performed in at least three replicates (Supplementary Table S1).
The data were analyzed via the 2−ΔΔCᴛ method. Raw data were normalized and plotted using GraphPad. All statistical analyses were performed using SPSS 26.0 software. Differences between groups were tested by one-way analysis of variance (ANOVA) followed by Duncan's multiple comparison test, with p < 0.05 and p < 0.01 considered to be statistically significant.
-
A significant difference in chlorophyll content was observed in P. ternata under heat and cold stress conditions. As the duration of thermal stress increased, chlorophyll a was elevated by 25%, chlorophyll b by 30%, and total chlorophyll by 28%. After 3 d, all three indices gradually declined; by Day 9, chlorophyll a decreased to 60% of the initial level, chlorophyll b dropped to 40% of the initial level, and total chlorophyll fell to 55% of the initial level. Under cold stress, chlorophyll a and total chlorophyll showed a continuous downward trend: By Day 9, chlorophyll a was reduced by 45%, and total chlorophyll by 40%. In contrast, chlorophyll b exhibited a transient increase, being 20% higher than the initial level on Day 3, followed by a decline and dropping to 50% of the initial level by Day 9 (Supplementary Fig. S1a).
Leaf photosynthetic parameters under cold or heat stress
-
Under cold and heat stress, the Pn, Gs, Tr, ETR, lake model-based qL, qP, and ΦPSII in P. ternata seedlings were significantly reduced (p < 0.05). Specifically, after 9 d of heat treatment, these parameters decreased by 83.27%, 27.10%, 91.43%, 92.40%, 85.32%, 62.94%, 62.33%, and 62.94%, respectively, compared with the control (CK) group. In contrast, after 1 d of cold stress, Pn, Gs and Tr decreased significantly by 66.20%, 79.22% and 73.57% relative to the CK group (Supplementary Fig. S1b). In terms of WUE, the average WUE of heat-stressed seedlings increased by approximately 118.7% on Day 3 compared with the initial level on Day 1, and then decreased by about 14.0% on Day 9 relative to the Day 3 peak value. In comparison, the average WUE of cold-stressed seedlings increased by around 25.1% on Day 3 compared with the Day 1 level, followed by a 36.0% decrease on Day 9 relative to the Day 3 peak value. Additionally, Gs in cold-stressed seedlings showed a transient rebound on Day 3 before declining again with the prolongation of stress.
Leaf antioxidant enzyme activity and PRO, GSH, and MDA contents under cold and heat stress
-
When P. ternata was exposed to heat or cold stress alone, its MDA content showed distinct dynamic changes: Under heat stress, it rose to 179.20 nmol·g−1 by Day 3, then dropped to 85.61 nmol·g−1 on Day 6; under cold stress, it increased gradually to a peak of 291.51 nmol·g−1 by Day 6.
Overall, the proline content showed an upward trend under heat stress, with significant differences observed between the CK group and the treatment groups on Days 1, 6, and 9. In contrast, cold stress led to significant differences in proline content between the CK group and the treatment groups on Days 6 and 9 only. The activities of GSH, CAT, POD, and SOD all showed a trend of increasing first and then decreasing. Furthermore, the activities of CAT and SOD reached their peak on the third day and then stabilized (Supplementary Fig. S1c).
Plants' physicochemical properties and evolutionary analysis of the PtHSP70 gene
-
In total, 21 PtHSP70 members were identified in P. ternata. The PtHSP70 genes were named PtHSP70-1 to PtHSP70-21 according to their arrangement on the chromosomes. Utilizing the ExPASy online platform, this study predicted and analyzed the basic physicochemical properties of the HSP70 proteins in P. ternata (Supplementary Table S2). The amino acid lengths of PtHSP70 proteins ranged from 332 to 841, with molecular weights varying between 36.08 and 93.30 kDa and isoelectric points between 5.06 and 6.95. The protein instability index results indicated that out of 21 genes, 10 were classified as stable proteins (instability index < 40), whereas 11 were identified as unstable (instability index > 40); the aliphatic index ranged from 68.68 to 98.71. A hydrophobicity analysis of PtHSP70 proteins revealed that the HSPs were all hydrophilic (< 0). Subcellular localization prediction showed most proteins were localized in the endoplasmic reticulum (ER) (nine PtHSP70 proteins) and mitochondria (eight PtHSP70 proteins), and a few were localized in the chloroplast (two PtHSP70 proteins), plasma membrane (one), or nucleus (one). The secondary structure of PtHSP70 protein contained 35.54%−46.67% α-helices, 8.68%−21.43% extended strands, and 36.69%−45.54% random coils. Prediction of the phosphorylation sites also showed that the main phosphorylation sites of PtHSP70 proteins were serine (Ser), threonine (Thr), and tyrosine (Tyr), especially Ser (Supplementary Table S3).
Phylogenetic relationship, gene structure, and conserved protein motifs in the PtHSP70 gene family
-
The phylogenetic tree (Fig. 1a) was constructed using the NJ method in MEGA 11 software with 1,000 bootstrap replications, and bootstrap values were labeled on the branches. In total, 71 HSP70 protein sequences from P. ternata, A. thaliana, and O. sativa were clustered into six distinct groups in this tree. Group A consists of 8 members, Group B consists of 8 members, Group C consists of 11 members, Group D consists of 11 members, Group E consists of 14 members, and Group F consists of 19 members. Among them, Group F has the most members, with eight from rice, six from P. ternata, and five from A. thaliana.
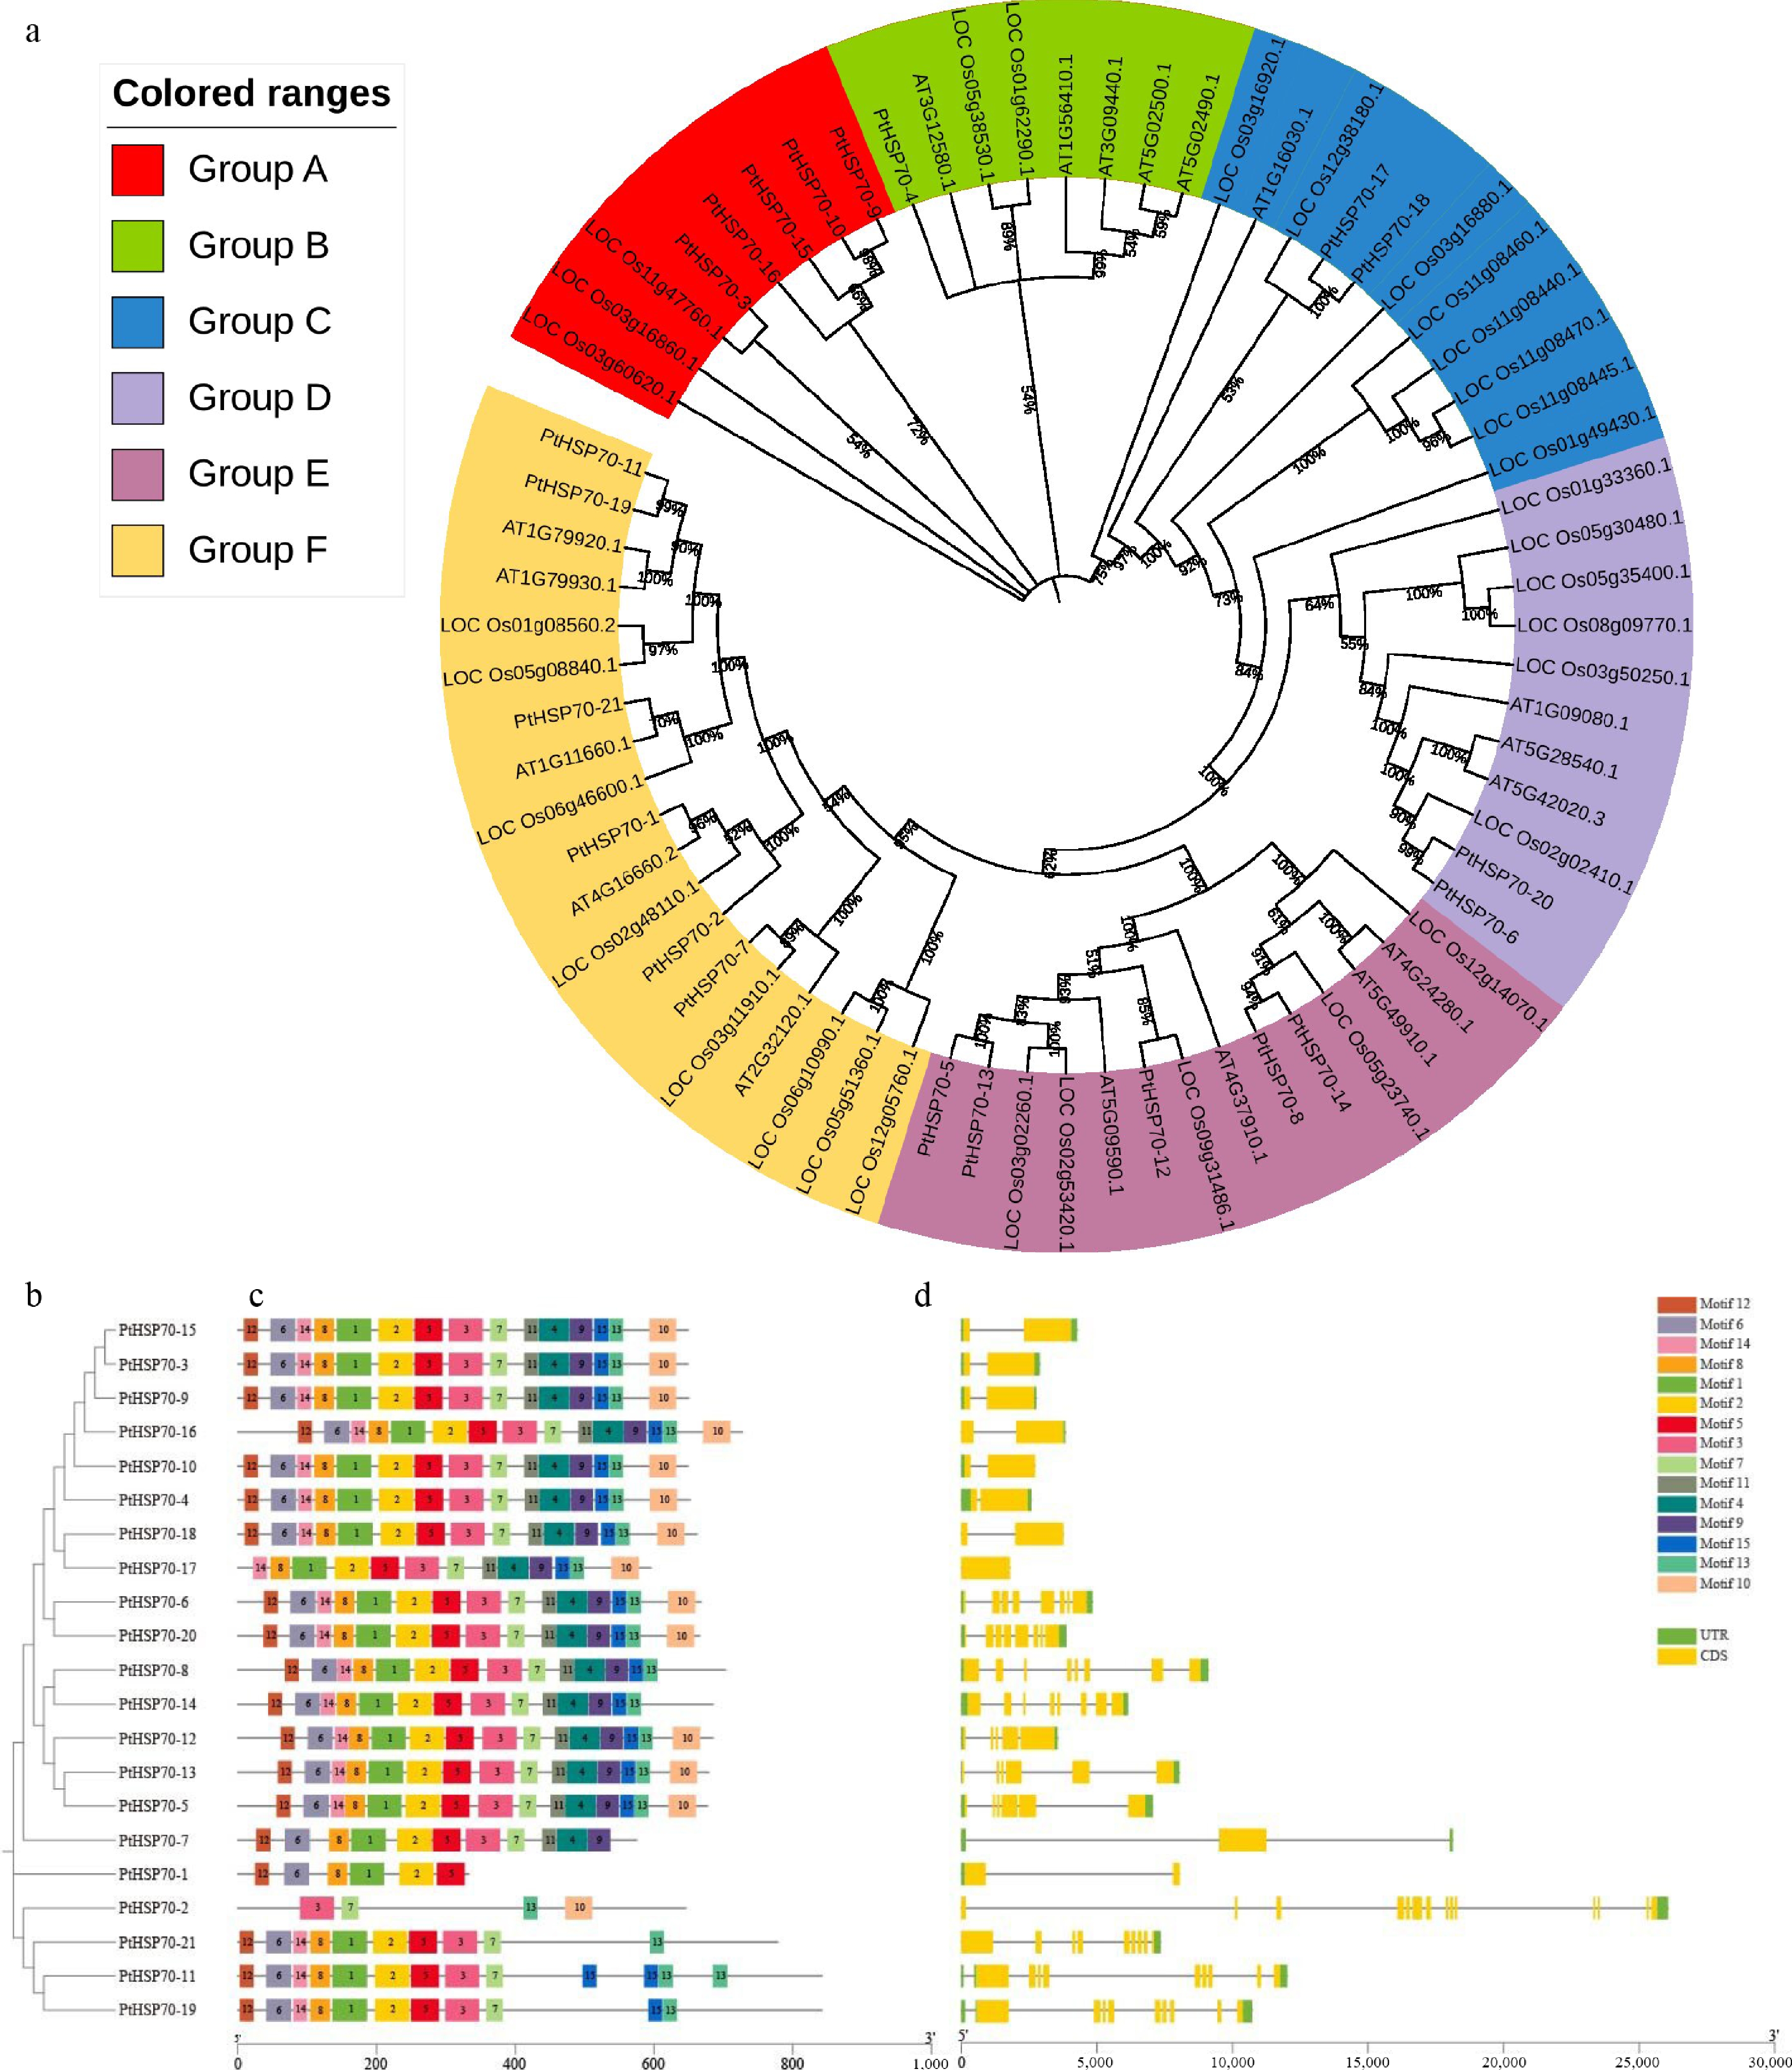
Figure 1.
Phylogenetic relationship, gene structure, and conserved protein motifs in the PtHSP70 gene family. Conserved motif analysis was performed by the MEME tool and visualized with TBTools; the gene structure was also visualized using TBTools. (a) Circular phylogenetic tree of HSP70 proteins from P. ternata (PtHSP70), Arabidopsis thaliana (At) and Oryza sativa (Os), divided into six colored groups (A−F), with each branch representing an individual HSP70 sequence. (b) Phylogenetic analysis of HSP70 proteins in P. ternata. (c) The conserved motifs in P. ternata, where each motif is shown as a box in one of 15 different colors. (d) Exon–intron structure of the HSP70 genes in P. ternata, where the yellow box represents the coding sequence (CDS), the green box represents the untranscribed region (UTR), and the black line connecting the two exons represents the intron. The scale in the bottom is in units of base pairs (bp).
Conserved motif analysis of HSP70 proteins was performed using the MEME Suite (
https://meme-suite.org/meme , accessed on 25 June 2025). The parameters were set to identify 15 different motifs. As shown in Fig. 1b, c, the number of detected motifs per gene ranged from 4 to 15, revealing phylogenetic group-specific conservation patterns. Proteins within the same evolutionary clade exhibited highly conserved motif compositions, whereas intergroup comparisons showed distinct variations. This suggests functional diversification during evolution. Exon–intron architecture analysis revealed substantial variation in gene structure across the PtHSP70 family. Intron numbers ranged from 1 to 13, and PtHSP70-2 (ID: PtGene02870.t1) contained the highest count (13 introns). Notably, PtHSP70-2 represented the sole intronless member, whereas the other paralogs contained 1–9 introns (Fig. 1d).Cis-acting element analysis of HSP70 promoters in P. ternata
-
Putative cis-acting elements were identified in the 2,000-bp upstream promoter regions of PtHSP70 genes using Plant CARE. The results showed that the promoter regions contained cis-acting elements associated with light responsiveness, stress responses, hormonal signaling, and growth and development. (Fig. 2). Among the hormone-responsive elements, those responsive to auxin, salicylic acid, and MeJA were detected, with MeJA-responsive elements being the most abundant. Light-responsive elements were the most numerous overall, underscoring the potential involvement of light signaling in PtHSP70 regulation. Additionally, stress-related elements, including ABRE (ABA responsiveness), TC-rich repeats (defense and stress), and HSE (heat shock), were also present. These findings suggest that PtHSP70 genes are closely associated with the growth and development of P. ternata, as well as its responses to hormonal and environmental stimuli.
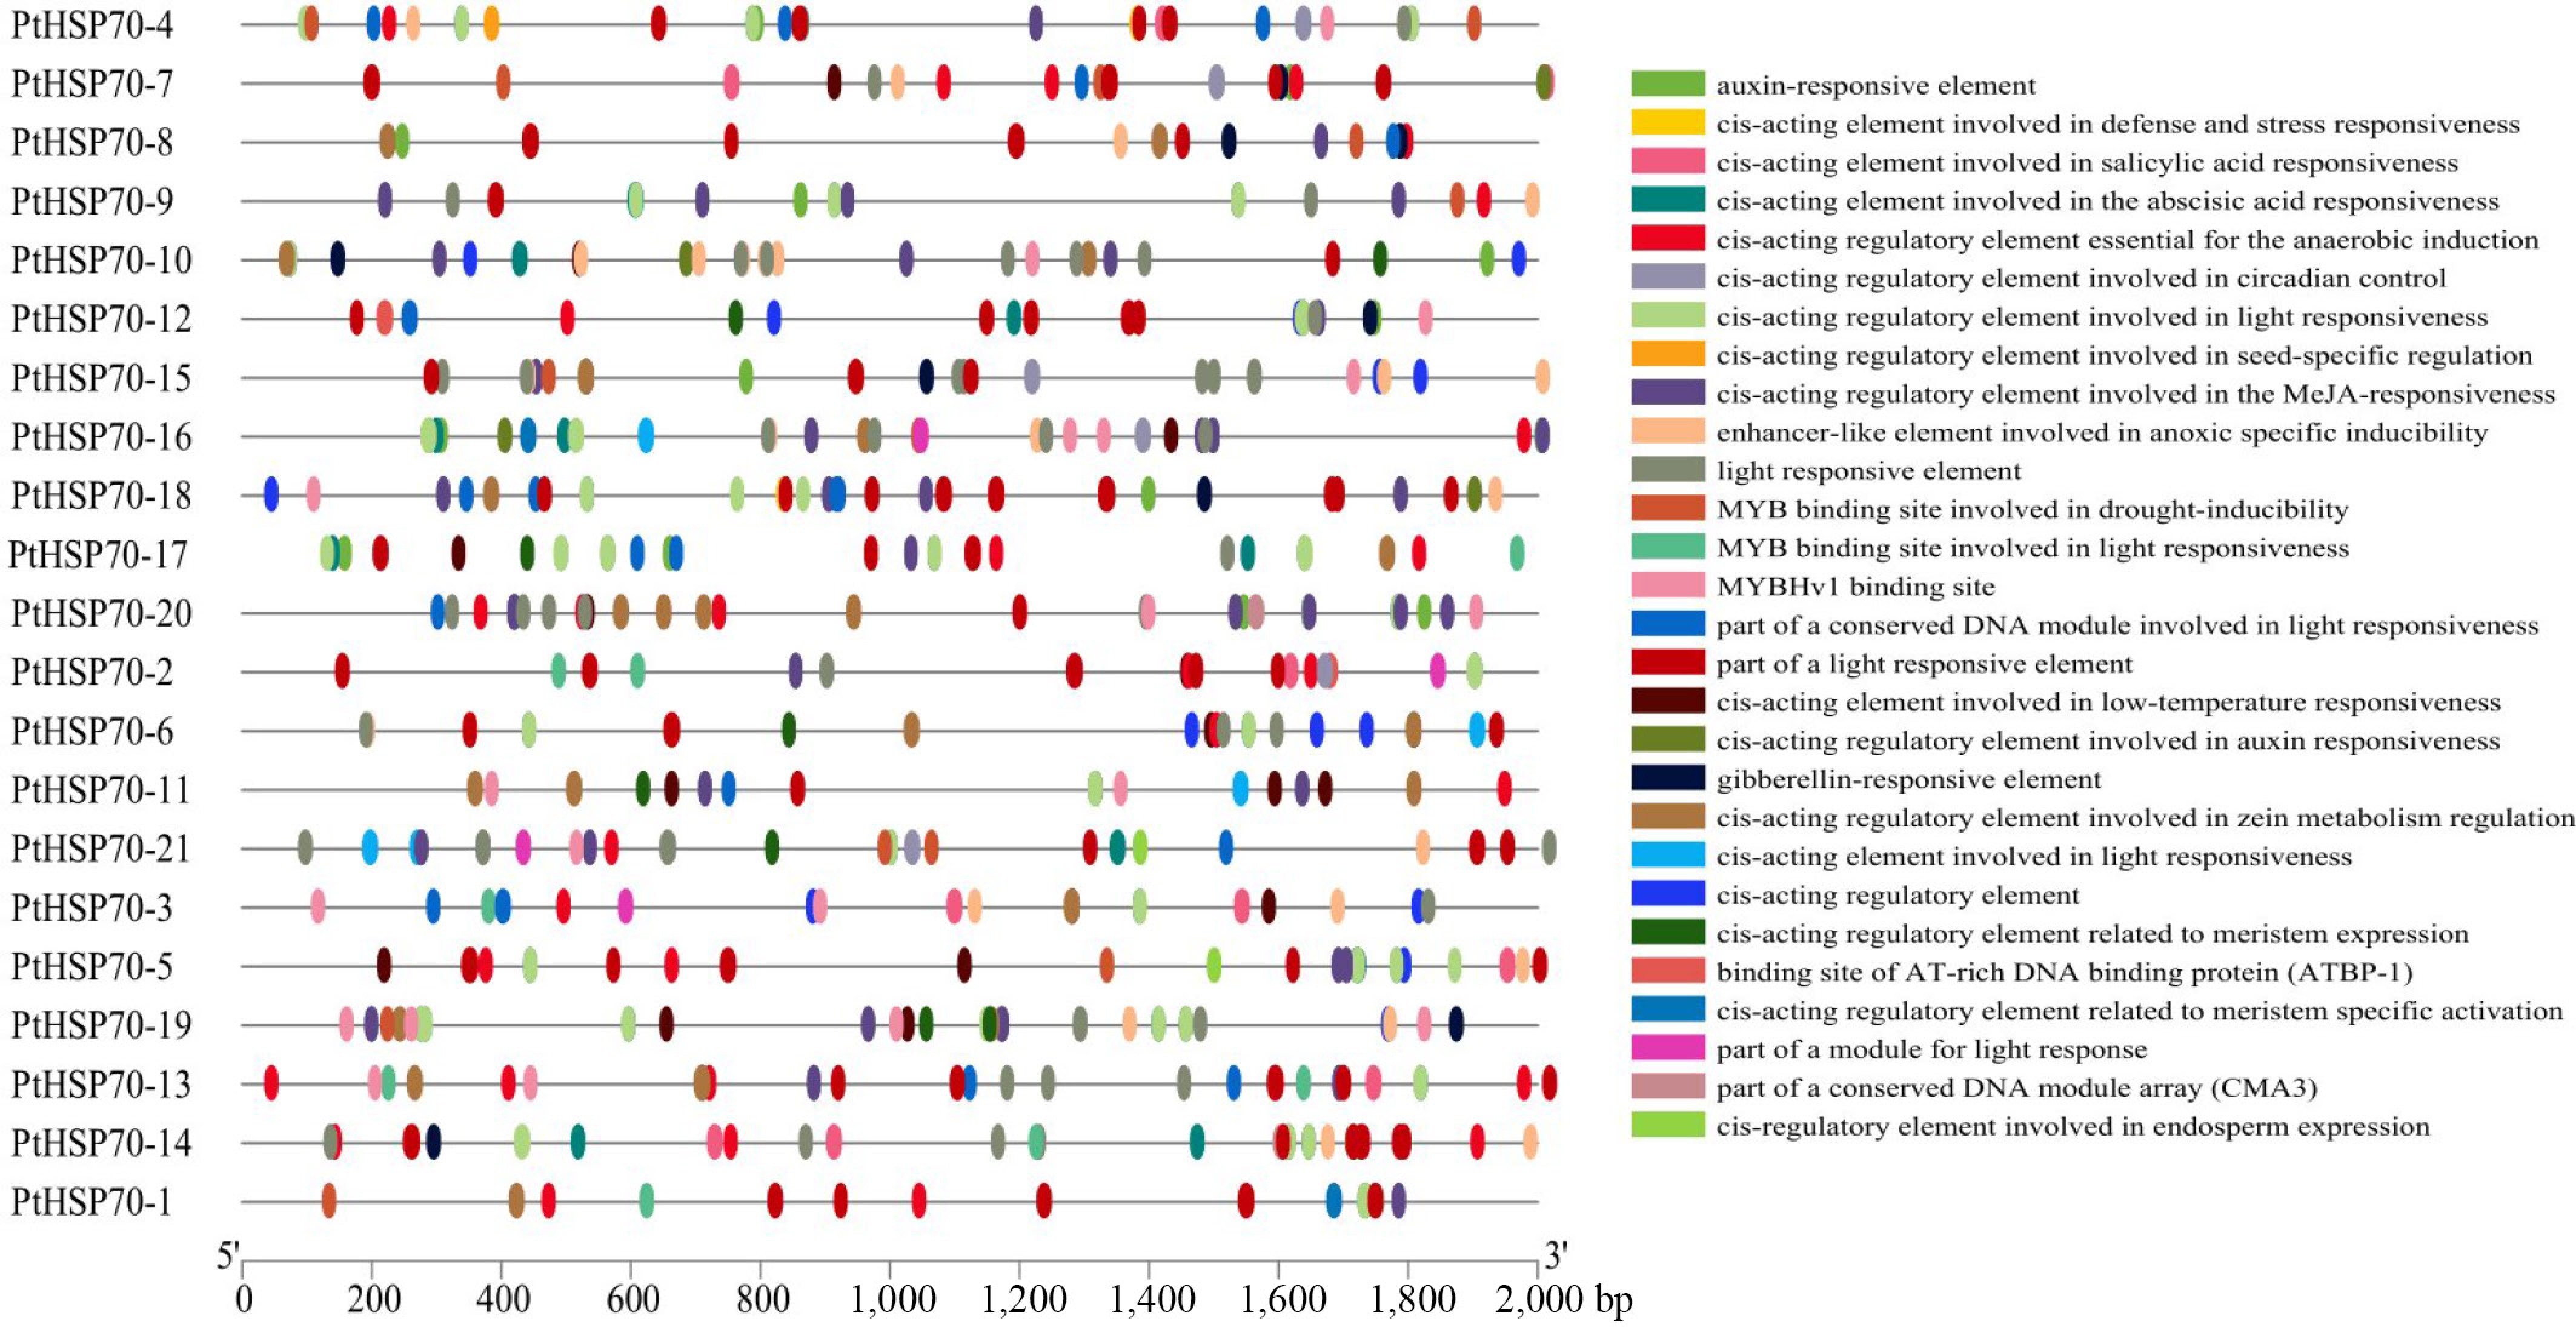
Figure 2.
PtHSP70 promoters' cis-acting elements. Different colored squares show different promoter cis-acting elements.
Chromosomal mapping of PtHSP70 genes
-
The 19 identified PtHSP70 genes were mapped to the seven chromosomes of P. ternata, revealing an uneven chromosomal distribution (Fig. 3). Chromosome 5 harbored the highest number of HSP70 genes (five), followed by chromosome 9 (four). Chromosome 11 had the lowest gene density, with only one gene. Chromosomes 1, 3, and 6 each contained two genes, whereas chromosome 2 had three. Overall, HSP70 genes were unevenly distributed across the seven chromosomes. The distribution pattern showed that most genes were located toward the distal (end) regions of chromosomes, with fewer in the central (middle) regions.
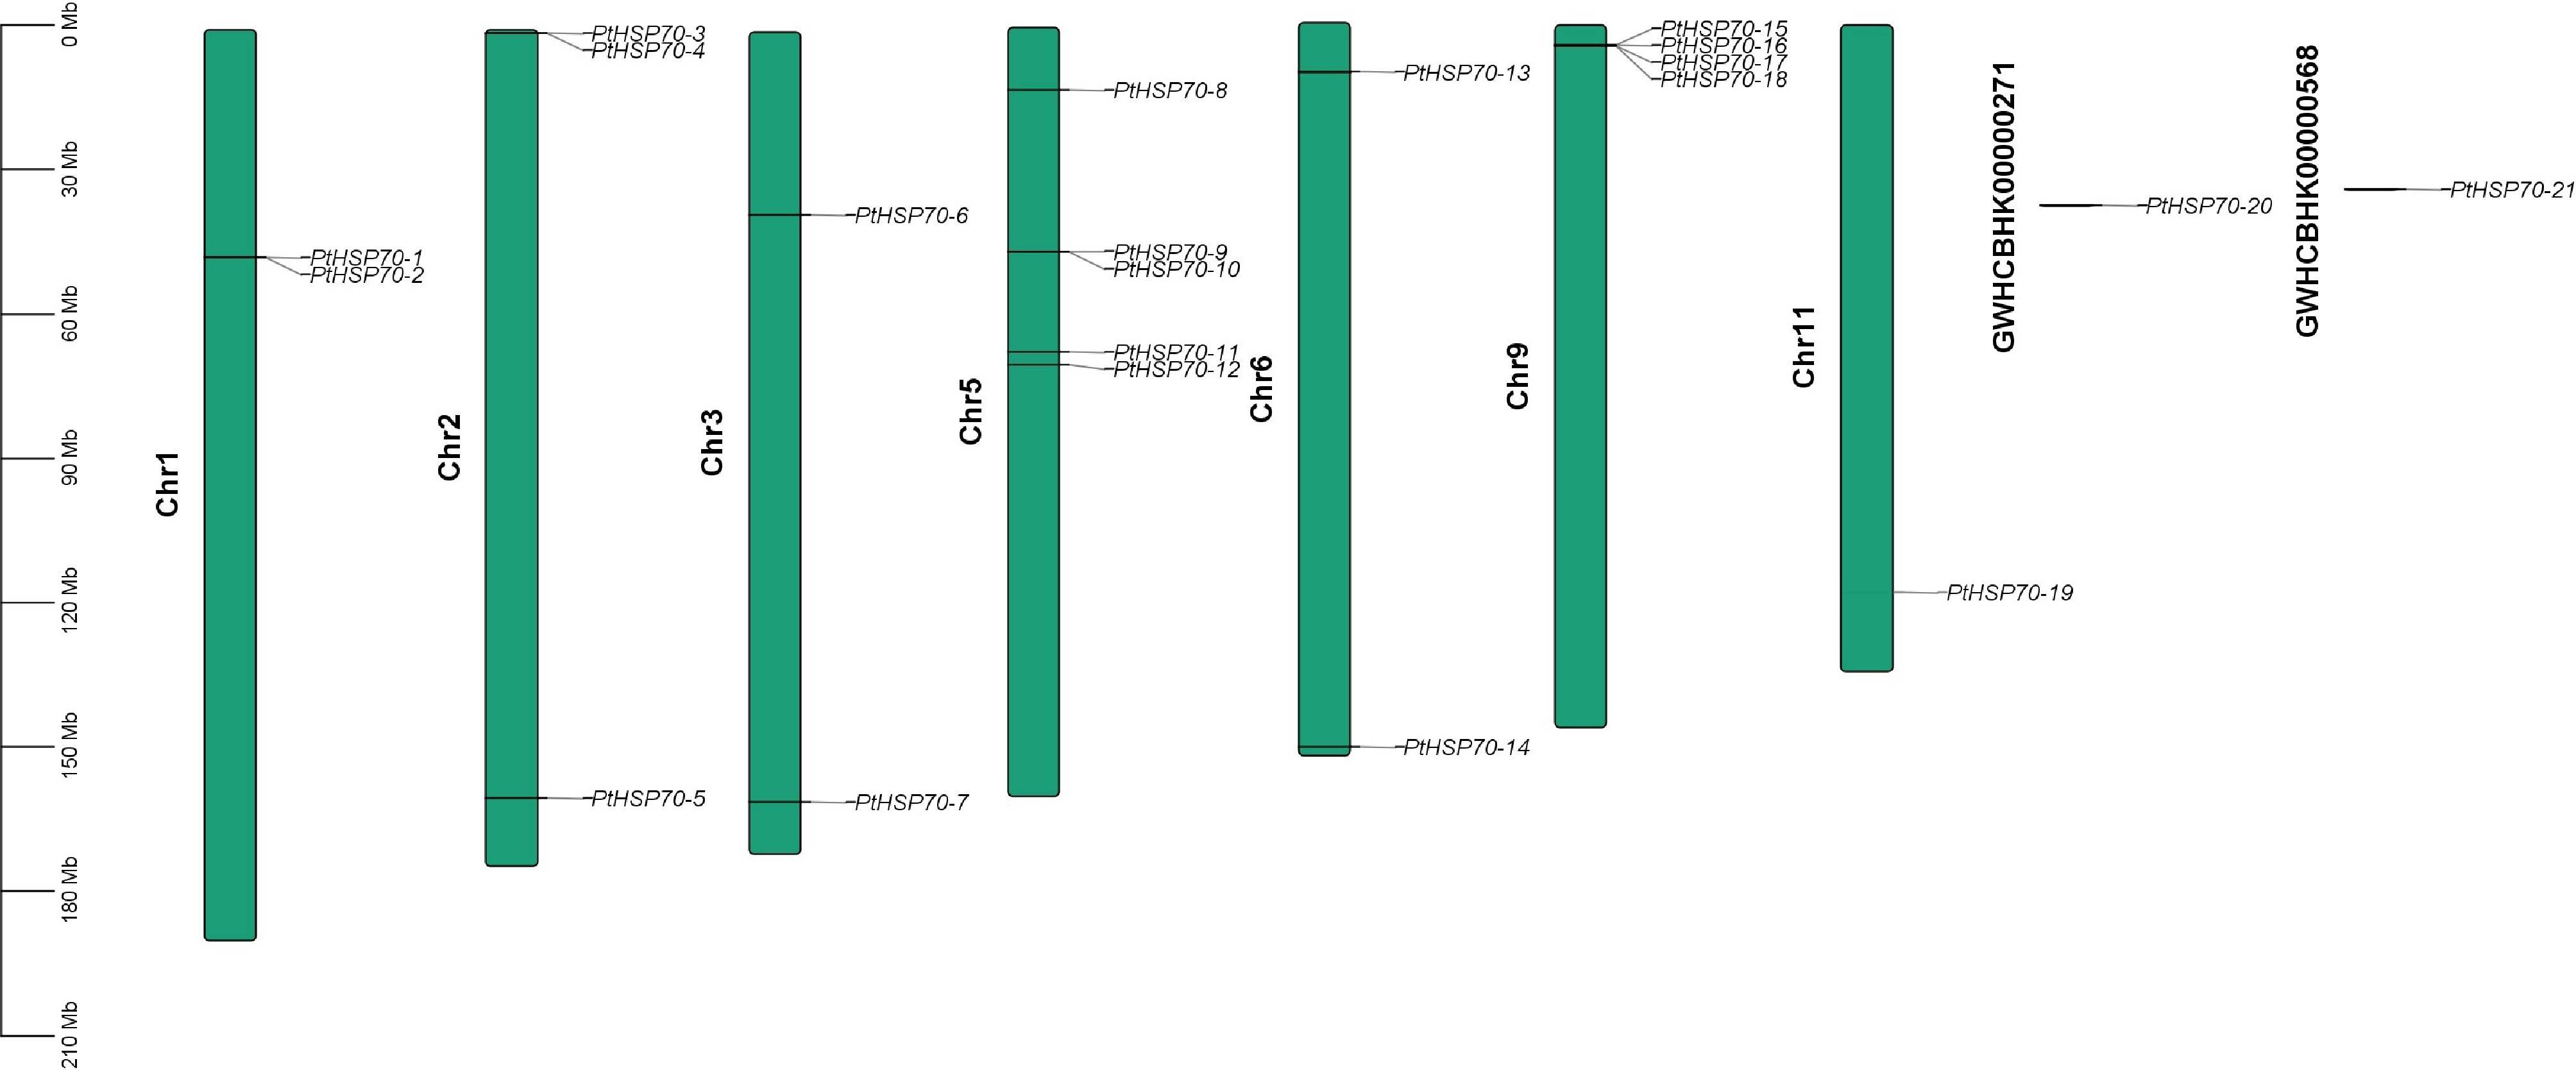
Figure 3.
Chromosomal location of the PtHSP70s. The chromosomes containing PtHSP70 genes are presented according to their physical lengths. The scalebar (Mb) on the left represents the length of the chromosomes, and the chromosome numbers are displayed on the left of chromosomes.
Collinearity of PtHSP70 genes between P. ternata and other plant species
-
To investigate the evolutionary relationships of PtHSP70s across species, both interspecific (between P. ternata and four other studied species) and intraspecific collinearity analyses were performed; the former was used to identify orthologous genes (Fig. 4). One gene pair was identified in the 21 PtHSP70s, corresponding to PtHSP70-15 (mapped to chromosome 9) and PtHSP70-10 (mapped to chromosome 5). (Fig. 4a). To further study the divergence and selection in the gene duplication of PtHSP70s, the Ka/Ks values of the paralogous gene pairs in P. ternata were evaluated (Supplementary Table S4). The Ka/Ks values of the paralogous gene pairs in P. ternata were less than 1, demonstrating that these genes were mainly under purifying selection during evolution.
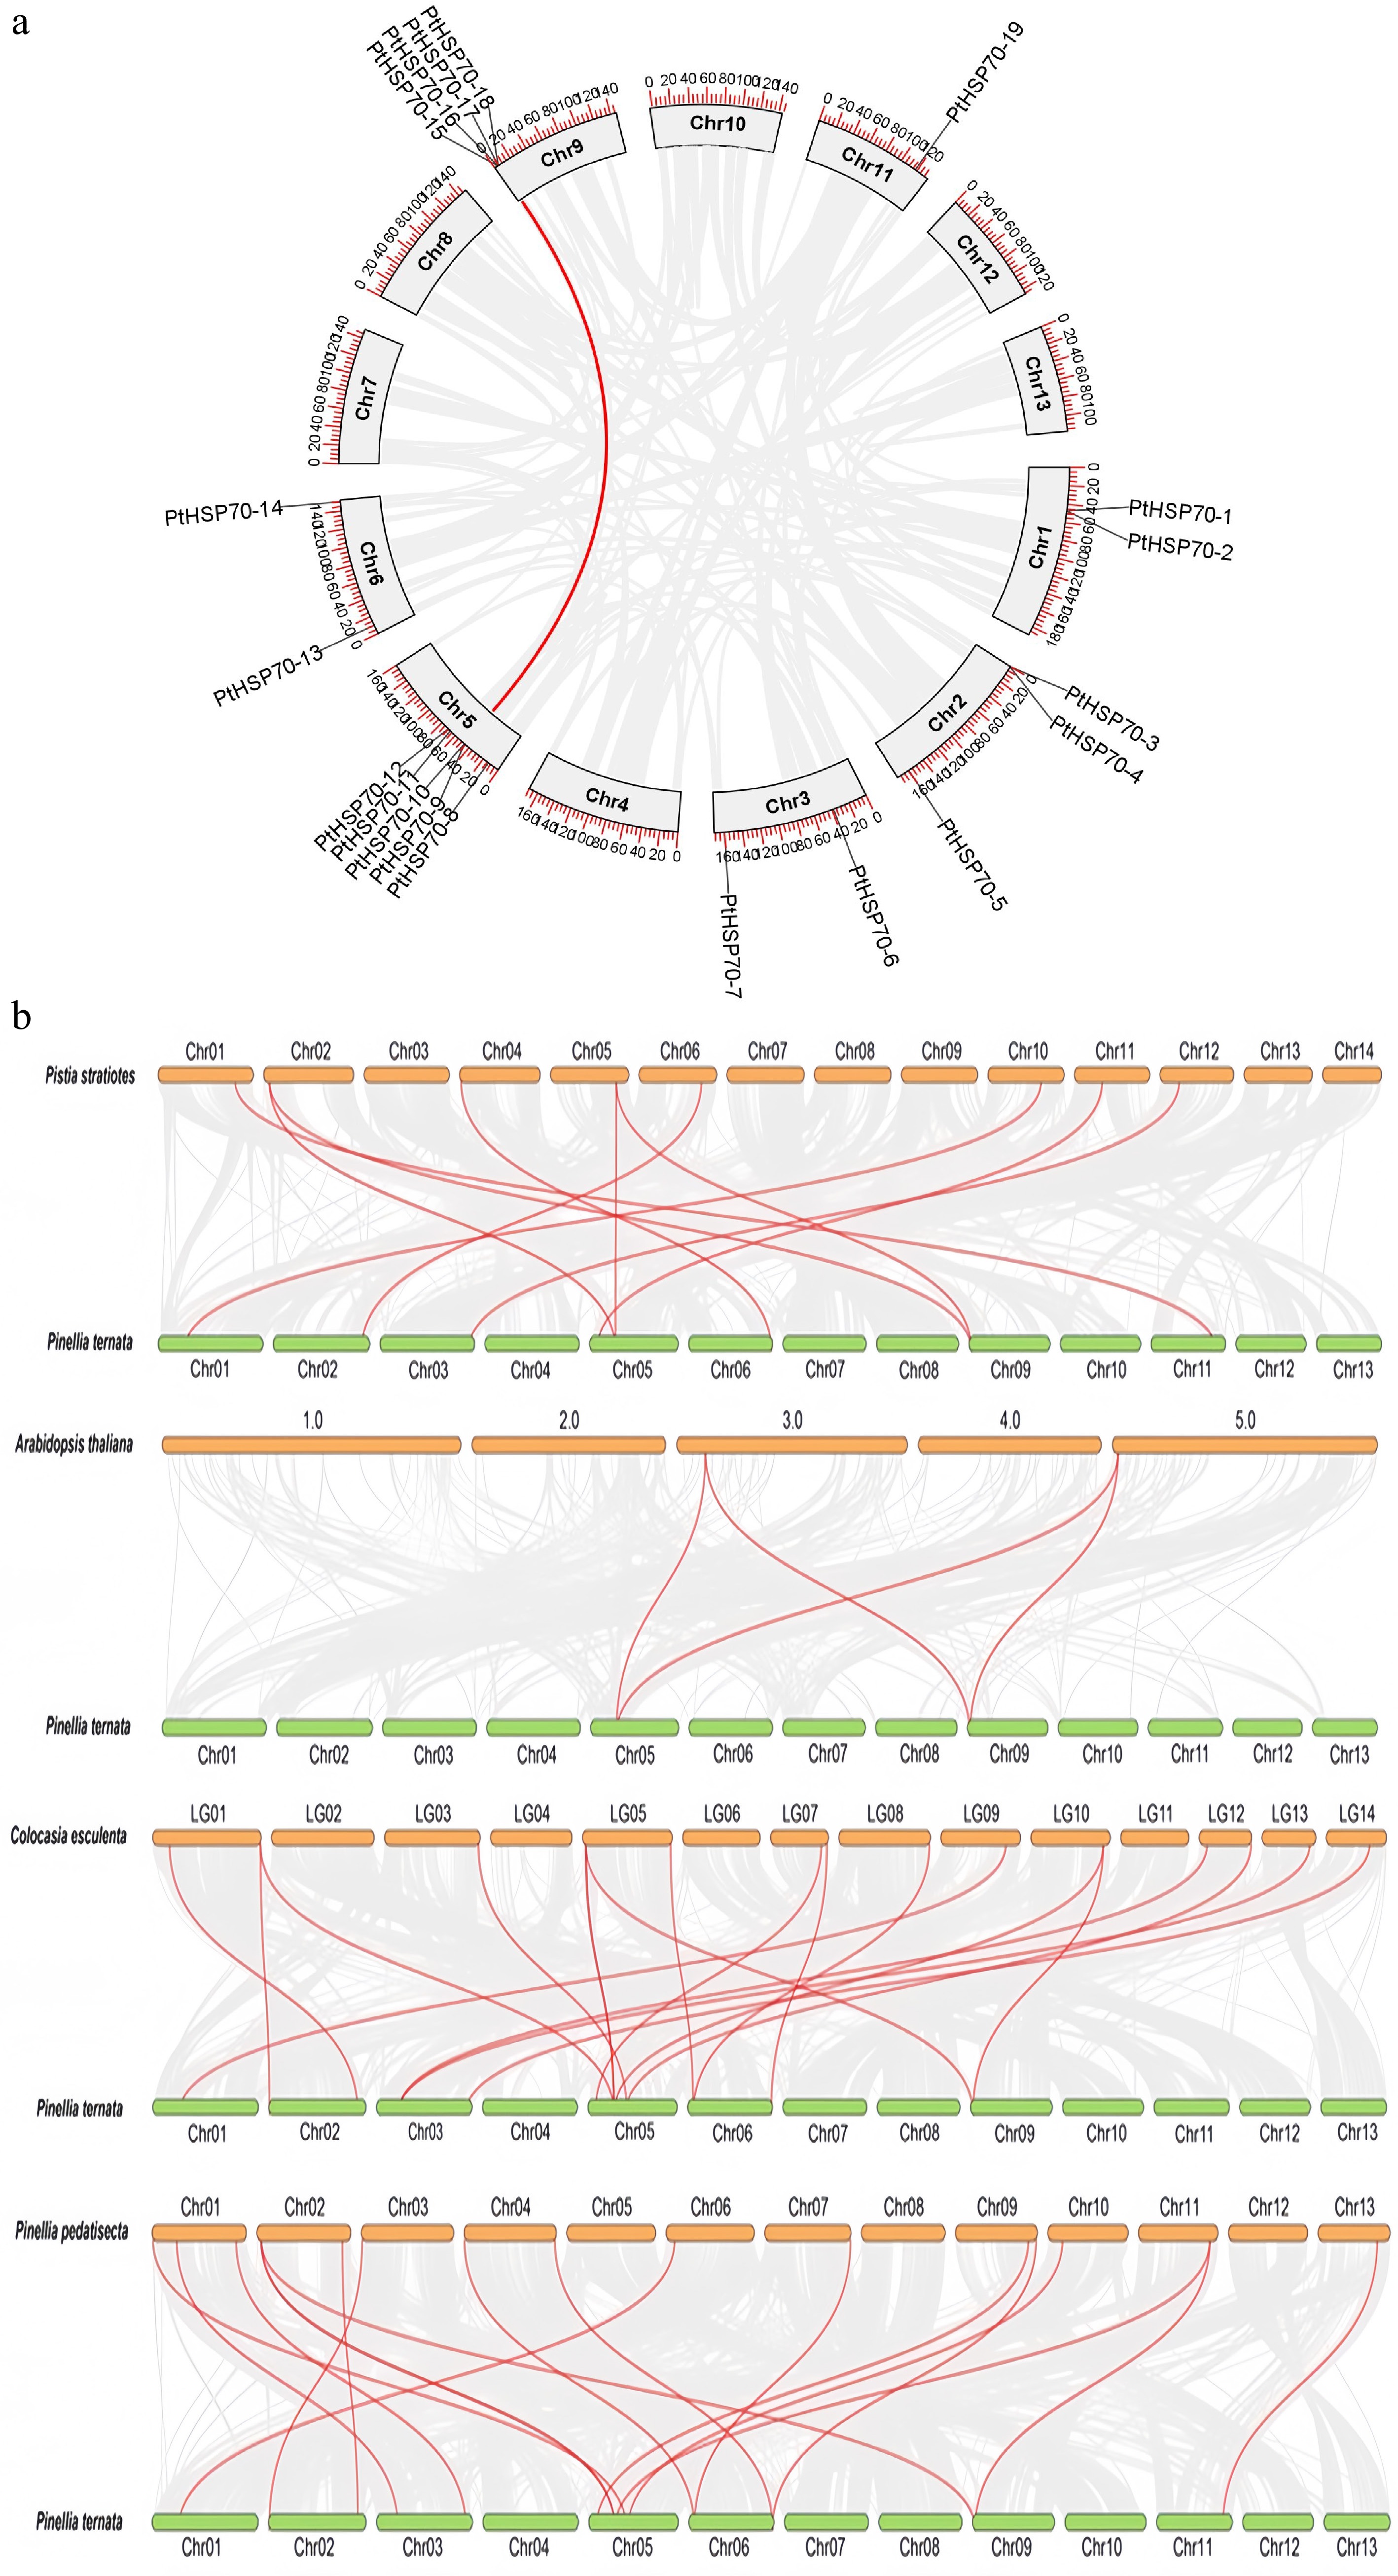
Figure 4.
Collinearity analysis of the PtHSP70 gene family between P. ternata, P. stratiotes, A. thaliana, C. esculenta, and P. pedatisecta. (a) Intraspecific collinearity analysis of the PtHSP70 gene. Synteny analysis of PtHSP70 genes in P. ternata. Gray lines indicate all syntenic gene pairs in the P. ternata genome, and red lines indicate collinearity relationships among P. ternata PtHSP70 genes. Chr, chromosome. (b) Collinearity analysis of the PtHSP70 gene across different species. The green bars show the chromosomes of P. ternata, orange shows the different chromosomes within different species. Red lines show the orthologous pairs between the species, and gray lines represent collinearity blocks. The four species are P. stratiotes, A. thaliana, C. esculenta, and P. pedatisecta.
Comprehensive syntenic analysis was performed to define the collinearity relationship of PtHSP70 with four representative species, namely Pistia stratiotes, A. thaliana, Colocasia esculenta, and Pinellia pedatisecta. As shown in Fig. 4b, the results suggested that these species included one dicotyledonous species (A. thaliana) and three monocotyledonous species (P. stratiotes, C. esculenta, and P. pedatisecta). There were 19 pairs of orthologous genes between P. ternata and C. esculenta, 18 pairs between P. ternata and P. pedatisecta, 10 pairs between P. ternata and P. stratiotes, and 4 pairs between P. ternata and A. thaliana. P. ternata had strong collinearity with the monocotyledonous species (P. stratiotes, C. esculenta and P. pedatisecta) but had the least collinearity with the dicotyledonous species (A. thaliana). Overall, these findings provided new insights into the evolution of PtHSP70 genes: The collinear HSP70s between species may originate from the same ancestor.
Analysis of parameters related to codon usage bias
-
The frequencies of third-position bases in synonymous codons (A3s, T3s, C3s, and G3s) in P. ternata are 18.49%, 28.74%, 39.63%, and 40.45%, respectively. The higher proportions of C3s and G3s compared with A3s and T3s suggest that codons in the PtHSP70 genes predominantly end in C or G (Fig. 5a). The number of synonymous amino acids (Lsym) and length of the amino acids (Laa) for the PtHSP70 genes range from 320 to 821 and from 332 to 841, respectively. Gravy scores range from –0.83 to 0.06, Aromo values from 0.04 to 0.08, CAI values from 0.195 to 0.298, CBI values from –0.083 to 0.209, and FOP values from 0.375 to 0.548. Correlation analysis revealed that G3s and C3s were positively associated with codon bias indicators (CAI, CBI, FOP) and GC3s, whereas T3s showed negative correlations with these parameters (Fig. 5b). The value of ENC ranged from 30.93 to 56.56, with all 21 PtHSP70 genes exhibiting ENC > 35, indicating weak codon usage bias. The ranges for individual genes were GC, 43.50%−61.71%; GC1, 43.50%−61.71%; GC2, 35.29%−43.15%; and GC3, 38.54%−91.72%. The order of GC content at the three codon positions was GC3 > GC1 > GC2, indicating a biased nucleotide composition among the codon positions in PtHSP70 genes among the codon positions in PtHSP70 genes (Fig. 5c, d).
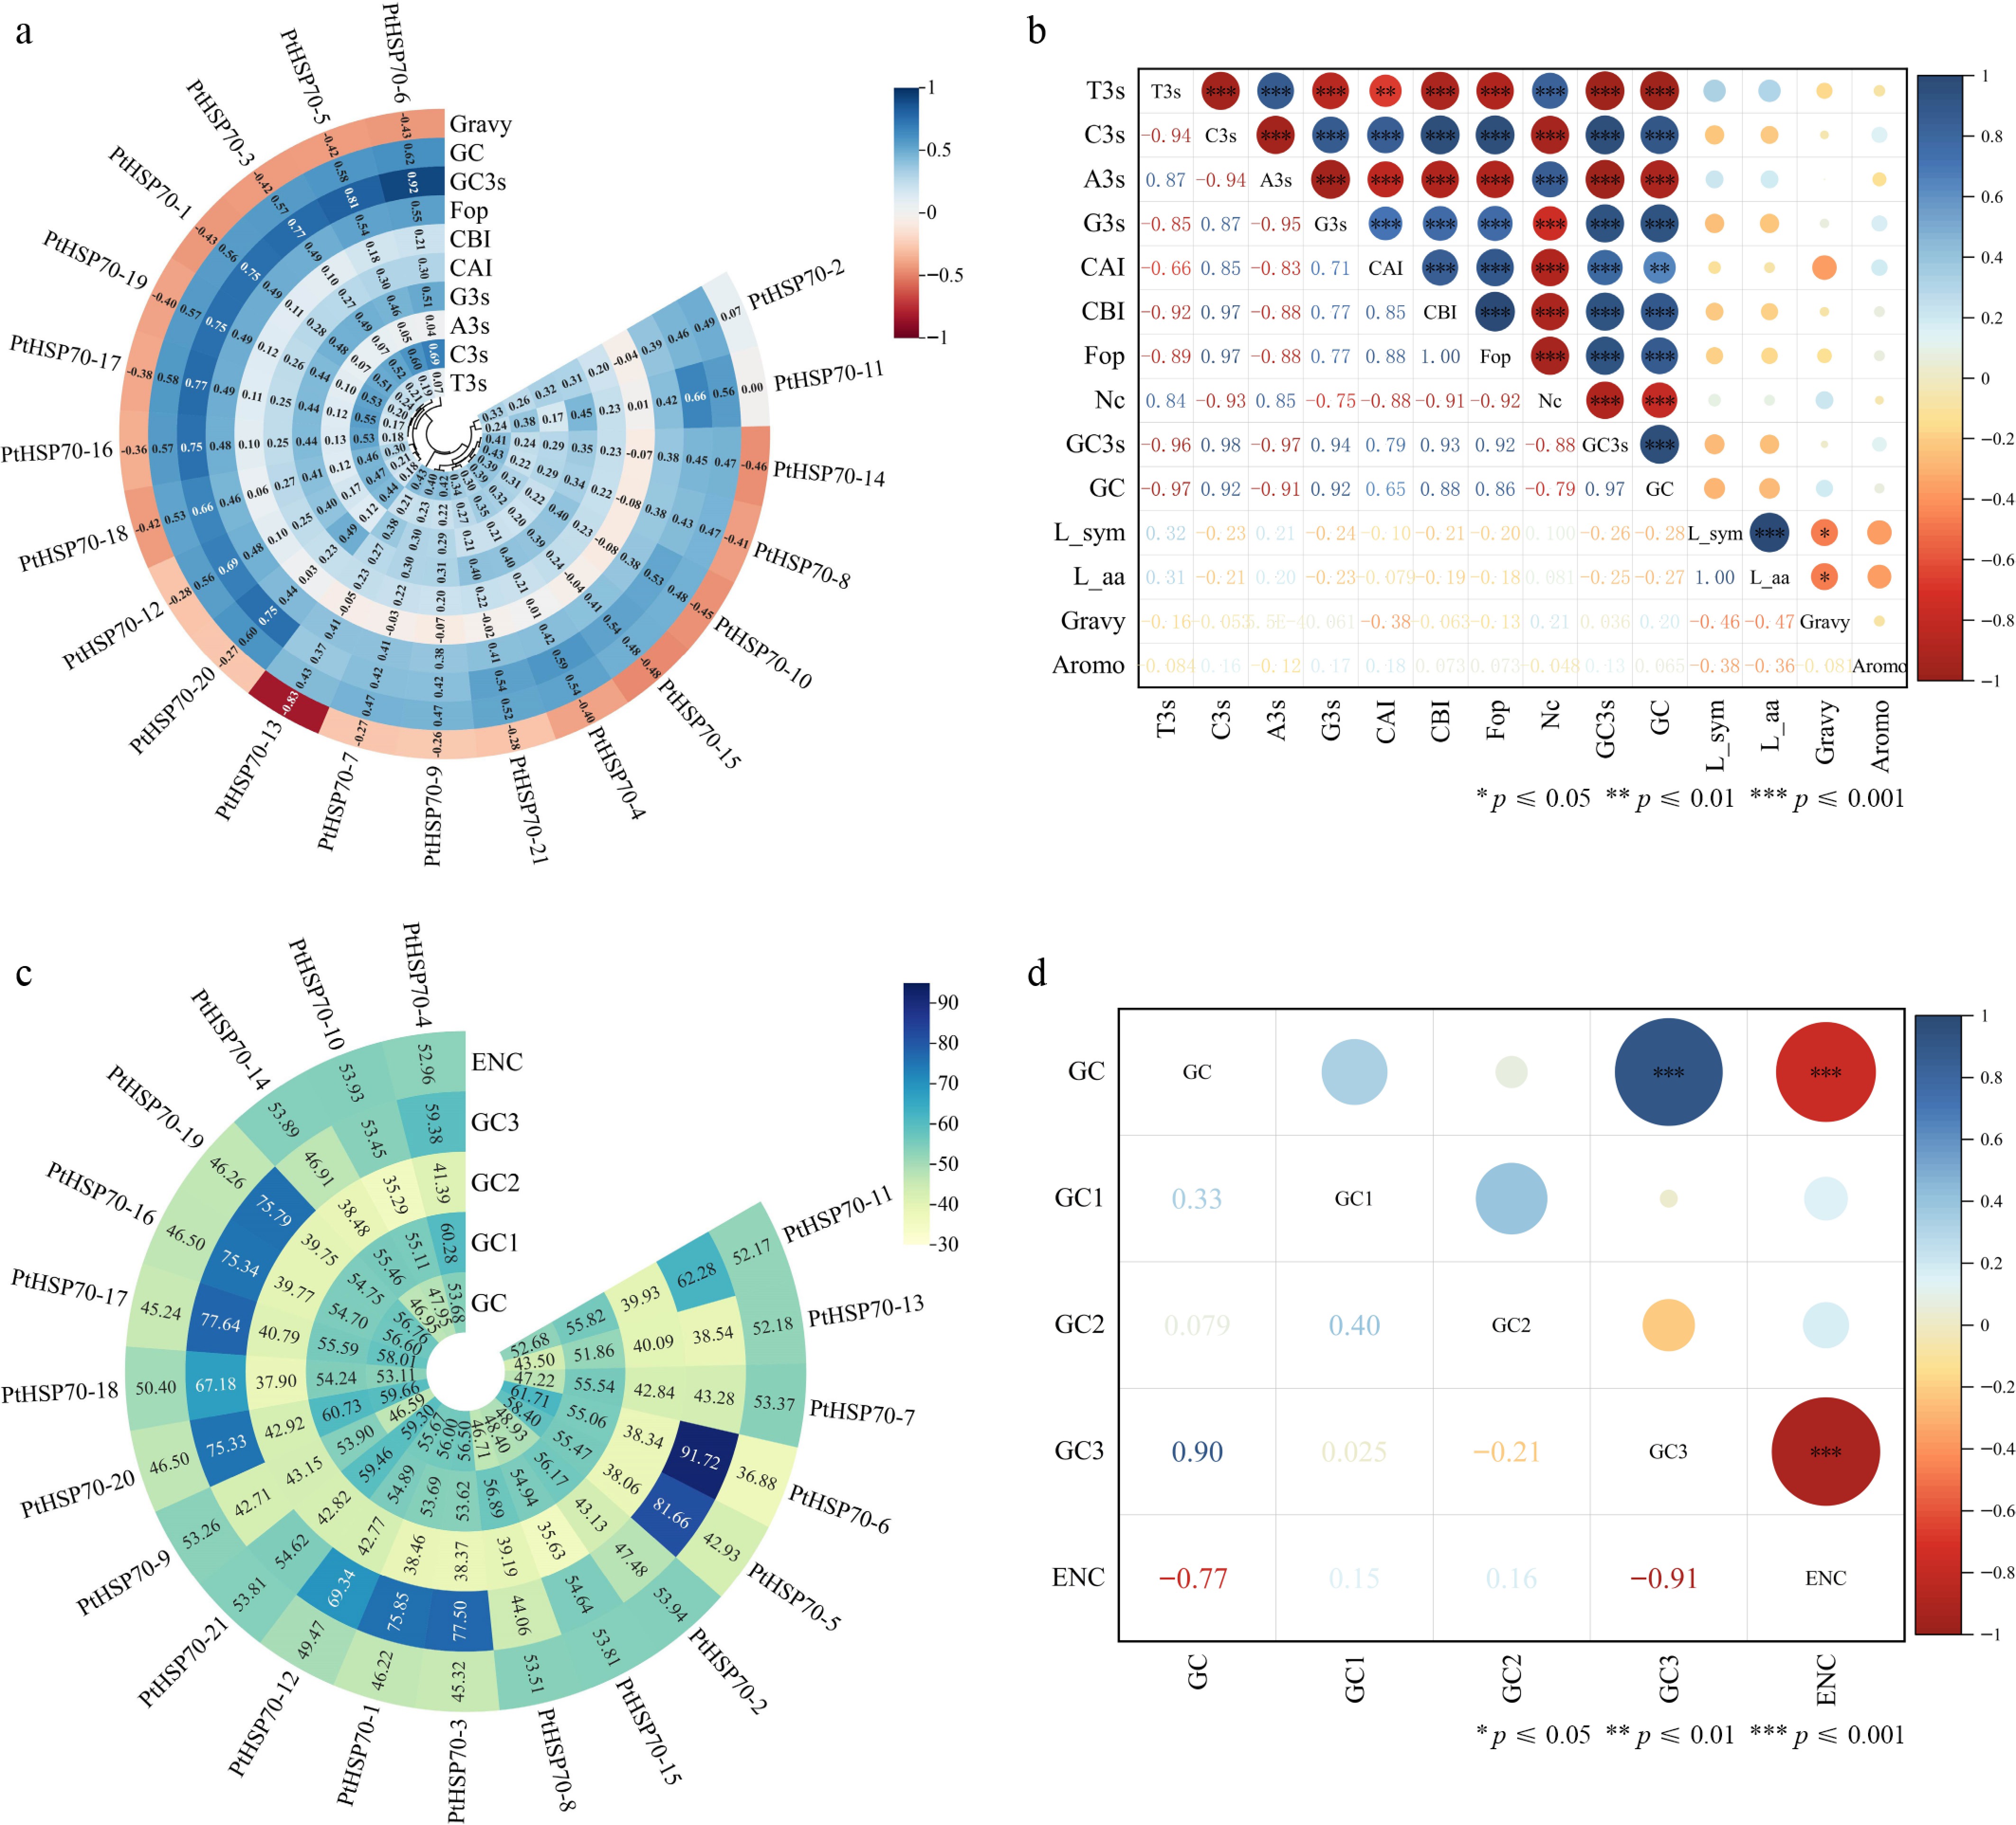
Figure 5.
Analysis of parameters related to codon usage bias. (a) Codon parameter analysis of the PtHSP70 gene family, including the Gravy value (Gravy), the frequency of the third base corresponding to synonymous codons (A3s, G3s, C3s, T3s), CAI, CBI, FOP, G + C content at the third codon position (GC3s), and total G + C content of the gene (GC). (b) and (d) Correlation analysis of HSP70 gene family codons, where L-sym represents the number of synonymous amino acids, L-aa denotes the length of the amino acid sequence, and Aromo refers to the frequency of aromatic amino acids. (c) Codon base composition of the HSP70 gene family, including G + C content at the first (GC1), second (GC2), and third (GC3) codon positions, as well as the ENC. (a) and (c) were analyzed using Codon W and CUSP tools; (b) and (d) were constructed using Origin software.
Analysis of factors influencing the codon usage preference of the PtHSP70 gene family
-
In the neutrality plot, GC12 ranged from 45.20% to 51.83%, whereas GC3 varied from 38.54% to 91.72% (Fig. 6). Most PtHSP70 genes were located below the diagonal line (the expected trajectory under pure mutational bias). The correlation coefficient between GC12 and GC3 was 0.0137 (p > 0.05), indicating no significant relationship. This weak correlation suggests that codon usage in the PtHSP70 family is primarily driven by natural selection rather than mutational pressure. Analysis of the ENC plot also supported this conclusion: The majority of genes fell below and were distant from the expected curve, consistent with selective constraints on codon usage. In contrast, a subset of four genes clustered near the expected curve, implying that their codon bias is largely shaped by mutational pressure. Analysis of the PR2 bias plot revealed an asymmetric distribution of codons, with most points concentrated in two quadrants. The base composition at the third codon position followed the order T3 > A3 and C3 > G3, indicating a significant bias in nucleotide usage.
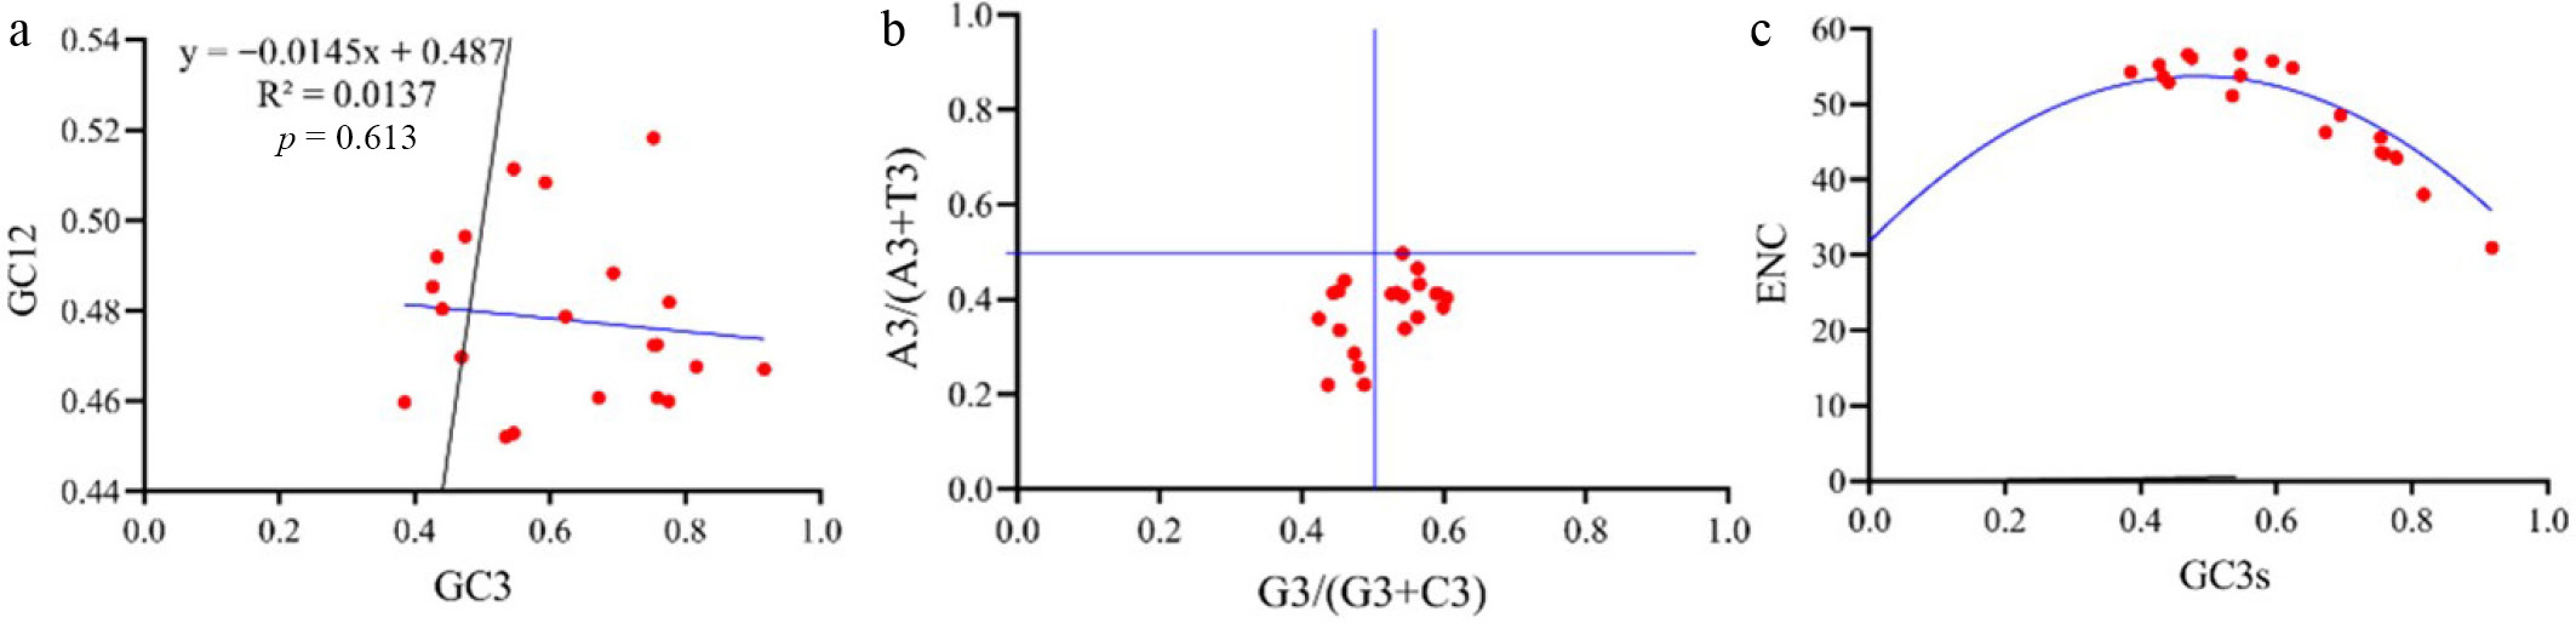
Figure 6.
(a) Neutrality plot analysis (the x axis is the frequency of the codon at the first and second position of G/C, and the y axis is the frequency of the codon at the third position of G/C). (b) PR2 bias plot analysis, with G3/(G3 + C3) as the x-axis and A3/(A3 + T3) as the y-axis. G3, C3, A3, and T3 are the contents of G, C, A, and T at the third codon position, respectively to get the PR2 plot (parity rule 2-plot) diagram. (c) ENC plot analysis using ENC as the ordinate and the C and G content (GC3) of the codon at Position 3 as the abscissa to draw a scatter plot to obtain the ENC plot.
RSCU values analysis and determination of putative optimal codons
-
The RSCU (relative synonymous codon usage) analysis of the P. ternata HSP70 gene family was performed using Codon W and CUSP. The analysis reveals that UUA exhibited the lowest usage frequency (RSCU = 0.3), whereas the AGG demonstrated the highest usage frequency (RSCU = 2.5). The results also demonstrated that 33 codons exhibited RSCU values greater than 1, but 31 codons demonstrated RSCU values less than 1. The preferred codons were C-ended (15), G-ended (8), U-ended (7), and A-ended (3) (Supplementary Table S5). By comparing the RSCU values of the HSP70 gene, two bias libraries for 12 optimal codons UUG, CUU (leucine), GUU (valine), UCU, UCA (Ser), CCU, CCA (proline), ACU (Thr), GCU, GCA (alanine), GAU (asparagine), and AGA (arginine) were determined, whose ΔRSCU are greater than 0.3, with RSCU > 1 in high-bias genes and RSCU < 1 in low-bias genes (Supplementary Table S6).
Analysis of tissue-specific expression of the PtHSP70 gene
-
To elucidate PtHSP70's expression characteristics, we analyzed their patterns across P. ternata tissues (leaf, petiole, root, flower, and tuber) in the public RNA-seq data (Fig. 7a). PtHSP70s showed variable expression across tissues, implying distinct functions. Most PtHSP70 genes were highly expressed in the tubers except for PtHSP70-21 and PtHSP70-3. Genes like PtHSP70-3 and PtHSP70-8 had high abundance (log2 fold change > 1.0) in flowers and tubers. Tissue-specific patterns were also observed: PtHSP70-4 was elevated in the roots, whereas PtHSP70-21 was highly expressed in the flowers. These results highlight PtHSP70s' roles in tissue development.
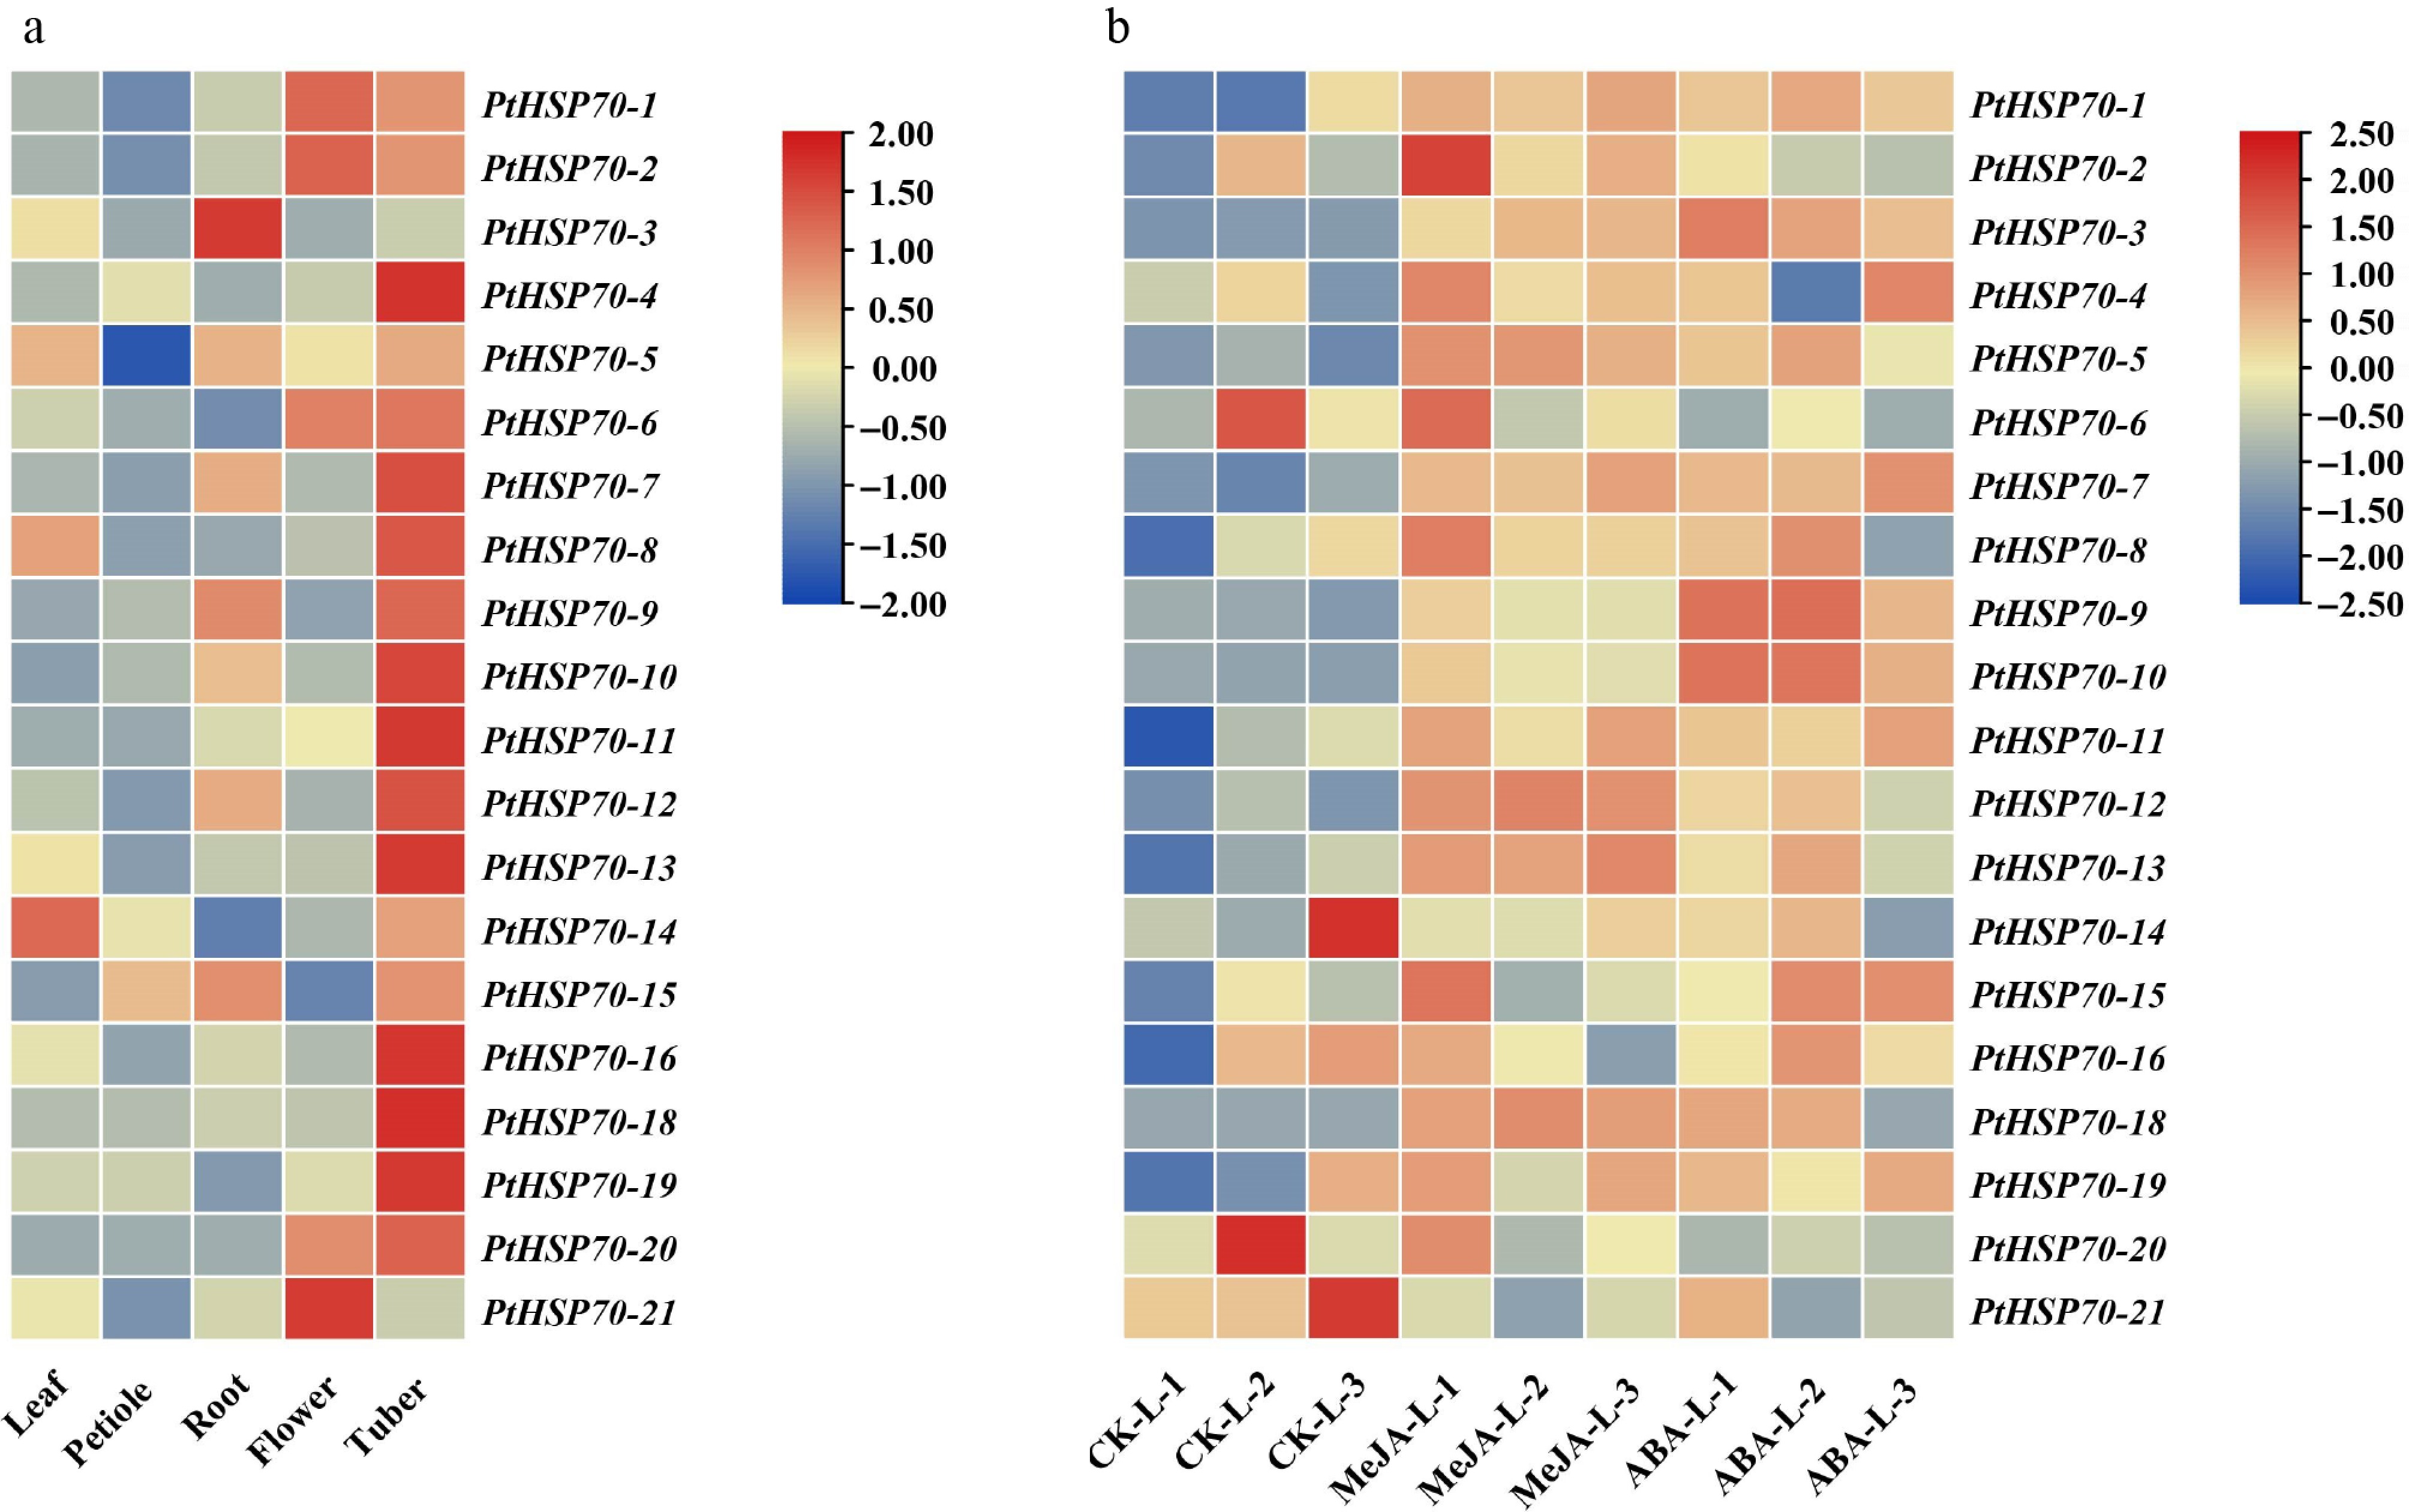
Figure 7.
Expression profiles of PtHSP70 genes in different tissues and in response to phytohormone treatments. (a) Tissue-specific expression profiles of PtHSP70 genes in P. ternata (leaf, petiole, root, flower, and tuber). The color scale on the right represents the expression level, with red indicating high transcript abundance and blue indicating low transcript abundance. (b) Expression patterns of PtHSP70 genes under MeJA and ABA treatments. The heatmap shows the relative expression levels (log2 fold change) of 21 PtHSP70 genes in P. ternata under control (CK), 100 μM MeJA, and 100 μM ABA treatments (three biological replicates per treatment). Color intensity reflects the magnitude of expression: Red denotes upregulation (maximum log2 fold change = 2.50), blue denotes downregulation (minimum log2 fold change = −2.50), and yellow indicates no significant change (log2 fold change ≈ 0).
Expression patterns of the PtHSP70 gene under MeJA and ABA treatments
-
To characterize PtHSP70s' responses to phytohormones, their expression under MeJA and ABA was profiled via RNA-seq (Fig. 7b). The heatmap reveals distinct regulatory patterns. Five PtHSP70 genes (PtHSP70-3, PtHSP70-7, PtHSP70-9, PtHSP70-10 and PtHSP70-12) were significantly upregulated both by ABA and MeJA, indicating potential involvement in the ABA and jasmonic acid signaling pathways.
PtHSP70 gene expression in response to heat or cold stress
-
To further investigate the expression of PtHSP70 genes under heat and cold stress, we analyzed all 21 members of this family (Fig. 8). After 1 h of cold stress, 12 PtHSP70 genes (PtHSP70-3, -4, -5, -6, -7, -8, -11, -13, -14, -15, -17, and -18) were rapidly upregulated. In contrast, under 1 h of heat stress, 14 PtHSP70 genes (PtHSP70-4, -6, -7, -9, -10, -11, -12, -13, -14, -16, -17, -18, -19, and -20) showed rapid induction, with expression levels significantly higher than those in the CK group. At 6 h, the expression levels of most PtHSP70 genes were relatively low under both stress conditions. Meanwhile, PtHSP70-17 and -14 exhibited relatively high expression under cold stress compared with other family members. Overall, PtHSP70 genes showed stronger induction in response to heat stress than to cold stress, indicating that this gene family is more responsive to elevated temperatures.
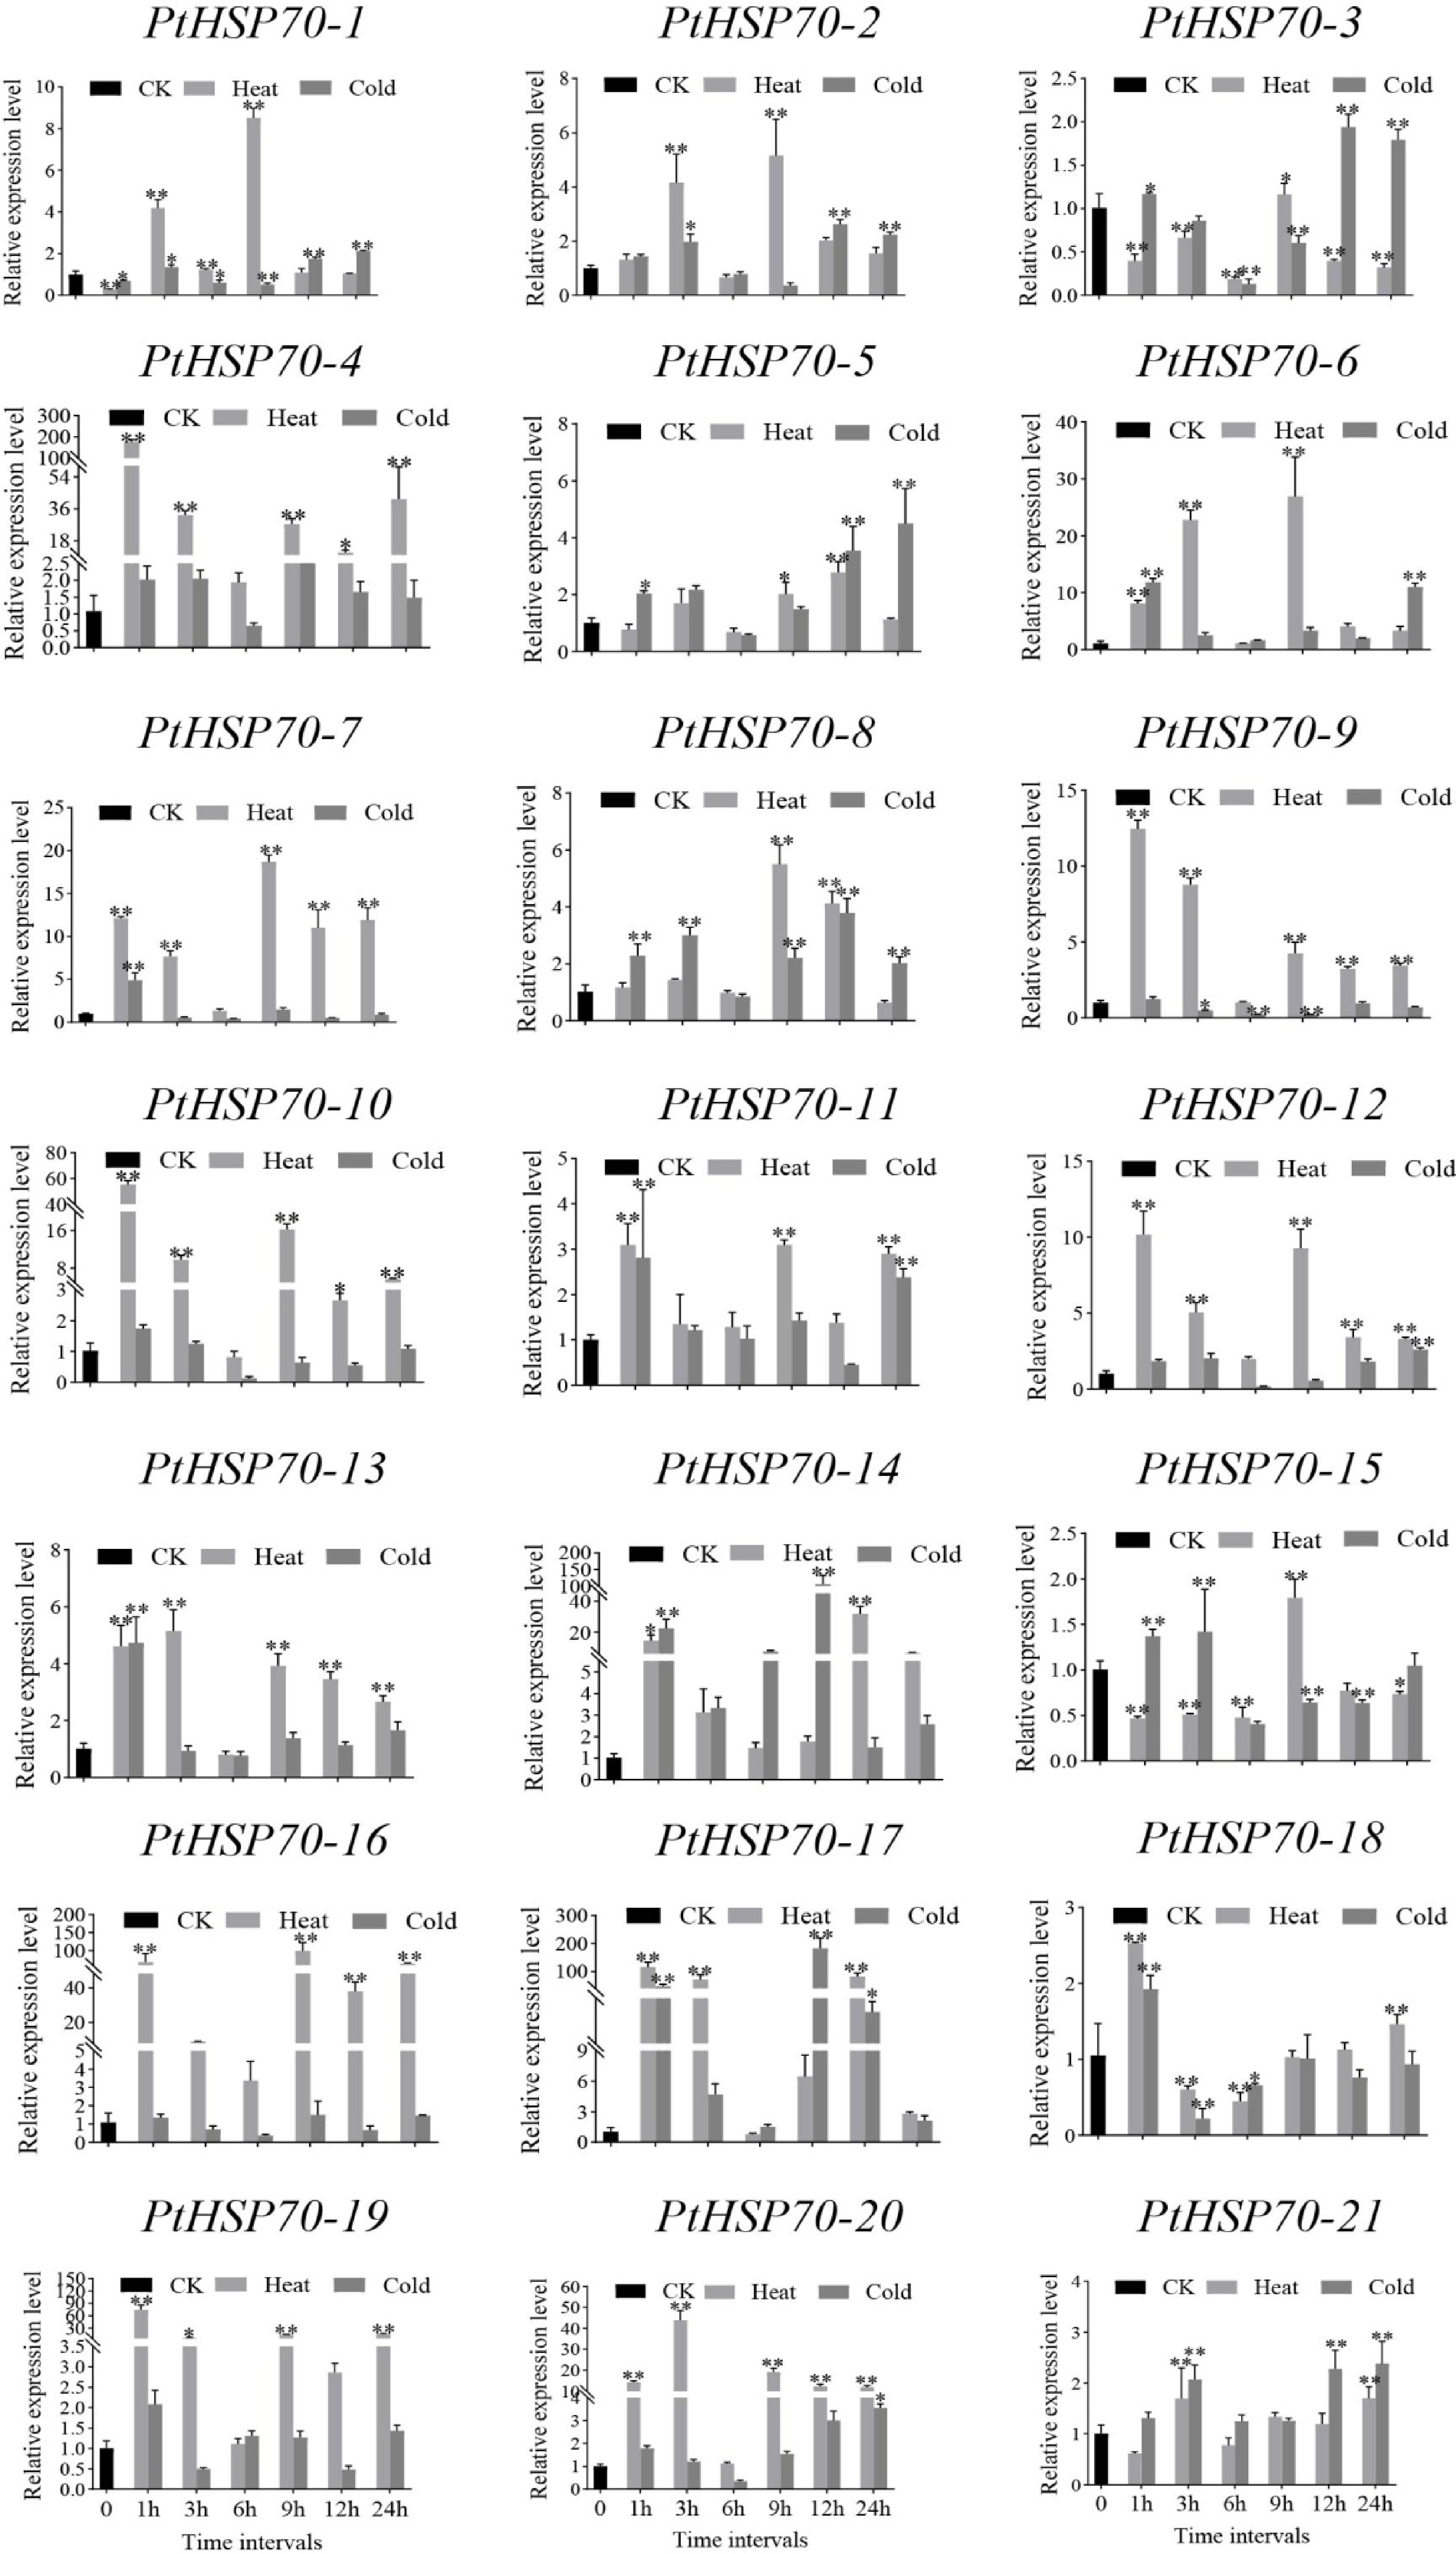
Figure 8.
Gene expression of 21 PtHSP70s under individual cold or heat stress at 0, 3, 6, 9, 12, and 24 h were analyzed using real-time qPCR.
The 0 h indicator denotes the point in time at which the P. ternata seedlings were not exposed to any external stress. The 3, 6, 9, 12 and 24 h times denote when the P. ternata seedlings were exposed to either cold or heat stress for a longer period of time. The CK group is represented by black bars, the heat stress treatment by gray bars, and the cold stress treatment by dark gray bars. Error bars represent the standard error of the mean (SEM) from three biological replicates (n = 3). The ribosomal 18S gene was used as the internal control. Statistical significance was determined by one-way ANOVA followed by Duncan's multiple comparison test, with * indicating a significant difference compared with the CK group at p < 0.05 and ** indicating a significant difference at p < 0.01.
-
Photosynthesis is a thermosensitive process that is disrupted by extreme temperatures, which impairs CO2 assimilation and chlorophyll metabolism in P. ternata seedlings. Under temperature stress, the declines in the photosynthetic parameters (Pn, Gs, ΦPSII) and chlorophyll content, together with the elevated proline content and antioxidant enzyme activities, reflect the adaptive responses of P. ternata. The subcellular localization of PtHSP70s (43% in the ER), 38% in the mitochondria) provides a structural basis for temperature stress defense: ER-localized PtHSP70s maintain protein folding to mitigate ER stress[30], whereas mitochondrial PtHSP70s protect the structure of the respiratory chain and scavenge ROS, ensuring a supply of adenosine triphosphate for stress adaptation[31]. This role is consistent with the conserved function of HSP70 in maintaining organelle homeostasis across plant species, as supported by studies in A. thaliana[32], rice[33], and maize (Zea mays)[31], where multiple HSP70 genes exhibit significant upregulation or downregulation under heat or cold conditions. Notably, the HSP70 gene family generally plays a crucial role in protecting plants and reestablishing cellular and biological functions under temperature stress[11], and their gene expression patterns are closely correlated with their functions; therefore, analyzing these patterns can partially predict the molecular functions of genes involved in different biological processes[34]. Consistent with this, a real-time qPCR analysis (Fig. 8) verified the response of PtHSP70s to heat and cold stress, showing that PtHSP70-4, PtHSP70-14, PtHSP70-16, and PtHSP70-17 were significantly induced under both stress conditions, indicating their potential important roles in temperature stress response.
ABA and jasmonic acid signaling pathways are widely involved in plants' responses to various stresses. The promoters of PtHSP70s contain numerous ABA-responsive and MeJA-responsive elements, suggesting that the expression of these genes may be regulated by ABA and MeJA. Other results on the expression patterns (Fig. 8) showed that PtHSP70-3, PtHSP70-7, PtHSP70-9, PtHSP70-10, and PtHSP70-12 were significantly upregulated by both ABA and MeJA. Collectively, these findings indicate that PtHSP70s are regulated by ABA, MeJA, and cold and heat stress, implying that the PtHSP70 family may function in ABA-and jasmonic acid-mediated regulation of abiotic stress responses. This synergistic interaction between MeJA and ABA signaling in enhancing P. ternata's stress resistance is consistent with previous findings in maize, where HSP70 mediates ABA-induced antioxidant responses under combined stresses[35].
Collinearity analysis showed that PtHSP70s share synteny with monocot orthologs, whereas the purifying selection (Ka/Ks < 1) confirms their functional conservation[36,37]. PtHSP70s exhibit weak C/G-ending codon bias (ENC: 30.93−56.56), consistent with monocot genomic traits[38,39]. A high GC content stabilizes DNA under stress[40], whereas C/G codons match abundant monocot tRNAs to accelerate translation, ensuring timely chaperone synthesis for stress-induced protein folding[41]. Weak bias also supports functional diversity across growth and stress responses.
This study advances the understanding of HSP70-mediated stress responses by linking the molecular characteristics of PtHSP70s (subcellular localization, hormone-responsive elements, and codon bias) to physiological adaptation outcomes in P. ternata. The findings identify targeted organelle protection, integration of hormone signaling, and translational optimization as key adaptive strategies of P. ternata under temperature stress. These insights not only bridge the gap between the molecular mechanisms and physiological phenotypes of P. ternata under temperature stress but also lay a critical foundation for the subsequent functional validation of candidate PtHSP70 genes in breeding for stress tolerance.
-
This study presents a comprehensive genome-wide characterization of the HSP70 gene family in the medicinal herb P. ternata, identifying 21 PtHSP70 genes that exhibit conserved structural features and diverse subcellular localizations. Evolutionary analyses revealed that these genes are predominantly under purifying selection and share strong synteny with related monocots. Expression profiling demonstrated that most PtHSP70 members are significantly responsive to abiotic and hormone stresses: They are upregulated under both heat (35 °C) and cold (8 °C) conditions, and display different response patterns to ABA and MeJA treatment. Additionally, several genes showed tissue-preferential expression, suggesting functional diversification. These findings not only enhance our understanding of the molecular mechanisms underlying stress adaptation in P. ternata but also provide valuable candidate genes for future functional validation and molecular breeding aimed at improving stress tolerance in this important medicinal plant.
-
The authors confirm their contributions to the paper as follows: designed the research: Huang W, Sun X; performed the experiments: Li S, He Y; performed the data analysis and interpretation: Li S, Wang N, Cai X; prepared the figures and tables: Wang N, He Y, Wang X; wrote the manuscript: Liu Y. All authors reviewed the results and approved the final version of the manuscript.
-
The datasets generated during and/or analyzed in the current study are available from the corresponding author on reasonable request.
-
This work was supported by the National Natural Science Foundation of China (Grant No. 81703652), the National Natural Science Foundation of China (Grant No. 81703656), the National TCM Resources Survey Project (Grant [2018] No. 43), the Natural Science Foundation Project of Shaanxi Province (Grant No. 2023-JC-YB-722), Shaanxi Province Traditional Chinese Medicine Research Project (Grant No. 2021-GJ-JC001).
-
The authors declare that they have no conflict of interest.
-
accompanies this paper online at https://doi.org/10.48130/mpb-0026-0007.
-
# Authors contributed equally: Yajun Liu, Xinghang Cai
- Supplementary Table S1 Specific primer sequences of HSP70 genes and the 18S reference gene in P. ternata used in this study.
- Supplementary Table S2 Physicochemical properties of HSP70 genes in P. ternata.
- Supplementary Table S3 Secondary structure and phosphorylation site prediction of HSP70 in P. ternata.
- Supplementary Table S4 The Ka/Ks values of the paralogous gene pairs in P. ternata.
- Supplementary Table S5 RSCU Codon values and high frequency used codons in the HSP70 gene family genome of P. ternata.
- Supplementary Table S6 Comparative RSCU analysis of genes with high and low expression in the HSP70 gene family genome of P. ternata.
- Supplementary Fig. S1 Effect of cold and heat stress on physiological parameters of P. ternata.
- Copyright: © 2026 by the author(s). Published by Maximum Academic Press, Fayetteville, GA. This article is an open access article distributed under Creative Commons Attribution License (CC BY 4.0), visit https://creativecommons.org/licenses/by/4.0/.
-
About this article
Cite this article
Liu Y, Cai X, Li S, Wang X, He Y, et al. 2026. Genome-wide identification and stress-responsive expression profiling of the HSP70 gene family in Pinellia ternata. Medicinal Plant Biology 5: e013 doi: 10.48130/mpb-0026-0007 

Genome-wide identification and stress-responsive expression profiling of the HSP70 gene family in Pinellia ternata
- Received: 24 November 2025
- Revised: 13 February 2026
- Accepted: 25 March 2026
- Published online: 31 May 2026
Abstract: Heat shock protein 70 (HSP70) plays crucial roles in plants' responses to abiotic stresses. In this study, we performed a genome-wide identification and comprehensive characterization of the HSP70 gene family in the medicinal herb Pinellia ternata. In total, 21 PtHSP70 genes were identified and classified into distinct subfamilies via phylogenetic analysis. Structural and motif analyses revealed conserved domain architectures, whereas promoter examination indicated the enrichment of stress- and hormone-responsive cis-elements. Ka/Ks and collinearity analyses indicated that the PtHSP70 genes have primarily evolved under purifying selection and share extensive synteny with orthologs in related monocot species. Expression profiling revealed that most PtHSP70 genes were significantly upregulated in response to both heat (35 °C) and cold (8 °C) stress. The result of tissue-specific expression showed most PtHSP70 genes were highly expressed in the tubers. PtHSP70 genes responded differentially to methyl jasmonate (MeJA) and abscisic acid (ABA) treatments, with five PtHSP70 genes being significantly upregulated by both ABA and MeJA. Our findings provide a foundation for further functional studies of PtHSP70 genes in abiotic stress tolerance and offer valuable insights for molecular improvement of P. ternata.
-
Key words:
- Pinellia ternata /
- Heat shock protein 70 /
- Codon usage bias /
- Expression patterns