


-
Composting, an organic solid waste management strategy inherited from agricultural history, has garnered significant attention due to its substantial potential in recycling resources and environmental protection[1,2]. During composting, organic waste is transformed into sanitized, stable, and nutrient-rich humus through microbial metabolism under suitable humidity, temperature, and aeration[3,4]. However, greenhouse gases (GHGs), including carbon dioxide (CO2), methane (CH4), and nitrous oxide (N2O), and reactive nitrogen (Nr) gases such as ammonia (NH3) and N2O will also be emitted during the composting process[5−7]. These gas emissions are inevitable products of carbon and nitrogen's transformation during composting. CO2 is mainly released by aerobic metabolism, while CH4 is more easily generated by methanogenic bacteria under anaerobic conditions[8,9]. NH3 produced by the conversion of ammonium (NH4+) will volatilize rapidly and exacerbate nitrogen losses[10,11]. N2O is primarily produced by autotrophic nitrification, heterotrophic nitrification, and bacterial and fungal denitrification[12−14]. These carbon and nitrogen losses as gas emissions further decrease product quality and amplify the environmental risks[1,15].
Practices for optimizing the composting conditions (e.g., the C/N ratio, moisture content, pH), supplying auxiliary measures (e.g., films and electromagnetic fields), or adding exogenous materials (e.g., biochar, zeolite, and bentonite) have been employed to mitigate GHGs and NH3 emissions during composting[9,16−19]. Among these technologies, biochar amendment is regarded as a promising avenue due to its exceptional physicochemical properties, such as high surface area, porous structure, and abundant surface functional groups[20−24]. It has been proved that biochar may mitigate gas emissions by regulating the microbial community and adsorbing gas on its surface[25−27]. Specifically, biochar possesses a large surface area anda porous structure that optimizes the distribution of oxygen, enhances aeration, and suppresses the activity of methanogenic and denitrifying bacteria[28−30]. Biochar with abundant surface functional groups can inhibit NH3 volatilization and reduce GHG emissions via adsorption and redox reactions[30−32]. Notably, other properties of biochar (e.g., application rate, pH, and particle size) also significantly impact the efficiency of mitigation, demonstrating the multifaceted positive effects of biochar on composting processes[11,33−35].
Despite extensive research on the mitigation efficiency of biochar-amended composting, the findings still remain inconsistent or contradictory due to the isolation of many experiments. For example, some studies reported that biochar increased CO2 emissions by approximately 20%–80% compared with the control[22, 36,37]. This phenomenon can be attributed to the more appropriate habitat provided by biochar, which enhanced the degradation of organic matter during composting[38,39]. In contrast, biochar may reduce CO2 emissions through the adsorption of CO2 and the sequestration of exogenous organic matter[40]. So what is the overall effect of biochar amendment on CO2 emissions, and what is the key mechanism? Similarly, a high biochar application rate (> 8%) was reported to minimize CH4 emissions because biochar can avoid anaerobic pockets and facilitate the diffusion of oxygen[41]. However, a 5.0% application rate of biochar may be the optimal dosage, although a high biochar application rate (20%) increased the formation of compost aggregates and enhanced the anaerobic zone[29]. The mitigating effect of biochar on N2O emissions is also controversial. Biochar can reduce N2O emissions by enhancing the expression of the nosZ gene but also may increase N2O emissions by promoting the nitrification process[42,43]. These results indicate that the mitigation efficiency, influencing factors, and key mechanisms of biochar are still not clear. Therefore, a more comprehensive analysis of these issues is necessary to achieve the optimization of gas abatement in composting.
Here, a meta-analysis including 123 studies (Supplementary File 1) was conducted to evaluate the existing data on biochar-amended composting. The objectives of this meta-analysis were: (1) to assess the overall impacts of biochar on compost's properties and gas emissions; (2) to identify the dominant factors mitigating CO2, CH4, N2O, and NH3 emissions; and (3) to explore the optimal strategies for minimizing gas emissions. The results can offer practical strategies to decrease the gas emissions and environmental risk of composting.
-
As illustrated in Supplementary Fig. S1, peer-reviewed literature was systematically retrieved from two authoritative databases: Web of Science (WoS) and the China National Knowledge Infrastructure (CNKI) (2000–2024). The search combined gas terms (CO2, CH4, N2O, NH3, and GHGs) with composting terms (compost, biochar) to identify studies on composting systems. Following the initial retrieval, we deduplicated and screened articles for relevance to our study objectives. The eligibility criteria required: (1) a biochar vs. control comparison, (2) no co-additives, (3) ≥ 1 target gas emission reported, and (4) valid measurement methods. This identified 123 studies (WOS: 120; CNKI: 3) with 251 paired comparison and 1,184 observations (Supplementary File 1). The global distribution of the selected studies is presented in Fig. 1.
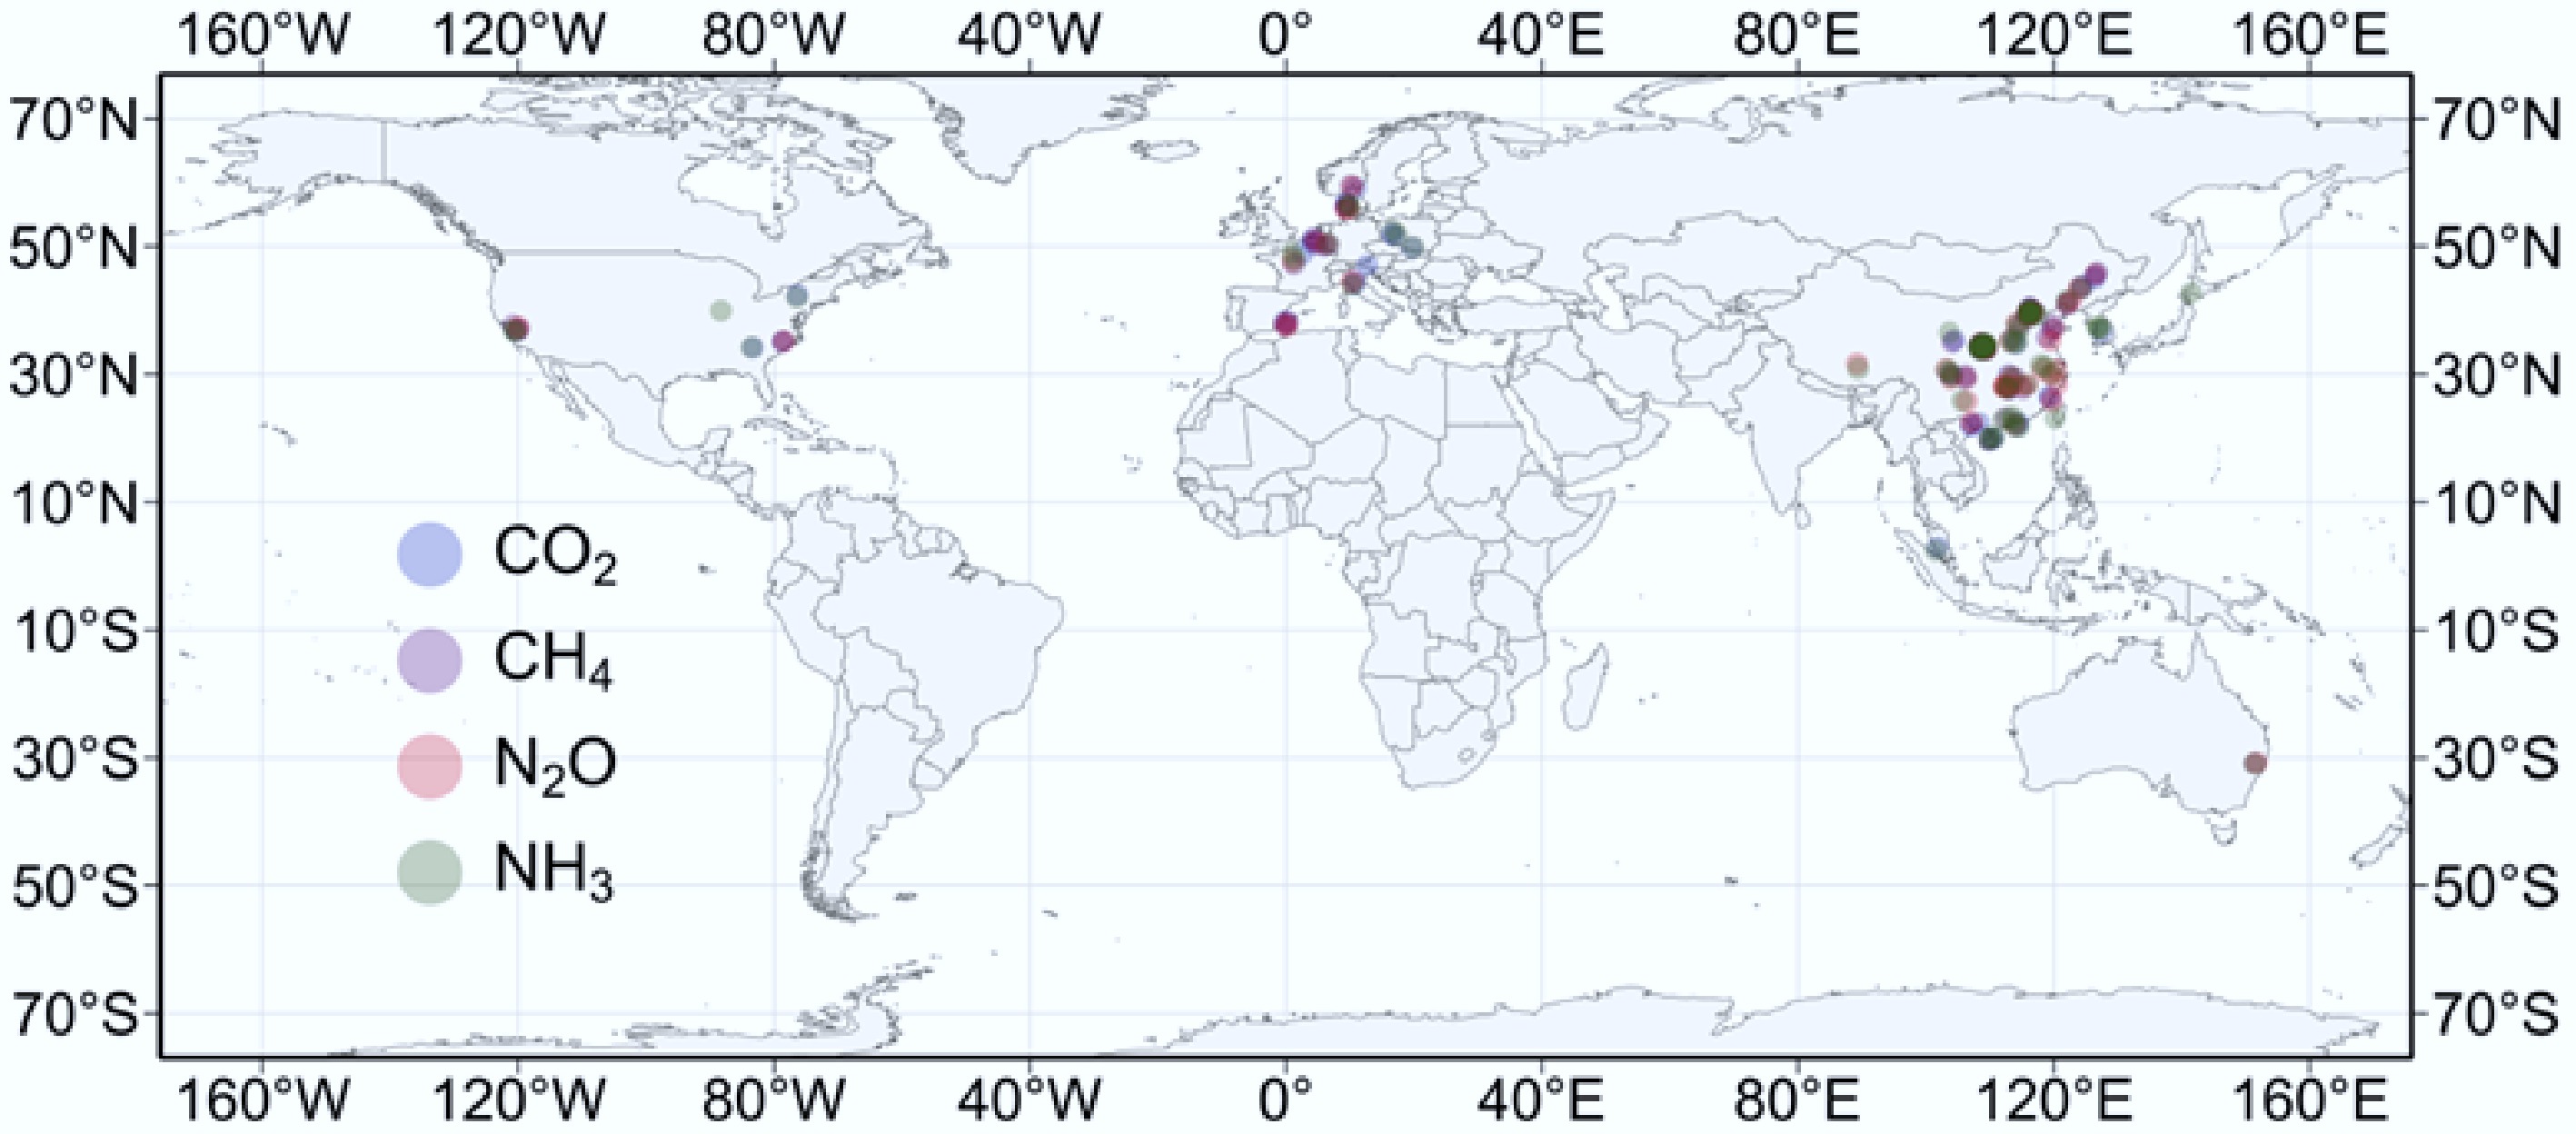
Figure 1.
Global distribution of qualifying studies.
Data extraction and classification
-
Emission data were extracted from tables and figures in the selected studies. Graphic data were extracted via an online website (
https://automeris.io ). Cumulative emission data on CO2, CH4, N2O, and NH3 were extracted and expressed as a percentage (%) of the initial total C or N[10]. When cumulative emissions were not reported, we calculated them by summing the extracted flux measurements. For studies without standard deviations (SDs), these were calculated from the standard error (SE) by using the formula$ SD = SE \times \sqrt {\text{n}} $ We compiled comprehensive datasets of biochar properties (BC), namely total carbon (TC), total nitrogen (TN), carbon:nitrogen ratio (C/N), moisture content (MC), pH, electric conductivity (EC), specific surface area (SSA), particle size (PS), feedstock type (FT), and application rate (AR), and composting characteristics (CP), such as C/N, MC, initial pH, EC, reactor volume (RV), ventilation instrument (VI), and FT. The ammonium (NH4+) and nitrate (NO3−) contents of compost were calculated as average values because of their dynamic changes during composting. The pH, total carbon loss (TCloss), total nitrogen loss (TNloss), and total organic carbon loss (TOCloss) were extracted from the final stage of the composting process. All variables are listed in Table 1.
Table 1. The abbreviations and units of all variables in biochar-amended composting systems
Category Variable Abbreviation Unit Biochar properties Total carbon TCBC g/kg Total nitrogen TNBC g/kg Carbon: nitrogen ratio C/NBC − Moisture content MCBC %, w/w pH pHBC − Electric conductivity ECBC mS/cm Specific surface area SSABC m2/g Particle size PSBC mm Feedstock type FTBC − Application rate AR %, w/w
(dry weight)Composting conditions Carbon:nitrogen ratio C/NCP − Moisture content MCCP %, w/w Initial pH pHCP − Electric conductivity ECCP mS/cm Reactor volume RVCP m3 Ventilation instrument VICP − Feedstock type FTCP − Compost properties Average ammonium NH4+ g/kg Average nitrate NO3- g/kg Final pH pH − Total carbon loss TCloss % Total nitrogen loss TNloss % Total organic carbon loss TOCloss % Data analysis
-
The natural logarithm response ratio (RR) method was used to quantitatively analyze the CO2, CH4, N2O, and NH3 gas emissions. The RR was calculated as follows:
$ RR = \ln ({\bar X_t}/{\bar X_c}) = \ln {\bar X_t} - \ln {\bar X_c} $ (1) where,
$ {\bar X_t} $ $ {\bar X_c} $ $ (\overline {RR} ) $ $ v = \dfrac{{{S_t}^2}}{{{N_t}^2{{\bar X}_t}^2}} + \dfrac{{{S_c}^2}}{{{N_c}^2{{\bar X}_c}^2}} $ (2) $ {{\text{w}}_{\text{i}}} = \dfrac{1}{{{v_i}}} $ (3) $ \overline {RR} = \dfrac{{\displaystyle\sum\limits_{i = 1}^n {{w_i}R{R_i}} }}{{\displaystyle\sum\limits_{i = 1}^n {{w_i}} }} $ (4) where, St, Nt, Sc, and Nc are the standard deviation and sample size for the biochar treatment and control, respectively; wi and n are the weighting factor and the number of observations, respectively. To facilitate expression, RR was transformed and expressed as a percentage change:
$ \text{%}Change=(e^{\ln RR}-1)\times100 $ (5) Relative to the control, negative values indicate that the biochar treatment reduced the measured parameters, while positive values denote increases. A 95.0% confidence interval (CI) excluding zero implies statistical significance.
Since some studies contributed multiple repeated effect sizes, we fitted a hierarchical random-effects model using the rma.mv() function from the "metafor" R package. To account for within-study dependence, we included the reference number (Rf) of each study as a moderating factor in the model[45]. To assess the heterogeneity across categorical variable groups, we decomposed the total heterogeneity (QT) into between-group (QM) and within-group (QE) components. A significant between-group heterogeneity (QM, p < 0.05) indicated meaningful differences among subgroups. We computed QM and its associated p-value for each subgroup category (Supplementary Table S1). A subgroup was deemed to be meaningful if it exhibited significant heterogeneity in at least one of the four gas metrics: CO2, CH4, N2O, and NH3[46]. For robustness, we compared the fail-safe N with the threshold of 5n + 10 (n = number of cases) whenever Kendall’s Tau or Spearman's correlations were statistically significant (Supplementary Table S2). To further investigate the combined effect of the application rate (AR) and composting conditions on the mitigation effects of biochar, a sub-meta-analysis was performed. Finally, we conducted linear regression analyses using the "ggplot2" package in R.
Additionally, other compost properties, including NH4+, NO3−, pH, TCloss, TNloss, and TOCloss were analyzed in this meta-analysis. However, becasue of insufficient reporting of the SD or SE values in many studies, the RR and
$ \overline {{\text{RR}}} $ Random Forest models were conducted by using the "randomForest" R package to evaluate the relative importance of explanatory factors in RRCO2, RRCH4, RRN2O, and RRNH3. The "mice" R package was used to impute missing values, with the resulting dataset restricted to Random Forest analysis and subsequent partial least squares path modeling (PLS-PM)[47,48]. We restricted data imputation to biochar properties and composting conditions, as the variables within each category exhibited strong internal correlations[3, 49].
Using the "plspm" R package, we implemented PLS-PM to determine the primary mechanisms by which biochar mitigates CO2, CH4, N2O, and NH3 emissions. Only variables demonstrating significant importance in the Random Forest models were included in the PLS-PM analysis. For improved variable interpretation, data standardization was carried out prior to principal component analysis (PCA). PLS-PM performance was assessed through the goodness-of-fit (GOF) index and the R2 values of target gas emissions.
-
Biochar amendment significantly reduced the NH4+ content of compost by 17.4% (95% CI: −22.4% to −12.1%, p < 0.001), with the mean NH4+ concentration decreasing from 1.94 to 1.59 g/kg (Fig. 2). Biochar amendment significantly increased the NO3− content of compost by 17.2% (95% CI: 5.4%–30.3%, p < 0.01), with the mean NO3− concentration rising from 0.37 to 0.42 g/kg. Adding biochar significantly increased the final pH of compost by 4.7% (95% CI: 1.8%–7.6%, p < 0.01), which rose from 7.79 to 8.21. However, adding biochar did not significantly change the total carbon loss during composting (95% CI: −89.2% to 576.1%, p > 0.05), as the average total carbon losses between the control and treatment groups were 37.5% and 32.3%, respectively. Similarly, adding biochar did not significantly change the total organic carbon loss during composting (95% CI: −11.6% to 24.7%, p > 0.05); the average total organic carbon losses between control and treatment groups were 17.8% and 20.8%, respectively. In contrast, biochar application reduced the total nitrogen loss by 41.3% (95% CI: −53.0% to −26.8%, p < 0.001), reducing the mean losses from 27.8% to 20.4%.
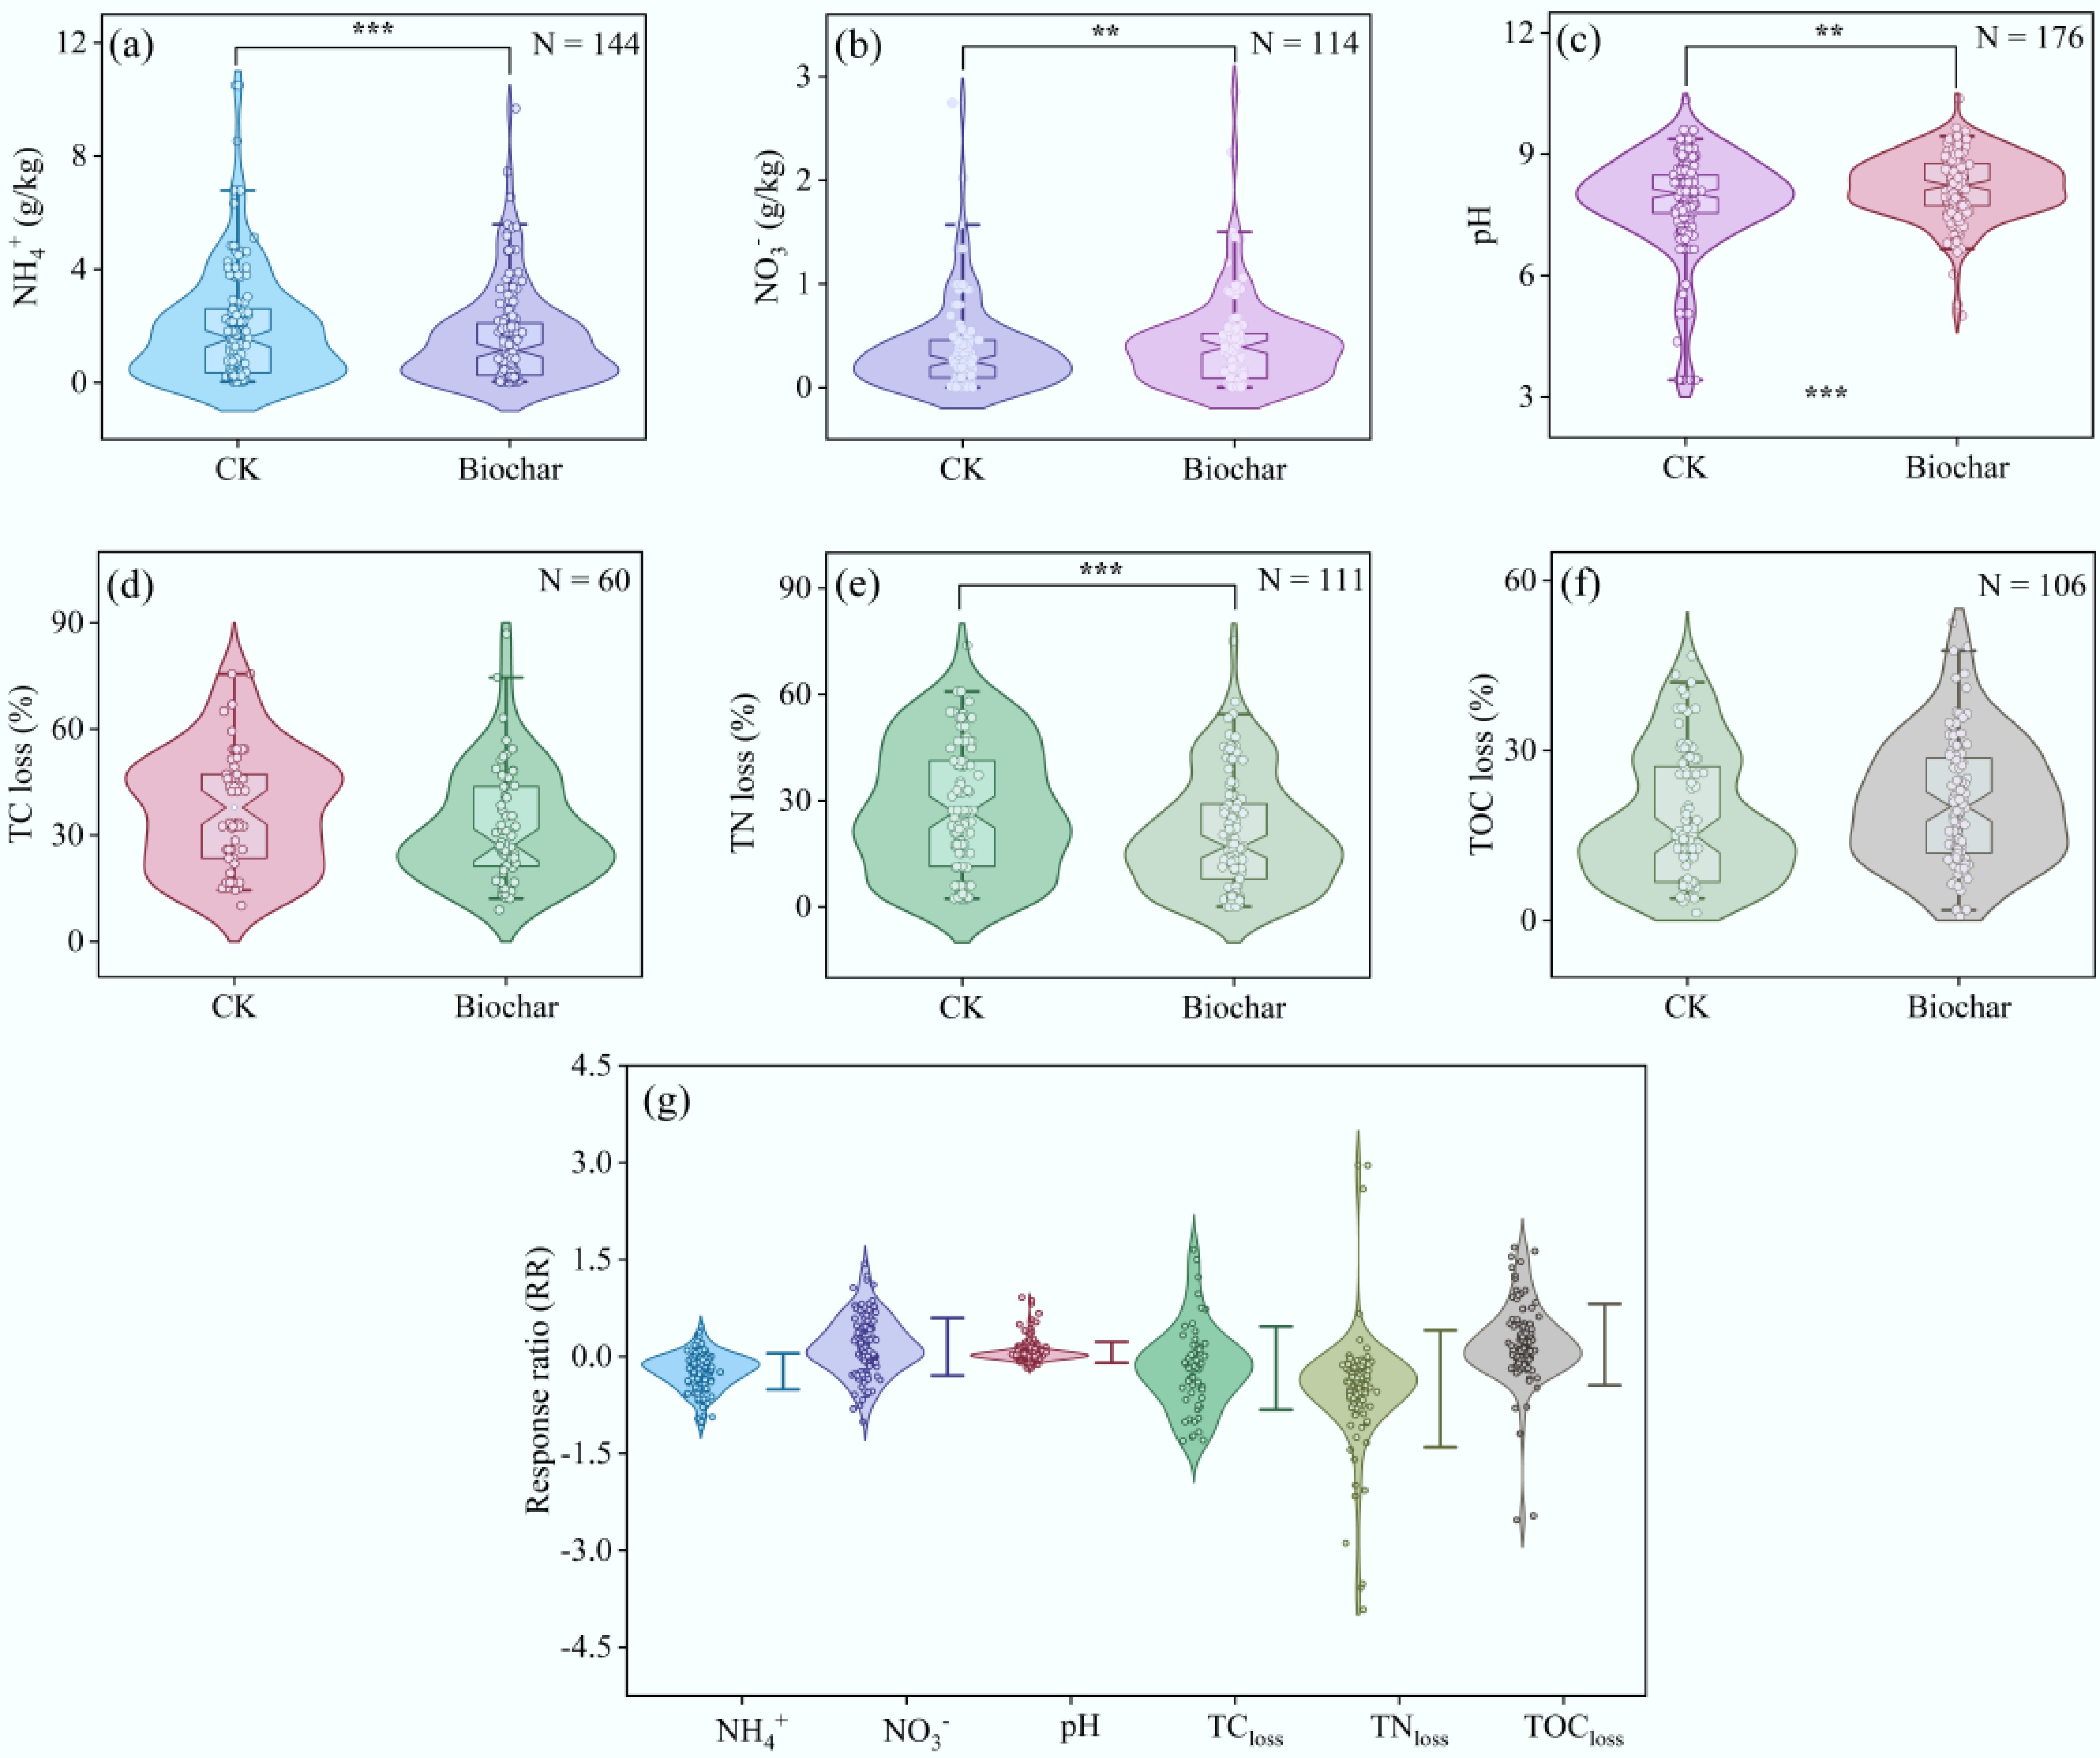
Figure 2.
Violin plots of NH4+, NO3−, pH, TC loss, TN loss, and TOC loss in the control (CK) and biochar-amended composting systems (a)–(g). N denotes the number of paired samples, with asterisks indicating the statistical significance levels (* p < 0.05, ** p < 0.01, and *** p < 0.001). The response ratios (RR) of NH4+, NO3−, pH, TC loss, TN loss, and TOC loss are shown in (f). The color-coded point markers on the right represent the mean RR values, with the error bars indicating standard deviations.
The effects of biochar amendment on gas emissions during composting
-
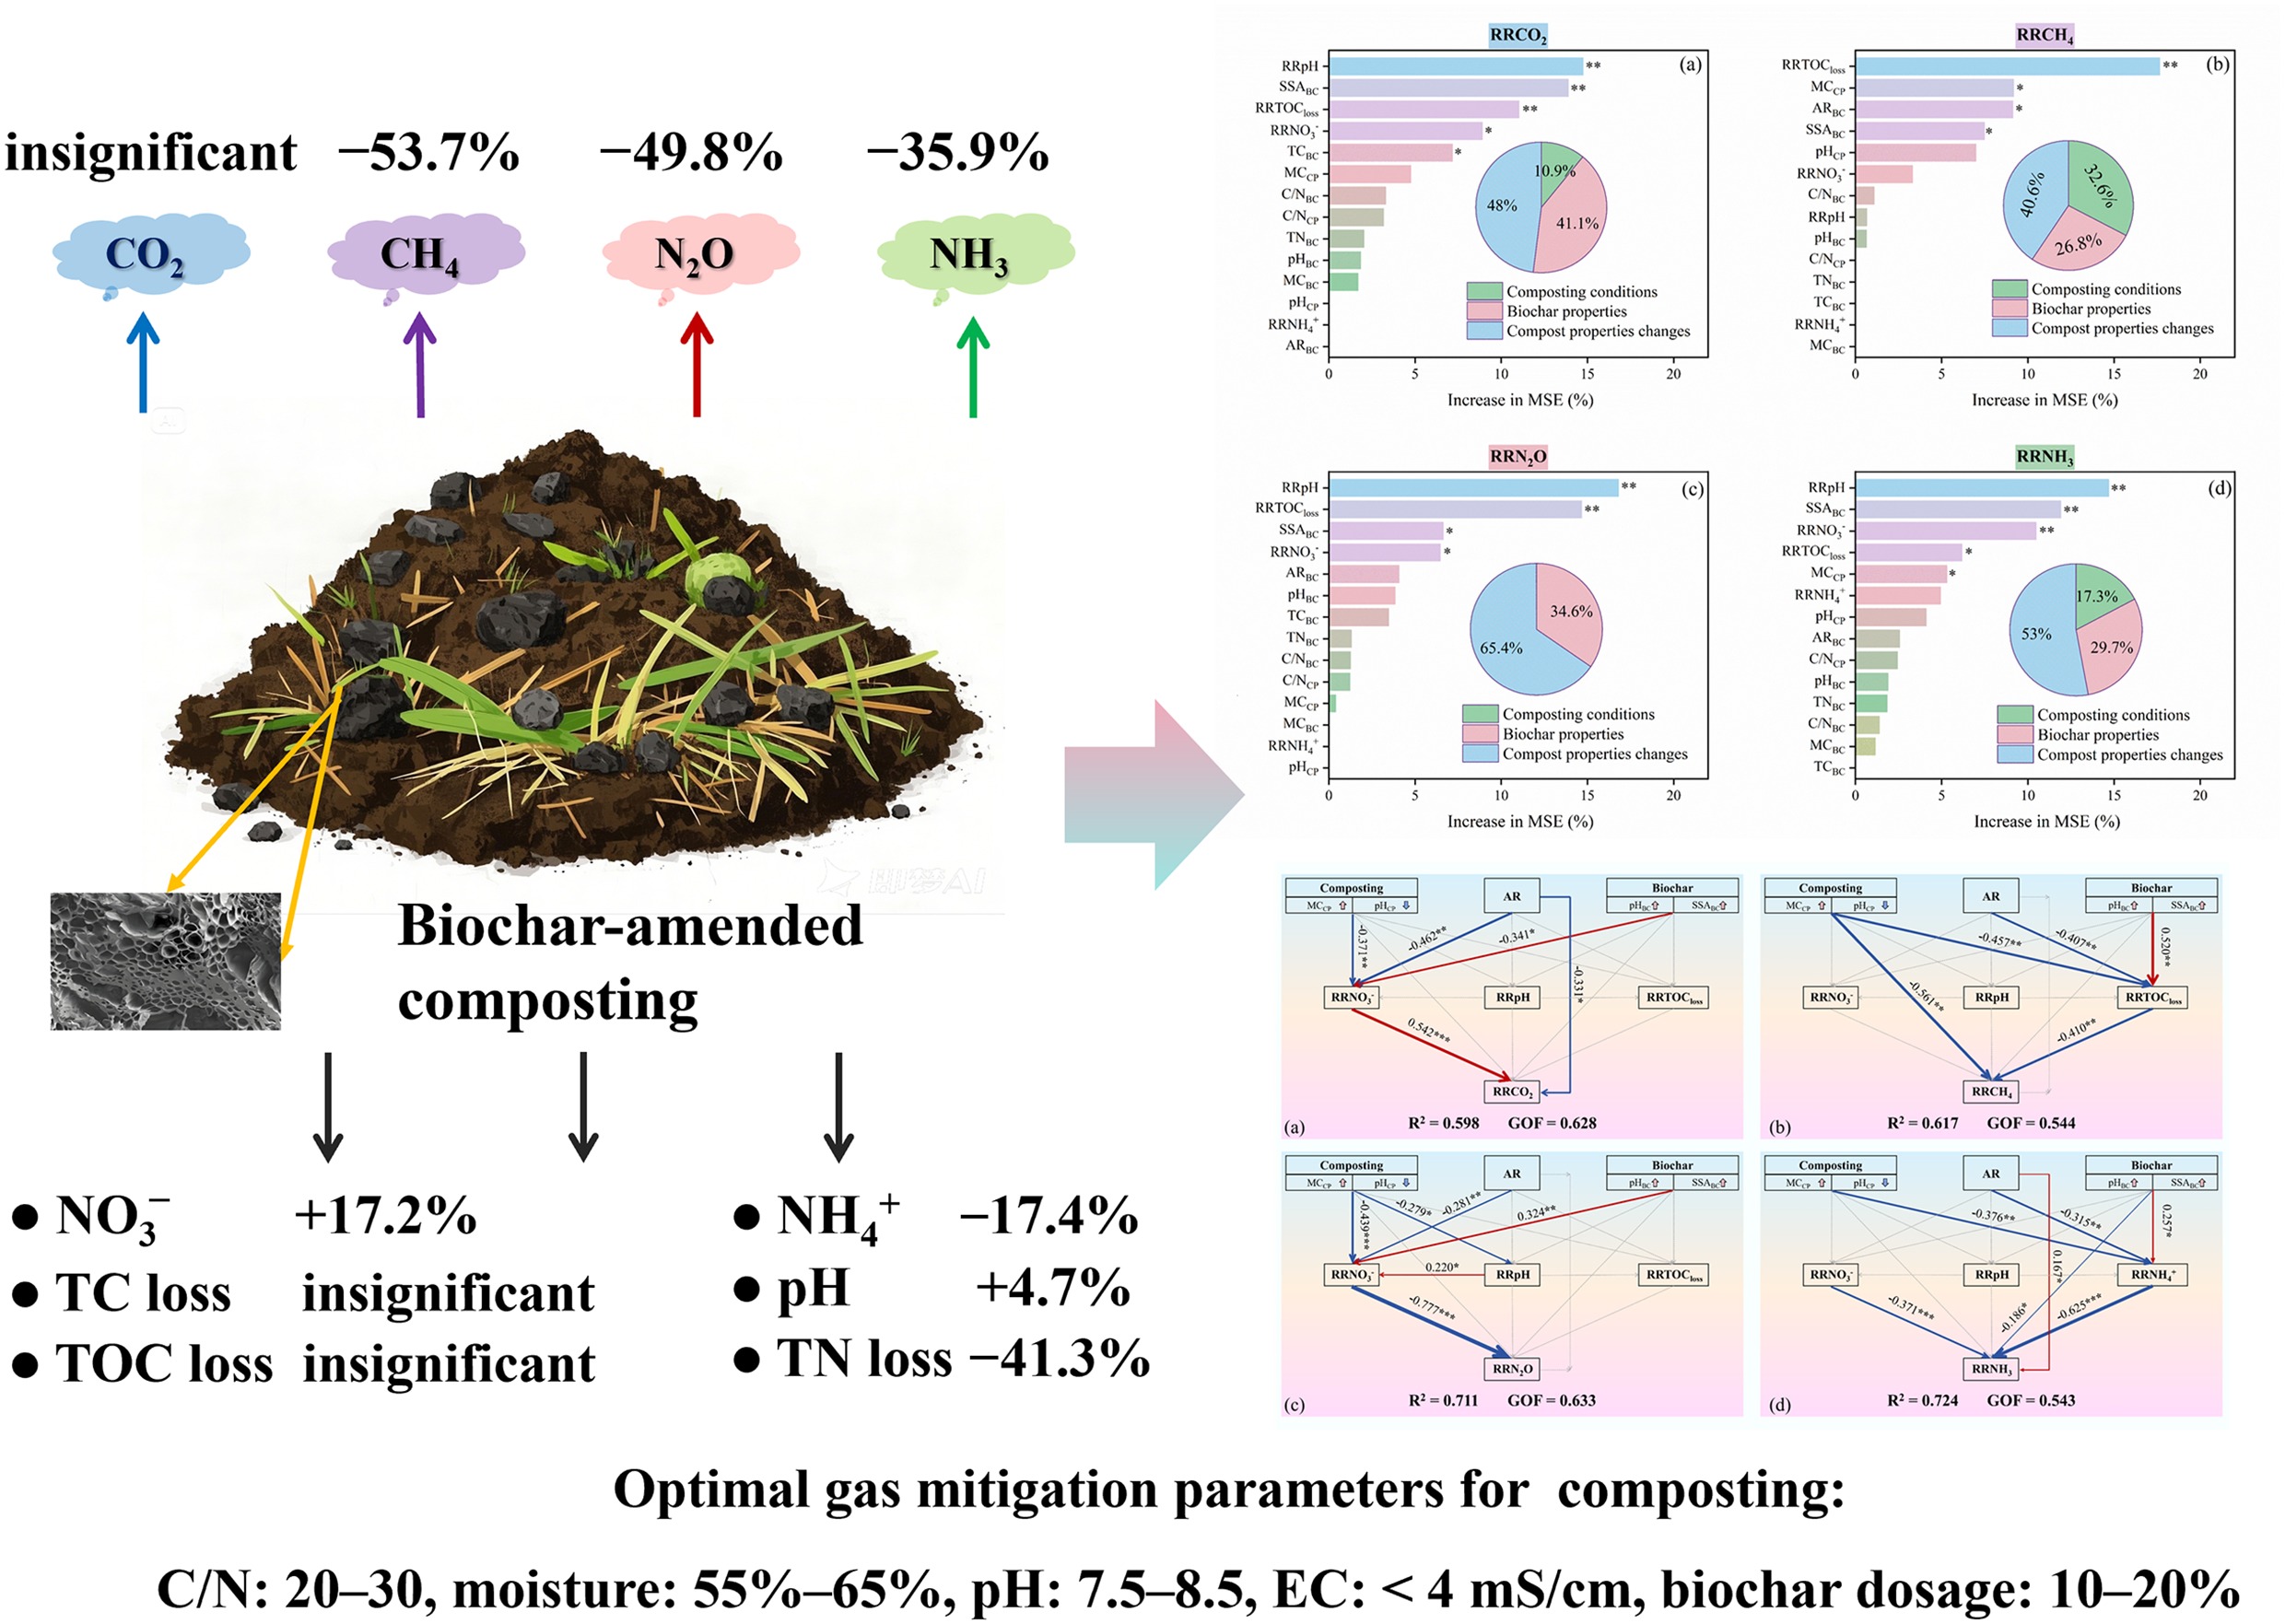
Overall, biochar amendment significantly reduced emissions of CH4 (53.7%), N2O (49.8%), and NH3 (35.9%), while CO2 emissions showed a marginal increase (4.9%) that was statistically nonsignificant (Fig. 3). Biochar ARs significantly and differentially influenced gas emissions. CO2 emissions increased significantly (20.7%) at moderate ARs (5.0%–10.0%, w/w), while both higher (> 10.0% w/w) and lower (< 5.0% w/w) application rates showed no significant effects. For CH4 emissions, the greatest reduction (−86.1%) occurred at ARs greater than 10.0% (w/w), demonstrating substantially greater mitigation than lower application rates. N2O emissions displayed contrasting responses: AR < 5.0% (w/w) significantly increased emissions (51.4%), whereas AR > 10.0% (w/w) strongly suppressed them (−93.7%). Moderate application rates (5.0%–10.0% w/w) had no significant impact on N2O emissions. NH3 emissions showed maximum mitigation (−60.2%) at AR > 10.0% (w/w), significantly outperforming both the 5.0%–10.0% and < 5.0% ARs.
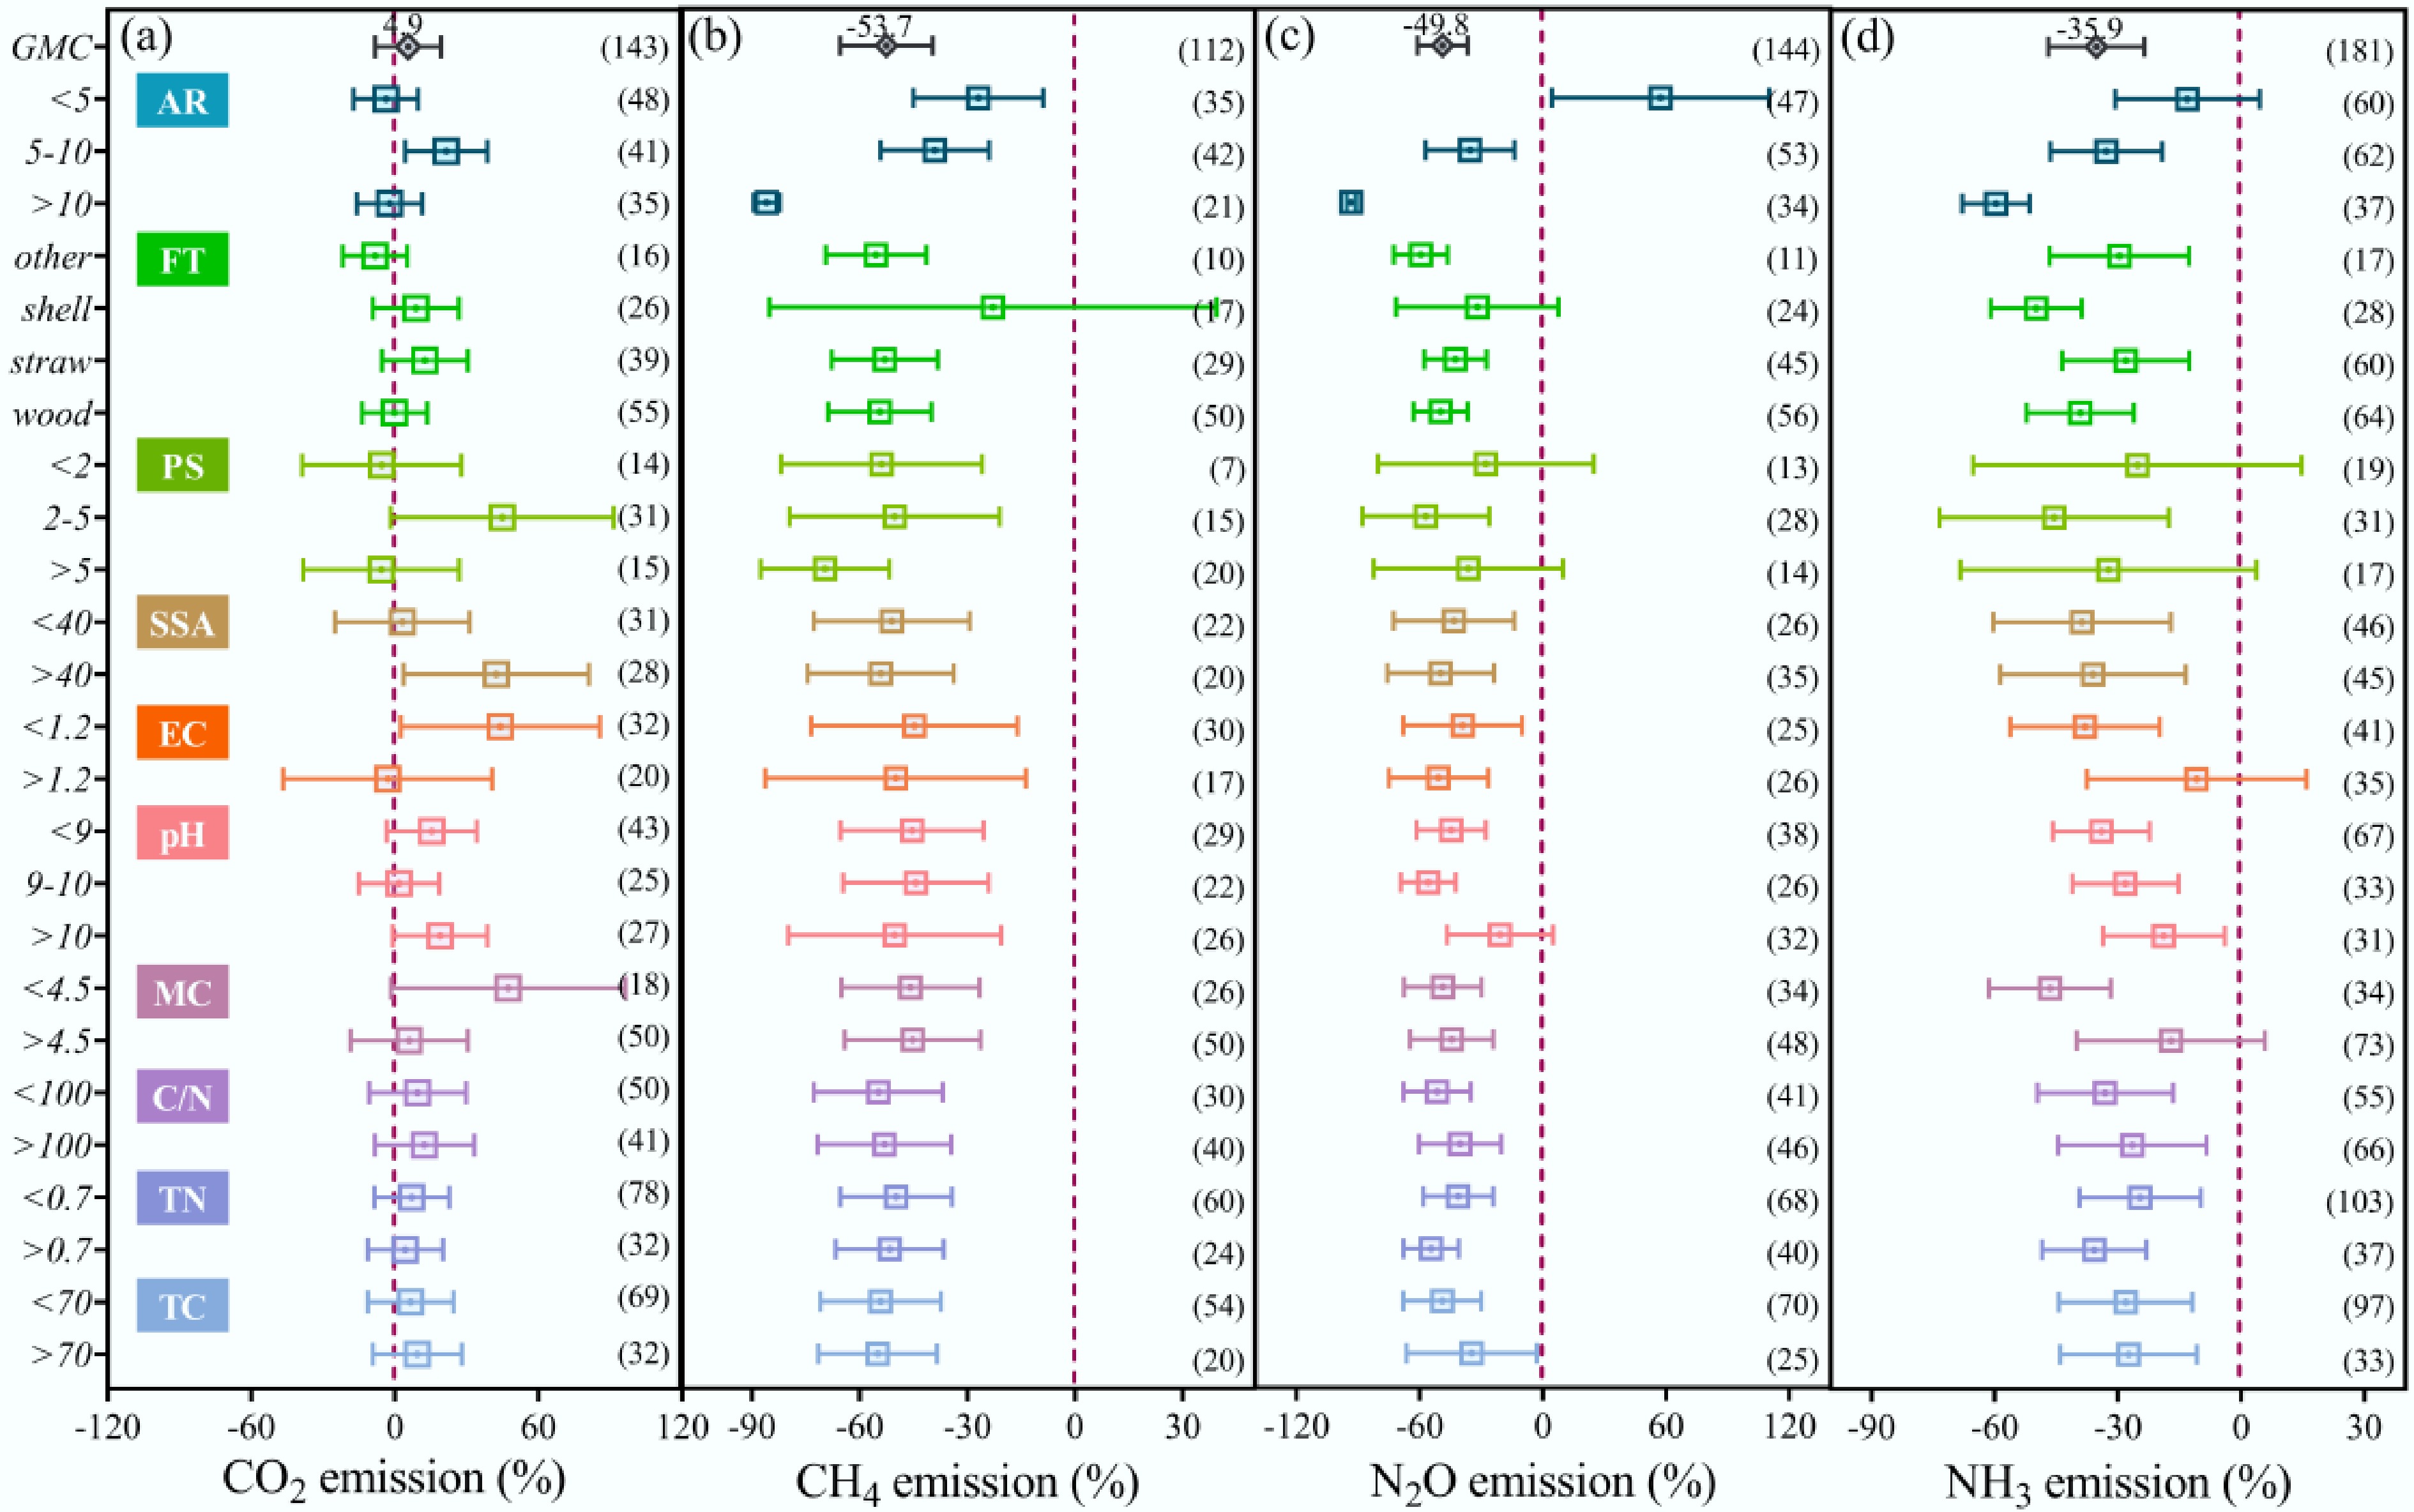
Figure 3.
Effects of biochar properties on CO2, CH4, N2O, and NH3 emissions during composting (a)–(d). The center of the small square represents the average value, and the error line represents the ± 95% CIs. The numbers in brackets represent sample sizes. TC, total carbon; TN, total nitrogen; C/N, carbon : nitrogen ratio; MC, moisture content; EC, electric conductivity; SSA, specific surface area; PS, particle size; FT, feedstock type; AR, application rate.
Apart from the biochar AR, other biochar properties differentially influenced various gas emissions. For CO2 emissions, PS, MC, EC, and SSA had significant effects, with the largest increase (41.9%) occurring at MC < 4.5%. Most biochar property groups effectively mitigated CH4 emissions (reductions of 46.8%–73.8%), except for shell as the FT. The strongest CH4 mitigation (73.8%) was observed with a PS of >5 mm, while pH 9–10 showed more moderate effects (46.8%). N2O emissions were most effectively reduced (−64.4%) by a PS of 2–5 mm. Other property groups (pH > 10, PS < 2 mm, PS > 5 mm, and shell as the FT) showed nonsignificant mitigation effects despite positive trends. For NH3, the maximum reduction (50.3%) occurred with a PS of 2–5 mm, whereas MC, EC, and PS exhibited substantial within-group variability.
Compared with the overall effects, AR > 10.0% (w/w) can simultaneously and significantly enhance the mitigation of CH4, N2O, and NH3 emissions, which indicates that the AR was the key factor in CH4, N2O, and NH3 emissions. The significant convex relationships between AR and the response ratios of CH4, N2O, and NH3 also validated this finding (Supplementary Fig. S2), Moreover, the convex relationships further imply a nonlinear dose-dependent effect, in which the mitigation effects initially increase but subsequently decrease. Despite the existence of influences from other biochar properties on gas emissions, these variables do not serve as critical determinants of emission dynamics.
The effects of composting conditions on gas emissions during composting
-
The meta-analysis revealed that composting conditions strongly influenced gas emissions (Fig. 4). For CO2 emissions, all composting conditions groups except VI and RV exhibited significant within-group variability, while C/N > 30, MC < 55.0%, pH > 8.5, EC > 4 mS/cm, and sludge as the FT markedly increased CO2 emissions by 123.2%, 62.4%, 52.4%, 99.2%, and 93.5%, respectively. For CH4 emissions, sludge as the FT had the highest mitigation effects (74.2%), whereas no significant effects were observed for EC > 4 and pH < 7.5. For N2O emissions, most groups of composting conditions demonstrated positive mitigation effects, and the mitigation efficiency ranged from 31.6% in MC 55.0%–65.0% to 78.2% in MC > 65.0%; however, pH < 7.5, EC > 4 mS/cm, RV > 200 m3, and a turner as the VI showed no significant mitigation effects. For NH3 emissions, significant emission reduction effects were observed under most composting conditions, although pH < 7.5, EC > 4 mS/cm, and RV > 200 m3 showed no significant mitigation effects. Compared with the overall effects, the CO2 emissions can be significantly enhanced by C/N > 30, MC < 55.0%, pH > 8.5, EC > 4 mS/cm, and sludge as the FT, whereas MC > 65.0% markedly decreased N2O emissions, and C/N > 30 strongly reduced NH3 emissions. The regression analysis showed that the RRCO2 was negatively correlated with MC (Supplementary Fig. S2). The RRN2O and RRNH3 exhibited convex and negative relationships with EC, respectively (Supplementary Fig. S2). Additionally, our sub-meta-analysis showed that AR exhibited different effects on RRCO2 under different levels of C/N and MC. Specifically, increasing AR could promote CO2 emissions under high C/N (>30) and low MC (<55%) (Supplementary Fig. S3). These results indicated that the C/N, MC, pH, EC, and FT of composting conditions are the primary factors affecting gas emissions in biochar-amended compost.
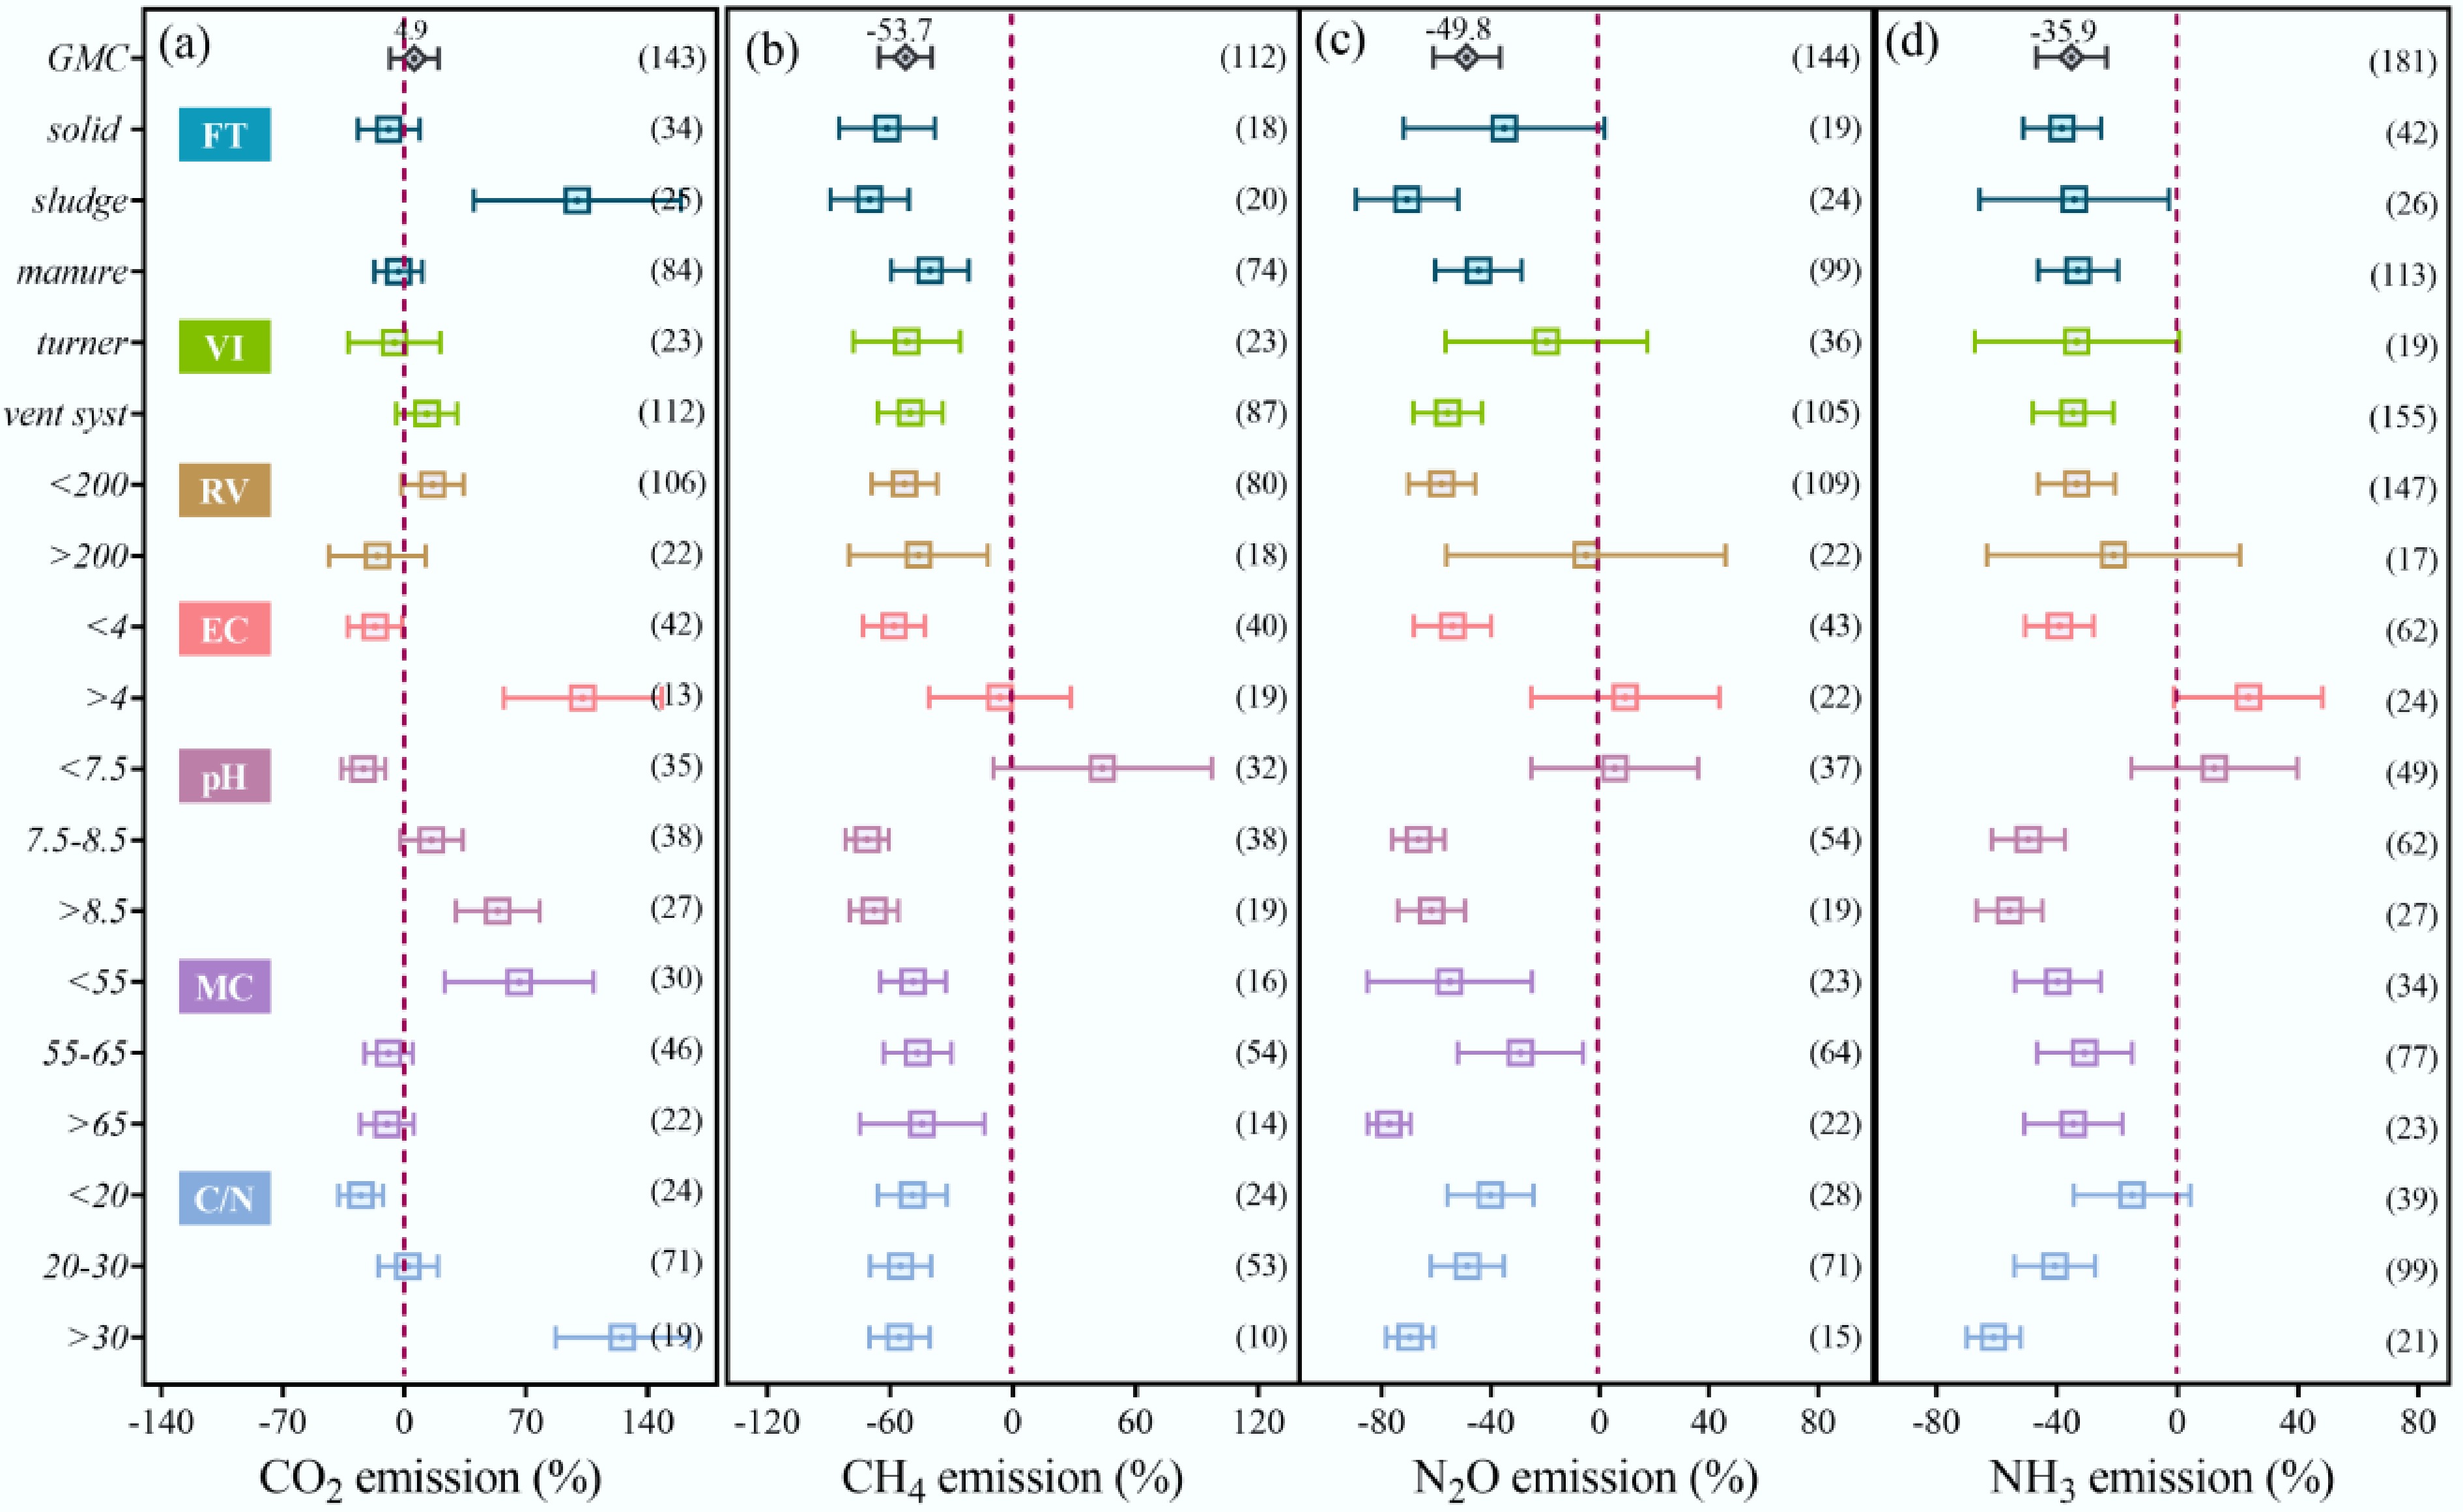
Figure 4.
Effects of composting conditions on CO2, CH4, N2O, and NH3 emissions during composting (a)–(d). The center of the small square represents the average value, and the error line represents the ± 95% CIs. The numbers in brackets represent the sample sizes. C/N, carbon : nitrogen ratio; MC, moisture content; pH, initial pH; EC, electric conductivity; RV, reactor volume; VI, ventilation instrument; FT, feedstock type.
Dominant factors driving CO2, CH4, N2O, and NH3 emissions during composting
-
Random Forest analysis was used to predict the relative importance of composting parameters to the response ratios of CO2, CH4, N2O, and NH3 emissions. The key factors associated with RRCO2 were RRpH, SSABC, MCCP, RRTOCloss, RRNO3−, and TCBC (Fig. 5). Among the three categorized drivers, changes in compost properties exhibited the strongest response to RRCO2 (48%). RRTOCloss, MCCP, ARBC, and SSABC played a more important role in RRCH4, wheeras changes in compost properties accounted for the largest proportion at 40.6%. RRpH, RRTOCloss, SSABC, and RRNO3− were the dominant factors influencing RRN2O, whereas changes in compost properties contributed the largest proportion at 65.4%. RRpH, SSABC, RRNO3−, RRTOCloss, and MCCP governed RRNH3, with the largest proportion (53%) provided by changes in compost properties.
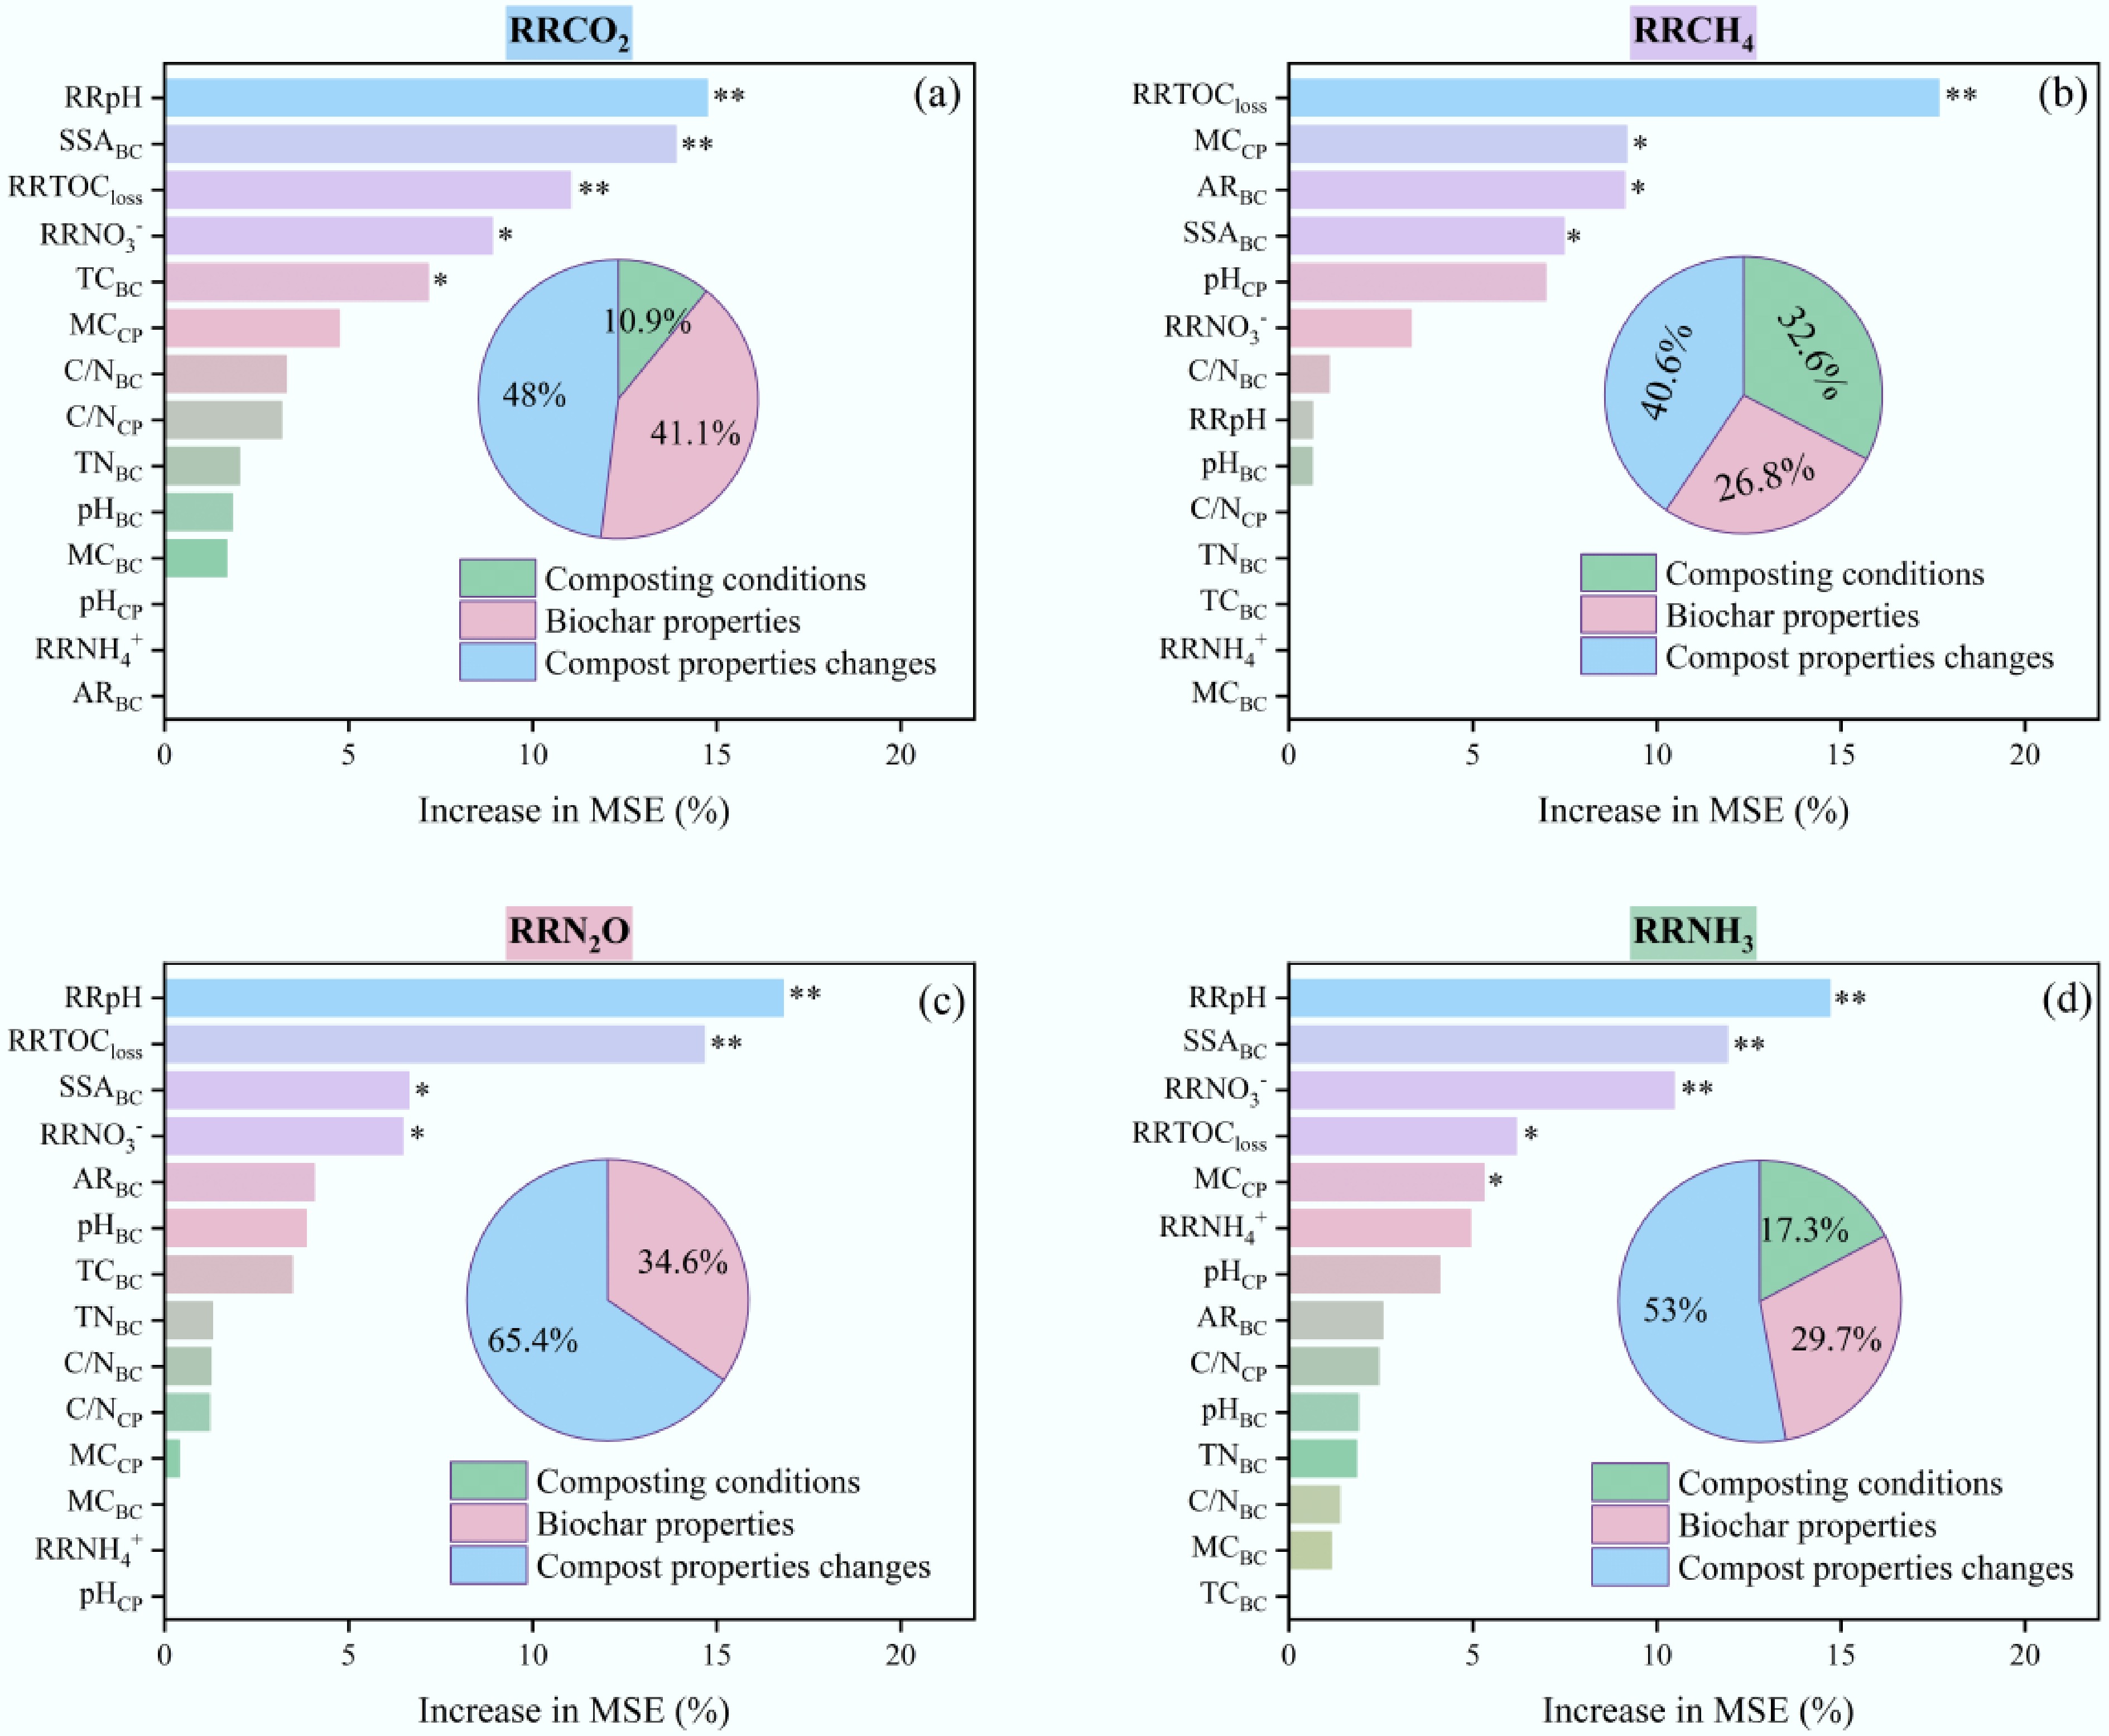
Figure 5.
Random Forest models used to rank the predictive variables of response ratios (RR) of CO2, CH4, N2O, and NH3 emissions (a)–(d). The percentage increase in the mean squared error (%IncMSE) represents the importance of the main predictors; negative values of %IncMSE are not shown. Statistical significance levels are denoted by asterisks (* p < 0.05 and ** p < 0.01). The predictive variables are categorized into three classes, namely composting conditions, biochar properties, and changes in compost properties. Composting conditions include the carbon : nitrogen ratio (C/N), moisture content (MC), and initial pH. Biochar properties include total carbon (TC), total nitrogen (TN), C/N, MC, pH, specific surface area (SSA), and application rate (AR). Changes in compost properties include the RRs of NH4+, NO3− final pH, and TOC loss.
Our PLS-PM results explained 59.8%, 61.7%, 71.1%, and 72.4% of the variance in the RR of CO2 (Fig. 6a), CH4 (Fig. 6b), N2O (Fig. 6c), and NH3 (Fig. 6d) emissions, respectively. According to PLS-PM, AR had a negative effect on RRCO2, whereas composting conditions, AR, and biochar properties all indirectly influenced emissions through RRNO3− (Fig. 6a). Composting conditions and RRTOCloss directly regulated CH4 emissions, whereas RRTOCloss is governed by composting conditions, AR, and biochar properties (Fig. 6b). Similarly, composting conditions, AR, and biochar properties indirectly influenced N2O emissions by controlling RRpH and RRNO3− (Fig. 6c). The key factors influencing NH3 emissions included AR, RRNO3−, and RRNH4+, whereas RRNH4+ predominantly governed NH3 emissions (Fig. 6d). Above all, RRNO3− was the dominant factor driving RRCO2 and RRN2O, whereas RRTOCloss and RRNH4+ were the dominant factors driving RRCH4 and RRNH3, respectively, as illustrated in the PLS-PM model (Fig. 6a−d).
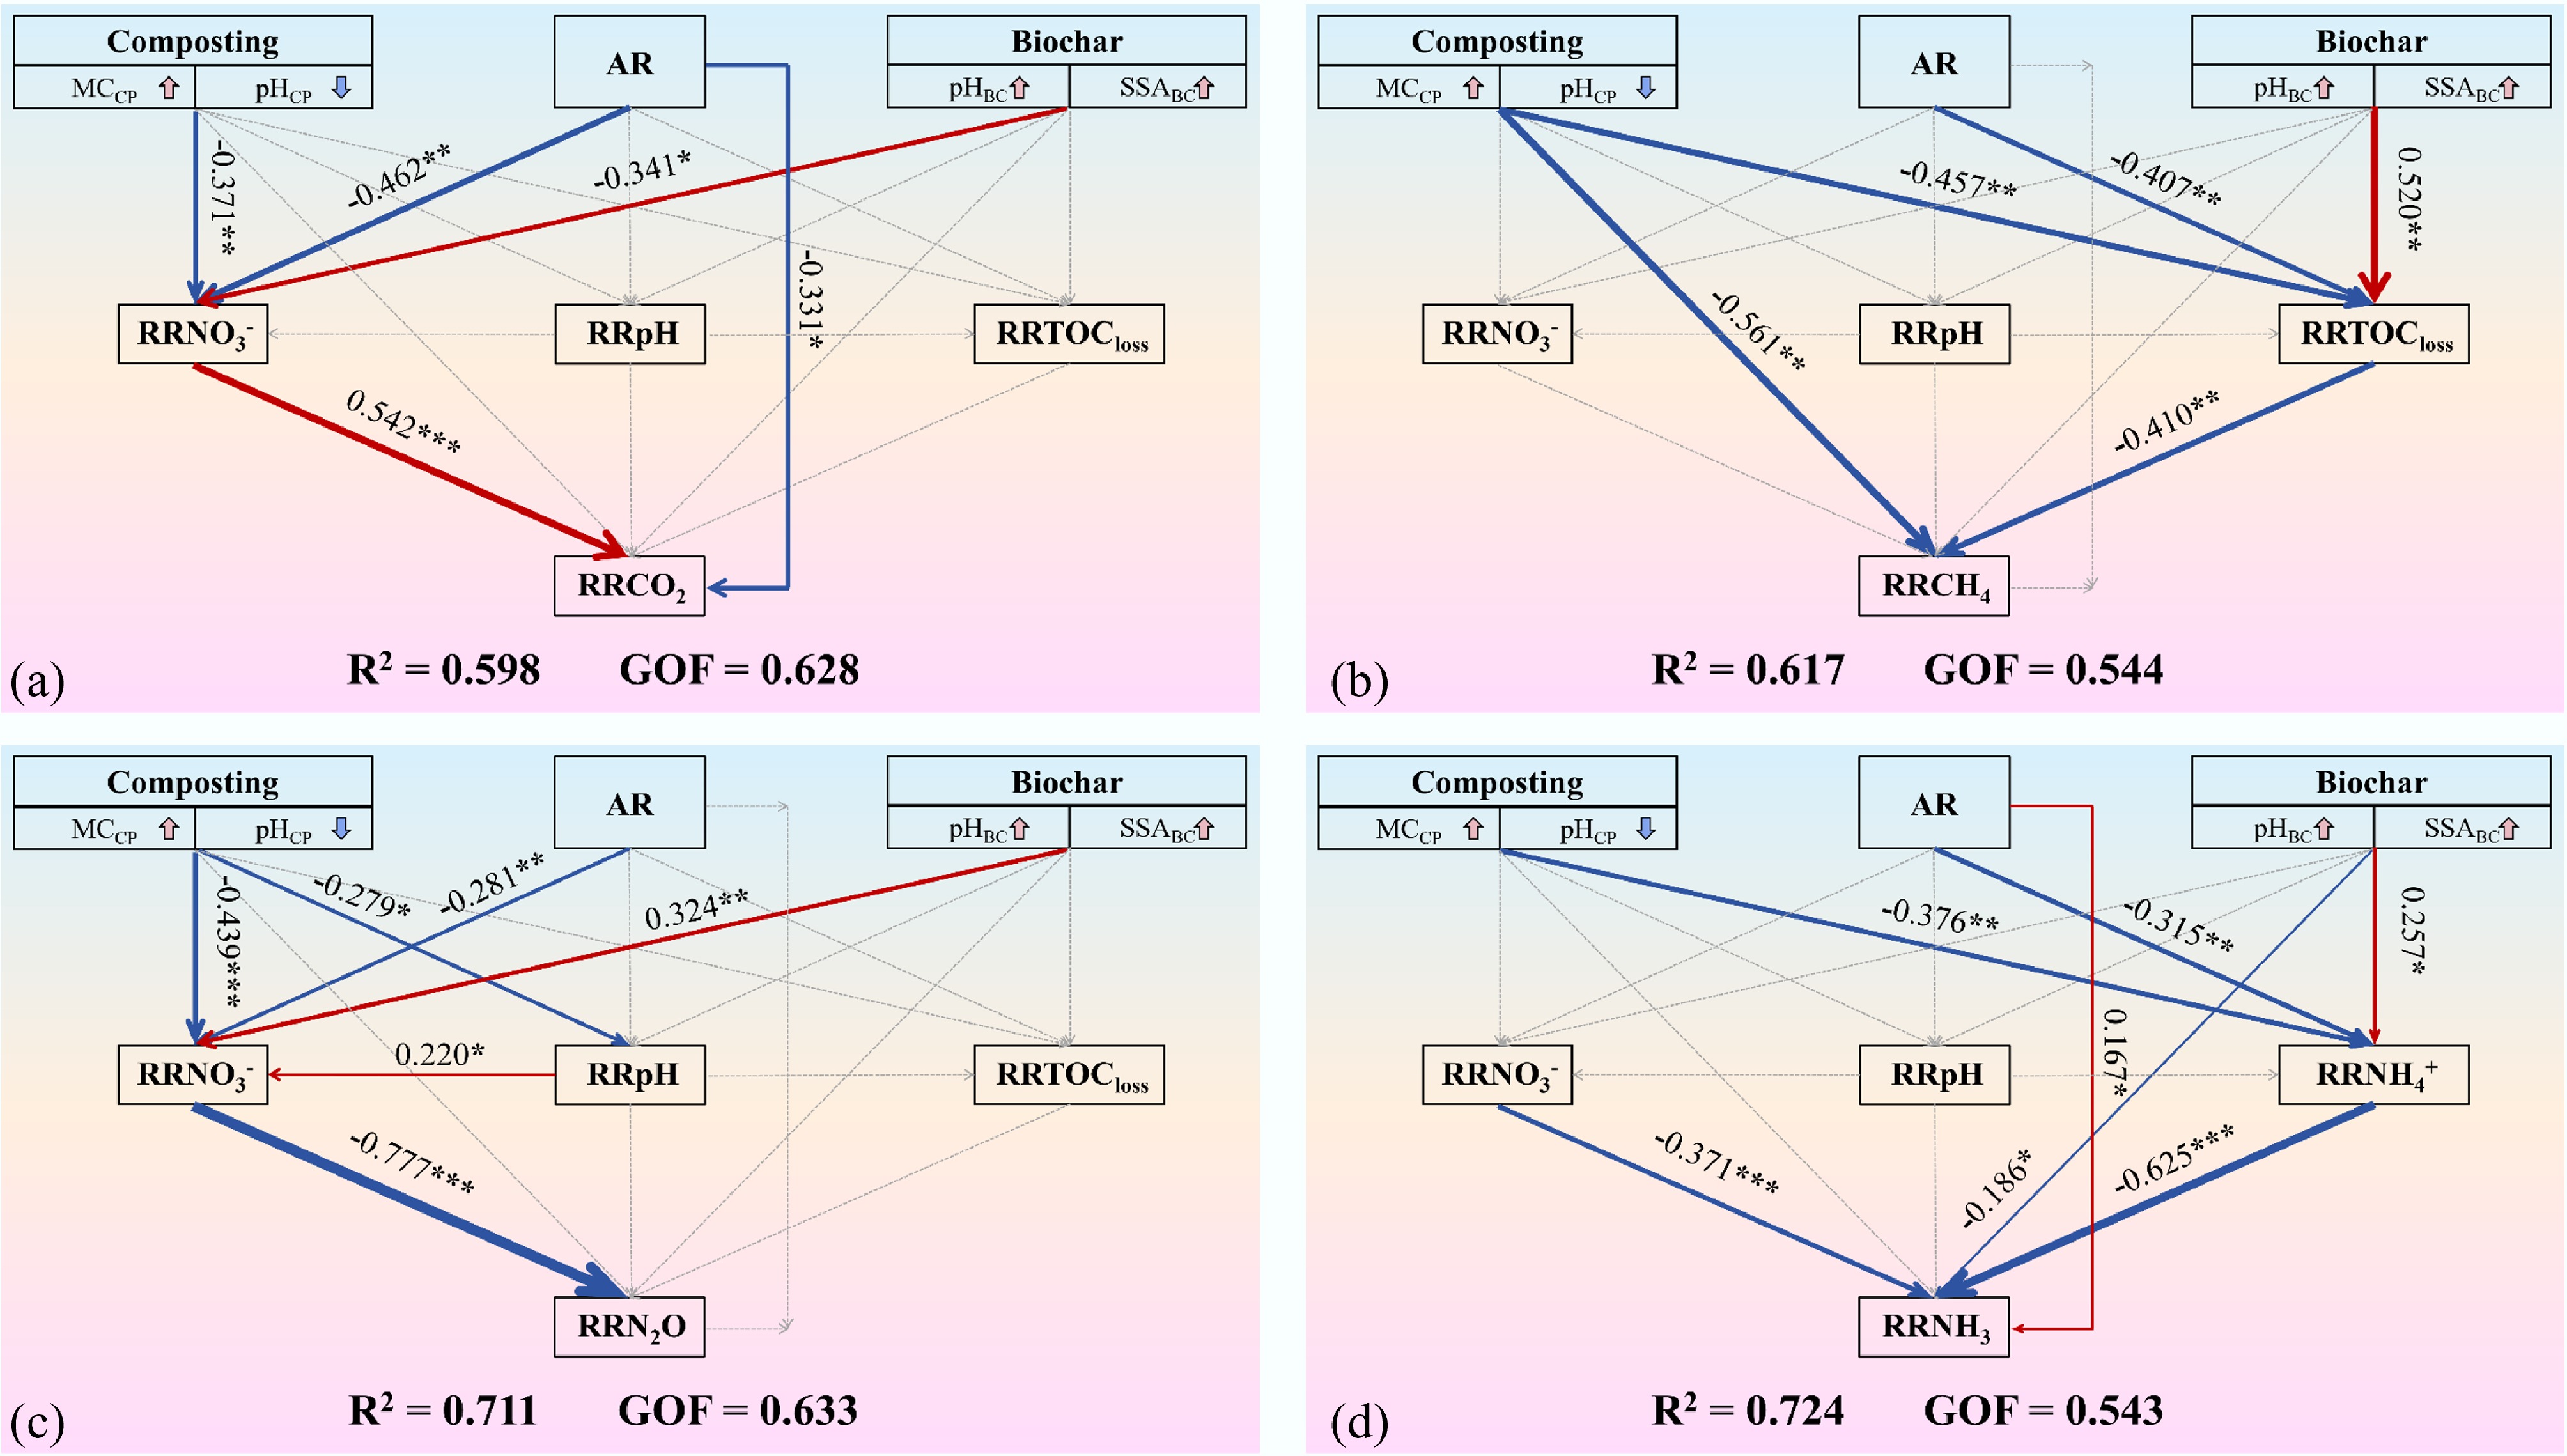
Figure 6.
Partial least squares path models (PLS-PMs) demonstrating how composting conditions (MCCP, moisture content of compost; pHCP, initial pH of compost), the application rate of biochar (AR), biochar properties (pHBC, pH of biochar; SSABC, specific surface area of biochar), and changes in compost properties (RRNO3−, response ratio of average NO3− contents; RRpH, response ratio of final pH; RRTOCloss, response ratio of total organic carbon loss; RRNH4+, response ratio of average NH4+ contents) influence the response ratios of (a) CO2, (b) CH4, (c) N2O, and (d) NH3 emissions. Pink and blue arrows refer to positive and negative relationships (* p < 0.05, ** p < 0.01, and *** p < 0.001). Dotted arrows denote insignificant correlations (p > 0.05). The numbers next to the arrows indicate the standardized path coefficient.
-
Biochar amendment demonstrated multiple benefits in composting systems by mitigating gas emissions (CH4, N2O, and NH3), conserving nitrogen nutrients, and contributing to carbon stability. Our analysis confirmed that biochar significantly reduced NH4+, increased NO3−, and elevated pH during composting (Fig. 2), implying that biochar stimulates nitrification[21]. Simultaneously, biochar markedly reduced TN losses, supporting the role of biochar in optimizing nitrogen conservation[50]. The stable TC and TOC levels suggest that biochar did not increase carbon mineralization losses. Additionally, although biochar did not significantly alter TC or TOC loss, its recalcitrant structure could contribute to carbon stocks and stabilization in the composting system. Importantly, our results demonstrated that biochar could significantly reduce CH4, N2O, and NH3 emissions, with no significant influence on CO2 mitigation (Fig. 3). Compared with other mitigation methods (e.g., adding zeolite, adding clay, and adjusting C/N), biochar demonstrates superiority in reducing multiple gases[9,10, 16]. This multi-gas efficacy, validated by our expanded sample sizes, underscores the broad applicability of biochar for the mitigation of targeted gases in composting systems.
Biochar dose controls CH4, N2O, and NH3 emissions during composting
-
Our results indicated that biochar amendment significantly reduced CH4, N2O, and NH3 emissions, with the efficiency of mitigation strongly depending on the AR (Fig. 3). Biochar exhibited differential impacts on the gas emissions and even increased N2O emissions at low ARs (> 10%, w/w), indicating that biochar promotes the nitrification process and thus N2O emissions at a low AR. This was supported by our observation of elevated NO3− levels during composting (Fig. 2). With increased ARs, biochar progressively enhanced its mitigation efficacy for CH4, N2O, and NH3, indicating that biochar enhances aeration performance at a high AR and improves the gas mitigation effect[41]. However, our further regression analysis between AR and RRCH4, RRN2O, and RRNH3 revealed a dose effect, indicating a saturation point beyond which the mitigation efficacy of biochar declines (Supplementary Fig. S2). A possible explanation is that excessive biochar promotes aggregate formation and expands anaerobic sites in compost piles[29]. Collectively, our regression analysis indicates that the peak mitigation efficacy for the three target gases occurs within the AR range of 10%–20% w/w. We proposed that AR at 10%–20% w/w may be the optimal range to achieve co-mitigation effects on CH4, N2O, and NH3.
Rebalancing of carbon and nitrogen possibly influenced CO2 emissions in composting
-
Biochar addition did not significantly alter CO2 emissions (Fig. 3), whereas the TC loss and TOC loss results indirectly support this conclusion (Fig. 2). However, the overall nonsignificant effect does not imply that biochar has no impact on compost CO2 emissions. Critically, our PLS-PM results distinctly identified RRNO3− as the most critical direct driver of RRCO2 (Fig. 6a), which was not mentioned in previous research[31, 38]. This finding suggests a pivotal role of nitrogen processes (specifically nitrification–denitrification dynamics influencing NO3− levels) in governing CO2 dynamics in composting, challenging the conventional focus on carbon cycle mechanisms[51−53]. The meta- and sub-meta-analyses also showed that the impacts of AR on CO2 emissions vary significantly under different C/N ratios (Fig. 4 and Supplementary Fig. S3). Specifically, at C/N ratios > 20, increasing AR tended to promote CO2 emissions, but CO2 emissions are suppressed at C/N ratios < 20. This opposite response implies that the nitrogen concentration in compost is a key regulator determining whether biochar stimulates or inhibits CO2 production. Since biochar is known to enhance nitrogen mineralization, promote nitrification, and modulate denitrification processes[13,18,43,54], we reasonably hypothesized that biochar may regulate the composting environment, rebalance carbon and nitrogen's interdependence, and redistribute microbial activity, ultimately influencing CO2 emissions. This rebalancing of carbon and nitrogen caused by biochar results in a nonsignificant overall effect on CO2 emissions, as the process is inherently complex and highly dependent on the composting conditions. According to the predictive model of PLS-PM, the rebalancing of carbon and nitrogen is the possible underlying mechanism regulating CO2 emissions in composting.
The optimal parameters for mitigating gas emissions in composting
-
Biochar decreased CH4, N2O, and NH3 emissions under most composting parameters except acidic conditions (Fig. 4). Notably, the C/N ratio and MC are important factors determining the responses of CO2 emissions to biochar, with high C/N ratios (> 30) and low MC (< 55%) increasing CO2 emissions. The EC impairs the mitigation effects of biochar on all target gases. Hence, to achieve stable and effective mitigation efficiency for CO2, CH4, N2O, and NH3 emissions, appropriate parameters should be established for composting. It is a challenge to achieve synergistic optimization because of the different gas mitigation mechanisms. According to our meta-analysis and discussion, we propose the following optimal parameters: a C/N ratio of 20–30, a moisture content of 55%–65%, a pH of 7.5–8.5, EC < 4 mS/cm, and 10%–20% (w/w, dry weight) biochar dosage to mitigate gas emissions in composting. Compared with previous studies[31], this new proposal further bounded the pH and EC conditions which decrease the mitigation efficiency of biochar for CH4, N2O, and NH3 emissions at pH < 7.5 and EC > 4 mS/cm (Fig. 4). The AR of biochar dosage at 10%–20% (w/w, dry weight) was chosen due to its convex relationships with the response ratios of CH4, N2O, and NH3 (Fig. 3 and Supplementary Fig. S2).
The C/N ratio is a pivotal parameter in the composting process[55]. Our meta-analysis showed that biochar promotes CO2 emissions under high C/N ratios (> 30), but reduces CO2 emissions under a low C/N (< 20) (Fig. 4 and Supplementary Fig. S3). However, there is a lack of in-depth research into and explanations of the mechanisms related to this phenomenon. A possible explanation is that biochar may modulate nitrogen's availability[31,55]. Under nitrogen-poor conditions, biochar may mitigate nitrogen limitations and stimulate microorganisms to decompose organic carbon, thereby promoting CO2 emissions[56,57]. In contrast, under nitrogen-rich conditions, biochar may adsorb excess readily available nitrogen and alleviate nitrogen-induced suppression of microbial carbon metabolism efficiency, thereby reducing futile carbon loss[58].
The MC is the key factor in starting composting, with MC directly determining the oxygen environment of the compost[59]. Our meta-analysis and regression results showed that as the MC increases, the impact of biochar on CO2 emissions shifts from promoting to inhibiting (Fig. 4 and Supplementary Fig. S2). This transition suggests that biochar stabilizes CO2 emissions within an optimal range by regulating moisture to appropriate aerobic conditions during composting[51]. This conclusion can also be used to explain our observations of CH4 and N2O emissions (Fig. 4). Because biochar regulates an appropriate aerobic environment, there were significant mitigation effects on CH4 and N2O emissions under all the different MC conditions.
The pH mainly influences the microbial activity during composting[59]. Our meta-analysis showed that biochar’s mitigation effects on CH4, N2O, and NH3 significantly decrease at a low pH (< 7.5) (Fig. 4), indicating that an acidic environment (< 7.5) compromises the alkaline buffering capacity of biochar. Notably, there was no significant increase in NH3 emissions at high pH values, indicating that appropriately managed higher pH levels may not necessarily promote the volatilization of ammonia in biochar-amended composting. Additionally, we detected that biochar promoted CO2 emissions when pH increased, which may be explained by the partial decomposition of biochar in an alkaline environment[27,60]. Although pH significantly influences gas emissions levels across biochar treatments, these variations remain unaltered by changes in the biochar dosage (Supplementary Fig. S3), suggesting that the inherent chemical properties of biochar may primarily drive differences in emissions in acidic versus alkaline environments[49].
The EC is an important indicator for evaluating the quality of compost products[61]. Our results firstly indicated that the initial EC of compost influenced the effectiveness of biochar's mitigation effects (Fig. 4). As the initial EC increased, the mitigation effects of biochar on all targeted gases were weakened. This phenomenon may be explained by the competitive adsorption between nutrients and salinity[62,63]. Unfortunately, the mechanisms between biochar's mitigation effects and the initial salt content have not been fully proved and remain to be further studied.
The optimal parameters we proposed for gas mitigations fall into the ranges for optimal compost quality, although this was not the current focus[31]. Future research should be further carried out to validate compost quality as well as gas mitigation for sustainable organic waste management and climate-smart agricultural practices.
-
Biochar amendment demonstrated a tripartite benefit: mitigating gas emissions (CH4, N2O, and NH3), conserving nitrogen nutrients, and contributing to carbon stocks' stability in composting. Biochar could significantly reduce CH4 (53.7%), N2O (49.8%), and NH3 (35.9%) emissions during composting. Biochar amendment could reduce NH4+ (17.4%), increase NO3− (17.2%), elevate pH (4.7%), and decrease TN losses (41.3%) in composting. There were no significant changes in CO2 emissions, TC loss, and TOC loss with added recalcitrant carbon stocks. Subgroup analysis and regression analysis showed that biochar's AR was the key parameter affecting CH4, N2O and NH3 emissions, demonstrating dose-dependent effects on the efficacy of mitigation. Biochar decreased CH4, N2O, and NH3 emissions under most parameters except acidic conditions. High C/N ratios (> 30) and low MC (< 55%) increased CO2 emissions, whereas high EC (> 4 mS/cm) impaired the mitigation effects of biochar on all target gases. The optimal parameters were identified as a C/N ratio of 20–30), moisture content of 55%–65%), pH 7.5–8.5, an EC of < 4 mS/cm, and biochar dosage at 10%–20% (w/w dry weight) for mitigating gas emissions in composting.
We would like to express our deep gratitude to the editors and two anonymous reviewers for their valuable comments and critical evaluation of this manuscript.
-
It accompanies this paper at: https://doi.org/10.48130/nc-0025-0003.
-
Not applicable.
-
The authors confirm their contributions to the paper as follows: study conception and design: Xu J, Xiong Z; material preparation, data collection, and data analysis: Xu J; writing – draft manuscript preparation: Xu J; conceptualization, funding acquisition, supervision, writing – review and editing: Xiong Z. Both authors read and approved the final manuscript.
-
The datasets used or analyzed during the current study are available from the corresponding author upon reasonable request.
-
This work was jointly supported by the Chinese Academy of Sciences, the Jiangsu Province Special Project for Carbon Peak and Carbon Neutral Science and Technology Innovation (BE2022309), Dazhou Key Laboratory of Advanced Technology for Fiber Materials (XWCL2204), and the National Natural Science Foundation of China (42377292).
-
All authors declare that they have no competing interests.
-
Full list of author information is available at the end of the article.
- Supplementary File 1 References used for data collection.
- Supplementary Table S1 Statistical results of heterogeneity for each group: biochar properties (BC) and composting conditions (CP).
- Supplementary Table S2 The results of publication bias for each group: biochar properties (BC) and composting conditions (CP).
- Supplementary Fig. S1 The criteria and procedure of selecting studies for the meta-analysis.
- Supplementary Fig. S2 Relationships between the RRCO2, RRCH4, RRN2O and RRNH3 with carbon-nitrogen ratio (C/N), moisture content (MC), initial pH (pH), electric conductivity (EC) of compost, and application rate (AR) of biochar.
- Supplementary Fig. S3 Effects of biochar application rate on gas mitigation effects under different compost conditions.
- Copyright: © 2025 by the author(s). Published by Maximum Academic Press, Fayetteville, GA. This article is an open access article distributed under Creative Commons Attribution License (CC BY 4.0), visit https://creativecommons.org/licenses/by/4.0/.
-
About this article
Cite this article
Xu J, Xiong Z. 2025. Biochar amendments mitigate trace gas emissions in organic waste composting: a meta-analysis. Nitrogen Cycling 1: e005 doi: 10.48130/nc-0025-0003 

Biochar amendments mitigate trace gas emissions in organic waste composting: a meta-analysis
- Received: 03 June 2025
- Revised: 28 July 2025
- Accepted: 12 August 2025
- Published online: 17 September 2025
Abstract: Composting is valuable for recycling resources and environmental protection, but it emits greenhouse gases, namely carbon dioxide (CO2), methane (CH4), and nitrous oxide (N2O), and ammonia (NH3). Biochar can reduce greenhouse gases and NH3 emissions, but its effects and mechanisms in composting are debated. We conducted a global meta-analysis of 123 published studies (251 paired comparisons and 1,184 observations) to identify the dominant factors and underlying mechanisms driving CO2, CH4, N2O, and NH3 emissions during biochar-amended composting. Biochar amendment significantly reduced emissions of CH4 (53.7%), N2O (49.8%), and NH3 (35.9%), but had no significant effect on CO2 emissions. The application rate of biochar was the key parameter affecting CH4, N2O, and NH3 emissions, demonstrating a dose effect on mitigation efficacy. Biochar decreased CH4, N2O, and NH3 emissions under most parameters, except acidic conditions. Although a high carbon:nitrogen ratio (> 30) and a low moisture content (< 55%) increased CO2 emissions, high electric conductivity (> 4 mS/cm) impaired the mitigation effects of biochar on all target gases. To achieve optimal composting performance to mitigate trace gases, the following parameters are recommended: a carbon : nitrogen ratio of 20–30, a moisture content of 55%–65%, pH 7.5–8.5, an electric conductivity of < 4 mS/cm, and a biochar dosage of 10%–20% (w/w, dry weight).
-
Key words:
- Greenhouse gases /
- Ammonia /
- Meta-analysis /
- Composting /
- Biochar /
- Manure