


-
Since the Industrial Revolution, anthropogenic activities have driven rapid and sustained increases in reactive nitrogen (Nr) emissions, leading to widespread nitrogen (N) enrichment in terrestrial ecosystems, and profoundly altering global N cycling processes[1]. These perturbations have triggered a cascade of interconnected environmental challenges, including haze formation, acid deposition, elevated N deposition fluxes, soil acidification, N saturation, enhanced greenhouse gas emissions, biodiversity loss, vegetation community restructuring, water quality degradation, and aquatic eutrophication[2−4]. Crucially, many of these alterations to Earth's N cycle exhibit irreversible characteristics, fundamentally reshaping biosphere-atmosphere interactions[5].
Within the Earth system, the dynamic cycling of Nr serves as a critical nexus connecting atmospheric, biospheric, and hydrospheric processes[5]. Anthropogenic emissions from industrial activities and agricultural practices (e.g., ammonia [NH3] from fertilizer volatilization, nitrogen oxides [NOx] from fossil fuel combustion) combine with natural N sources (e.g., soil microbial processes, lightning NOx) to form secondary inorganic N compounds through complex atmospheric chemistry[6,7]. These transformations convert gaseous precursors (NH3, NOx) into particulate ammonium (NH4+), and nitrate (NO3−), which subsequently enter terrestrial and aquatic ecosystems via dry and wet deposition[4]. This redistribution mechanism not only modifies N allocation patterns across environmental compartments but also exerts cascading impacts on ecosystem carbon-nitrogen (C-N) stoichiometry, freshwater quality, and global climate feedback through canopy-mediated filtration, soil microbial transformations, and plant-mediated assimilation processes.
The N isotope (δ15N) signatures of environmental N compounds integrate source-specific isotopic fingerprints and process-dependent fractionation effects, providing a powerful diagnostic tool for deciphering N provenance and transformation pathways[6−9]. This isotopic approach enables quantitative assessment of anthropogenic vs natural N inputs, identification of dominant transformation mechanisms (e.g., nitrification and denitrification), and evaluation of cumulative isotopic effects along N-cascade pathways. The contrasting δ15N fractionation behaviors between nitrification and denitrification arise from their fundamentally different redox biochemistry and rate-limiting enzymatic steps[10], providing a critical basis for tracing nitrogen transformations in the environment. Nitrification, the aerobic oxidation of NH4+ to NO3−, exhibits consistent 15N depletion in the product (NO3−). This occurs because the enzyme ammonia monooxygenase (AMO) preferentially reacts with the lighter 14NH4+, leaving the residual NH4+ pool enriched in 15N, and the newly formed NO3− depleted in15N. The reported enrichment factors (ε) for this process typically range from −30‰ to −5‰[10], with the largest fractionation occurring during the initial NH4+ to NH2OH step. Consequently, NO3− produced primarily from nitrification tends to have a lower δ15N value than its source. Denitrification, the anaerobic reduction of NO3− to N2 gas, produces the opposite pattern: 15N enrichment in the residual substrate (NO3−). The enzyme nitrate reductase (NaR) favors the lighter 14NO3−, causing the residual NO3− pool to become progressively heavier as the reaction proceeds. This results in a classic Rayleigh distillation trend, in which the δ15N of the remaining NO3− increases as its concentration decreases. Fractionation during denitrification is generally greater, with ε values ranging from −40‰ to −10‰, making its isotopic signature particularly pronounced[10]. Therefore, the key difference lies in the isotopic imprint on the inorganic nitrogen pool: nitrification generates 15N-depleted NO3−, while denitrification leaves behind 15N-enriched NO3−. This fundamental distinction allows researchers to identify the dominant nitrogen transformation processes in ecosystems.
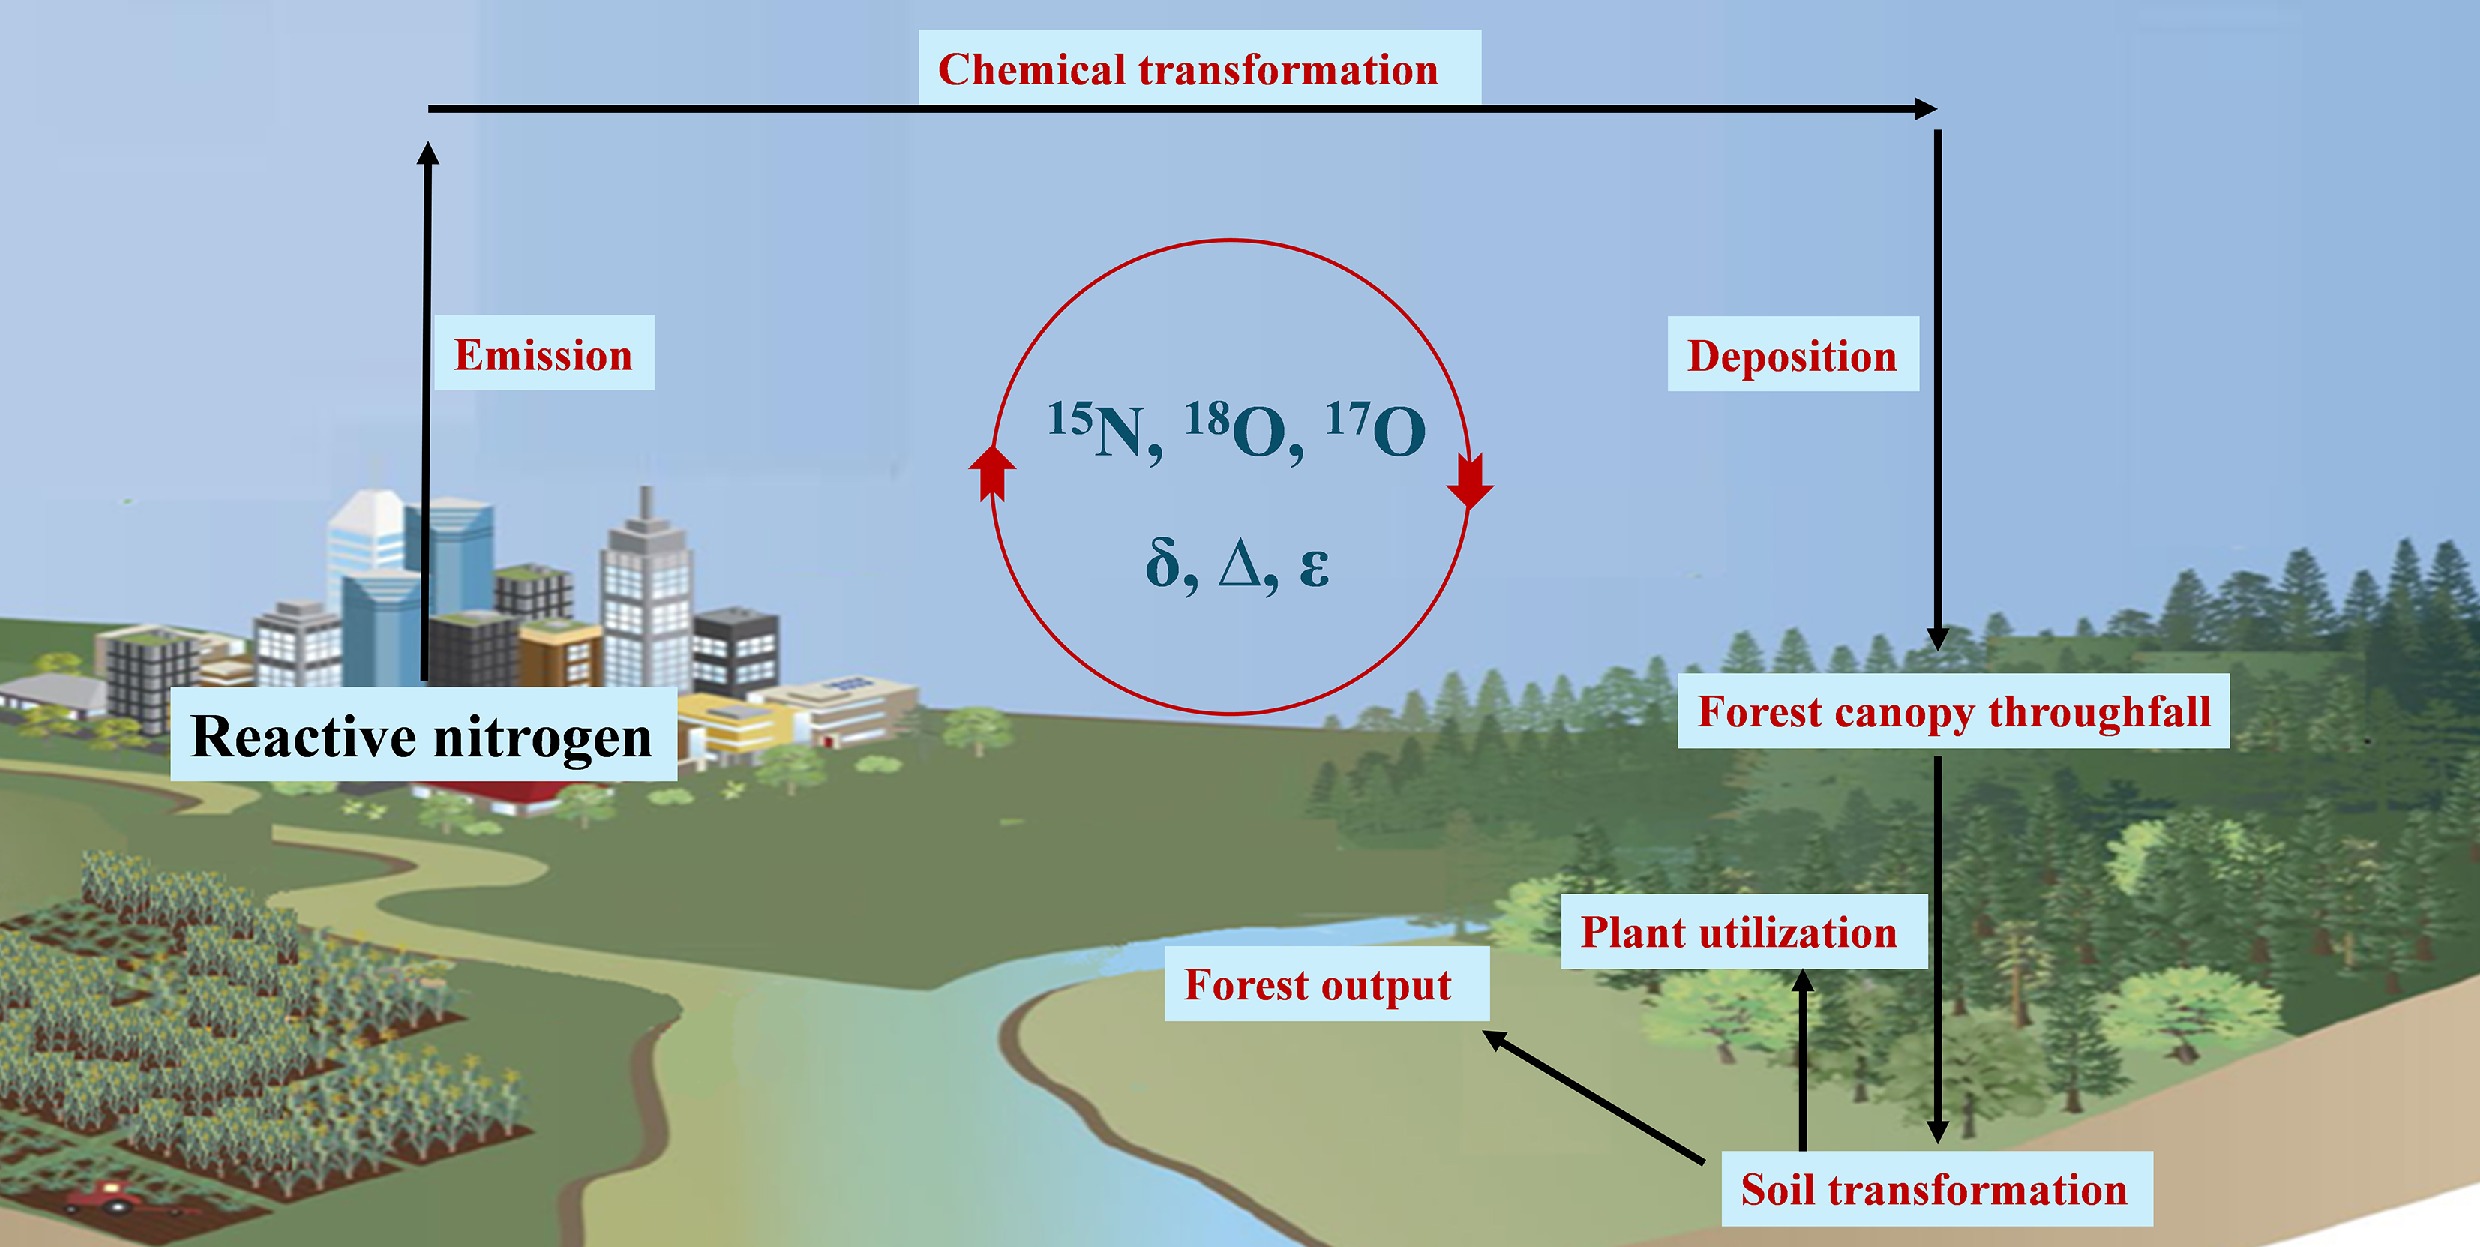
Such insights are critical for developing targeted Nr mitigation strategies, and assessing the ecological consequences of N saturation. This review synthesizes recent advances in N isotope applications across five key domains: (1) Atmospheric Nr sources; (2) Nitrogen inputs via forest canopy throughfall; (3) Soil N transformation; (4) Plant N utilization; and (5) N output in forest ecosystems. Furthermore, an integrated framework is proposed for systematically understanding cross-compartmental N fluxes and their interactions, emphasizing the need for multi-isotope approaches, spatially resolved monitoring networks, and process-explicit modeling to address remaining uncertainties in quantifying the global nitrogen cycle.
-
Fossil fuel NOx emissions, primarily from coal combustion and vehicle exhaust, are widely recognized as the dominant contributors to atmospheric nitrate nitrogen (NOy) pollution, and increasing deposition fluxes. However, persistent uncertainties in quantifying the relative contributions of terrestrial fossil vs non-fossil NOx sources (e.g., microbial N cycle and biomass burning) hinder accurate estimation of total NOx emissions, impairing the formulation of mitigation strategies, deposition flux accounting, modeling efforts, and ecological impact assessments of nitrogen deposition.
Since the 1950s, N stable isotopes of precipitation NO3− (
$\delta ^{15}{\rm N} _{\rm w{\text-}NO_3^-}$ 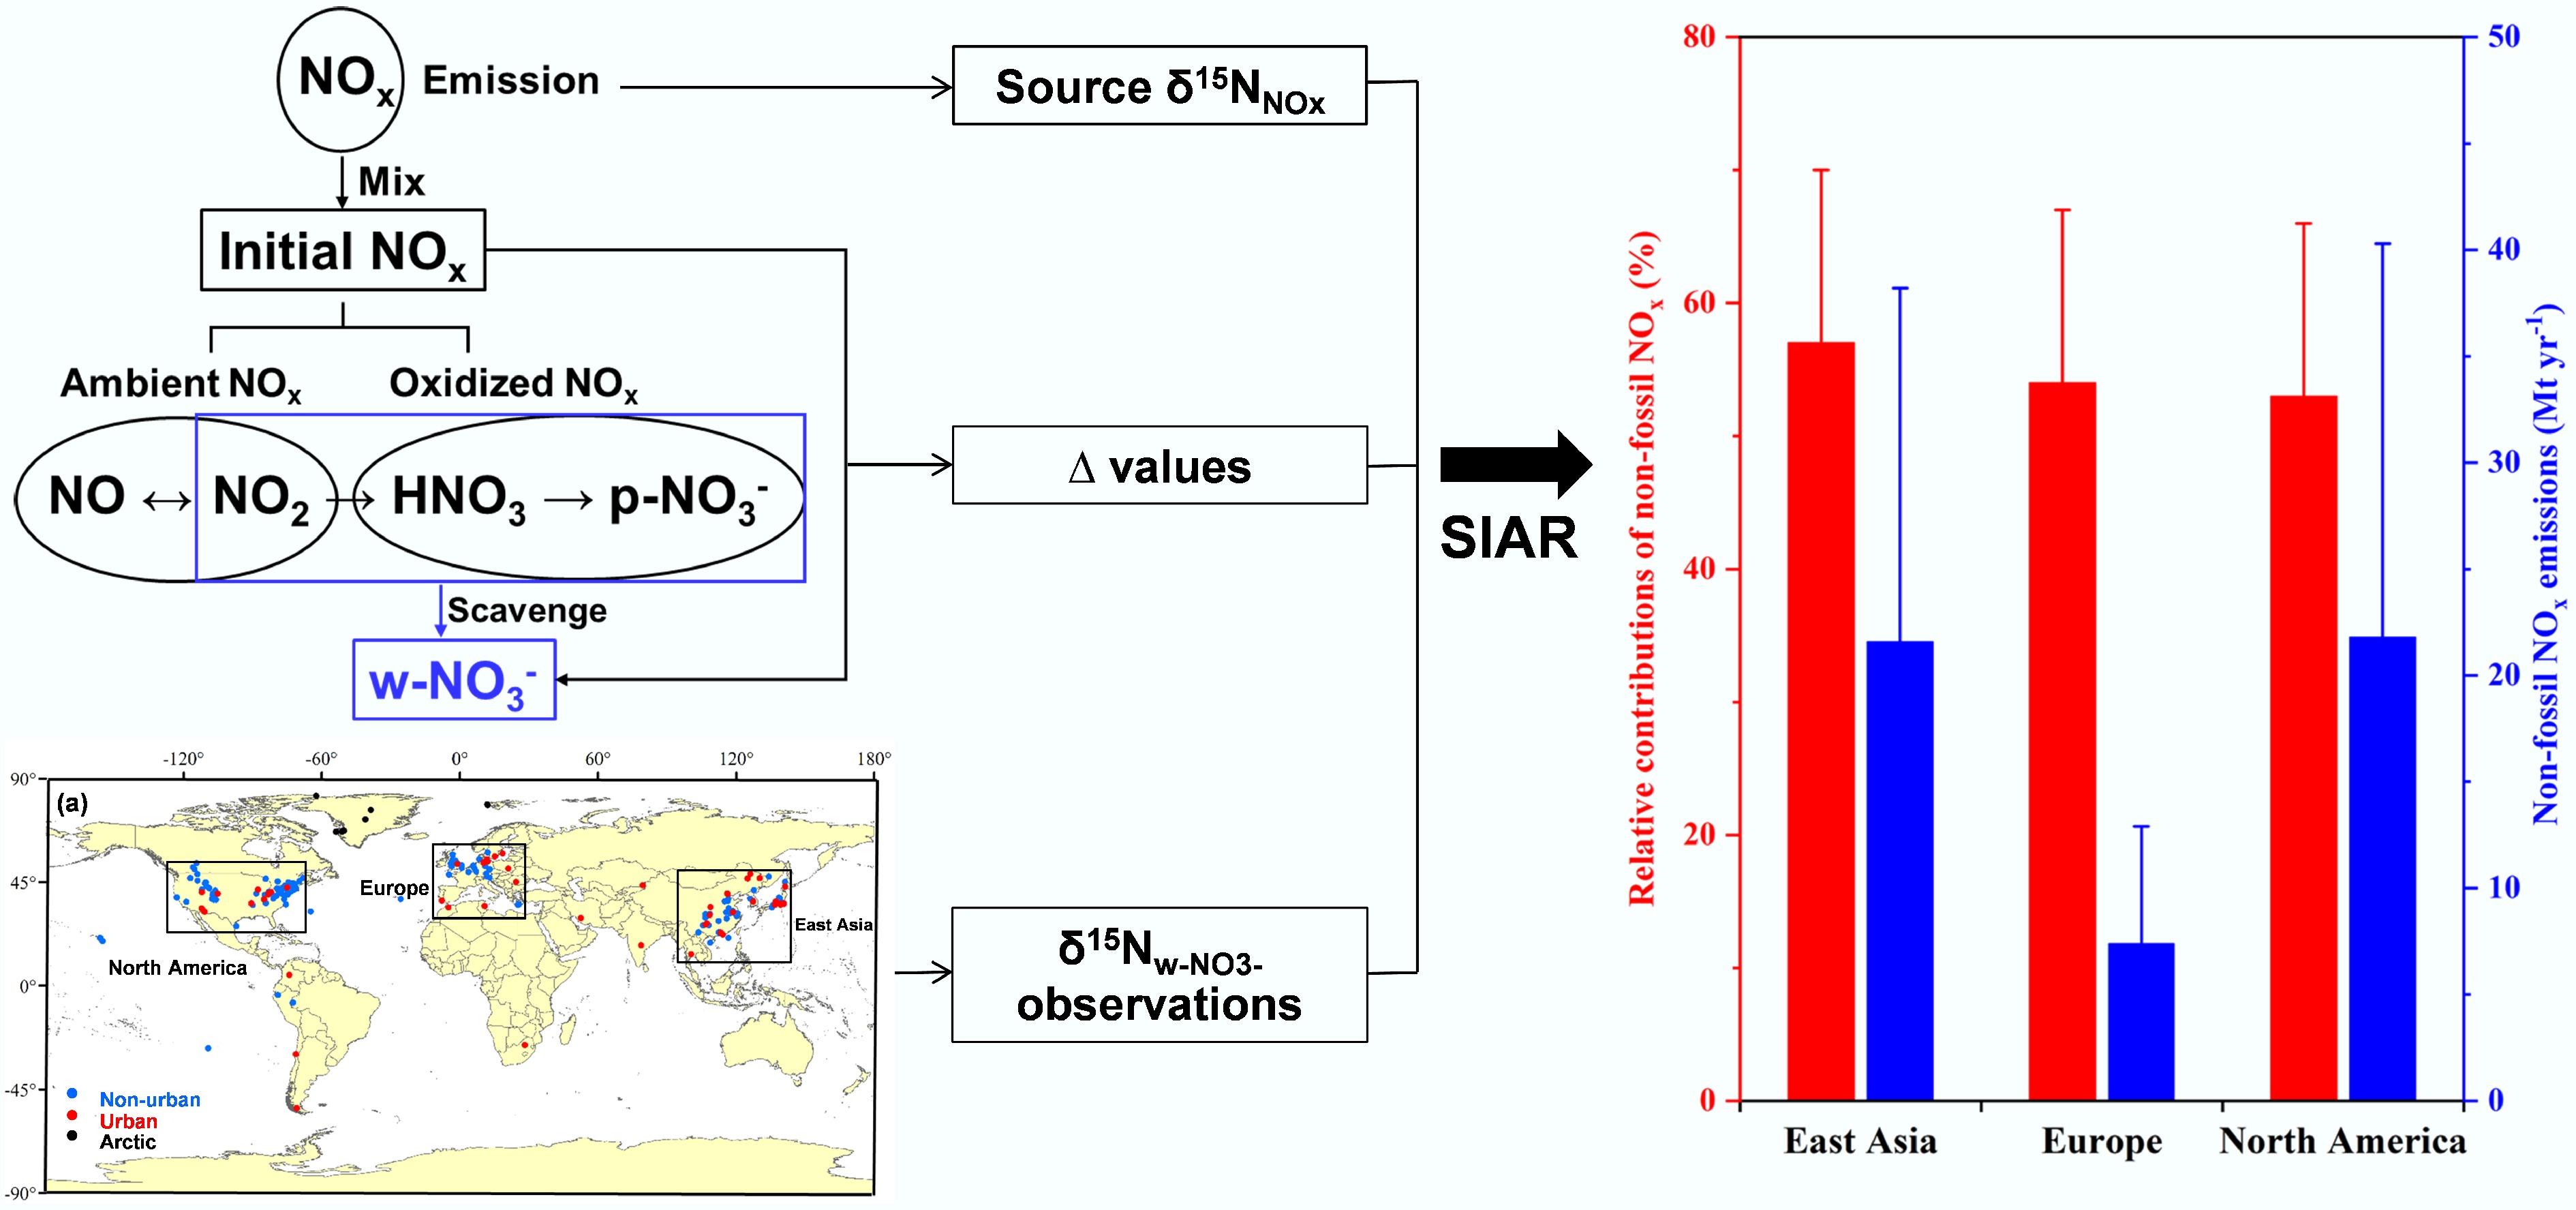
Figure 1.
Isotope analysis diagram of NO3− sources in precipitation (modified from Song et al.[7]).
By integrating chemical kinetic parameters and quantum-chemical calculations, the N-isotopic effects during particulate NO3− (p-NO3−) formation have been systematically characterized[12,17,18]. Precipitation NO3− (w-NO3−), which integrates information from atmospheric nitrogen dioxide (NO2), p-NO3−, and gaseous nitric acid (HNO3), allows calculation of N isotopic effects during formation through concurrent analysis of concentrations and δ15N values of these species[7]. This breakthrough has facilitated the establishment of isotopic frameworks for quantifying primary NOx sources.
Song et al.[7] revealed spatiotemporal variations in
$\delta ^{15}{\rm N} _{\rm w{\text-}NO_3^-} $ $\delta ^{15}{\rm N} _{\rm w{\text-}NO_3^-} $ $\delta ^{15}{\rm N} _{\rm w{\text-}NO_3^-} $ In South Africa, a wintertime study conducted in the Vaal Triangle Air-Shed Priority Area (VTAPA) by Altieri et al.[19] utilized δ15N of NO3− to quantitatively apportion local NOx sources. The results demonstrated a pronounced dominance of coal combustion, contributing 66% of NO3−, followed by biomass burning (16%), vehicle emissions (12%), and minor soil emissions (6%). These findings underscore the pivotal role of coal-fired power stations in driving secondary particulate matter formation within the Highveld region. Similarly, research in Belo Horizonte, Brazil, by Passos et al.[20] employed δ15N and δ18O of NO3− in precipitation collected between 2019 and 2020 to investigate NOx sources and wet deposition in a tropical urban environment. The δ15N of NO3− values ranged from −8.5‰ to +4.1‰, indicative of mixed anthropogenic inputs. Combined backward trajectory analysis and geospatial mapping identified urban-industrial emissions, coastal shipping, and biomass burning linked to Amazon wildfires as major contributors. Notably, a temporary decline in vehicle emissions was observed during the COVID-19 lockdown period. This case highlights the necessity of integrated, multi-tracer approaches to elucidate NOₓ transformation processes and inform air quality management in rapidly urbanizing tropical regions.
Further expanding the geographic scope, a study in Karachi, Pakistan[21] applied δ15N and δ18O of NO3− alongside a Bayesian mixing model to delineate NOx sources and formation pathways in a coastal megacity. The source apportionment revealed coal combustion as the leading contributor (32%), followed by biomass burning and lightning combined (30%), mobile sources (25%), and microbial processes (13%). This work emphasizes the critical need to incorporate maritime emissions, particularly from shipping, into air quality frameworks for coastal urban centers, illustrating how isotopic tracers can capture both terrestrial and marine influences on reactive nitrogen pollution. Collectively, these regionally focused studies demonstrate the significant role of coal combustion, biomass burning, and shipping emissions in shaping local and regional nitrogen cycles, while also showcasing the utility of isotopic methods in overcoming the constraints of traditional monitoring approaches. The integration of such findings is essential for developing context-specific, scientifically informed strategies to mitigate nitrogen-related air pollution across diverse global settings.
Recent studies have identified biomass burning and microbial N cycle as significant non-fossil NOx sources[7,22−25]. However, global NOx flux uncertainties persist due to incomplete data on microbial emissions from land and the ocean. While microbial NOx emissions from natural and agricultural soils have been partially characterized, accurate quantification remains challenging for aquatic systems (rivers, lakes, wetlands), wastewater treatment, and solid waste. In the ocean environment, microbial NOx emissions are poorly constrained, and ship fuel combustion has historically been considered the dominant marine NOx source. Song et al.[26] analyzed global observation data on δ15N of p-NO3−, utilizing ocean-land isotopic differences to constrain δ15N signals of particulate NO3− that were purely derived from ocean NOx emissions. Furthermore, a new N isotope method is developed to quantify the relative contributions of major NOx emission sources by constraining N isotope effects of atmospheric NOx transformations to p-NO3− and combining the δ15N of NOx from dominant emission sources, including coal combustion, oil combustion, biomass burning, and microbial N cycle. Then, combining the known fossil fuel NOx emissions, they accomplished estimates on NOx emissions from microbial N cycle in the land and ocean, respectively (Fig. 2). Their results show that NOx emissions from the microbial N cycle account for about 24%, 58%, and 31% of the total NOx emissions in the land, ocean, and globe, equivalent to 0.5, 1.4, and 0.6 times of the corresponding fossil fuel NOx emissions (Fig. 2). This study fills the data gap of NOx emissions from microbial N cycle in the ocean and updates fluxes of NOx emissions from microbial N cycle in the land and globe. They confirm the significant contribution of microbial N cycle to global NOx emissions. It should be considered in the formulation of current and future atmospheric NOx emission-reduction policies and in the assessment of eco-environmental and climatic effects.
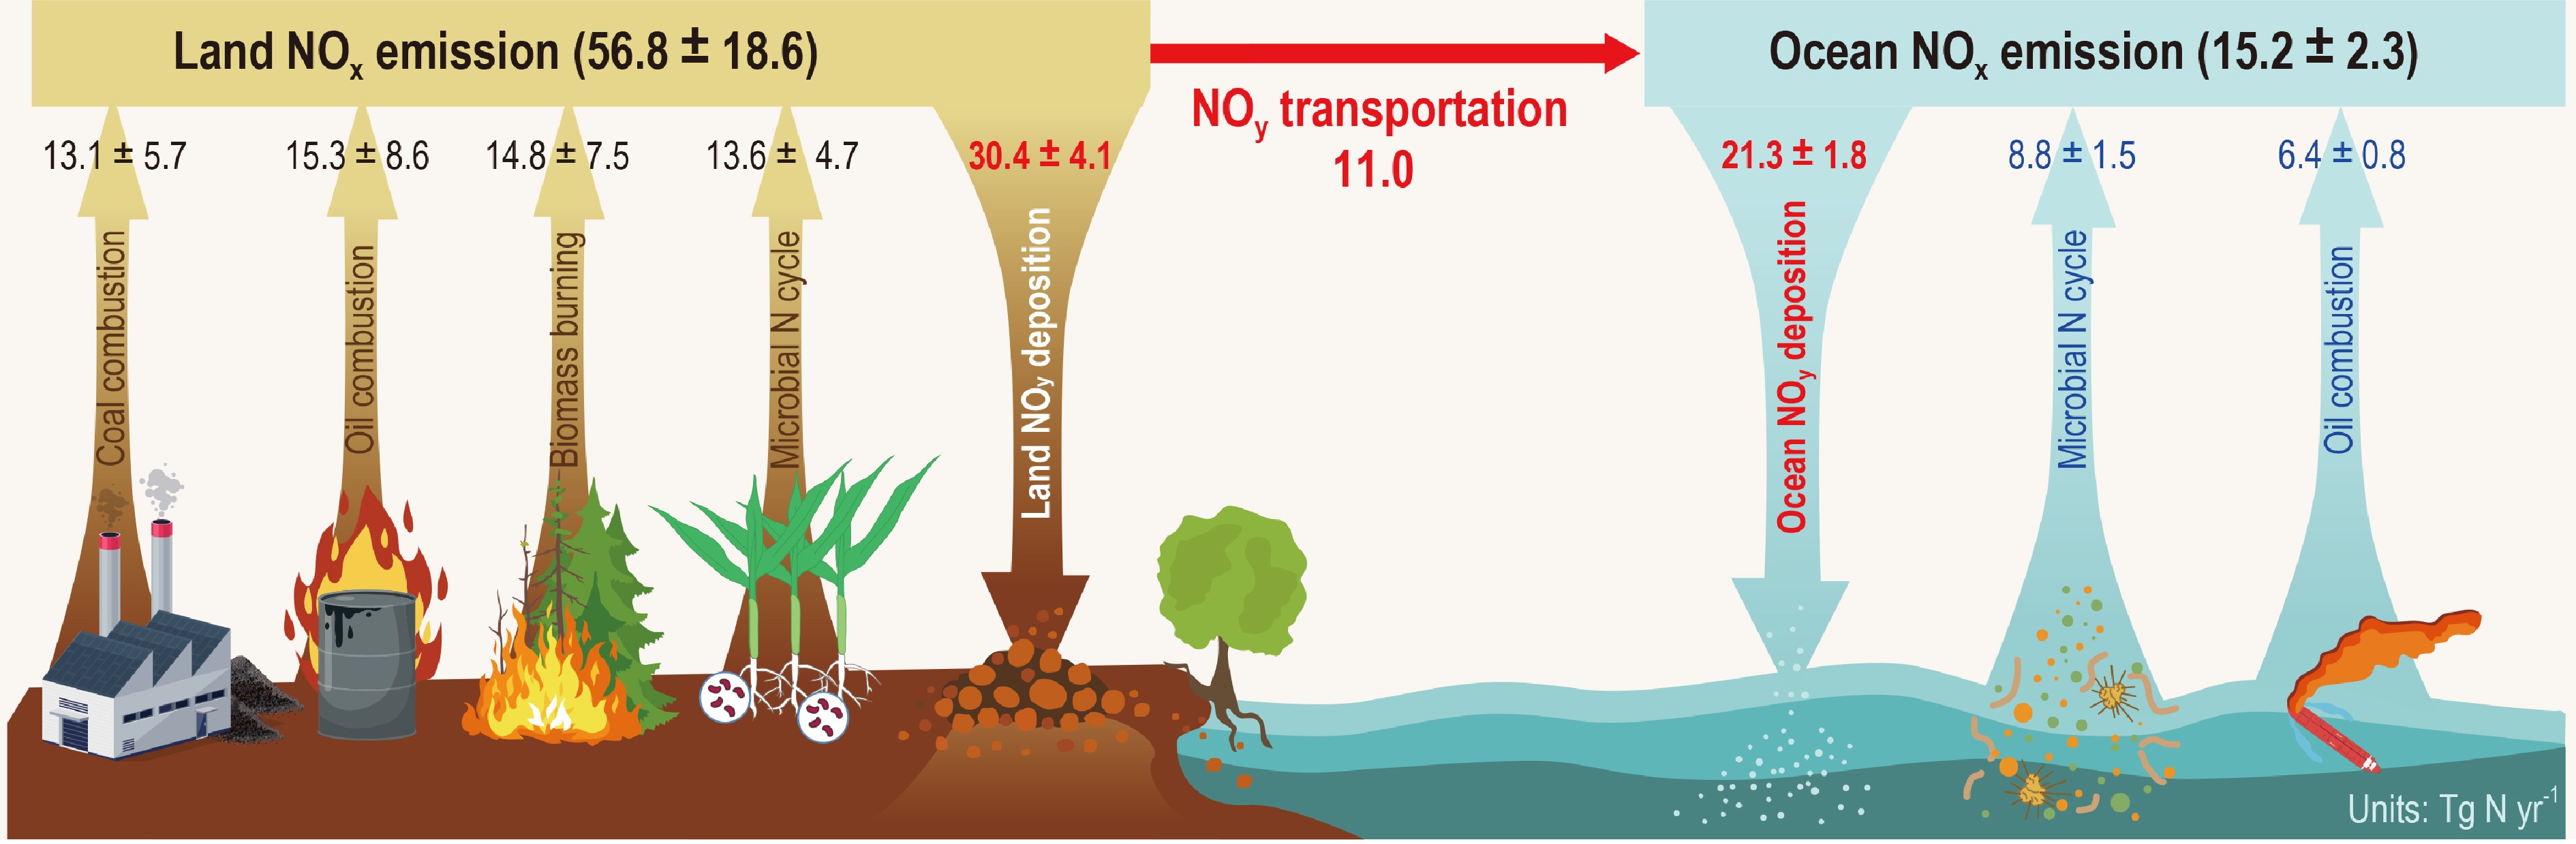
Figure 2.
Emission fluxes from major NOx sources in the atmosphere and NOy transportation and deposition fluxes (modified from Song et al.[26]).
Due to its high solubility and chemical reactivity, NH3 has a short atmospheric lifetime, but atmospheric transport of NH4+ is significant and widespread, resulting in complex, highly mixed sources of atmospheric NHx (the sum of NH3 and NH4+) at specific monitoring sites and underlying surfaces. NH3 has two primary sources: combustion-related NH3 (c-NH3), which originates from the high-temperature combustion processes of fossil fuels and biomass, and volatilization-derived NH3 (v-NH3), which is produced from the low-temperature volatilization of nitrogen-based fertilizers and animal manure. The v-NH3 has long been assumed to be the primary NH3 source at regional and global scales. In recent years, evidence from laboratory simulations, in situ observations, satellite observations, and more accurate emission inventories point to that fossil-fuel combustion sources dominated by coal combustion (industrial coal combustion in the urban and surrounding areas, and domestic coal combustion in non-urban areas), and oil combustion (urban traffic as a regional hotspot, and vehicles are also widely distributed in non-urban areas), as well as biomass burning dominated by crop straw and wildfires, emit a large amount of NH3. However, it is difficult to accurately constrain the emission factors and intensity of the widely distributed c-NH3, leading to uncertainty in the fractional contribution and amount of c-NH3 to regional NH3 emissions.
Since the 1950s, stable N isotope (δ15N) has gradually been recognized as an effective tool for tracing or differentiating NH3 emission sources. To date, site-based δ15N observations of atmospheric NHx have been conducted widely in high N-pollution regions of East Asia, North America, and Europe (Fig. 3). However, it remains a challenge to constrain the post-emission δ15N changes of NH3 due to transformations in the atmosphere, which prevents a quantitative assessment of source contributions to NH3 emissions. Chen et al.[6] constrained the N isotope effect between atmospheric NH3, particulate NH4+ (p-NH4+), or precipitation NH4+ (w-NH4+), and the initial NH3 mixture (i-NH3). Then, they reconstructed δ15N of i-NH3 (
$\delta ^{15}{\rm N} _{\rm i{\text-}NH_3} $ $\delta ^{15}{\rm N} _{\rm i{\text-}NH_3} $ 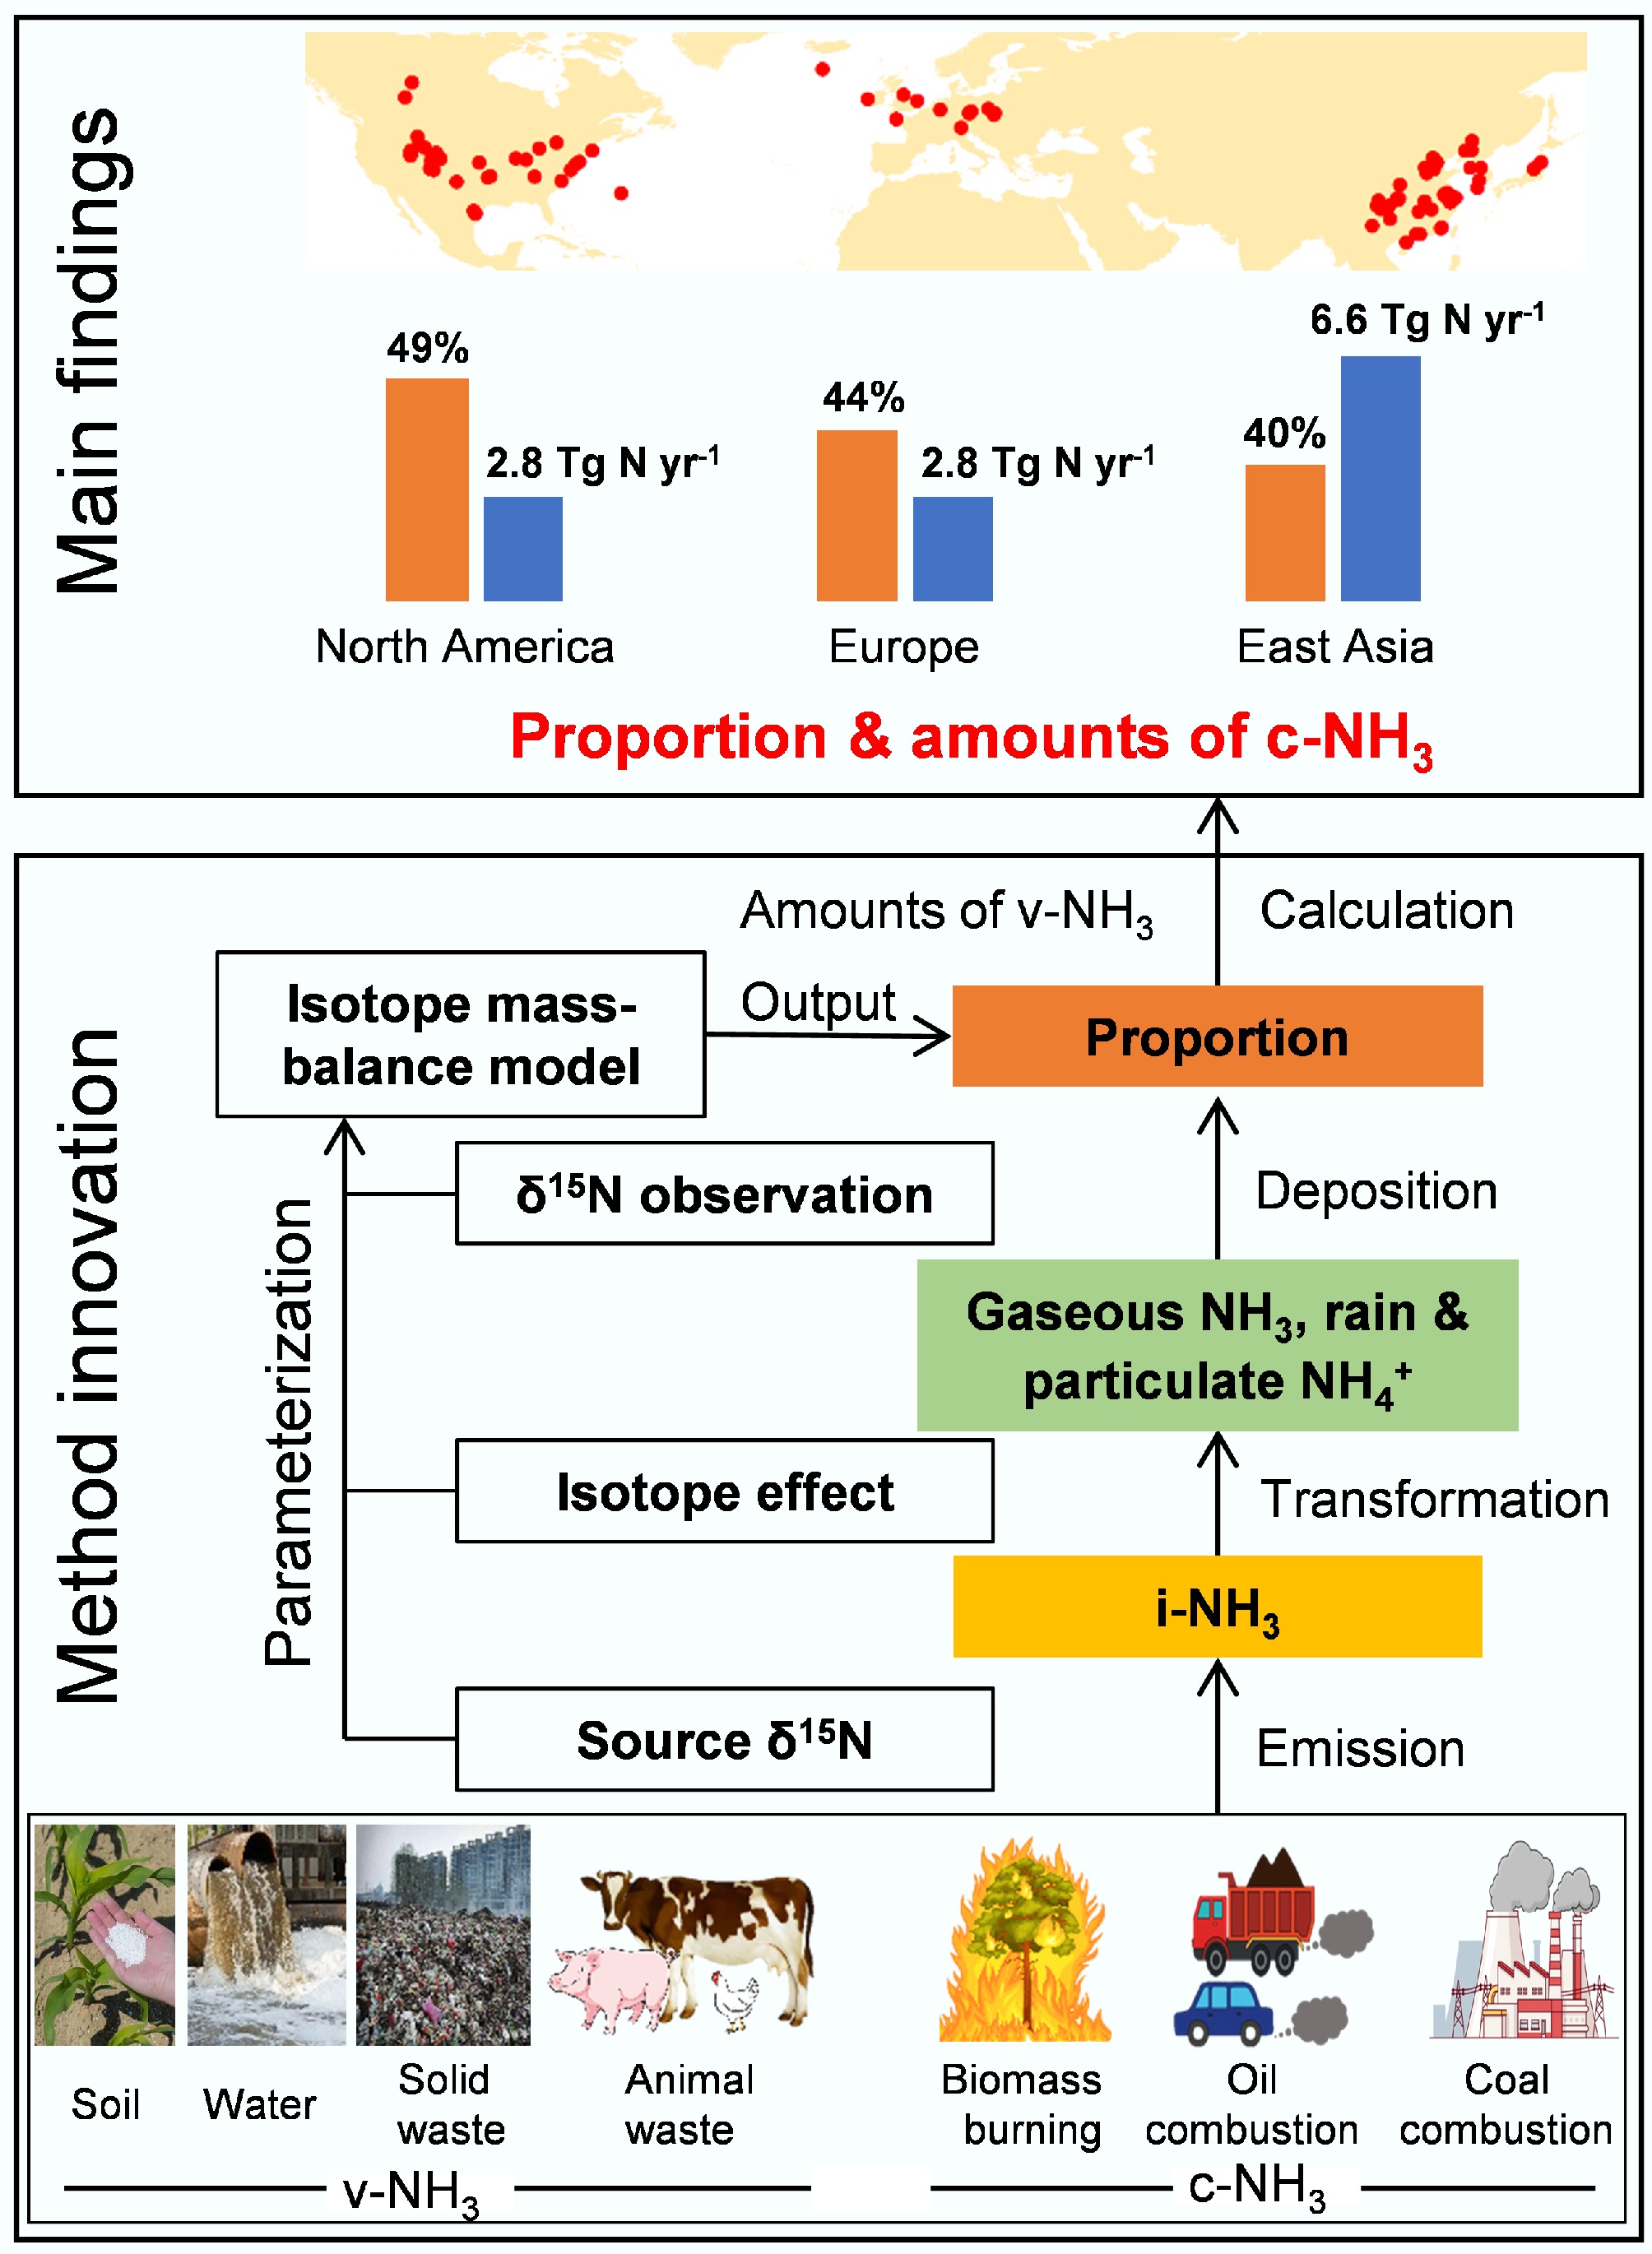
Figure 3.
Main principles and key findings of atmospheric NH3 and NH4+ isotope analysis (modified from Chen et al.[6]).
The isotopic identification of c-NH3 as a major contributor to urban haze formation has directly informed policy interventions in China. Following the landmark study by Chen et al.[6] demonstrating that 30%–50% of atmospheric NH3 in the North China Plain originated from industrial and vehicular sources rather than agriculture, the Chinese Ministry of Ecology and Environment incorporated NH3 emission standards into the 'Air Quality Continuous Improvement Action Plan'[27].
-
The forest canopy serves as the primary interface for nutrient redistribution in forest ecosystems. Atmospheric N entering forests is partitioned into three components: canopy interception/uptake, throughfall (TF), and stemflow (SF). The canopy facilitates complex biological, physical, and chemical interactions, with unretained N ultimately reaching the soil via TF and SF. Studies in the coniferous forests of Washington (USA) revealed that ~90% of precipitation N is intercepted by the canopy[28], while tropical forest research demonstrated that 56% (0.6 kg N ha−2 yr−1) of wet deposited NO3− is retained[29]. In the Langkeshan forests of Zhaoqing (China), rainfall NH4+ and NO3− inputs were 22.5 and 15.7 kg N ha−2 yr−1, respectively, lower than TF values (26.0 and 26.75 kg N ha−2 yr−1)[30]. Canopy processes including interception, foliar N uptake, dry deposition leaching, and microbial N transformations[31], modify atmospheric N fluxes and speciation before reaching the forest floor. However, the mechanisms driving these differences in N dynamics across the canopy remain poorly resolved.
Quantifying precipitation-canopy N exchange encompassing canopy-induced N loss (via interception/uptake) and TF N gain (via particulate or biogenic N capture) has long been challenging. Consequently, open-field precipitation measurements often inaccurately estimate soil N deposition fluxes and biogeochemical characteristics, limiting assessments of atmospheric N impacts on forest N cycling and ecosystem functions. Liu et al.[32] addressed this by developing a novel triple-isotope (15N,17O,18O) framework and synthesizing global data. Their study revealed that canopy-derived NO3− from nitrification (n-NO3−), p-NO3−, and bulk precipitation NO3− (b-NO3−) contributed 10% ± 9% (0.6 ± 0.6 kg), 47% ± 14% (3.1 ± 2.5 kg), and 43% ± 13% (2.7 ± 2.2 kg), respectively, to NO3− in TF (t-NO3−) fluxes in broadleaf forests (Fig. 4). For coniferous forests, contributions were 18% ± 16% (1.3 ± 1.1 kg), 39% ± 12% (2.6 ± 2.2 kg), and 43% ± 12% (2.9 ± 2.5 kg), respectively (Fig. 4). Crucially, canopy gains of n-NO3− and p-NO3− exceeded losses of original precipitation NO3−, explaining why t-NO3− fluxes generally surpassed open-field b-NO3− fluxes (Fig. 4). This highlights the necessity of accounting for canopy N exchange in quantifying forest soil N inputs. Additionally, atmospheric NO3− pollution intensity amplifies precipitation-canopy NO3− exchange, while differences in biogeochemical processes between broadleaf and coniferous canopies require further mechanistic validation. These findings advance the assessment of forest N cycling, its interaction with carbon dynamics, and the optimization of forest ecosystem management strategies.
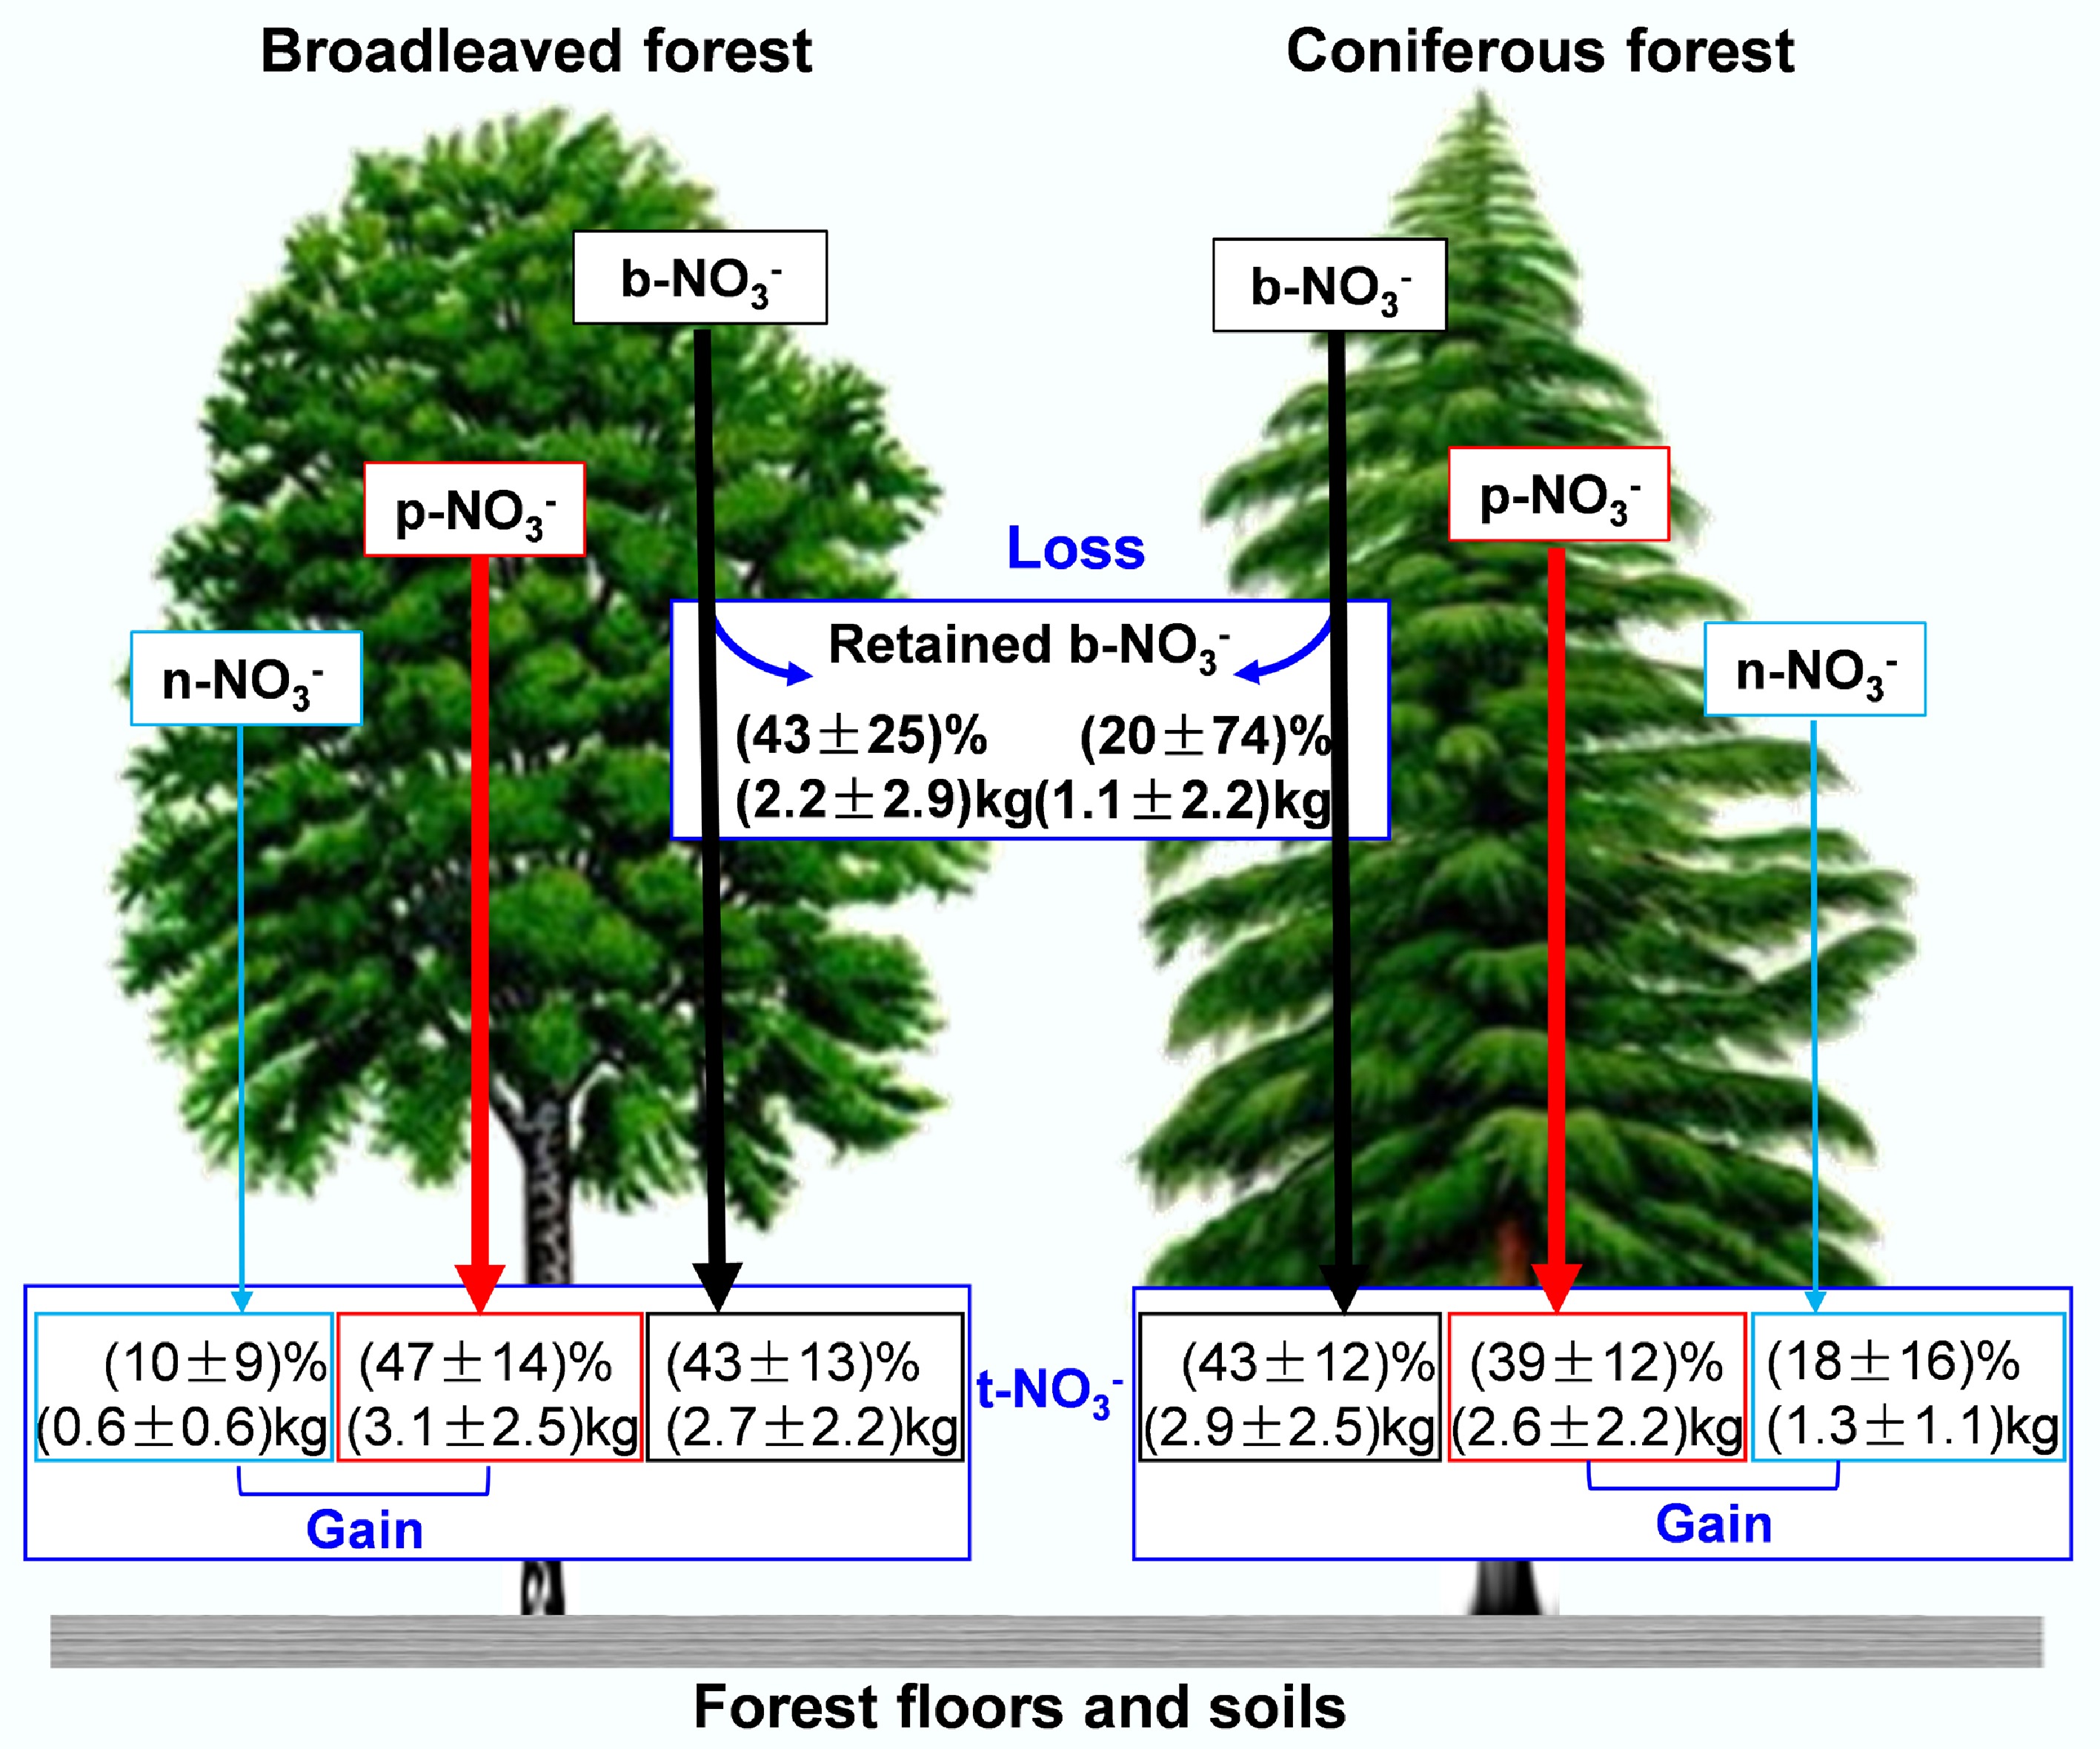
Figure 4.
Proportion and flux of the primary exchange process of nitrate between precipitation and canopy (modified from Liu et al.[32]).
-
Previous approaches for quantifying soil N transformation processes primarily include: (1) Measurement of net transformation rates and gross transformation rates (total transformation rates)[33−35]; (2) Analysis of soil microbial community structure and functional diversity[36]; (3) Biogeochemical modeling of soil N cycling[37,38]. While net N transformation rates reflect the potential capacity of specific N transformation processes to produce target products, they fail to quantify microbial assimilation rates and other biological processes[39]. The estimation of gross N transformation rates primarily relies on the 15N isotope dilution method[33,40]. However, limitations arise from the high cost of isotopic tracers and the rapid consumption of labeled substrates (primarily inorganic N), which restrict long-term and large-scale applications. Studies on microbial community structure and functional genes mainly provide qualitative assessments of specific processes, such as ammonia-oxidizing archaea and bacteria in nitrification[41]. Microbial metabolic functions play crucial roles in regulating reaction rates and magnitudes of multiple N transformation processes[42]. Despite diverse research efforts, comprehensive and accurate quantification of microbial N transformation processes remains challenging.
Determining plant-available N pools in soil constitutes a critical scientific challenge in plant N utilization research. The dynamics of plant-available N are predominantly driven by microbial N transformation processes. However, the complexity and dynamic continuity of these microbial processes pose significant challenges for in situ quantification, leading to substantial uncertainties in evaluating soil N dynamics under increasing atmospheric N deposition. Xu et al.[43] developed a multi-process soil N transformation model incorporating soil organic N (SON), dissolved organic N (DON), NH4+, and NO3− concentrations with natural 15N abundance. This model quantitatively resolves the relative proportions and fluxes of key processes, including N depolymerization, mineralization, nitrification, denitrification, and nitrate leaching (Fig. 5)[43]. The methodology provides direct parameters for reconstructing soil N transformation patterns, investigating soil N dynamics, and assessing soil N availability. Analysis of N transformation processes across 11 forest soils under varying N deposition regimes in East Asia revealed significant enhancements in soil N depolymerization, mineralization, and nitrification with increasing N deposition, accompanied by reduced proportional NO3− loss[43]. Notably, denitrification contributed increasingly to total NO3− loss compared to leaching processes under elevated N deposition. These findings offer critical scientific evidence for refining process-based N biogeochemical models and accurately assessing ecosystem-scale soil N cycling responses to regional and global environmental changes. This advancement supports the development of more effective N management strategies for future environmental stewardship.
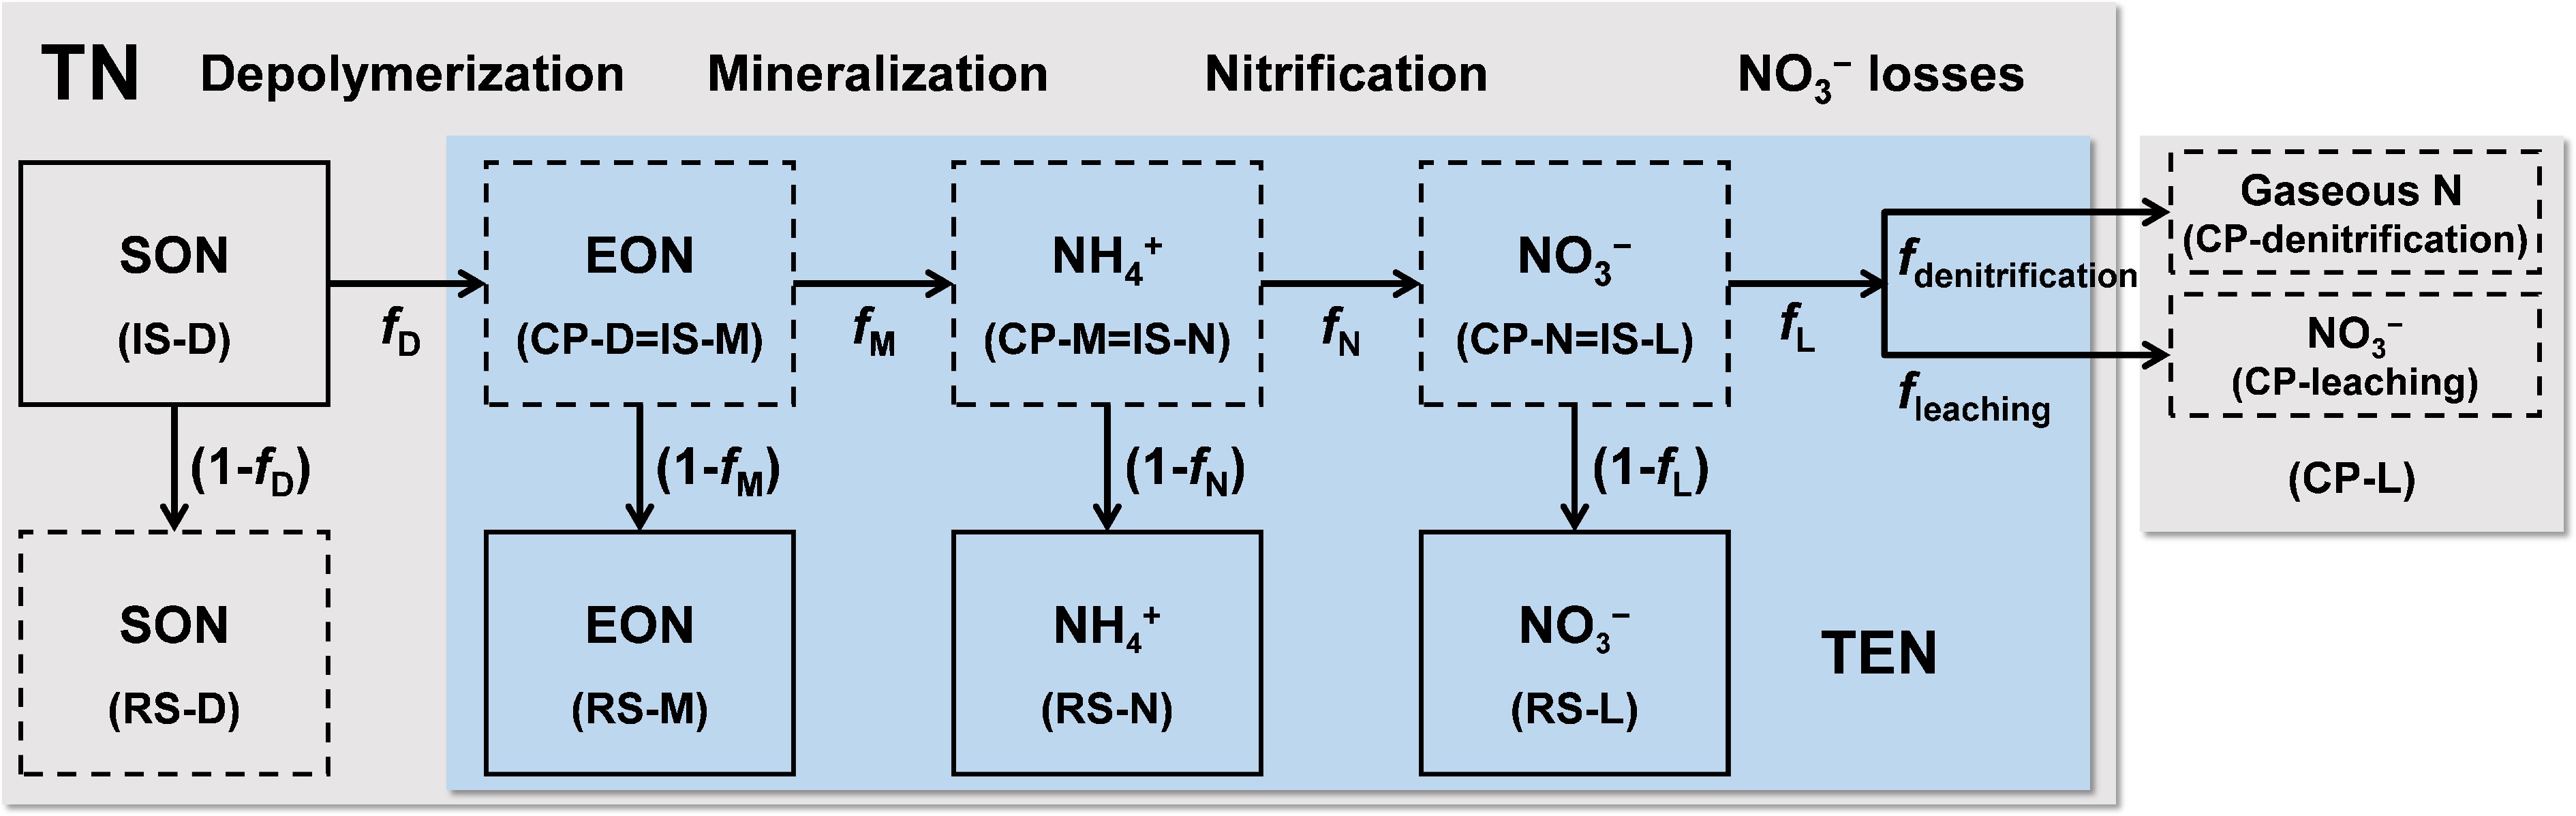
Figure 5.
Conceptual diagram of soil nitrogen transformation process model (modified from Xu et al.[43]). D: Depolymerization; M: Mineralization; N: Nitrification; TN: Total nitrogen; SON: Soil organic nitrogen; EON: Extractable organic nitrogen; TEN: Total extractable nitrogen. IS: The initial substrate of the nitrogen conversion process; CP: The reaction products of the nitrogen conversion process; RS: Remaining substrates in the nitrogen conversion process. f: The proportion of reaction products in the initial substrate for each nitrogen conversion process. 1-f: The proportion of residual substrates in the initial substrate for each nitrogen conversion process.
Recent advances in compound-specific isotope analysis (CSIA) of amino acids and DON have significantly refined the ability to trace and quantify the transformation of soil organic nitrogen. By targeting individual amino acids, CSIA enables researchers to distinguish the fates of different N pools-such as 'source' amino acids that retain isotopic signatures of original plant material vs 'trophic' amino acids that reflect microbial reworking-thereby providing more mechanistic insight into depolymerization, ammonification, and microbial assimilation processes. For instance, Philben et al.[44] used amino acid δ15N to demonstrate that no significant N isotope fractionation occurs during SON depolymerization and ammonification, shifting the explanation for soil δ15N depth profiles from decomposition-driven fractionation toward mechanisms like microbial necromass accumulation and mycorrhizal N transfer. Similarly, Enggrob et al.[45] employed compound-specific isotope analysis (AA-SIP) and phospholipid fatty acid stable isotope probing (PLFA-SIP) to reveal that large organic N compounds are rapidly assimilated, particularly by gram-positive bacteria, without extended protection by mineral sorption. These CSIA-based approaches have thus redefined the understanding of organic N turnover rates, microbial pathways, and the role of molecular size and structure in N transformation, emphasizing the importance of anabolic incorporation over traditional decomposition-centric models. Integrating CSIA into soil N transformation studies not only provides isotopic precision at the molecular level but also enhances the detection of active microbial players and their metabolic strategies, advancing a more dynamic, process-oriented view of soil N cycling.
The dual-isotope approach using δ15N and δ18O has become a cornerstone for distinguishing between nitrification and denitrification as sources of nitrous oxide (N2O) in agricultural soils[46]. The principle relies on the distinct isotopic fractionation patterns associated with each pathway. During denitrification, microbes preferentially reduce NO3− to N2O, enriching the remaining NO3− pool and the subsequently produced N2O in the heavier 15N isotope[10]. This leads to pronounced isotopic fractionation, often resulting in N2O depleted in 15N relative to the substrate. In contrast, N2O produced via nitrification (particularly nitrifier denitrification) undergoes more complex fractionation but usually carries an isotopic signature closer to that of the original NH4+ substrate[10]. The δ18O value provides a further critical constraint. N2O from denitrification inherits two oxygen atoms from the NO3− pool, which itself reflects a mixture of soil water O (through nitrification) and atmospheric O (from microbial processes)[47]. N2O from nitrification, however, incorporates one oxygen atom from atmospheric O2, and one from soil water[47]. By plotting δ15N against δ18O, researchers can often separate the two pathways; N2O from nitrification tends to have lower δ18O values (closer to water) while denitrification-derived N2O has higher δ18O values (closer to the enriched soil NO3− pool). However, challenges remain, as the 'crossover' of signatures can occur, and the isotopic endmembers are not always distinct[48], requiring complementary techniques like inhibitor methods or analysis of intramolecular 15N site preference (SP) for definitive attribution[49].
Recent advancements are refining the understanding of the N cycle by characterizing the δ15N signatures of reactive nitrogen gases beyond N2O, specifically NH3 and NOx, from wetland ecosystems. Managed wetlands, such as rice paddies, exhibit distinct isotopic fingerprints compared to natural wetlands due to the application of synthetic fertilizers, which have a characteristic δ15N value near 0‰. Studies, such as those by Ti et al.[50], have begun to quantify these differences, revealing that volatilized NH3 from fertilized paddies is significantly depleted in 15N. However, as the volatilization continues, the δ15N of the remaining NH4+ substrate increases. Consequently, the NH3 volatilized from this progressively enriching pool also exhibits a correspondingly higher δ15N value[50]. Applying this mechanistic understanding to wetland ecosystems, it can be deduced that natural marshes, which are characterized by high organic matter content and well-developed nitrogen cycling, tend to possess a soil organic nitrogen pool and a resulting NH4+ pool that is relatively enriched in 15N[51]. Therefore, NH3 from natural marshes reflects the more enriched soil organic matter pool, as the δ15N signature of the emitted NH3 is fundamentally tied to the isotopic composition of its source material. Similarly, NOx from wetland soils, produced mainly via nitrification, carry an isotopic imprint of its NH4+ precursor and subsequent fractionation during diffusion and oxidation. Building a robust database of these source-specific δ15N values for NH3 and NOx is critical for atmospheric chemistry models. It allows for more precise isotopic constraints on regional nitrogen deposition, and facilitates the apportionment of wetland-derived contributions to atmospheric aerosol formation and downwind nutrient loading, which were previously poorly quantified.
-
NO3− is a crucial form of bioavailable nitrogen. Studies on crops and model plants have revealed that NO3− acts as a key signaling molecule in plant metabolism, regulating numerous physiological functions. However, elucidating the sources, availability, uptake, and enzymatic reduction capacity of NO3− in natural terrestrial plants, and their responses to anthropogenic nitrogen pollution, remains challenging. This hinders the assessment of vegetation community structure, functional evolution, and climate-environment feedback in terrestrial ecosystems. Liu et al.[52] improved pretreatment methods for denitrifying bacteria and developed nanomolar-scale N and O isotope analysis techniques for plant NO3−. Their work demonstrated the inducible activity of moss NO3− reductase and revealed that moss δ15N is controlled by the stoichiometric relationship between reduced nitrogen and NO3−. By constructing a non-steady-state open-system isotope model, they quantified moss NO3− absorption, reduction fluxes, and their contributions to total nitrogen at varying time steps[53], thereby enhancing the accuracy of moss isotope monitoring for atmospheric nitrogen pollution[54].
The Arctic tundra, a critical terrestrial ecosystem, stores approximately twice as much carbon as the atmospheric pool in its permafrost. As climate warming and N pollution alter N availability, plant N utilization has become pivotal in regulating carbon dynamics and climate feedback. Due to low soil pH and temperature, soil nitrification rates and plant NO3− were historically undetectable, leading to the neglect of plant NO3− utilization. Liu et al.[8] established highly sensitive methods for detecting plant NO3− concentration and isotopes (Fig. 6). Using tissue-specific NO3− content and isotopic signatures, they demonstrated that Arctic tundra plants actively absorb and utilize soil NO3− (Fig. 6). By incorporating δ15N fractionation scenarios across four mycorrhizal absorption pathways into an isotope mass balance model, they found that NO3− contributes an average of one-third to total plant nitrogen[8]. This challenges traditional perceptions of N availability in Arctic tundra plants and holds significant implications for advancing the understanding of carbon and N dynamics in the region.
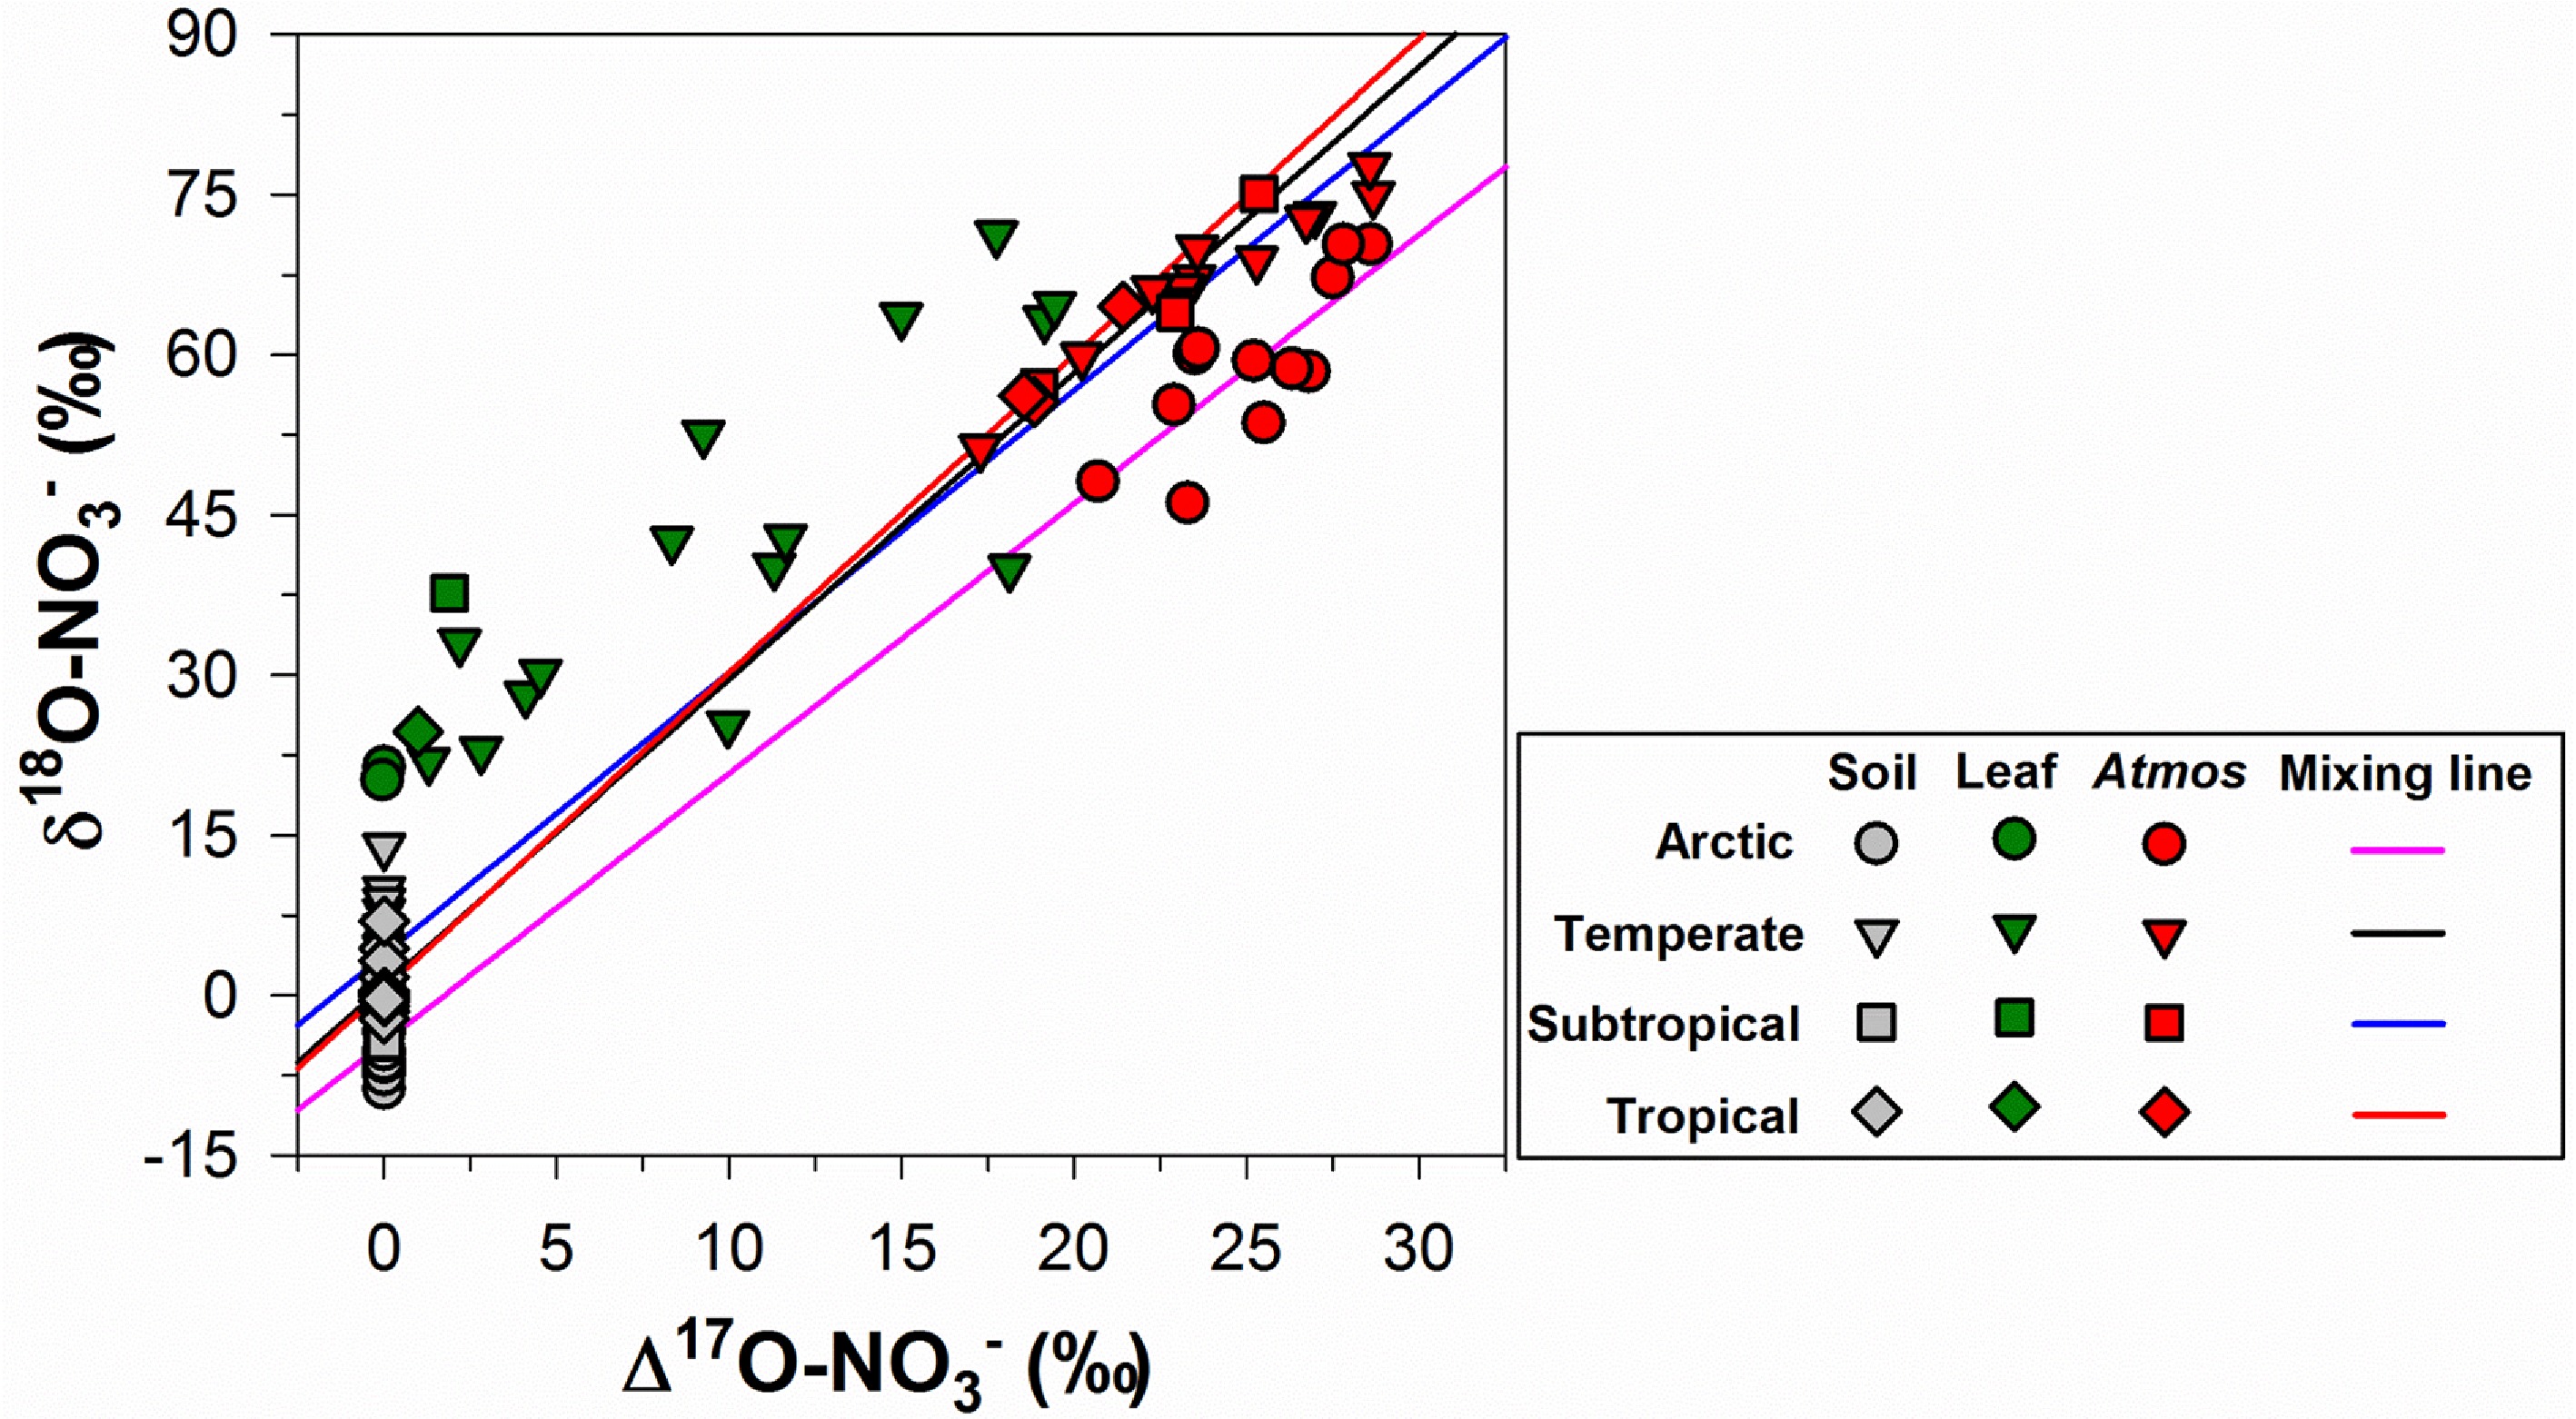
Figure 6.
Distribution of Δ17O and δ18O in nitrates of atmosphere-plant-soil systems (modified from Liu et al.[8]).
For in situ nitrogen preference assessment, Liu et al.[55] pioneered an isotopic diagnostic method. Applying this to invasive plants in southwestern China (Ageratina adenophora and Chromolaena odorata), they revealed that these species exhibit high N uptake capacity and a preference for energetically cheaper NH4+, which intensifies with invasion severity[56]. This suggests that soil NH4+ enrichment from human activities is a key driver of their invasion and expansion[56].
The question of whether plants directly acquire significant quantities of DON, particularly amino acids, has been a subject of considerable debate, fueled by contrasting findings. Early groundbreaking studies provided compelling evidence for this pathway. Näsholm et al.[57] demonstrated through a field experiment in boreal forests that diverse plants, including ectomycorrhizal trees and ericoid-mycorrhizal shrubs, could take up intact dual-labeled glycine, with conservative estimates suggesting 42%−91% of absorbed glycine-N remained organic. The strong correlation between 13C and 15N in plant roots was pivotal, offering clear evidence of direct assimilation that bypassed microbial mineralization. Similarly, Chapin et al.[58] showed that the tundra sedge Eriophorum vaginatum not only preferred amino acids over ammonium but also exhibited high-affinity uptake systems and, crucially, co-assimilated the 14C label from amino acids, indicating intact uptake. However, the broader ecological significance of this pathway has been challenged. Jones et al.[59] critically reviewed the evidence, highlighting key methodological constraints and ecological realities that may limit DON's role as a primary N source. They argued that rapid microbial mineralization often outpaces plant uptake, that diffusion kinetics favor inorganic N forms such as NO3−, and that plants are generally poor competitors with soil microbes in the short term. They further hypothesized that root amino acid transporters might primarily function in recapturing root-exuded N rather than acquiring new soil-derived DON.
To resolve these contrasting perspectives, and quantify the relative importance of direct organic N uptake under realistic conditions, advanced techniques like CSIA of amino acids are essential. CSIA builds on the dual-labeling approach by analyzing the stable isotope ratios (δ13C, δ15N) of individual amino acids in plant tissues. This allows for a more nuanced discrimination: if a plant directly takes up an intact, dual-labeled amino acid, the isotopic 'fingerprint' (the coupled 13C–15N signature) of that source molecule can be preserved or reflected in the plant's own synthesized amino acids. In contrast, if the plant assimilates N only after microbial mineralization, where microbes break down the organic molecule, releasing NH4+/NO3− and respiring CO2, the C and N atoms are decoupled. The plant's amino acids would then be built from N and C derived from separate, isotopically distinct pools, erasing the original coupled signature. Furthermore, CSIA can help clarify the role of mycorrhizal fungi, a critical component in many ecosystems studied[57]. Mycorrhizal fungi process, transfer, and synthesize amino acids for their host plants, potentially altering the isotopic patterns of these plants. By distinguishing fungal-derived amino acid signatures from those directly taken up by roots, CSIA can elucidate the relative contributions of direct root uptake vs mycorrhizal-mediated acquisition. By integrating CSIA with field tracer studies[57], and considering methodological critiques[59], researchers can move beyond simple detection of the pathway towards a quantitative, mechanistic understanding of plant N sourcing strategies, plant-microbe competition, and the actual contribution of organic N to plant N budgets across diverse ecosystems.
Plant N utilization mechanisms are critical for evaluating carbon sequestration and species composition. Non-N-fixing plants primarily absorb soil NO3−, NH4+, and extractable organic nitrogen (EON), assimilating these into leaves, stems, and roots (Fig. 7). However, quantifying contributions of soil NO3−, NH4+, and EON to plant-utilized nitrogen (PUN) has long been challenging, obscuring their drivers and variability.
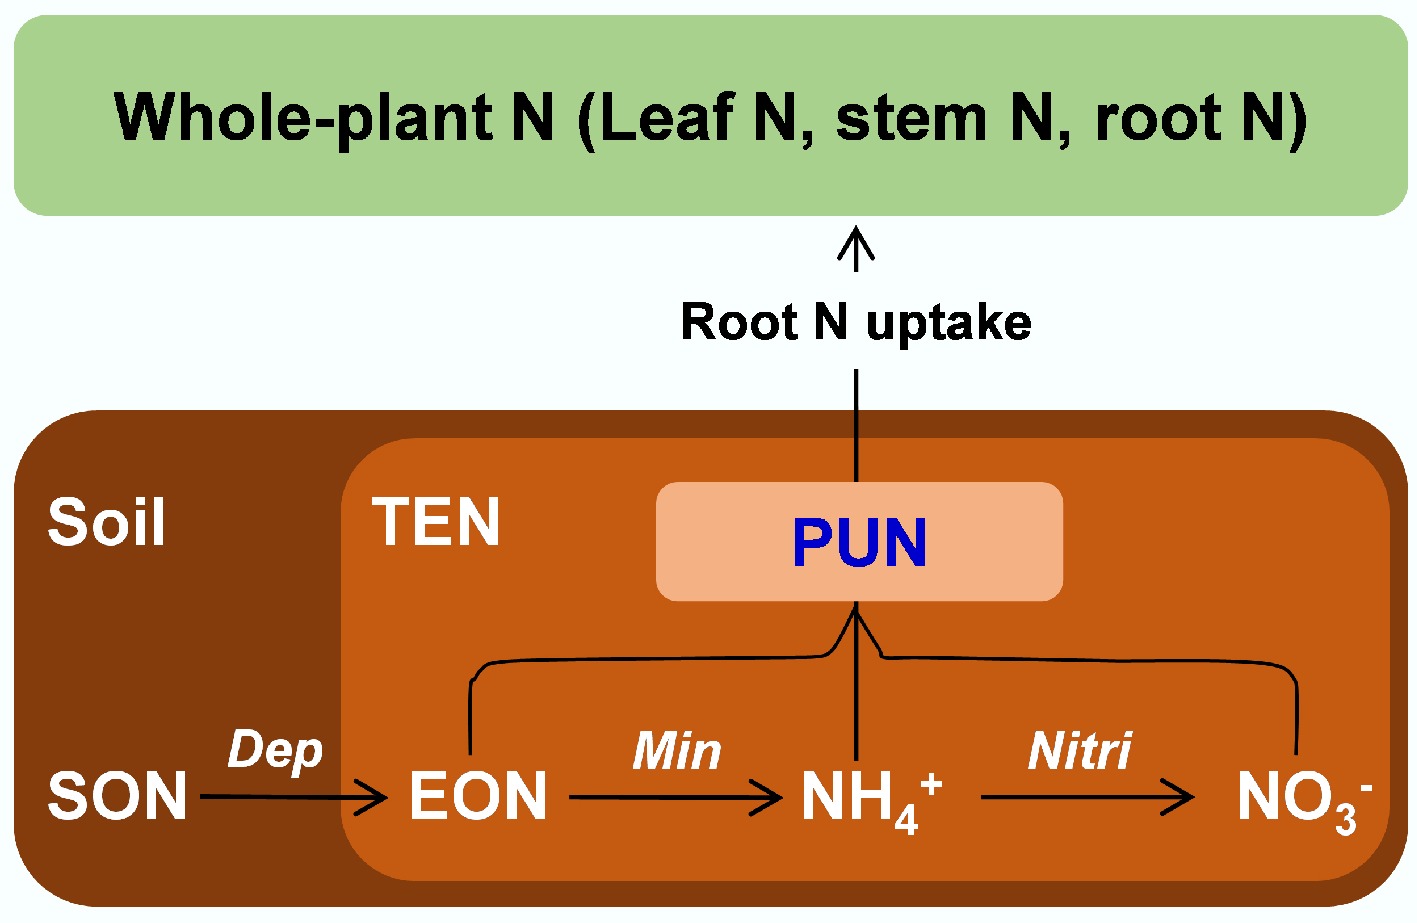
Figure 7.
Sources and processes of PUN in terrestrial ecosystems (modified from Hu et al.[9]). PUN: plant-used N, SON: soil organic N, TEN: total extractable N, EON: extractable organic N, NH4+: ammonium, NO3−: nitrate, Dep: depolymerization, Min: mineralization, Nitri: nitrification.
Hu et al.[9] analyzed global δ15N values of leaves, stems, and roots to establish relationships between total plant nitrogen δ15N and leaf δ15N across herbs, shrubs, and trees. They further quantified the isotopic effects of N assimilation and mycorrhizal uptake under varying climates and constrained δ15N values of PUN using leaf δ15N[9]. By integrating observed soil NO3−, NH4+, and EON δ15N data, they simulated soil endmember δ15N values and applied mass balance to determine global PUN source contributions[9]. Results showed distinct δ15N differences between PUN, leaf nitrogen, and total extractable nitrogen (TEN), indicating that leaf and TEN δ15N cannot reliably represent absorbed nitrogen. Global PUN sources exhibited nonlinear correlations with mean annual temperature (MAT) but no clear link to nitrogen deposition, identifying temperature, not nitrogen pollution, as the primary control (Fig. 8). This isotopic approach revealed novel mechanisms in plant nitrogen utilization, offering critical insights into how global changes affect vegetation diversity and carbon sequestration.
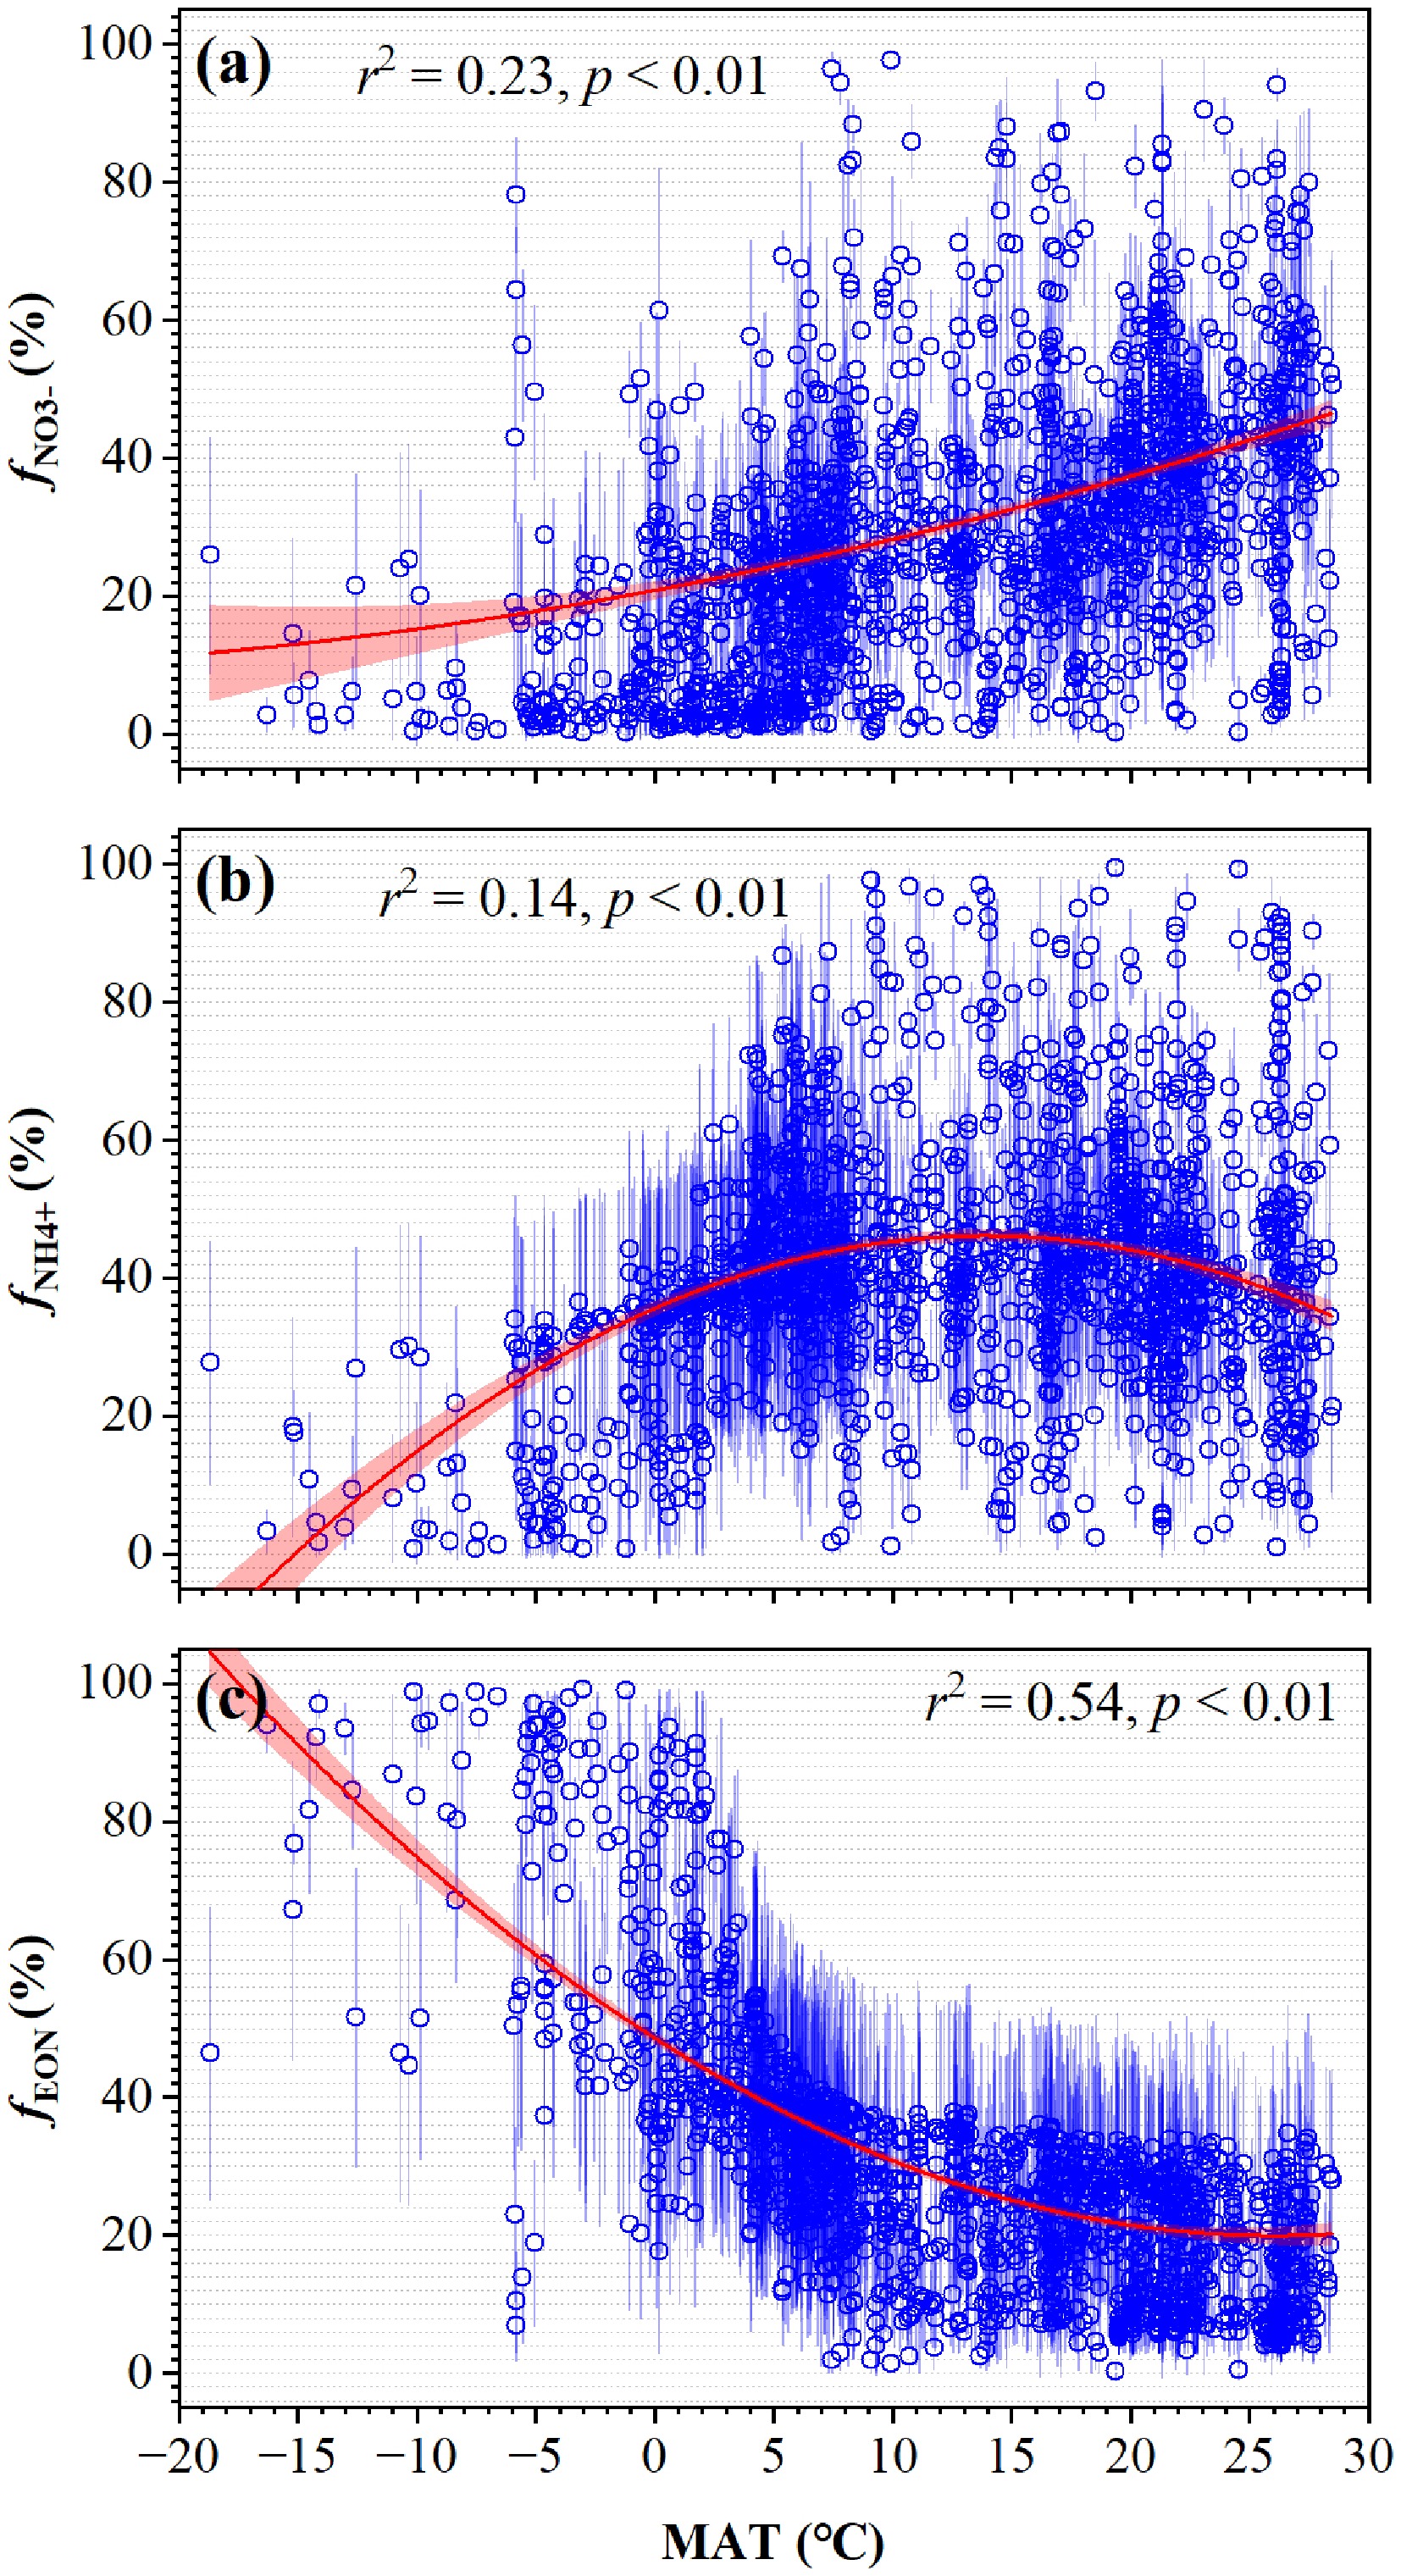
Figure 8.
Variations of soil N-source contributions to PUN with MAT (modified from Hu et al.[9]). (a) $f_{\rm NO_3^-} $, (b) $f_{\rm NH_4^+} $, and (c) $f_{\rm EON} $ are fractional contributions of soil NO3−, NH4+, and EON to PUN, respectively. The 0.1° (latitude) × 0.1° (longitude) grid-based mean ± SD values are shown. The regression was analyzed by fitting effects with 95% confidence intervals.
Based on the fractional contribution of these three N forms to total N in global terrestrial plants[9], the theoretical C costs for plant assimilation of three N forms (5.81, 4.32, and 2.16 g C/g N for NO3−, NH4+, and DON, respectively)[60], and global data on terrestrial plant C/N and gross primary productivity (GPP), Hu et al.[61] estimated the gross C consumed for N assimilation by global terrestrial plants to be 208 ± 12 Tg C yr−1 (Fig. 9). This value unexpectedly exceeds annual C emissions from forest fires and degradation (155 Tg C yr−1)[62], and is comparable in magnitude to forest C sequestration driven by atmospheric N deposition (240 Tg C yr−1[63]; 310 Tg C yr−1[64]). Previous studies have mainly emphasized the positive effects of N on plant growth and C sequestration, while the metabolic C costs of plant N assimilation have lacked detailed assessment. This gap represents a long-standing 'blind spot' in terrestrial C cycle research. Their findings indicate that this hidden C expenditure should be incorporated into C balance accounting.
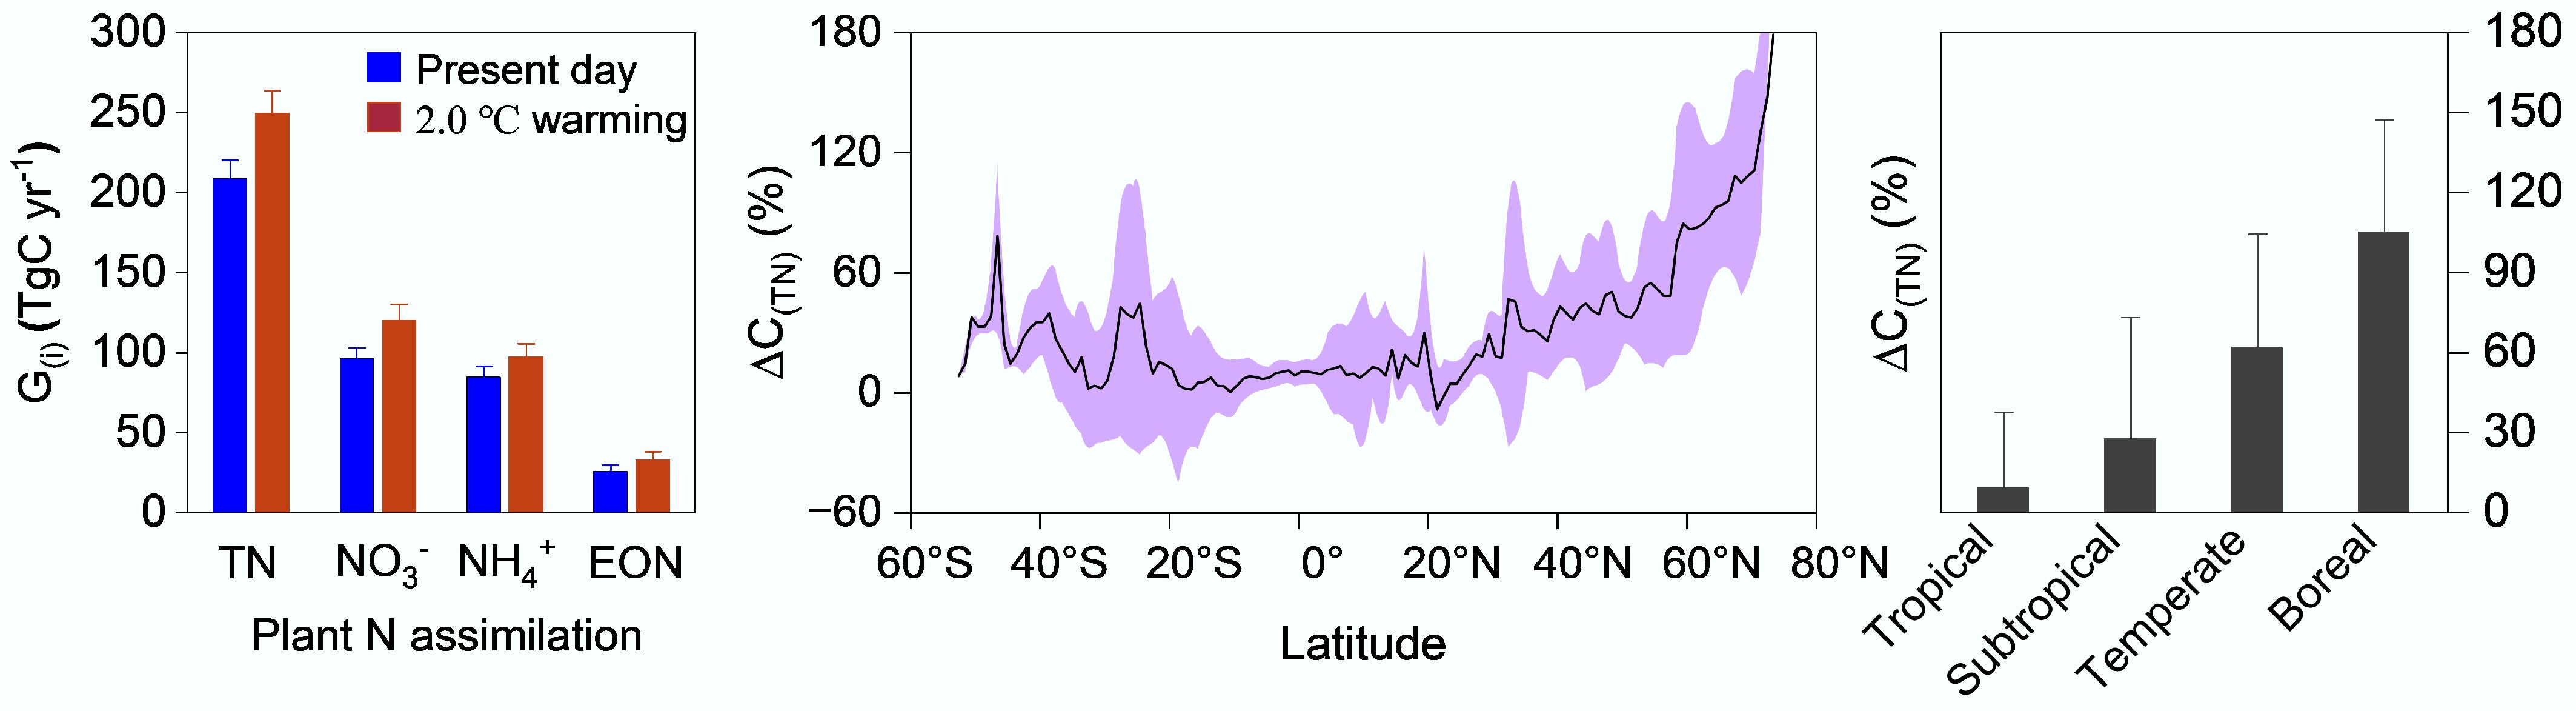
Figure 9.
Carbon consumption for nitrogen assimilation by global terrestrial plants and its response to climate warming (modified from Hu et al.[61]). (G(i) represents the gross C consumption associated with the assimilation of total N (TN), nitrate (NO3−), ammonium (NH4+), and extractable organic N (EON) by global terrestrial plants. ΔC(TN) denotes the relative change in C consumption for TN assimilation under the 2.0 °C warming scenario compared with the present-day.
On the other hand, climate warming can enhance soil N transformations, increase the supply of bioavailable N (particularly inorganic forms such as nitrate and ammonium), and raise plant N demand due to accelerated growth. These changes may increase the proportion of inorganic N assimilated by plants and the associated C consumption, thereby elevating the total C cost of plant N assimilation (Fig. 10)[61]. To test this hypothesis, Hu et al.[61] simulated the contributions of different N sources under a 2.0 °C warming scenario, and combined with corresponding simulations of plant C/N and GPP[65], estimated that the total C consumed for N assimilation by global terrestrial plants under this warming scenario would reach 249 ± 15 Tg C yr−1[61]. This represents an average increase of 47% (41 ± 19 Tg C) compared with the present-day level (208 ± 12 Tg C yr−1), with increases of 9%, 62%, and 105% in tropical, temperate, and boreal regions, respectively (Fig. 9). Climate warming thus enhances soil inorganic N availability and its contribution to plant total N assimilation. However, it also increases the metabolic C expenditure associated with plant N assimilation, offsetting part of the photosynthetic C gain. This effect is particularly pronounced at high latitudes (Fig. 9). This study reveals new mechanisms of coupling between vegetation C-N cycling processes and their climate responses and feedbacks, providing novel evidence for refined accounting of the global C balance and for formulating future C-neutral and climate-response strategies.

Figure 10.
Mechanisms of plant nitrogen assimilation and its carbon costs in response to climate warming (modified from Hu et al.[61]).
-
The nitrogen output in forest systems primarily manifests as gaseous N emissions dominated by denitrification products (e.g., N2O and N2), and hydrological leaching of nitrogen (mainly as NO3−). Numerous studies have analyzed the intensity of denitrification processes, their contributions to N2O emissions, and influencing factors through gas flux observations, functional gene analysis of denitrifying microorganisms, and enzyme activity measurements[66]. However, research on denitrifying microorganisms remains challenging due to the complexity of denitrification processes and the diversity of microbial participants. Over 80 bacterial genera, along with certain archaea, fungi, and actinomycetes, may engage in partial or complete denitrification steps, with many microorganisms harboring multiple functional genes. Additionally, technical difficulties in quantifying N2 emission rates and insufficient research on the temperature sensitivity of gaseous nitrogen losses have constrained model simulations of terrestrial ecosystem responses to global warming.
Yu et al.[67] developed a 15N-labeling technique to quantify soil N2O and N2 production rates, investigating the temperature sensitivity of denitrification processes in 18 forest soils in China, identifying key drivers. By integrating laboratory-derived temperature-sensitivity parameters into the ecosystem process model (DyN-LPJ), they simulated global forest soil denitrification responses to future warming scenarios. Their findings revealed exponential increases in N2O and N2 production rates with temperature across Chinese forests, exhibiting distinct geographical patterns[67]. Notably, the Q10 values (temperature sensitivity coefficients) for N2O (2.1 ± 0.5) and N2 (2.6 ± 0.6) showed no correlation with soil physicochemical properties, microbial indices, or climatic factors, indicating consistent temperature sensitivities across different climatic zones. Model projections under the SSP2-4.5 and SSP5-8.5 scenarios predicted that global forest soil N2O emissions would rise from 3.8 Tg N yr−1 (1991–2000 baseline) to 6.3–7.8 Tg N yr−1 by 2100, with N2 emissions increasing from 81.9 to 121.1–133.0 Tg N yr−1[67]. This provides critical parameters for improving model simulations of carbon-nitrogen coupling processes and their climate feedbacks. The isotopic evidence of enhanced denitrification temperature sensitivity under warming scenarios, as revealed by δ15N and δ18O patterns in soil N2O, has informed the formulation of climate-smart agricultural protocols. A key recommended strategy is to adjust fertilizer application timing in response to soil temperature thresholds. This demonstrated practice effectively reduces N2O emissions while maintaining crop yields.
As the most mobile N form, NO3− dominates hydrological N losses through leaching. Forest NO3− leaching not only elevates groundwater NO3− concentrations, causing eutrophication and water quality degradation, but also accelerates soil acidification and mobilizes toxic metals like aluminum. The NO3− leaching flux serves as a key indicator of ecosystem nitrogen status. Guo[68] investigated N cycling in high-N-deposition forests in the Beijing-Tianjin-Hebei region through streamwater chemical and isotopic analyses. The study developed isotope mass balance models to quantify N transformation fluxes, revealing that NO3− accounted for 64.6% of total dissolved N losses. Δ17O analysis demonstrated that atmospheric NO3− contributed directly to streamwater (10.8%–14.2%) with elevated N deposition, following an exponential growth pattern[68]. Complementary work by Huang et al.[69] using Δ17O signatures in precipitation (18.3‰–32.7‰), and streamwater (−0.1‰–4.8‰) quantified annual N losses at 6.9 kg N ha−1 yr−1 (4.2–8.9 kg range), exceeding the 5 kg N ha−1 yr−1 threshold for N saturation in temperate forests. Using the natural abundance isotope method, Fang et al.[70] calculated that the gaseous N loss at the watershed scale was 3.8 kg N ha−1 yr−1, accounting for 35% of the total N loss (gaseous N loss + NO3− loss, 10.7 kg N ha−1 yr−1). Such isotopic approaches enable precise quantification of ecosystem-scale nitrification rates, advancing the understanding of internal nitrogen cycling processes and ecosystem nitrogen status.
-
The anthropogenic amplification of Nr production since the Industrial Revolution has profoundly altered global N cycling, with cascading impacts on ecosystem functioning, climate feedback, and environmental sustainability. While isotopic techniques have revolutionized the understanding of N sources, transformations, and losses across atmospheric, terrestrial, and aquatic systems, critical knowledge gaps persist. Addressing these gaps will require interdisciplinary efforts integrating advanced isotopic methods, process-based modeling, and cross-scale observations to refine predictive frameworks and inform sustainable management strategies. Key priorities for future research are outlined as follows:
Advancing isotopic techniques for source-pathway-process resolution
-
The development of multi-isotope systems (e.g., δ15N, δ18O, Δ17O) and their application across Nr species (NH3, NOx, NO3−, N2O, organic N) must be prioritized to resolve complex N cycling dynamics. For example: (1) Despite progress in constraining combustion-related NH3 and non-fossil NOx contributions, isotopic signatures of primary sources remain poorly characterized. Systematic δ15N and Δ17O measurements across emission categories (e.g., agricultural soils, wastewater, marine microbial activity) are critical for refining source apportionment models. (2) Isotopic fractionation during atmospheric Nr transformation (e.g., NH3 volatilization, NOx oxidation) and deposition processes requires mechanistic quantification. Controlled laboratory experiments paired with field observations are needed to disentangle kinetic vs. equilibrium isotopic effects under varying environmental conditions (e.g., humidity, oxidant levels). (3) Expanding isotopic monitoring networks in underrepresented regions (e.g., tropics, polar zones) and ecosystems (e.g., wetlands, coastal systems) will address geographic biases and improve global Nr flux estimates.
Mechanistic understanding of N transformation processes
-
Isotopic techniques must bridge gaps between microbial activity, process rates, and ecosystem-scale fluxes: (1) While models like Xu et al.'s[43] multi-process framework have advanced soil N transformation quantification, integrating functional gene data with isotopic tracers could resolve microbial regulation of depolymerization, mineralization, and nitrification-denitrification coupling. (2) The role of mycorrhizal associations in modulating plant N preferences (NO3− vs NH4+ vs organic N) remains unclear. Compound-specific δ15N analysis of amino acids and root exudates could elucidate microbial mediation of N assimilation and the response of N assimilation to N deposition. (3) Microbial Nr emissions from aquatic environments (e.g., rivers, oceans) are poorly constrained. Isotopic fingerprinting of marine NOx sources (e.g., nitrification vs sedimentary fluxes) and their δ15N signatures, as pioneered by Song et al.[26], should be expanded to coastal and open-ocean regions.
Integrating isotopes into next-generation biogeochemical models
-
Current models often oversimplify N-cycle complexity, limiting their predictive power under global change scenarios: (1) Developing models that simulate isotopic signatures (e.g., δ15N of NH4+, Δ17O of NO3−) alongside Nr fluxes can validate process representations. (2) Bridging micro-scale isotopic process data (e.g., soil nitrification rates) with macro-scale models requires hierarchical parameterization. Machine learning could identify key drivers of isotopic variability (e.g., soil pH, C:N ratios) to upscale local findings. (3) Models must account for the interactive effects of warming, CO2 fertilization, and N deposition on N cycling. For instance, how will rising temperatures alter the δ15N of plant-available N in Arctic tundra[8], and what are the implications for carbon sequestration?
Coupling nitrogen and carbon cycles in a changing climate
-
The interdependence of N and C cycles demands co-tracing approaches: (1) Isotopic labeling (e.g.,13C–15N dual tracers) can quantify how Nr inputs modulate soil organic matter decomposition (priming effects) and plant C allocation. (2) Mycorrhizal fungi regulate both N acquisition and soil C stabilization. Compound-specific isotope analysis (CSIA) of fungal biomarkers (e.g., chitin) could reveal their role in C-N coupling under global change. (3) As Arctic warming accelerates permafrost thaw, isotopic tracking of N mobilization (e.g., DON leaching, nitrification) and its impact on CO2/CH4 emissions will clarify climate feedback. Furthermore, the application of isotopic techniques in Southern Hemisphere tropical ecosystems, which are often understudied, represents a critical frontier. These regions are experiencing rapid land-use change and biological invasions. Isotopic tracers (e.g., δ15N, δ13C) should be used to investigate how exotic invasive plants, which often exhibit distinct N-acquisition strategies and higher N-use efficiency, alter soil N cycling and carbon storage. Key questions include: Do these exotics enhance nitrification rates, modify the δ15N of soil organic matter, and ultimately trigger positive or negative feedbacks to ecosystem carbon sequestration? Understanding these dynamics is essential for predicting the resilience of vulnerable tropical ecosystems to simultaneous global change pressures.
-
Not applicable.
-
The authors confirm their contributions to the paper as follows: Wei Song: investigation, writing original draft; Xue-Yan Liu: study conception and design, investigation, writing original draft. Both authors reviewed the results and approved the final version of the manuscript.
-
The datasets generated during and/or analyzed during the current study are available from the corresponding author upon reasonable request.
-
This study was supported by the National Natural Science Foundation of China (No. 42322301).
-
The authors declare that they have no conflict of interest.
-
Full list of author information is available at the end of the article.
- Copyright: © 2026 by the author(s). Published by Maximum Academic Press, Fayetteville, GA. This article is an open access article distributed under Creative Commons Attribution License (CC BY 4.0), visit https://creativecommons.org/licenses/by/4.0/.
-
About this article
Cite this article
Song W, Liu XY. 2026. Isotopic insights into the anthropogenic nitrogen cycle: a review. Nitrogen Cycling 2: e008 doi: 10.48130/nc-0025-0020 

Isotopic insights into the anthropogenic nitrogen cycle: a review
- Received: 04 November 2025
- Revised: 02 December 2025
- Accepted: 23 December 2025
- Published online: 21 January 2026
Abstract: Anthropogenic activities since the Industrial Revolution have drastically amplified reactive nitrogen (Nr) emissions, disrupting global nitrogen cycling and triggering cascading environmental impacts, including biodiversity loss, eutrophication, and climate feedback. These perturbations, often irreversible, redistribute Nr across ecosystems via atmospheric deposition, soil processes, and hydrological transport. Nitrogen and oxygen isotopes (δ15N, δ18O, and Δ17O) provide critical insights into Nr sources and transformation pathways by distinguishing anthropogenic input from natural ones and tracing process-specific fractionation. This review synthesizes advances in δ15N applications across five domains: (1) Atmospheric Nr sources, resolving emission contributions via isotopic fingerprints; (2) N inputs via forest canopy throughfall, elucidating N interception and processing by vegetation; (3) Soil N transformations, quantifying microbial-driven fluxes and turnover; (4) Plant N utilization, assessing species-specific assimilation mechanisms; and (5) N output in forest ecosystems, tracking leaching and gaseous loss pathways. An integrated framework is proposed combining multi-isotope tracers (δ15N, δ18O, Δ17O), high-resolution monitoring, and process-based modeling to unravel cross-compartmental N fluxes. Such approaches address critical knowledge gaps in Nr legacies, ecosystem resilience thresholds, and climate-N feedback loops, thereby enabling the design of targeted mitigation strategies. By prioritizing spatially explicit datasets and isotopic integration across environmental interfaces, this framework can refine global N budgets and guide sustainable management of anthropogenic Nr cascades.