


-
Nitrous oxide (N2O) is a potent greenhouse gas with a 100-year Global Warming Potential (GWP100), 265 times that of carbon dioxide with a long atmospheric lifetime of 121 years. It is also the most significant ozone-depleting substance in the stratosphere[1]. Nitrogen fertilization was the dominant driver of N2O emission in agriculture[2,3], with acidic soils showing heightened sensitivity[4]. Globally, about two-thirds of the mitigation potential for soil N2O emissions (30% of direct soil emissions) could be realized in humid subtropical areas, particularly in gleysols and acrisols[5]. It suggests that acidic agricultural soils in humid subtropical regions represent significant potential for N2O mitigation.
Recently, biochar (BC) was reported to counteract soil acidity[6,7] and mitigate soil N2O[8,9]. The increase in soil pH due to BC application, accelerated soil nitrification and denitrification, which generally favored N2O production[10]. But the N2O/(N2O + N2) ratio decreased as soil pH increased due to changes in denitrification activity[11]. Soil pH showed a unimodal relationship with soil denitrifiers and N2O emission factors, with the highest values in moderately acidic (pH = 5.6–6.0) soils[12]. BC application was not, or only slightly, effective in mitigating N2O emissions[13,14] or altered N2O flux at a greater variation[15] in strongly acidic soils (pH < 5), compared to slightly acidic and neutral soils. The acid-buffering capacity of BC was an important aspect of N2O mitigation, which was not primarily due to a pH shift but to the 'electron shuttle' function that promotes N2O to N2[16]. Therefore, such contrasts complicate the BC impact on N2O emissions, and the liming effect requires separate assessment, especially in strongly acidic soils.
About 90% of N2O was produced by microbial processes in terrestrial and aquatic systems[2,17,18]. Almost all microbes involved in biogeochemical nitrogen cycling have the potential to catalyze N2O production[18−21]. Stable isotope labeling technologies could provide more information on N2O mediated by nitrification or denitrification in BC-amended soils. A reduction in the N2O/(N2 + N2O) ratio demonstrated that BC facilitated the final step of denitrification by using the15N gas-flux method[16,22]. However, the values of δ18O and δ15Nbulk of N2O will be affected by the isotopic composition of reactants like NO3− and NH4+. Recently, isotopic approaches using N2O signatures (δ15N, δ15NSP, and δ18O) have become available to identify N2O pathways without being affected by N2O precursors or the addition of substrates[17,23]. As a further development of the mapping approach, a new three-dimensional model integrated three N2O isotopic signatures in a Bayesian framework, and identified the nearest solution for
$r_{\rm N_2O} $ In this study, an incubation experiment was set up to measure soil-borne N2O fluxes and partition their sources. Afterwards, N2O-related microbial information was analyzed. It is hypothesized that: (1) the increase in soil pH achieved by adding BC to acidic soils cannot fully account for its effect on N2O emissions; and (2) the impact of BC on N2O emissions may vary across farmland with different land-use types.
-
Two acidic soils in proximity, namely upland soil (US), and paddy soil (PS), were collected from Liujiazhan in Yingtan City, Jiangxi Province, China (28°15' N, 116°55' E). The mean annual temperature was 18.4 °C, and the mean annual precipitation was 1,785 mm. The soils were classified as Orthic Acrisol according to the FAO soil classification, with Quaternary red clay parent material. The two soils from adjacent plots had different land-use types. Peanut was planted in upland soil, and rice was cultivated in paddy land, with an annual fertilization rate of 200–300 kg N ha−1. Surface soils (0–20 cm) were collected from four randomly selected plots (4 m × 4 m) without an O horizon. Roots and litter were removed, and the remaining soil was sieved (< 2 mm). The physicochemical properties of the two soils are listed in Table 1. The applied BC was produced from maize straw under an oxygen-limited condition at 450–500 °C (Qinfeng Zhongcheng Biochar New Material Ltd, Nanjing, China). The BC was ground to a particle size of 1 mm before incubation. The pH of the BC was 9.96; total C and N content were 643.1 and 8.1 g kg−1, respectively. The calcium oxide (CaO) used in the experiment was a normal laboratory reagent (CAS 1305-78-8).
Table 1. Soil properties of two studied soils after Biochar (BC), and CaO (Quicklime) amendment
Soil Treatment pH SOC (g C kg−1) TN (g N kg−1) DOC (mg C kg−1) C/N ratio US Control 4.87 ± 0.00 Cd 8.61 ± 0.80 Da 0.99 ± 0.00 Da 78.52 ± 2.44 Cb 8.72 ± 0.81 Da BC-1% 4.97 ± 0.04 C 13.07 ± 0.69 C 1.10 ± 0.01 C 48.80 ± 0.18 D 11.86 ± 0.49 C BC-3% 5.06 ± 0.06 B 21.52 ± 0.47 B 1.22 ± 0.03 B 91.77 ± 1.91 B 17.64 ± 0.92 B BC-5% 5.22 ± 0.01 A 31.07 ± 0.63 A 1.43 ± 0.02 A 103.15 ± 2.33 A 21.78 ± 0.58 A CaO-0.02% 5.04 ± 0.01 c 8.10 ± 0.75 a 0.97 ± 0.02 ab 92.75 ± 1.79 a 8.34 ± 1.00 a CaO-0.05% 5.29 ± 0.01 b 8.37 ± 0.54 a 0.94 ± 0.04 b 93.68 ± 0.58 a 8.88 ± 0.40 a CaO-0.08% 5.54 ± 0.04 a 7.99 ± 0.99 a 0.97 ± 0.01 ab 63.58 ± 0.60 c 8.21 ± 1.02 a PS Control 4.78 ± 0.02 Dc 13.40 ± 0.98 Da 1.53 ± 0.02 Ca 201.63 ± 3.67 Aa 8.77 ± 0.74 Da BC-1% 4.85 ± 0.02 C 17.62 ± 1.10 C 1.56 ± 0.02 C 164.60 ± 0.75 B 11.3 ± 0.68 C BC-3% 5.11 ± 0.02 B 25.38 ± 0.16 B 1.80 ± 0.02 B 142.83 ± 0.35 C 14.13 ± 0.21 B BC-5% 5.27 ± 0.04 A 35.29 ± 0.80 A 1.97 ± 0.04 A 163.10 ± 1.83 B 17.91 ± 0.39 A CaO-0.02% 4.87 ± 0.07 bc 12.94 ± 0.46 b 1.56 ± 0.02 a 171.47 ± 2.06 c 8.31 ± 0.28 a CaO-0.05% 4.97 ± 0.06 b 12.56 ± 0.24 c 1.48 ± 0.01 b 183.07 ± 1.36 b 8.46 ± 0.20 a CaO-0.08% 5.19 ± 0.05 a 11.34 ± 0.46 d 1.41 ± 0.03 c 161.73 ± 1.66 c 8.06 ± 0.50 a Data are expressed as the means ± SE (n = 3). Different capital letters indicate significant differences between BC treatments in the same soil (p < 0.05); different lowercase letters indicate significant differences between CaO treatments in the same soil (p < 0.05). SOC, soil organic carbon; TN, total nitrogen; DOC, dissolved organic carbon, C/N ratio, ratio of SOC to TN; US, upland soil; PS, paddy land soil; FS, forest land soil. A short-term incubation study (4 d) was designed to investigate the response of N2O emission to BC addition. To isolate the pH effect of BC on soil N2O emissions, different CaO addition gradients were applied simultaneously. The gradient addition rate of BC or CaO with three replicates was set to obtain a pH series at the end of the pre-incubation (40% water-holding capacity, 25 °C, 7 d), listed as the control (no BC or CaO, Control), BC-1%, BC-3%, BC-5%, CaO-0.02%, CaO-0.05%, and CaO-0.08%.
Briefly, 20 g (oven-dry weight basis) of US or PS was placed into a 250 mL Erlenmeyer flask to measure soil N2O fluxes. Soils were uniformly supplemented with urea (natural abundance) at 100 mg N kg−1 soil, followed by additional water supply (60% water-holding capacity for US; water-to-soil ratio of 1:1 for PS). Details of gas sampling and flux measurement are presented in Chu et al.[25]. Then, the source partition of the associated N2O experiment was conducted to calculate the relative proportions of N2O produced by each pathway. For the 500 mL flask, 100 g of US soil, or 50 g of PS soil were used to ensure the accuracy of stable isotope analysis (the N2O concentration needs to reach 385 ppb[26]). Then, flasks were sealed after daily vacuuming and ventilation with synthetic air (80% N2 + 20% O2), and incubated (25 °C, 4 d) between gas sampling events (0, 24, 48, and 96 h). Headspace gas samples for N2O production pathway analysis were collected at 48 h (US) and 24 h (PS) after urea application, based on the requirement that N2O concentration exceed 385 ppb for isotope analysis[26]. After resealing for 24 h, 80 mL of gas was extracted into a pre-evacuated serum bottle. In parallel, three additional soil microcosms were prepared for destructive sampling at the end of the incubation period.
Source partition of N2O production
-
The isotopic signatures of N2O, δ15Nbulk, δ15NSP, and δ18O were analyzed by Delta V plus IRMS (Thermo Fisher Scientific, Waltham, USA), fitted with five cups to analyze m/z 44, 45, and 46 of N2O molecules as well as m/z 30 and 31 of NO+ fragments. The analytical precision of δ15Nbulk, δ15NSP, and δ18O in the current IRMS was 0.3‰, 0.6‰, and 0.9‰, respectively. Further details on the isotopic analysis and N2O calculations were provided by Zhang et al.[27]. The N2O isotopic signatures, δ15Nα, δ15Nbulk, and δ15NSP, were calculated using Eqs (1) and (2).
$ {\delta }^{15}{N}^{bulk}=({\delta }^{15}{N}^{\alpha }+{\delta }^{15}{N}^{\beta })/2 $ (1) $ {\delta }^{15}{N}^{sp}={\delta }^{15}{N}^{\alpha }-{\delta }^{15}{N}^{\beta } $ (2) The novel Fractionation and Mixing Evaluation Model (FRAME,
https://malewick.github.io/frame/ ) was used to partition N2O sources, and estimate the extent of N2O reduction to N2 using Bayesian statistics. The probability distributions of proportional contributions were determined, allowing the simultaneous integration of multiple N2O isotopic signatures into a single model to find the nearest solution for the N2O mixing proportions and the residual fraction ($r_{\rm N_2O} $ Determination of soil properties
-
Soil pH was analyzed at a 2.5:1 (deionized water : dry soil, v : w) ratio using a pH meter (Quark Ltd, Nanjing, China). Soil organic carbon (SOC) concentration was measured by the wet digestion method with H2SO4-K2Cr2O7. Total nitrogen (TN) content was determined by the semi-micro Kjeldahl method using Se, CuSO4, and K2SO4 as catalysts. Dissolved organic C (DOC) was extracted with deionized water at a 5:1 water-to-dry soil ratio (v : w), and its content was measured using the Analyzer Multi N/C (Analytik Jena, Jena, Germany).
Quantitation of 16S rRNA, ITS, and nitrogen-related functional genes
-
Soil total DNA was extracted using the FastDNA Spin Kit for Soil (MP Biomedicals, Santa Ana, USA) following the manufacturer's instructions. DNA quality was assessed by ultraviolet absorbance (NanoDrop ND2000, Thermo Fisher Scientific, USA), and concentration was determined using the QuantiFluor dsDNA kit (Promega, USA).
The bacterial 16S rRNA and fungal ITS genes were amplified by quantitative polymerase chain reaction (qPCR, CFX96 Real-Time System, Bio-Rad Laboratories Inc., Hercules, CA, USA) using primer pairs of 515F/926R and ITS1F/ITS2R, respectively (further details are provided in Supplementary Table S2). Negative controls (sterile water instead of soil DNA template), and melting curve analysis were performed in triplicate synchronously in each batch of qPCR assays to confirm specific amplification. A serial dilution of the soil DNA solutions was used to assess whether the PCR assay was inhibited during the amplification[28].
Various key functional genes that mediate soil nitrogen cycling processes were quantified using high-throughput quantitative PCR assays, including ammonia-oxidizing archaea (AOA) amoA, ammonia-oxidizing bacteria (AOB) amoA, nirS, nirK, nosZI, and nosZII with extended phylogenies such as nirK2, nirK3, nirS2, and nirS3[29,30]. High-throughput quantitative PCR assays were run on the SmartChip Real-time PCR system (WaferGen Biosystems, Fremont, USA), further details are provided in Supplementary Table S3, and chip reaction systems are as described by Zheng et al.[29].
Microbial communities analysis
-
The Illumina HiSeq 2500 high-throughput sequencing platform was used for amplicon sequencing analysis of the V4−V5 region of the bacterial 16S rRNA gene, and the fungal ITS gene with primers of 515F/926R and ITS1F/ITS2R, respectively (Supplementary Table S2). PCR amplification was performed using primers with barcodes and PremixTaq (TaKaRa, Japan), and PCR products were recovered using a Gel Extraction Kit (E.Z.N.A.®, Omega, USA), and mixed to the same concentration. High-throughput sequencing library builds were performed according to the NEBNext® Ultra™ DNA Library PrepKit for Illumina following standard procedures. Results of Raw Reads were stored in the FASTQ file format. Amplicon sequencing was entrusted to Magigene Technology Co. (Guangdong, China). The high-throughput sequencing generated 16S rRNA and ITS gene sequences, which were deposited in the NCBI Sequence Read Archive database under Accession No. PRJNA673937.
Data and statistical analysis
-
The relevant calculations of N2O flux, cumulative N2O, N2 production rate, and the residual fraction of N2OD in products were provided in Supplementary Text S1. The raw data were quality-controlled using Fastp software (v0.23.2,
https://github.com/OpenGene/fastp ), with a window size set to 4 and mean base mass set to 20, to reject over-short sequences (length ≤ 200 bp) and to eliminate low-quality sequences (-q 15, -u 40). Primers were removed using Cutadapt (https://github.com/marcelm/cutadapt/ ) to obtain paired-end Clean Reads. The sequence was spliced on Usearch software (v11,www.drive5.com/usearch ). OTU (Operational Taxonomic Units) clustering analysis was conducted in Uparse, where sequences with ≥ 97% similarity were assigned to the same OTU, and the most frequent sequence was selected as the representative sequence for each OTU[31]. Silva (v132, for bacterial 16S rRNA genes,www.arb-silva.de ) and Unite (v8.0, for fungal ITS genes) databases were used to annotate species taxonomic information with confidence thresholds of 0.8[31,32].All statistical analyses were conducted on SPSS 26 (SPSS Inc., Chicago, USA), and Origin 2019 (OriginLab, Northampton, USA). Significant differences in soil properties, N2O flux, and cumulative N2O emissions among treatments within each soil type were evaluated using one-way ANOVA followed by least significant differences (LSD) at the 5% significance level. Correlations between microbial characteristics and N2O emissions from pathways were analyzed by linear regression models at a 5% significance level. Redundancy analyses (RDA) between the N2O production pathway and soil physicochemical properties were conducted on Canoco software (v5.0, Microcomputer Power, Ithaca, NY, USA).
-
The soil physicochemical properties of two different land-use types following treatment with BC and CaO are presented in Table 1. The initial pH of upland (US) and paddy (PS) soils was 4.87 and 4.78, respectively. The concentrations of SOC and TN in the US were significantly lower than those in PS. There was no significant difference in the C/N ratio between the two soils. Compared with Control, soil pH increased dramatically after BC or CaO addition. The highest pH was 5.22 and 5.54 in BC-5% and CaO-0.08% in US, and was 5.27 and 5.19 in BC-5% and CaO-0.08% in PS, respectively. The concentrations of SOC and TN and the C/N ratio significantly increased following BC addition in both US and PS, whereas little change was observed after CaO addition. DOC value for CaO-0.08% treatment showed an abrupt decrease compared with the control.
The abundances of N transformation-relevant genes in US soils were generally lower than those in PS soils (Fig. 1). In US soil, both BC and CaO treatments generally reduced gene abundance of amoA, nxrA, narG, napA, nirS, nirK, and ureC in N transformation, most significantly in aerobic nitrification, denitrification, and mineralization. But the BC amendment enlarged the relative quantitative advantage of nosZII (expressed as nosZII/(amoA + nxrA + narG + napA + nirS + nirK) ratio) from 0.49 ± 0.02 in the control to 0.71 ± 0.10 with the BC addition rate, implying a more favorable N2O reduction to N2. The nosZII/(amoA + nxrA + narG + napA + nirS + nirK) ratio slightly decreased from 0.48 ± 0.01 to 0.42 ± 0.07 in PS. Based on reported fungi capable of producing N2O[33], the community abundance of these fungi was calculated across different treatments (Supplementary Table S4). Following the BC addition, the relative abundance of Chaetomium, a genus known for its strong N2O-producing capacity of 99.9–206.9 nmol N2O mL−1 media day−1, significantly decreased in the US, whereas it increased in PS. The effects of CaO on microbial properties were significantly weaker than those observed with BC addition.
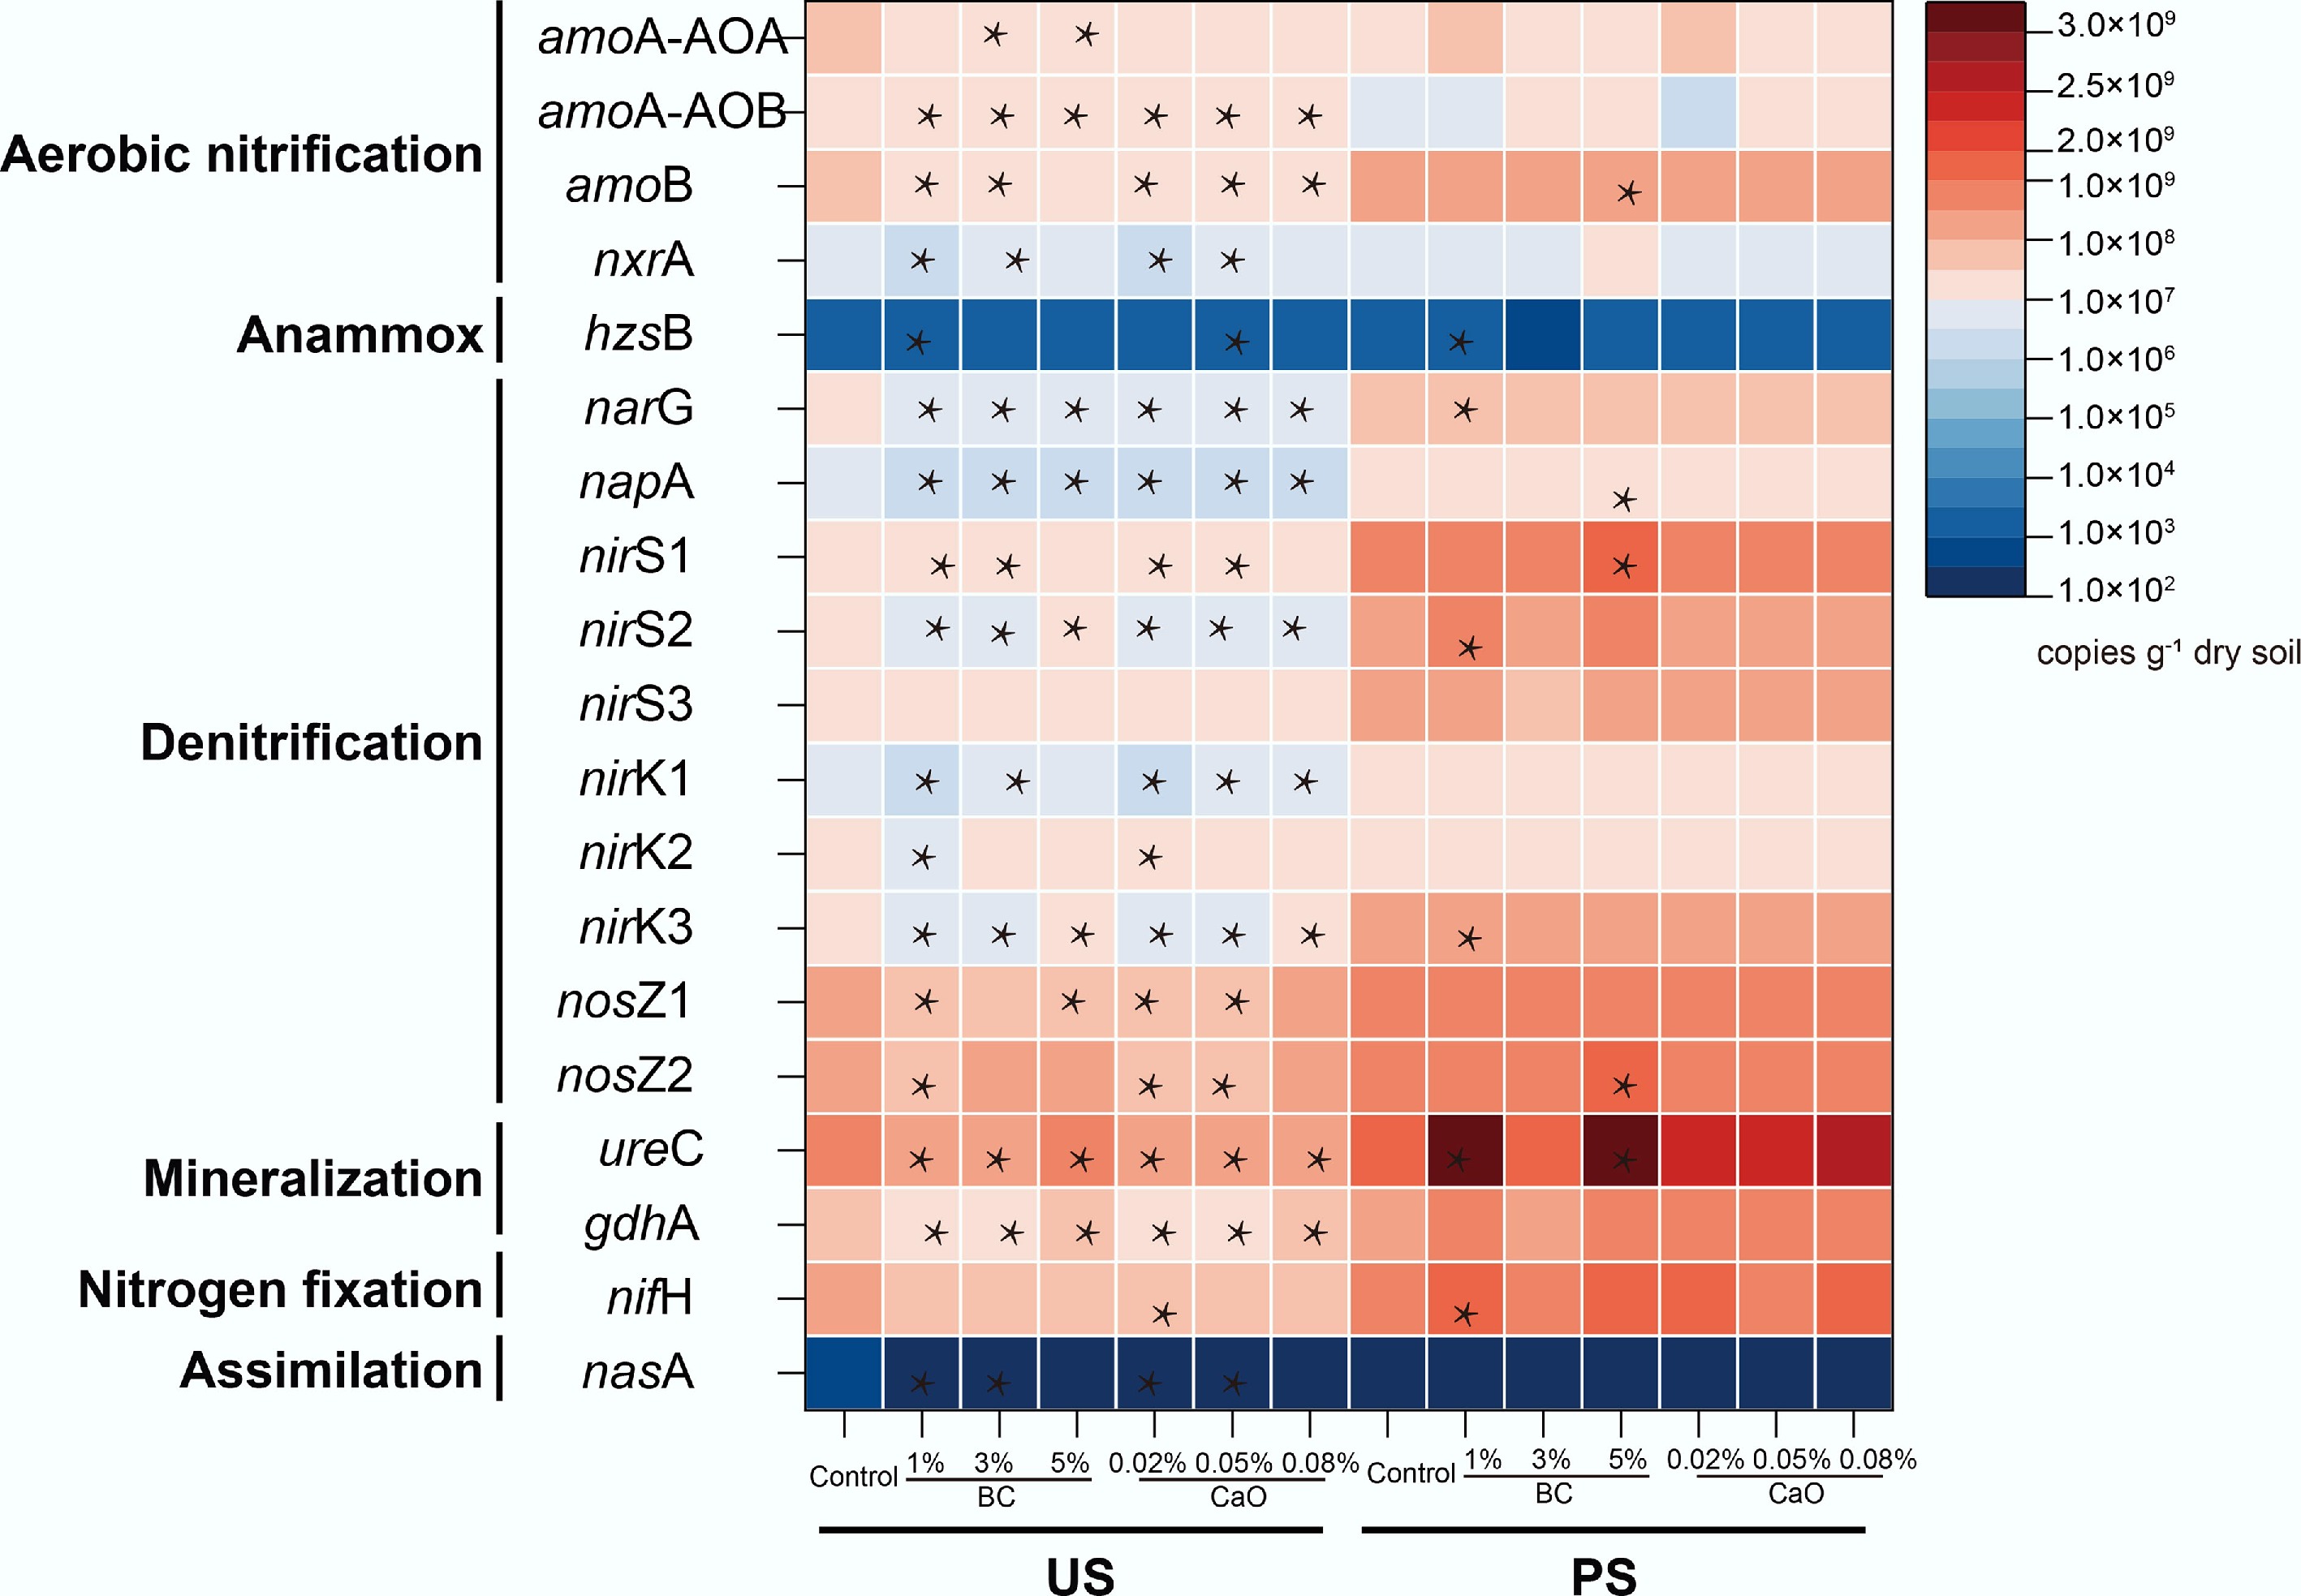
Figure 1.
Soil nitrogen cycling related functional gene abundance after biochar or CaO addition in two studied soils; the color of the block represents the functional gene abundance in nitrogen transformation. * Indicate the statistical significance with significance levels of p < 0.05. BC, Biochar; CaO, lime; US, upland soil; PS, paddy soil.
Effect of BC on Soil N2O emissions and mineral nitrogen content
-
Urea addition induced notably different N2O emission patterns in US and PS (Fig. 2a). In US, the N2O emission rate peaked at 48-h, showing a significantly lower value in BC-5% (6.15 μg N kg−1 d−1, p < 0.05) and a considerably higher value in CaO-0.02% (10.1 μg N kg−1 d−1, p < 0.05) compared with the control (7.77 μg N kg−1 d−1). In PS, N2O emissions increased gradually during the first 72 h, and then rose sharply thereafter. At 96 h, emissions were significantly higher in BC-3% (199 μg N kg−1 d−1), and BC-5% (470 μg N kg−1 d−1, p < 0.05), as well as in CaO-0.05% (104 μg N kg−1 d−1), and CaO-0.08% (125 μg N kg−1 d−1, p < 0.05), compared with the control (39.7 μg N kg−1 d−1). The cumulative N2O emission was 20.3 μg N kg−1 in the control of the US over 96 h of incubation (Fig. 2b). The cumulative N2O emission was significantly reduced to 16.6 μg N kg−1 in BC-5%, but increased dramatically to 23.3 μg N kg−1 in CaO-0.05%. The cumulative N2O emission was 37.1 μg N kg−1 in the PS control. The addition of 3% and 5% BC significantly increased cumulative N2O emissions by 5.25- and 14.4-fold, respectively, compared with the control. The addition of 0.05% and 0.08% CaO also significantly increased cumulative N2O emissions by 2.25- and 1.94-fold, respectively, compared with the control.
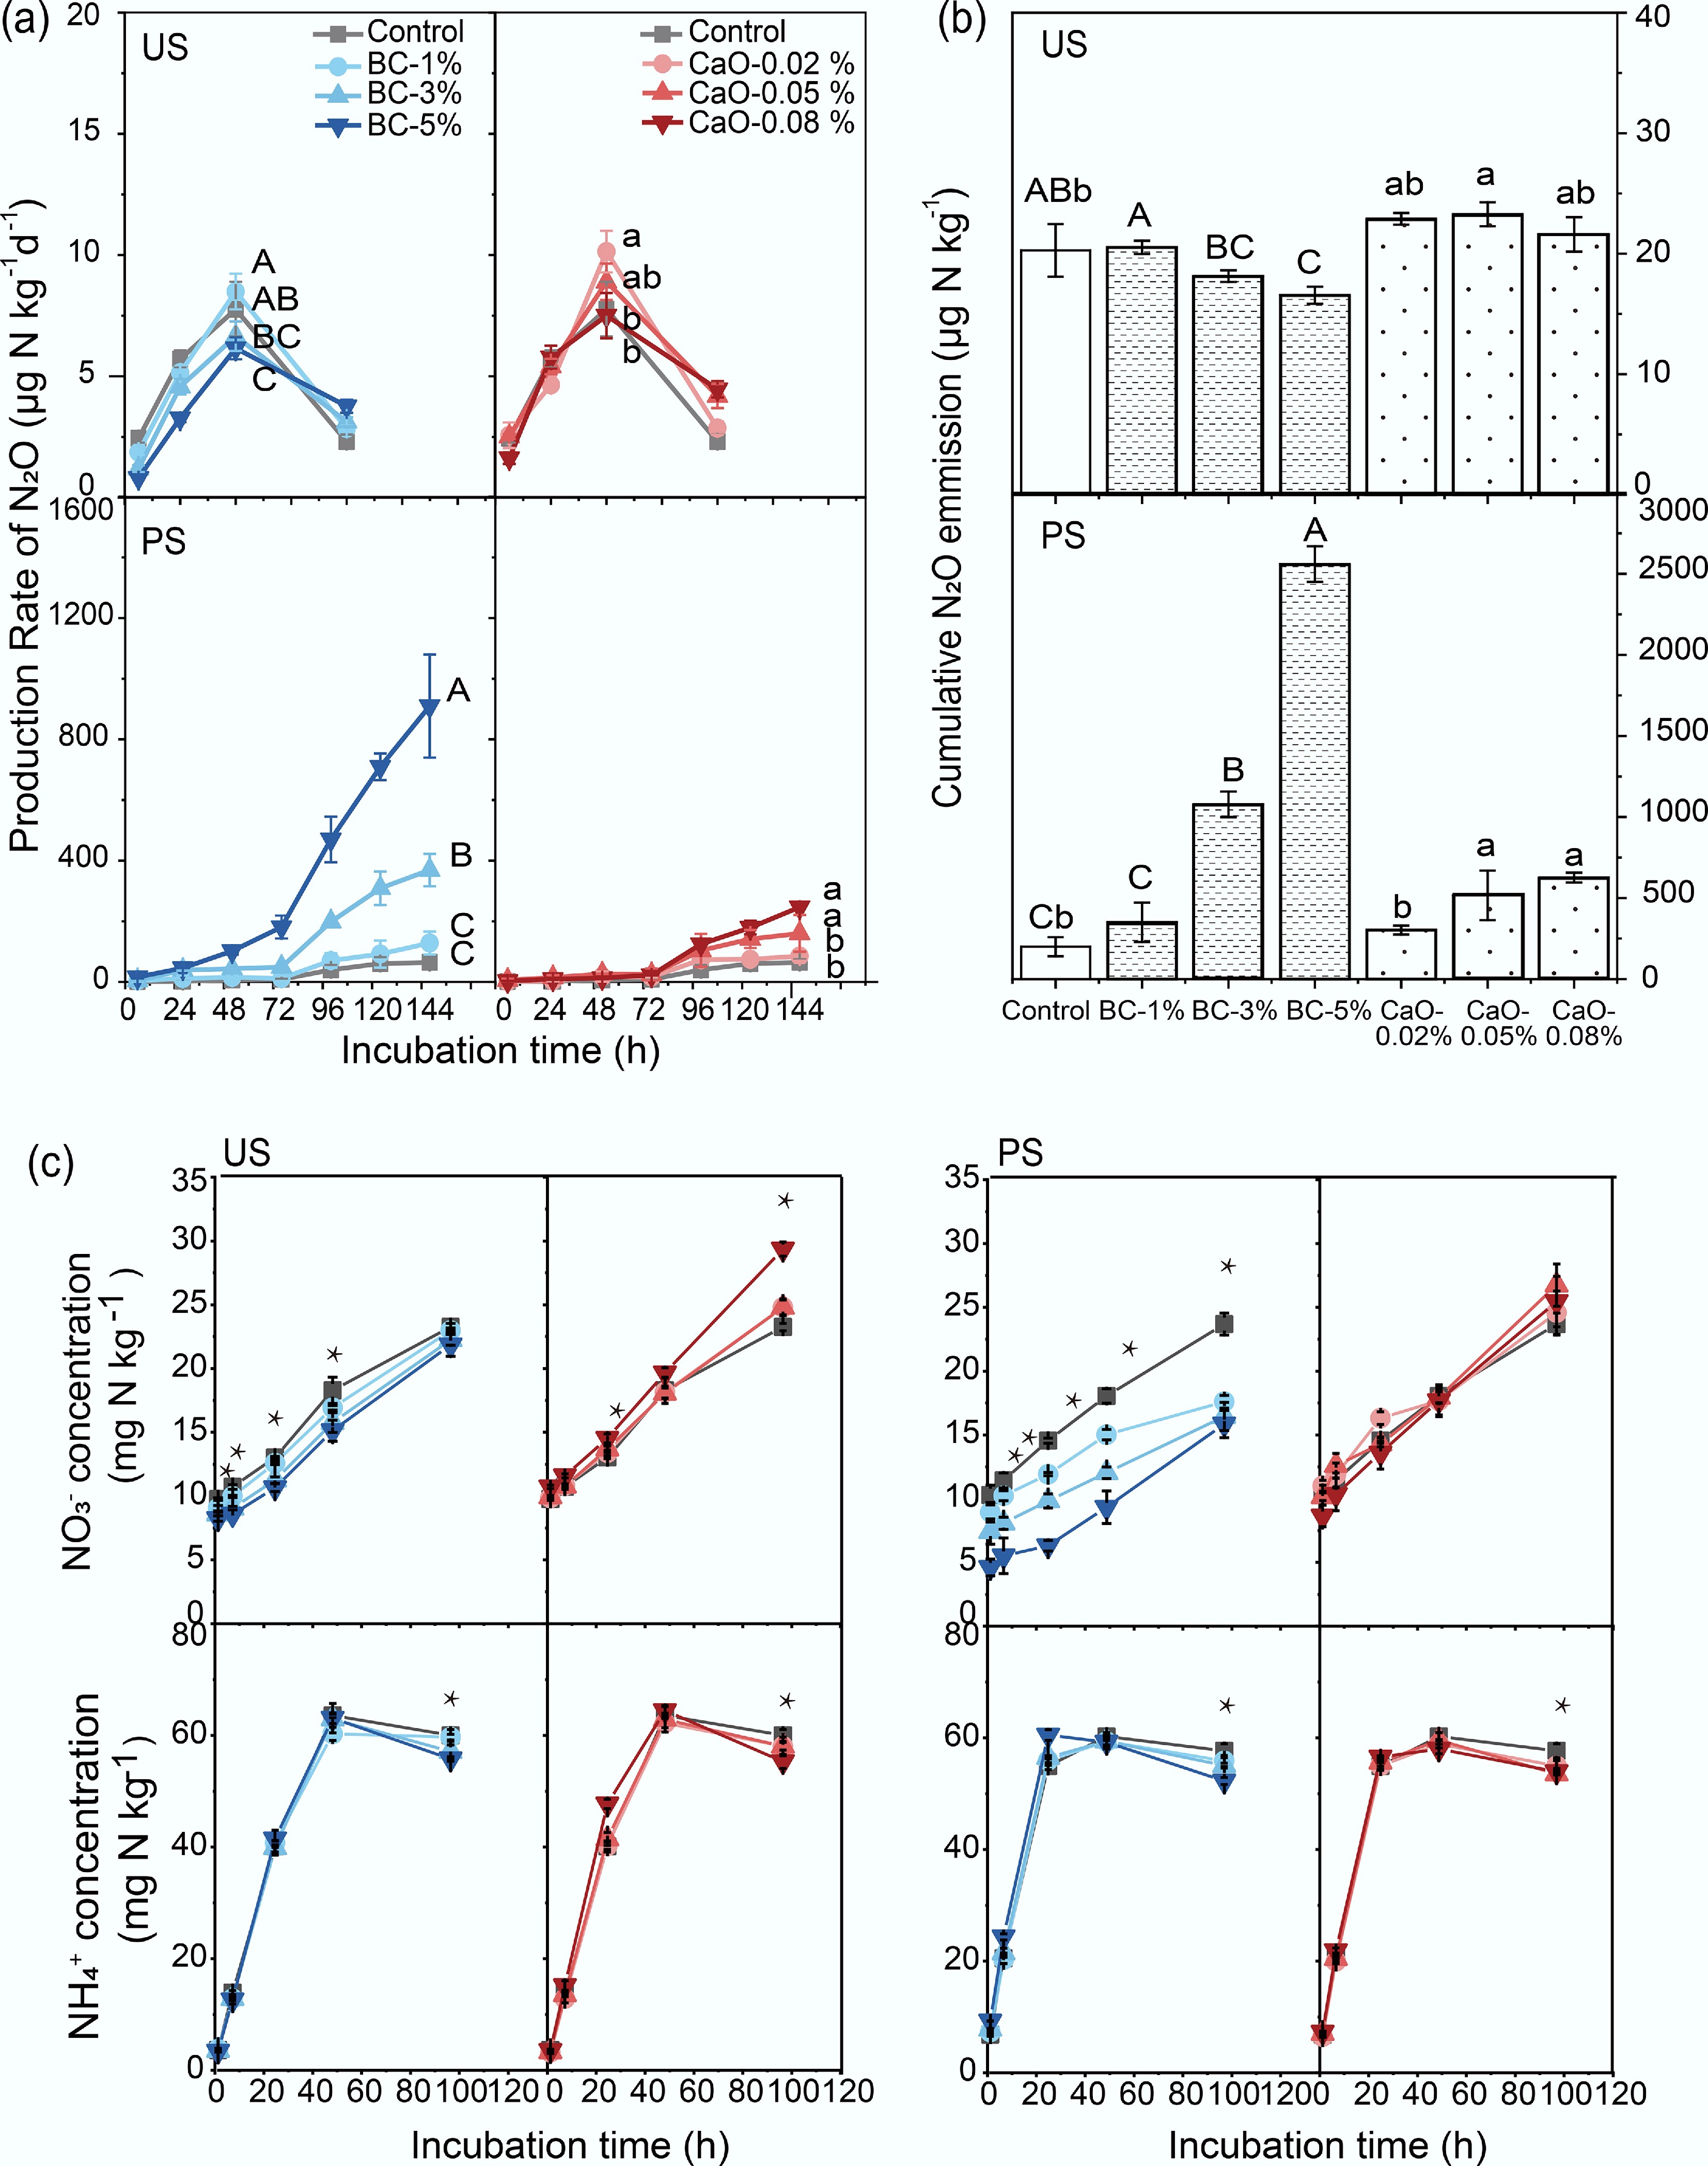
Figure 2.
Dynamics of (a) soil N2O production rate, and (b) cumulative soil N2O emission, and (c) inorganic nitrogen concentrations after biochar or CaO addition in two studied soils. Error bars indicate the standard deviations of the means (n = 3). Different capital letters indicate significant differences between BC treatments in the same soil (p < 0.05); different lowercase letters indicate significant differences between CaO treatments in the same soil (p < 0.05). * Indicate statistical significance at p < 0.05. BC, Biochar; CaO, lime; US, upland soil; PS, paddy soil.
Soil exchangeable NO3−-N concentration increased over time (Fig. 2c), from initial 8.24–10.73 to 21.86–29.36 mg N kg−1 in US soil, and from initial 4.62–11.00 to 15.85–26.75 mg N kg−1 in PS soil. BC amendment significantly reduced NO3−-N concentration throughout the incubation period, by 1.22%–20.05% in US soil and more evident by 10.50%–56.59% in PS soil. In contrast, CaO treatments sporadically increased NO3−-N concentration. Soil exchangeable NH4+-N concentration sharply peaked during the first 48 h and tapered off thereafter. NH4+-N concentration in all treatments was significantly lower than in the control in both soils at the end of incubation.
Effect of BC on N2O production pathways and N2
-
The FRAME model was used to partition sources of N2O, with probability distribution of the results, correlations between the modeled fractions, and the corresponding R coefficients presented in matrix plots (Supplementary Figs S1 & S2). Isotopic signature of soil N2O (δ15Nbulk, δ18O and δ15Nsp) was measured (Supplementary Fig. S3). The reliability of the modeled results was demonstrated by the low correlation between the output fractions. The correlation between fD and Ni ranged from −0.53 to −0.74 in the US and from −0.45 to −0.60 in PS. Similarly, the correlation between bD and nD ranged from −0.39 to −0.55 in the US and from −0.36 to −0.61 in PS. The observed correlation between these fractions likely resulted from the close isotopic endmember values between fD and Ni, as well as between bD and nD (Supplementary Table S1). The residual fraction
$r_{\rm N_2O} $ $r_{\rm N_2O} $ The dominant N2O production pathways in the control of US were bD and fD, accounting for 30% ± 19% and 25% ± 16% of the total N2O production, respectively, followed by Ni, nD and hN (Fig. 3c). In US, the addition of BC reduced the contribution of fD to total N2O emissions by 4%–13%, and that of bD by 4%–9%, relative to the control, whereas CaO addition led to smaller reductions of 0%–5% for fD, and 3%–6% for bD. For PS, N2O production occurred via bD, fD, nD, Ni, and hN, with each pathway contributing approximately equally (16%–26%) under all addition treatments (Fig. 3d). The contribution of each pathway showed slight changes within 7% after BC or CaO addition. N2O from pathways was dramatically reinforced to the same level after BC or CaO addition, which induced slight variation in contributions.
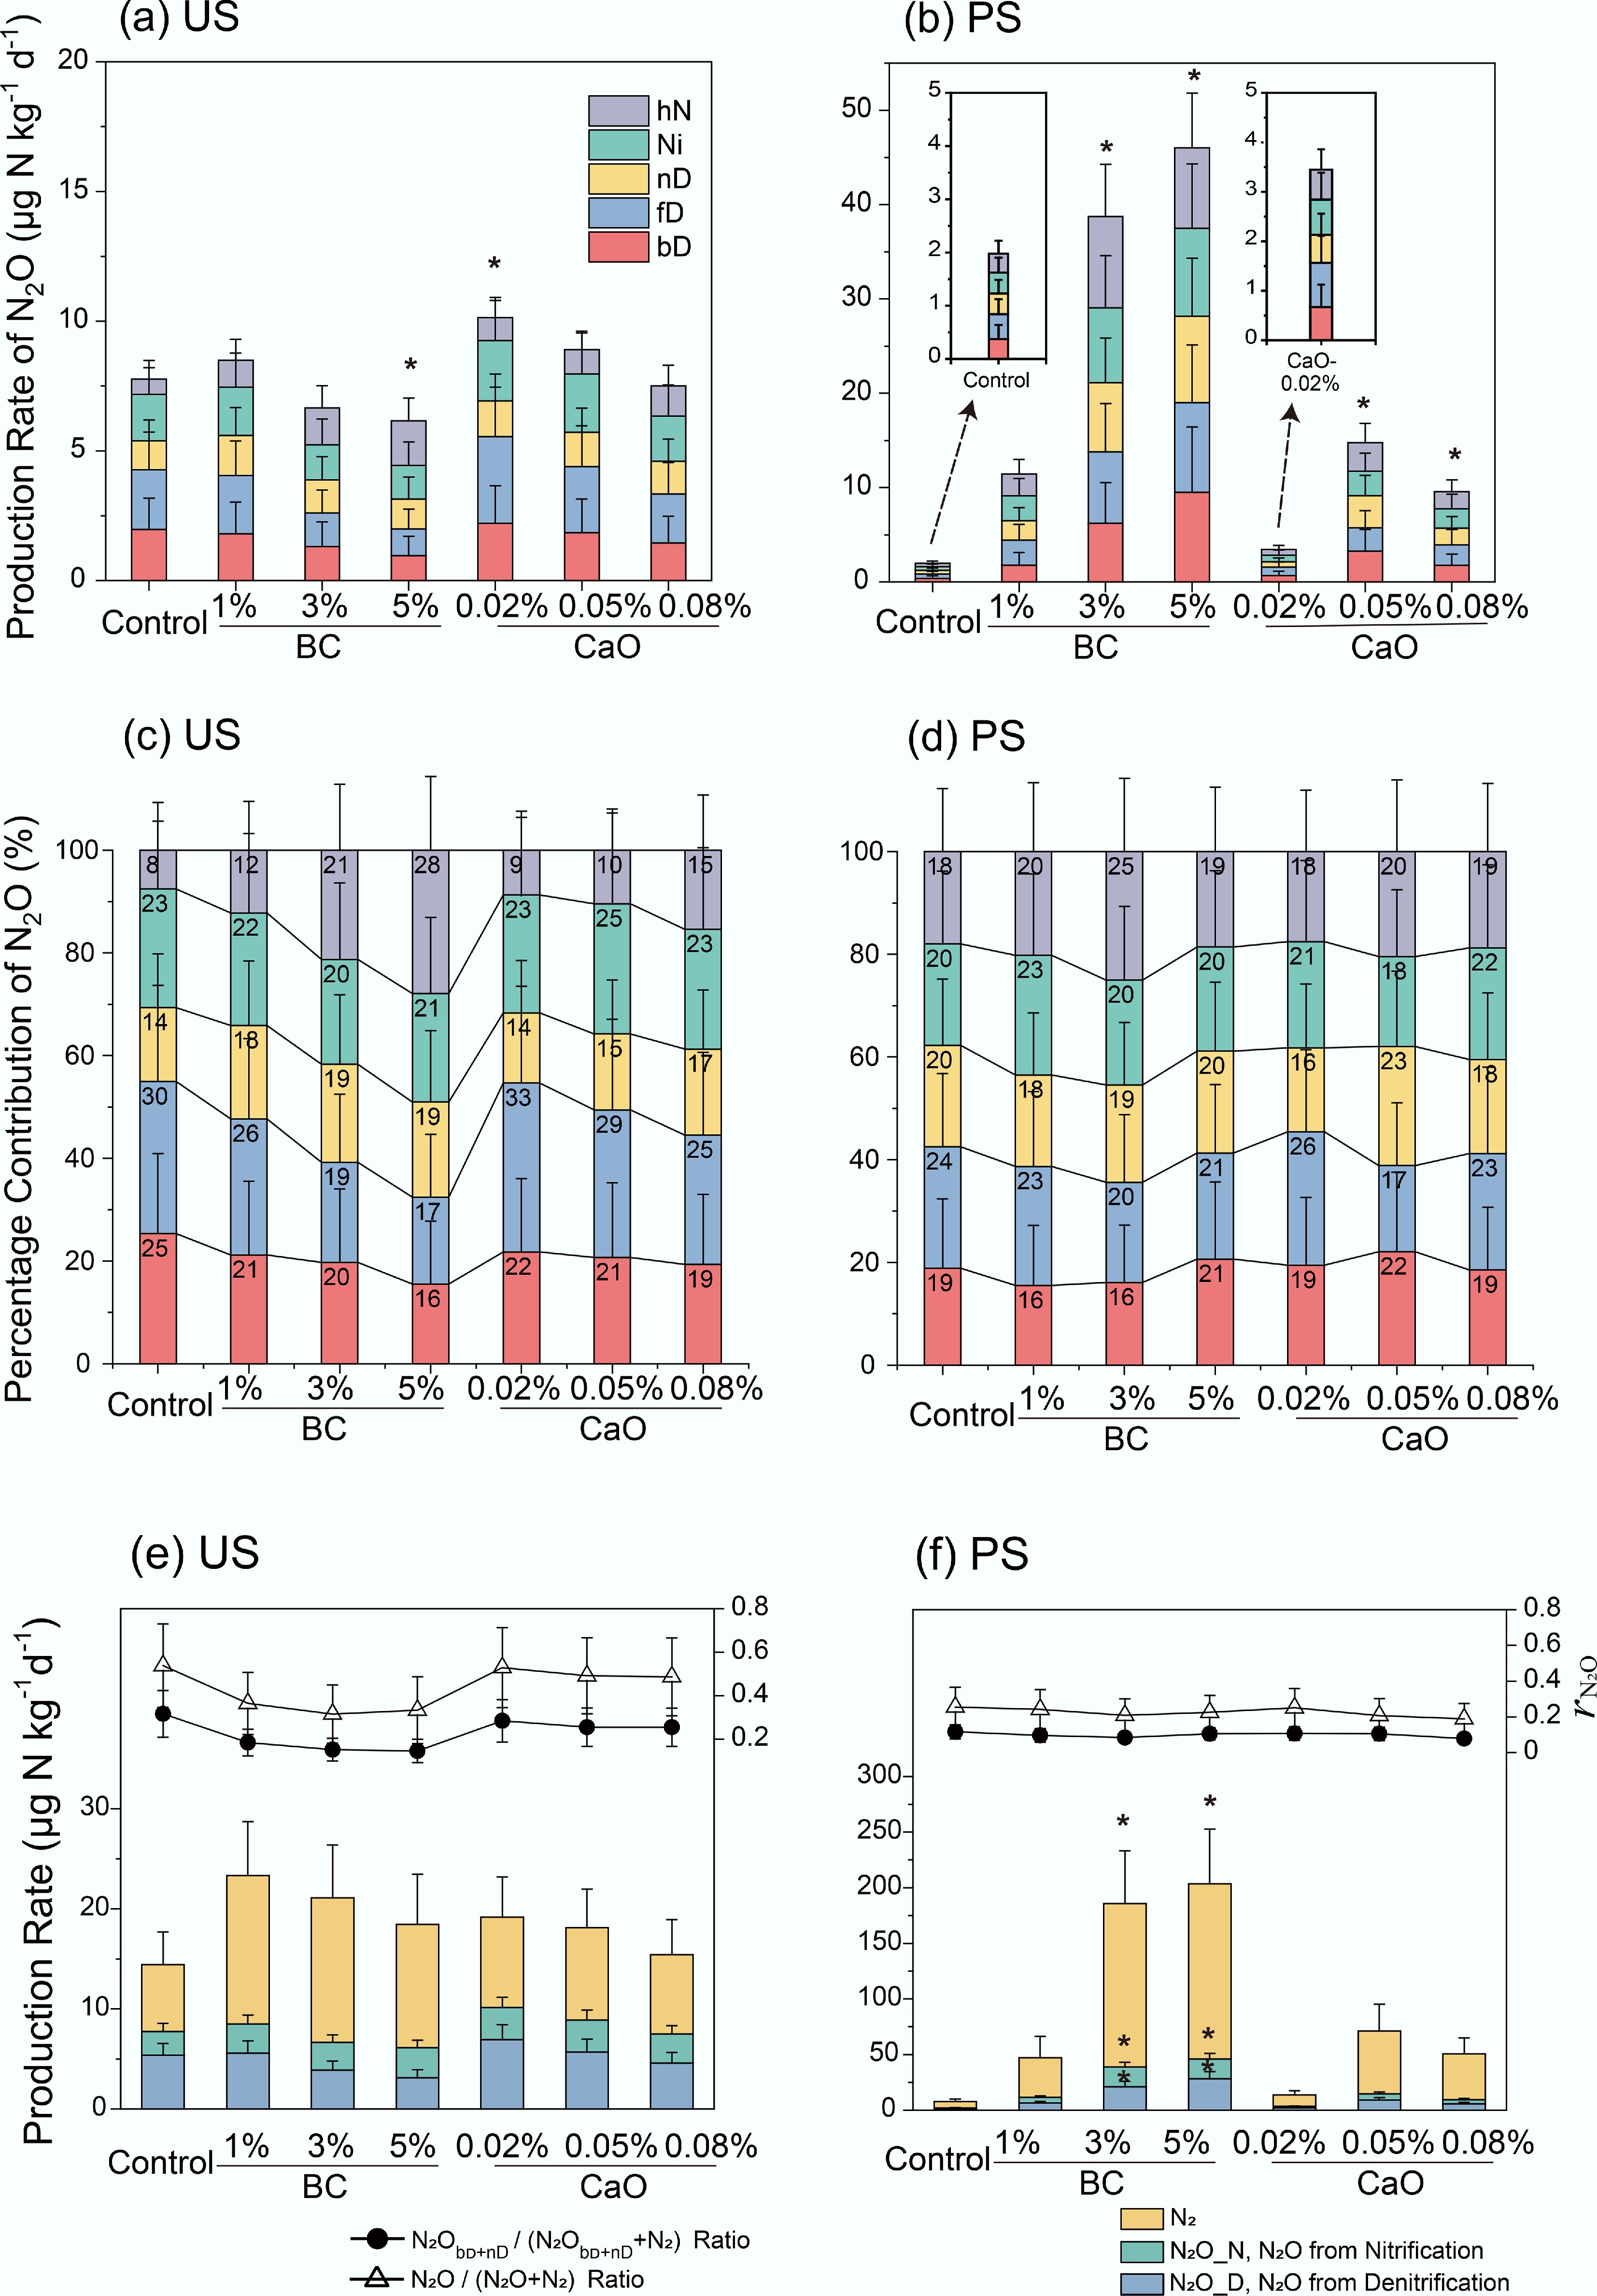
Figure 3.
(a), (b) N2O production from soil N2O pathways, (c), (d) their percentage contribution to total N2O emission, and (e), (f) N2O/N2 production rate (column) and the proportion of N2O after biochar or CaO addition in two studied soils. bD, bacterial denitrification; fD, fungal denitrification; nD, nitrifier denitrification; Ni, nitrification; hN, heterotrophic nitrification. * Indicate the statistical significance with significance levels of p < 0.05. BC, Biochar; CaO, lime; US, upland soil; PS, paddy soil.
In US soil, the BC addition reduced
$r_{\rm N_2O} $ $r_{\rm N_2O\_D} $ $r_{\rm N_2O} $ $r_{\rm N_2O} $ The relationship between N2O production pathways and characteristics of soil properties
-
The RDA analysis revealed a correlation between soil properties and N2O characteristics (Fig. 4). The first two ordination axes accounted for more than 90% of the total variance. In US soil, biochar treatments are clustered in the positive direction of Axis 1, indicating a close relationship with SOC, TN, and C/N ratio. The total N2O emission, that from bD and fD, and the
$r_{\rm N_2O} $ $r_{\rm N_2O} $ 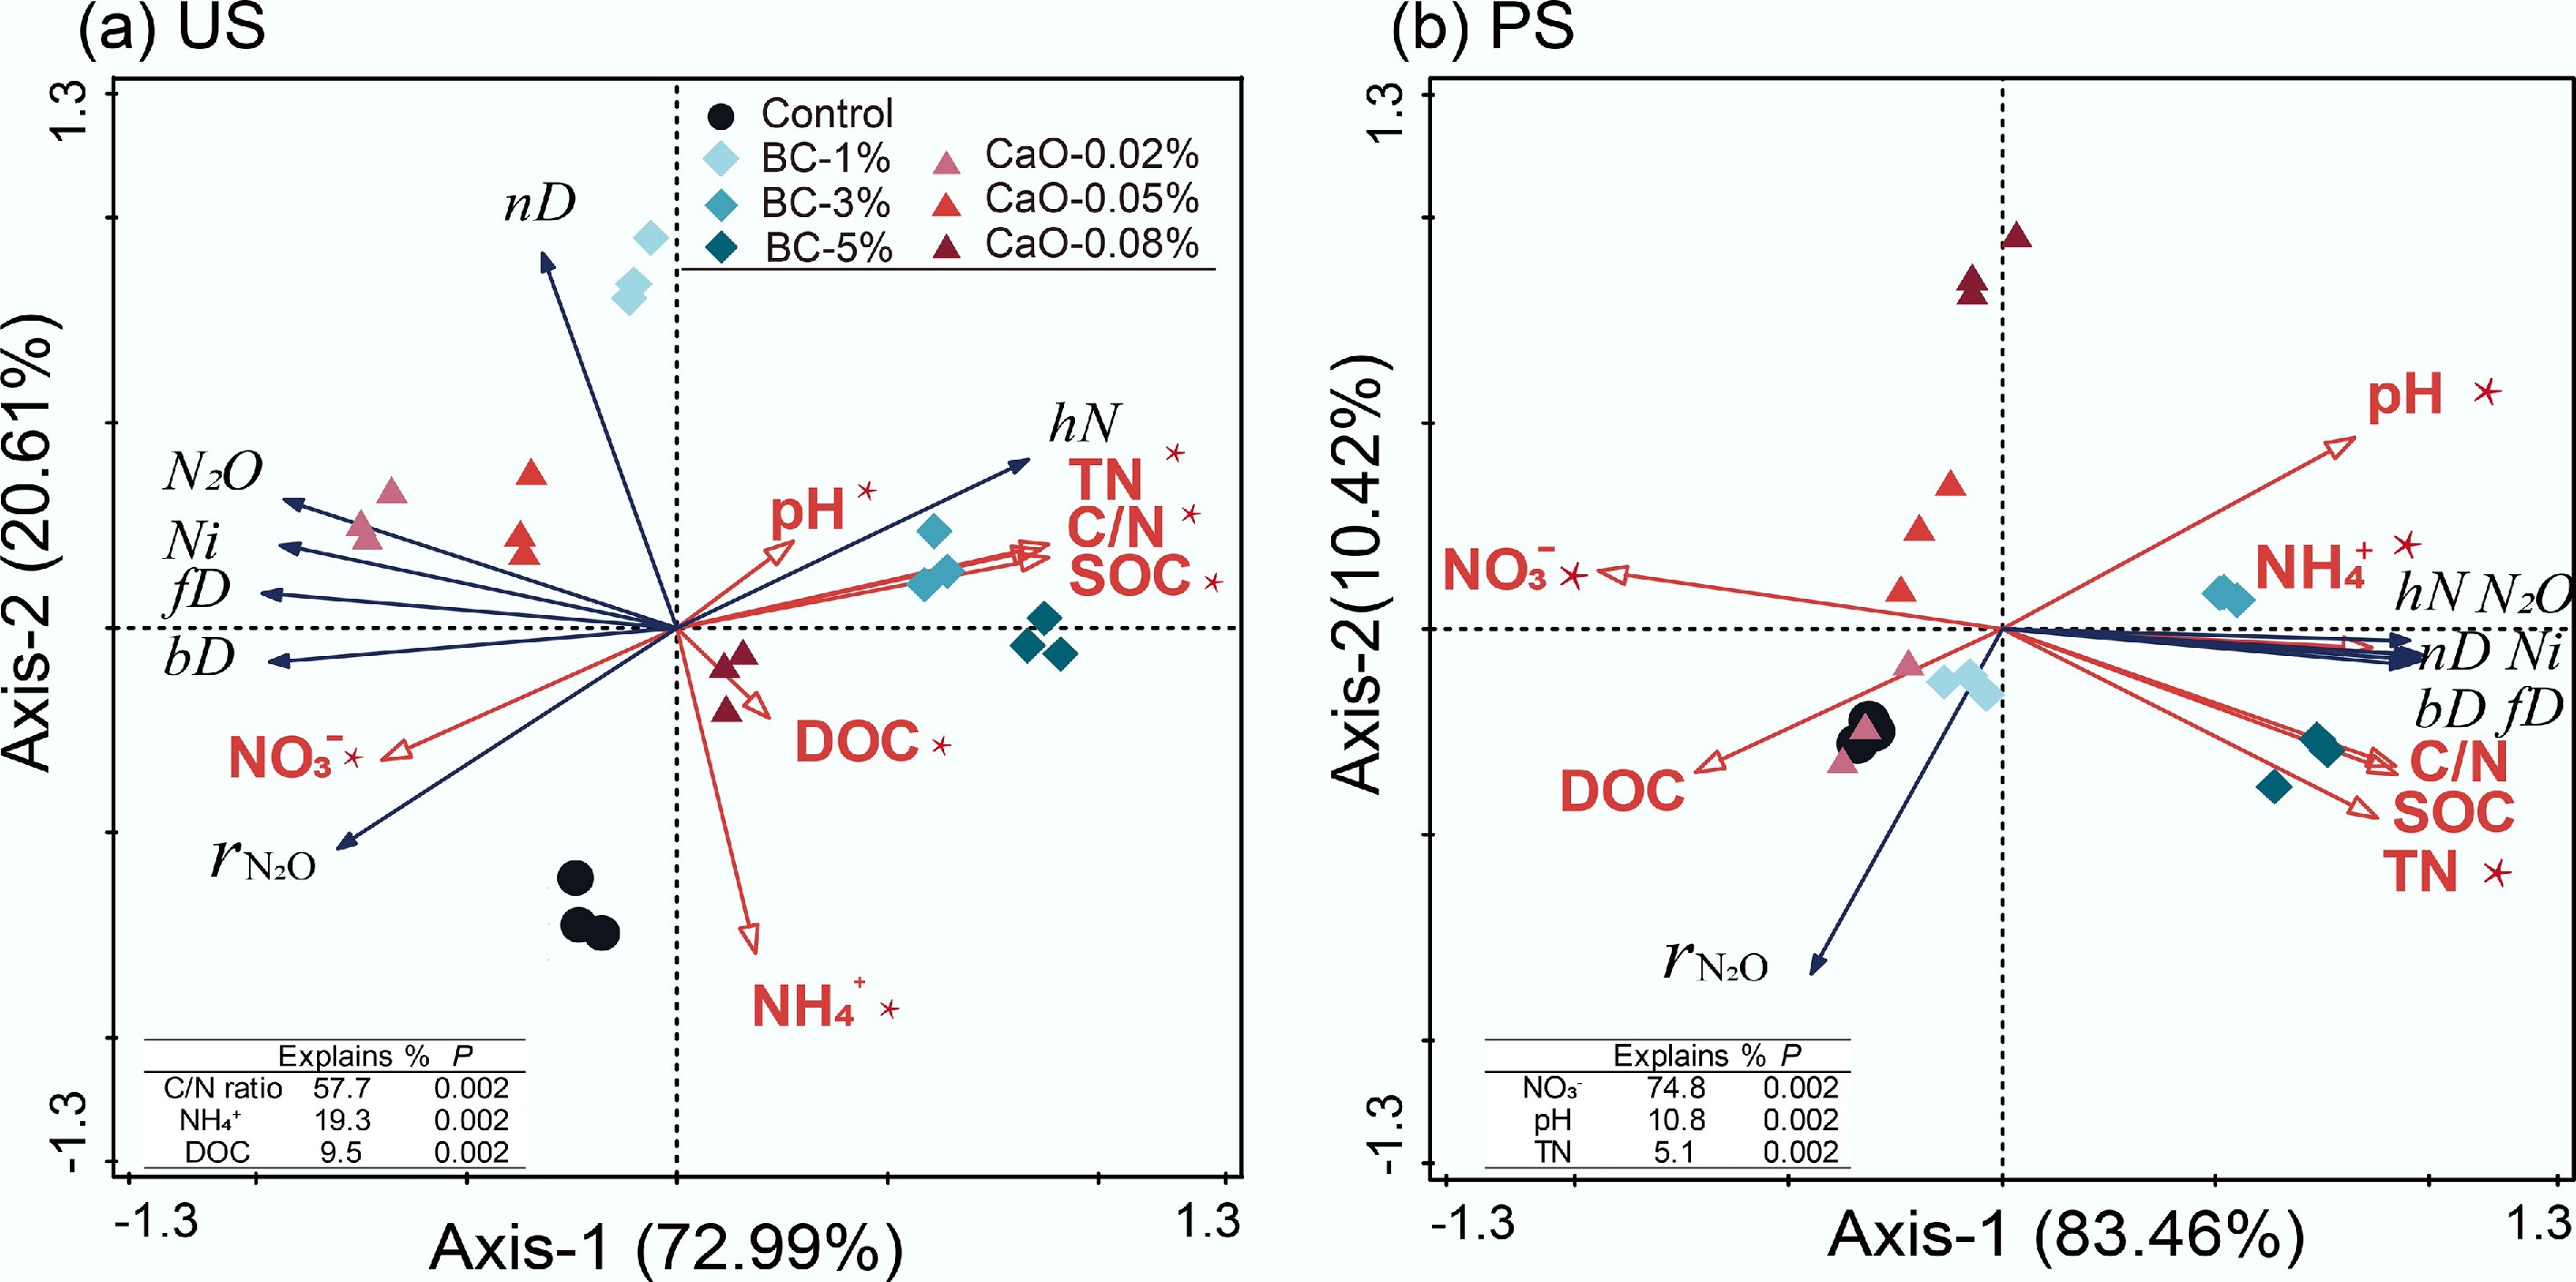
Figure 4.
Redundancy analyses (RDA) of the N2O production rate in each pathway and soil physicochemical properties. bD, bacterial denitrification; fD, fungal denitrification; nD, nitrifier denitrification; Ni, nitrification; hN, heterotrophic nitrification; BC, Biochar; CaO, lime; US, upland soil; PS, paddy soil.
The correlation between the abundance of nitrogen transformation-related genes and N2O production from the pathway explained some potential microbial effects. The bD-N2O was significantly, negatively correlated with the ratio of nosZII to (amoA + nxrA + narG + napA + nirS + nirK) in US (p <0.05, Supplementary Fig. S4a). The fD-N2O was positively correlated with the relative abundance of Chaetomium and Oidiodendron in the US fungi communities (Supplementary Fig. S4c), and with the total relative abundance of Chaetomium, Mortierella, Oidiodendron, and Pseudallescheria communities in PS (Supplementary Fig. S4d). Higher N2O emissions from nD and Ni were possibly related to the greater relative abundance of amoA-AOA in the US, but in PS, they were associated with amoA-AOB (Supplementary Fig. S5). The hN-N2O was significantly, positively correlated with SOC, TN contents, and C/N ratio (Supplementary Table S5). Besides, the significantly negative correlation between the relative abundance of the nosZII gene and
$r_{\rm N_2O} $ $r_{\rm N_2O} $ -
The present results showed that both peak N2O fluxes and cumulative N2O emissions were much lower in upland soils (US) than in paddy soils (PS), regardless of treatment (Fig. 2). This total difference between US and PS soils indicated that the water regime and soil TOC content may play a decisive role in regulating N2O emissions from the soil N cycle. The extremely high N2O emission from paddy soil could be related to the thin overlying water layer, which creates a slightly anaerobic environment in the soil. It allowed nitrification to occur producing sufficient substrate NO3−. Nitrification activities in the same paddy soils as this study were insensitive to oxygen concentration, which decreased from 20% to 2%[34]. Contrary to the previous findings that N2O emissions were negligible due to the complete reduction of NO3− to N2 in flooded soils, the thin water layer couldn't guarantee the complete denitrification of N2O to N2, resulting in the accumulation of N2O.
Similar results were reported that BC addition reduced N2O emissions in two upland soils (pH 5.05 and 4.90) under 65% WHC[10]. Significant increase in N2O emissions of 291% and 256% after BC amendment were reported in paddy soils at a soil : water ratio of 1:2[35], consistent with the field paddy experiment, which showed increased N2O emissions[36]. In the clay upland soil used for the test, BC addition might suppress N2O emissions by improving soil aeration, thereby depressing denitrifier activity, as bulk density decreased with BC amendment[37], likely due to the good structure and porous network of BC[38]. The BC amendment reduced the NO3− substrate concentration during most of the incubation period (Fig. 2). The negatively charged surface of BC, as well as chemical bonding, shows a strong affinity for NH4+[39], which affects abiotic NH4+ sorption and biotic NH4+ transformation in soils[40]. It is inferred that inorganic N substrate concentration in dryland soils is an important limiting factor. The 'electron shuttle' function of BC also facilitated the transfer of electrons to soil denitrifying microorganisms, thereby promoting the reduction of N2O to N2[16].
The effect of BC on soil N2O from denitrification
-
Denitrification was the primary source of N2O in both upland and flooded soils. It was because most fungi and approximately one-third of denitrifying bacteria[41] lacked the genetic potential for N2O reduction. Both fungi and bacteria can generate N2O across a wide range of WFPS (60%–90%) in farming systems[42]. They could play an important role in upland agricultural, tea plantation, and bamboo plantation soils[43], and in acidic soils[42,44,45]. The BC addition had a high potential for fD-N2O reduction of 2%–55% for absolute emissions and 4%–13% for its contribution in the US (Fig. 3), which was lower than the previously reported range of 28%–52%[45]. Previous studies reported that classes of Penicillium and Sordariomycetes, and genera of Botrytis, Cladosporium, Mortierella, and Verticillium with N2O-producing capability shifted significantly due to BC amendment in acidic tea soils[44,45]. The N2O emission from fD was positively correlated with the relative abundance of specific fungal genera with high N2O capacity, such as Chaetomium, Oidiodendron, Mortierella, and Pseudallescheria (Supplementary Fig. S4). The key genus, Chaetomium, showed relatively high N2O activity of 99.9–206.9 nmol mL−1 d−1[46]. The importance was also found to explain the contribution of fungal denitrification to N2O emissions in the Manure treatments within the co-occurrence networks of bacterial and fungal denitrifiers[47]. Moreover, its relative community abundance in PS is 100 times that in the US, which could better explain the higher N2O emission through fD in PS. More efforts from pure-culture experiments are needed to understand how BC affects Chaetomium growth.
In this study, the bD-N2O was negatively correlated with the ratio of nosZII to (amoA + nxrA + narG + napA + nirS + nirK). Many studies also linked soil N2O reduction to nosZ gene abundance after BC addition[48−50], and to optimizing electron distribution among denitrifying enzymes at the cellular level[51]. Clade II N2O reducers or nosZII gene abundance and community could play an important, previously unrecognized role in controlling N2O emissions[52,53]. Carbon availability (DOC) introduced by BC (Table 1) substantially increased relative nosZII gene abundance, leading to a net reduction in N2O emissions[54,55]. This explanation also accounted for the previous results that pH increase alone does not induce large N2O reductions within a few days[54,56]. The decreased DOC content in CaO-0.08% suggested that without additional DOC supplementation, CaO treatment enhanced microbial activity by raising pH, particularly among bacteria that utilized DOC, thereby accelerating DOC decomposition and mineralization[57,58].
Similar higher abundances of these genes were reported in the paddy soil than in orchard or vegetable soils[59]. The BC treatment vigorously promoted these functional genes related to N2O production compared with nosZII, resulting in a significant increase in N2O production over N2. The nosZ gene was more easily suppressed by BC than the nirS or nirK genes in flooded acidic soil[35]. It is likely due to the nosZ gene's high sensitivity to low pH[60,61] that were not elevated after BC amendment in the strongly acidic soil, or due to the greater inhibition by high O2 concentration[62,63], that might exist in the porous BC and thin layer of water, or due to the slow growth rate relative to nirS or nirK genes[64]. It was inferred that the N2O reduction in bD was achieved by increasing the relative nosZII gene abundance in the US, while the N2O increase was achieved by increasing the gene abundance related to N2O production in PS.
Effect of BC on soil N2O from other pathways
-
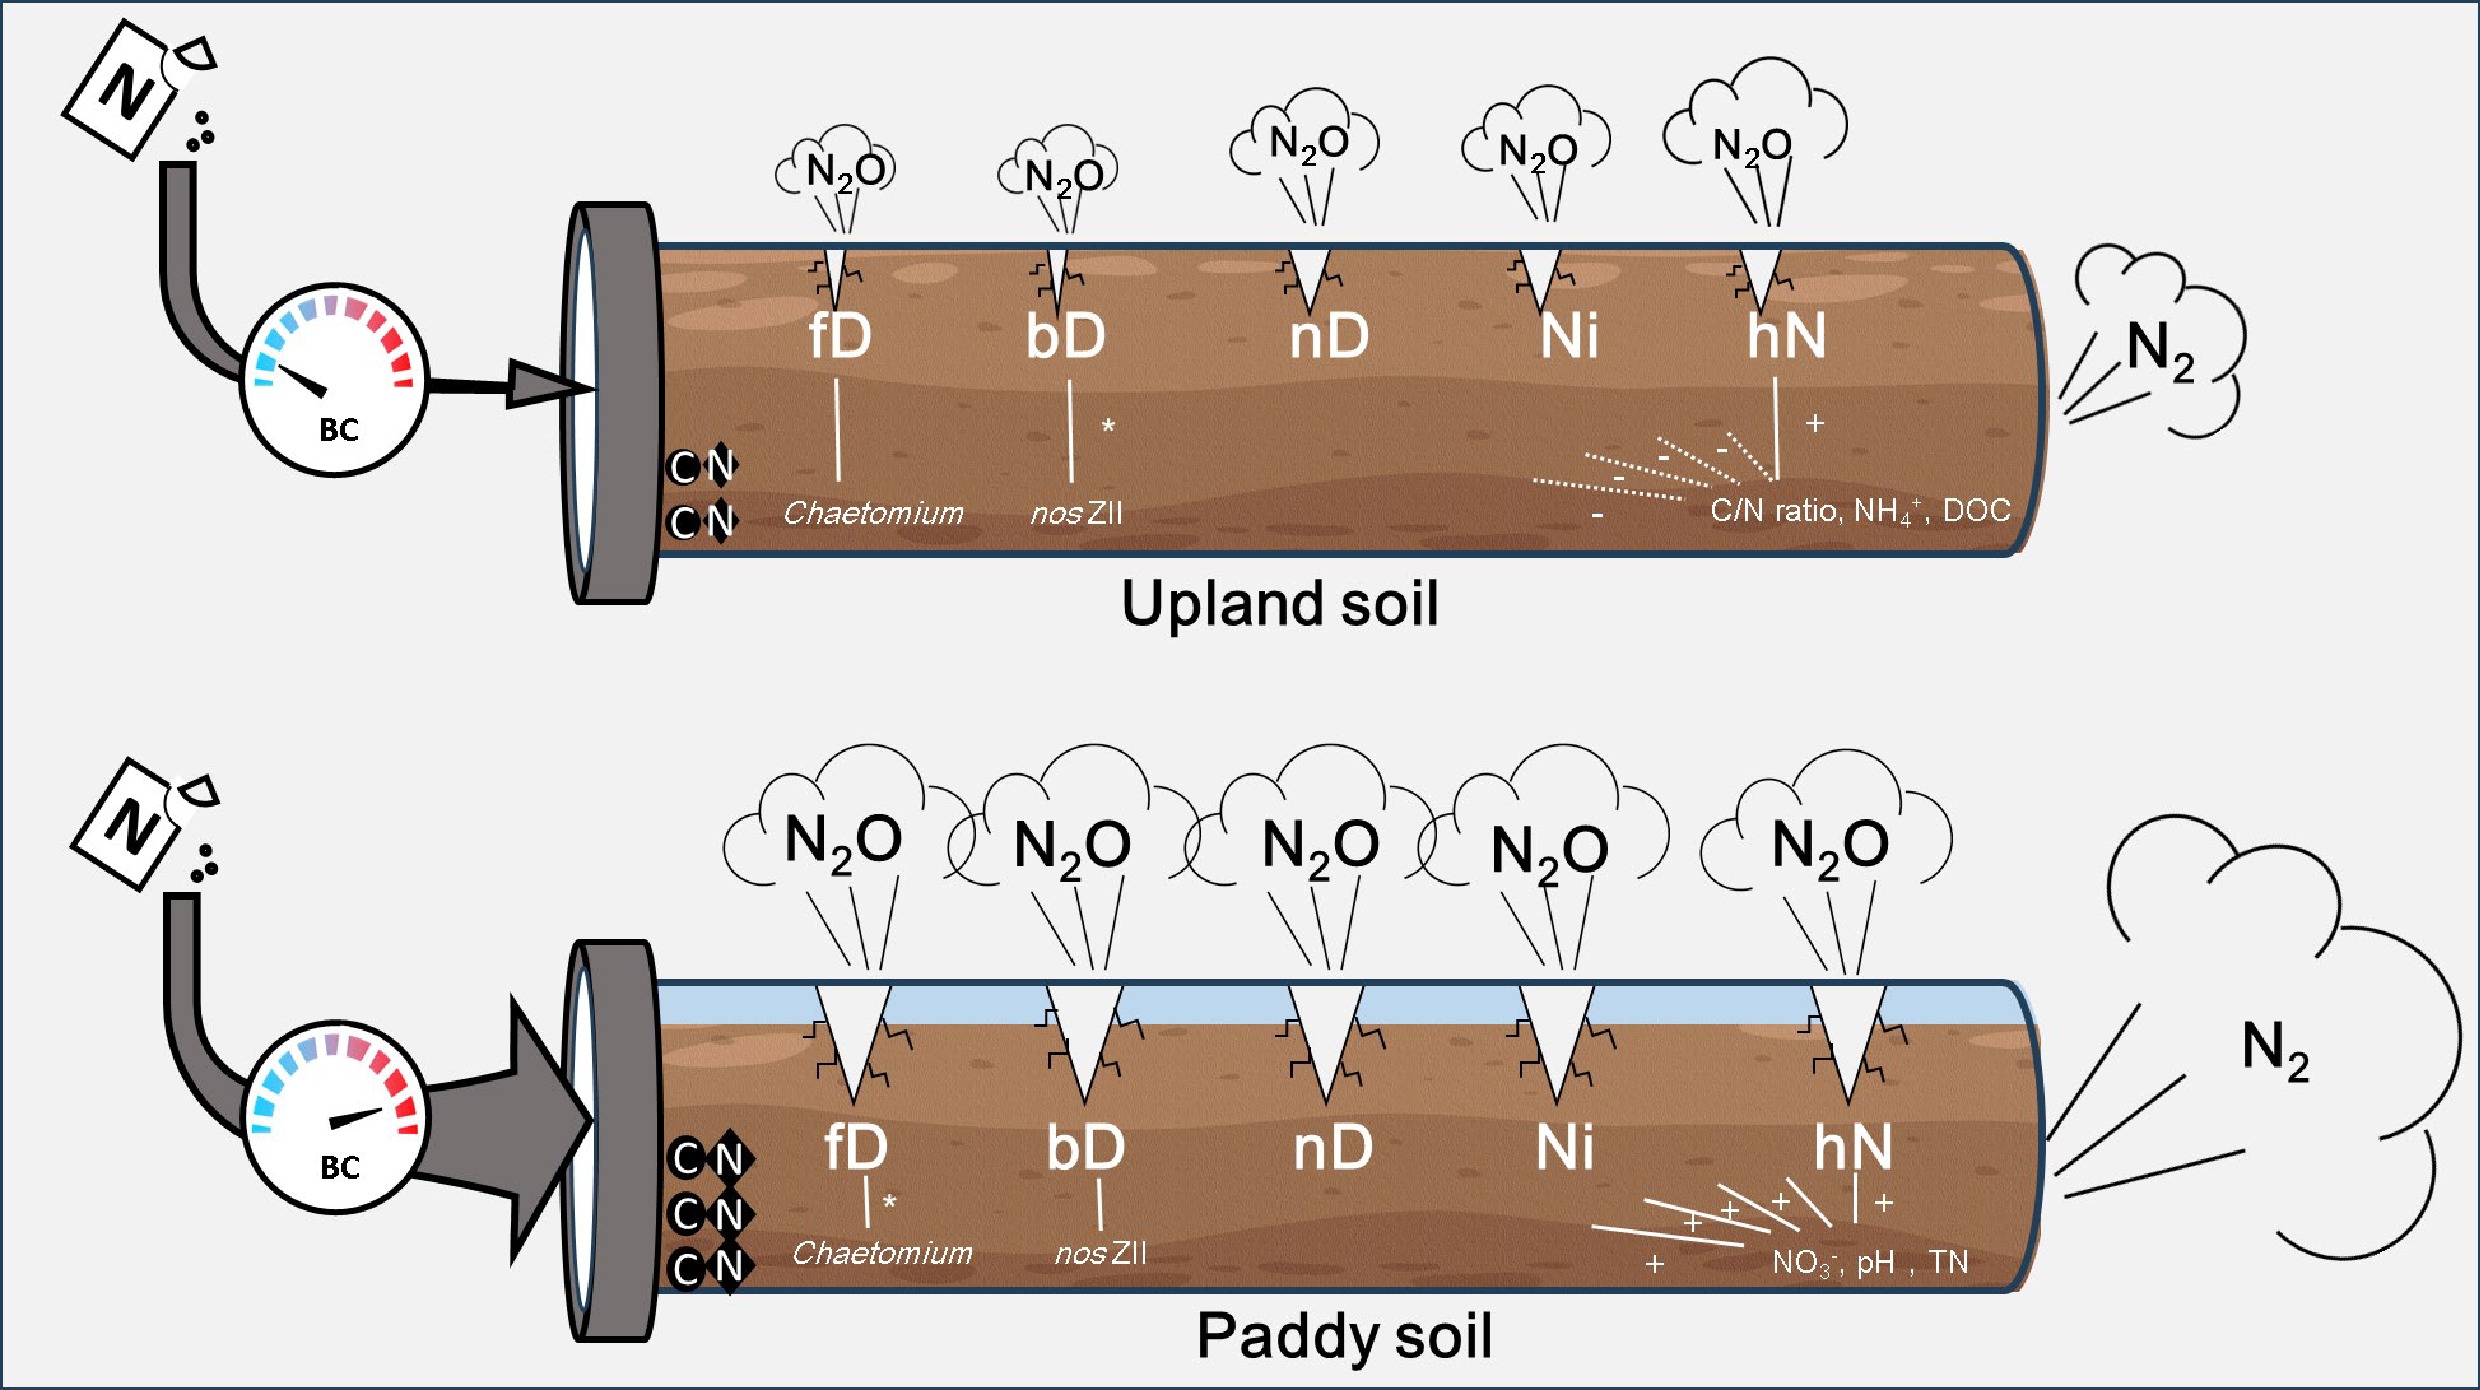
It is widely accepted that autotrophic nitrification could be stimulated following BC addition, as increased nitrification activity and nitrifier gene abundance were observed, likely due to improved nutrient availability and soil pH in acidic cropland soils[10,65,66]. However, in the present study, BC addition caused a smaller change in N2O emissions from autotrophic nitrification (Ni-N2O) than other production pathways, and a similar pattern was observed with CaO addition. While BC addition was observed to elevate N2O emissions via heterotrophic nitrification (hN-N2O) in the present study, this increase was substantially offset by reductions in bacterial and fungal denitrification pathways, where microorganisms related to bD and fD are more capable of producing N2O. BC addition also resulted in a remarkable increase of Ni-N2O in flooded PS, likely linked to elevated amoA-AOB abundance. During nitrification, the intermediate products NH2OH and NO2− serve as substrates for N2O production[67]. Rapid urea hydrolysis in humid or flooded soil produces ammonia (NH3), as evidenced by the observed increase in ureC genes in this study. This NH3 is more toxic to Nitrobacter than to ammonium oxidizers, thereby leading to excessive accumulation of NO2−, which in turn contributes to N2O production[36,68]. In addition, heterotrophic nitrification has been reported to explain N2O emissions in acidic soils in recent studies[43,69]. It was found that both BC and CaO consistently enhanced hN-N2O, especially in the BC-3% and BC-5% treatments. The hN-N2O was positively correlated with increasing SOC, TN content, and the C/N ratio. The same finding was reported, with the contribution of heterotrophic nitrification to N2O production significantly correlated with SOC content and soil C/N ratio, because SOC, rather than the oxidation of reduced nitrogen compounds, is the main energy source for heterotrophic microorganisms[20]. Thus, this stimulation may stem from amendments altering microbial activity, particularly favoring heterotrophic nitrification under elevated SOC and imbalanced C/N conditions. In summary, the results aligned with the hypothesis given in the introduction. A conceptual map of the biochar's contrasting effects on N2O emissions in two soils was depicted based on the 'Hole-in-the-Pipe' model. BC addition potentially reduced N2O production via denitrification pathways by increasing the C/N ratio, TN, and SOC, which (compared with CaO amendment that increased pH only) strongly affected key microorganisms in the fD and bD processes, thereby interfering with total N2O emissions through fD and bD. Other processes, such as nitrification, exhibit weaker responses than bD and fD. In the PS, which has a high SOC and TN content, the increase in pH induced by BC addition enhanced N2O production from SOC and TN, thereby promoting the activity of microorganisms involved in various pathways and leading to a surge in total N2O emissions.
-
This study reveals divergent effects of BC and CaO on soil N2O emissions across land use types. While BC demonstrated superior N2O mitigation efficacy in acidic upland soils compared to CaO, it paradoxically induced higher emissions in flooded paddy soil. Mechanistic investigations could focus on bacterial and fungal denitrification pathways as the principal drivers of N2O reduction in acidic upland soil following BC addition. In contrast, multiple production pathways contributed equally to N2O accumulation in flooded paddy soil, with each pathway showing a significant enhancement after BC addition. Biochar's contrasting effects on N2O emissions may involve uncertain offsetting or synergistic effects of pH factors and of synchronously added carbon and nitrogen on soil N2O emissions. This finding emphasizes the need for precise N2O pathway partitioning in future studies to disentangle these competing mechanisms. Advancing the understanding of microbial-mediated N2O production at the pathway level will be instrumental in developing land-use-specific mitigation strategies, ultimately optimizing agricultural practices for sustainable soil management.
We acknowledge the support of the Hainan Seed Industry Laboratory for this study.
-
It accompanies this paper at: https://doi.org/10.48130/nc-0025-0021.
-
Not applicable.
-
The authors confirm their contributions to the paper as follows: Cheng Chu: performing experiments and writing the first draft of the manuscript; Ahmed S. Elrys: writing the first draft of the manuscript and providing comments on earlier versions of the manuscript; Shenyan Dai: performing experiment; Teng Wen: performing isotope analysis; Jin Xu: performing isotope analysis; Zucong Cai: proposing study conception and designing study; Jinbo Zhang: proposing study conception and designing study; Anne B. Jansen-Willems: providing comments on earlier versions of the manuscript; Kristina Kleineidam: providing comments on earlier versions of the manuscript; Christoph Müller: providing comments on earlier versions of the manuscript. All authors reviewed the results and approved the final version of the manuscript.
-
The datasets used or analyzed during the current study are available from the corresponding author upon reasonable requests.
-
This work was supported by the Hainan Provincial Natural Science Foundation of China (Grant No. 425CXTD606), the National Natural Science Foundation for Excellent Youth Science Foundation of China (Grant No. RZ2400002277), and College initial funding (Grant No. 1677772342Y).
-
The authors declare that they have no known competing financial interests or personal relationships that could have appeared to influence the work reported in this paper.
-
# Authors contributed equally: Cheng Chu, Ahmed S. Elrys
Full list of author information is available at the end of the article. - The supplementary files can be downloaded from here.
- Copyright: © 2026 by the author(s). Published by Maximum Academic Press, Fayetteville, GA. This article is an open access article distributed under Creative Commons Attribution License (CC BY 4.0), visit https://creativecommons.org/licenses/by/4.0/.
-
About this article
Cite this article
Chu C, Elrys AS, Dai S, Wen T, Xu J, et al. 2026. Biochar's contrasting effects on N2O emissions in acidic upland and flooded paddy soils. Nitrogen Cycling 2: e009 doi: 10.48130/nc-0025-0021 

Biochar's contrasting effects on N2O emissions in acidic upland and flooded paddy soils
- Received: 28 October 2025
- Revised: 02 December 2025
- Accepted: 18 December 2025
- Published online: 22 January 2026
Abstract: Although it is well documented that biochar (BC) application reduces nitrous oxide (N2O) emissions in certain soils, a deeper understanding of the inconsistent results, and the underlying microbial mechanisms across different land-use types remains a significant challenge. In this study, biochar (BC-1%, 3%, and 5%), and quicklime (CaO-0.02%, 0.05%, and 0.08%) were applied to acidic upland and flooded paddy soils. N2O emissions were then determined and partitioned into nitrification, nitrifier denitrification, bacterial and fungal denitrification sources using natural abundance isotopic analyses (δ15Nbulk, δ15NSP, and δ18O), alongside complementary microbial molecular assessments. The results revealed contrasting effects of BC on N2O emissions in different soils. In acidic upland soil, BC achieved greater mitigation of N2O emissions than CaO. This mitigation was probably driven by suppressed bacterial and fungal denitrification, linked to lower abundance of Chaetomium—a high N2O-producing fungal genus—and enhanced expression of the nosZII gene, which encodes N2O reductase. Together, these changes curtailed N2O production from both microbial pathways. In flooded paddy soil, however, BC stimulated N2O emissions compared to the control or CaO treatment. Multiple pathways equally contributed to N2O emissions, with each showing a significant enhancement after BC addition to paddy soils. The present study demonstrated that comprehensive insight into the N2O pathway and microbial mechanisms is crucial, given the contrasting responses in upland and flooded paddy soils. Such mechanistic insight, through precise pathway attribution, highlights a critical need for and should precede future studies under more complex and realistic conditions before large-scale implications can be drawn.
-
Key words:
- Biochar /
- Acidic soil /
- N2O emission /
- Fungal denitrification /
- Bacterial denitrification