












-
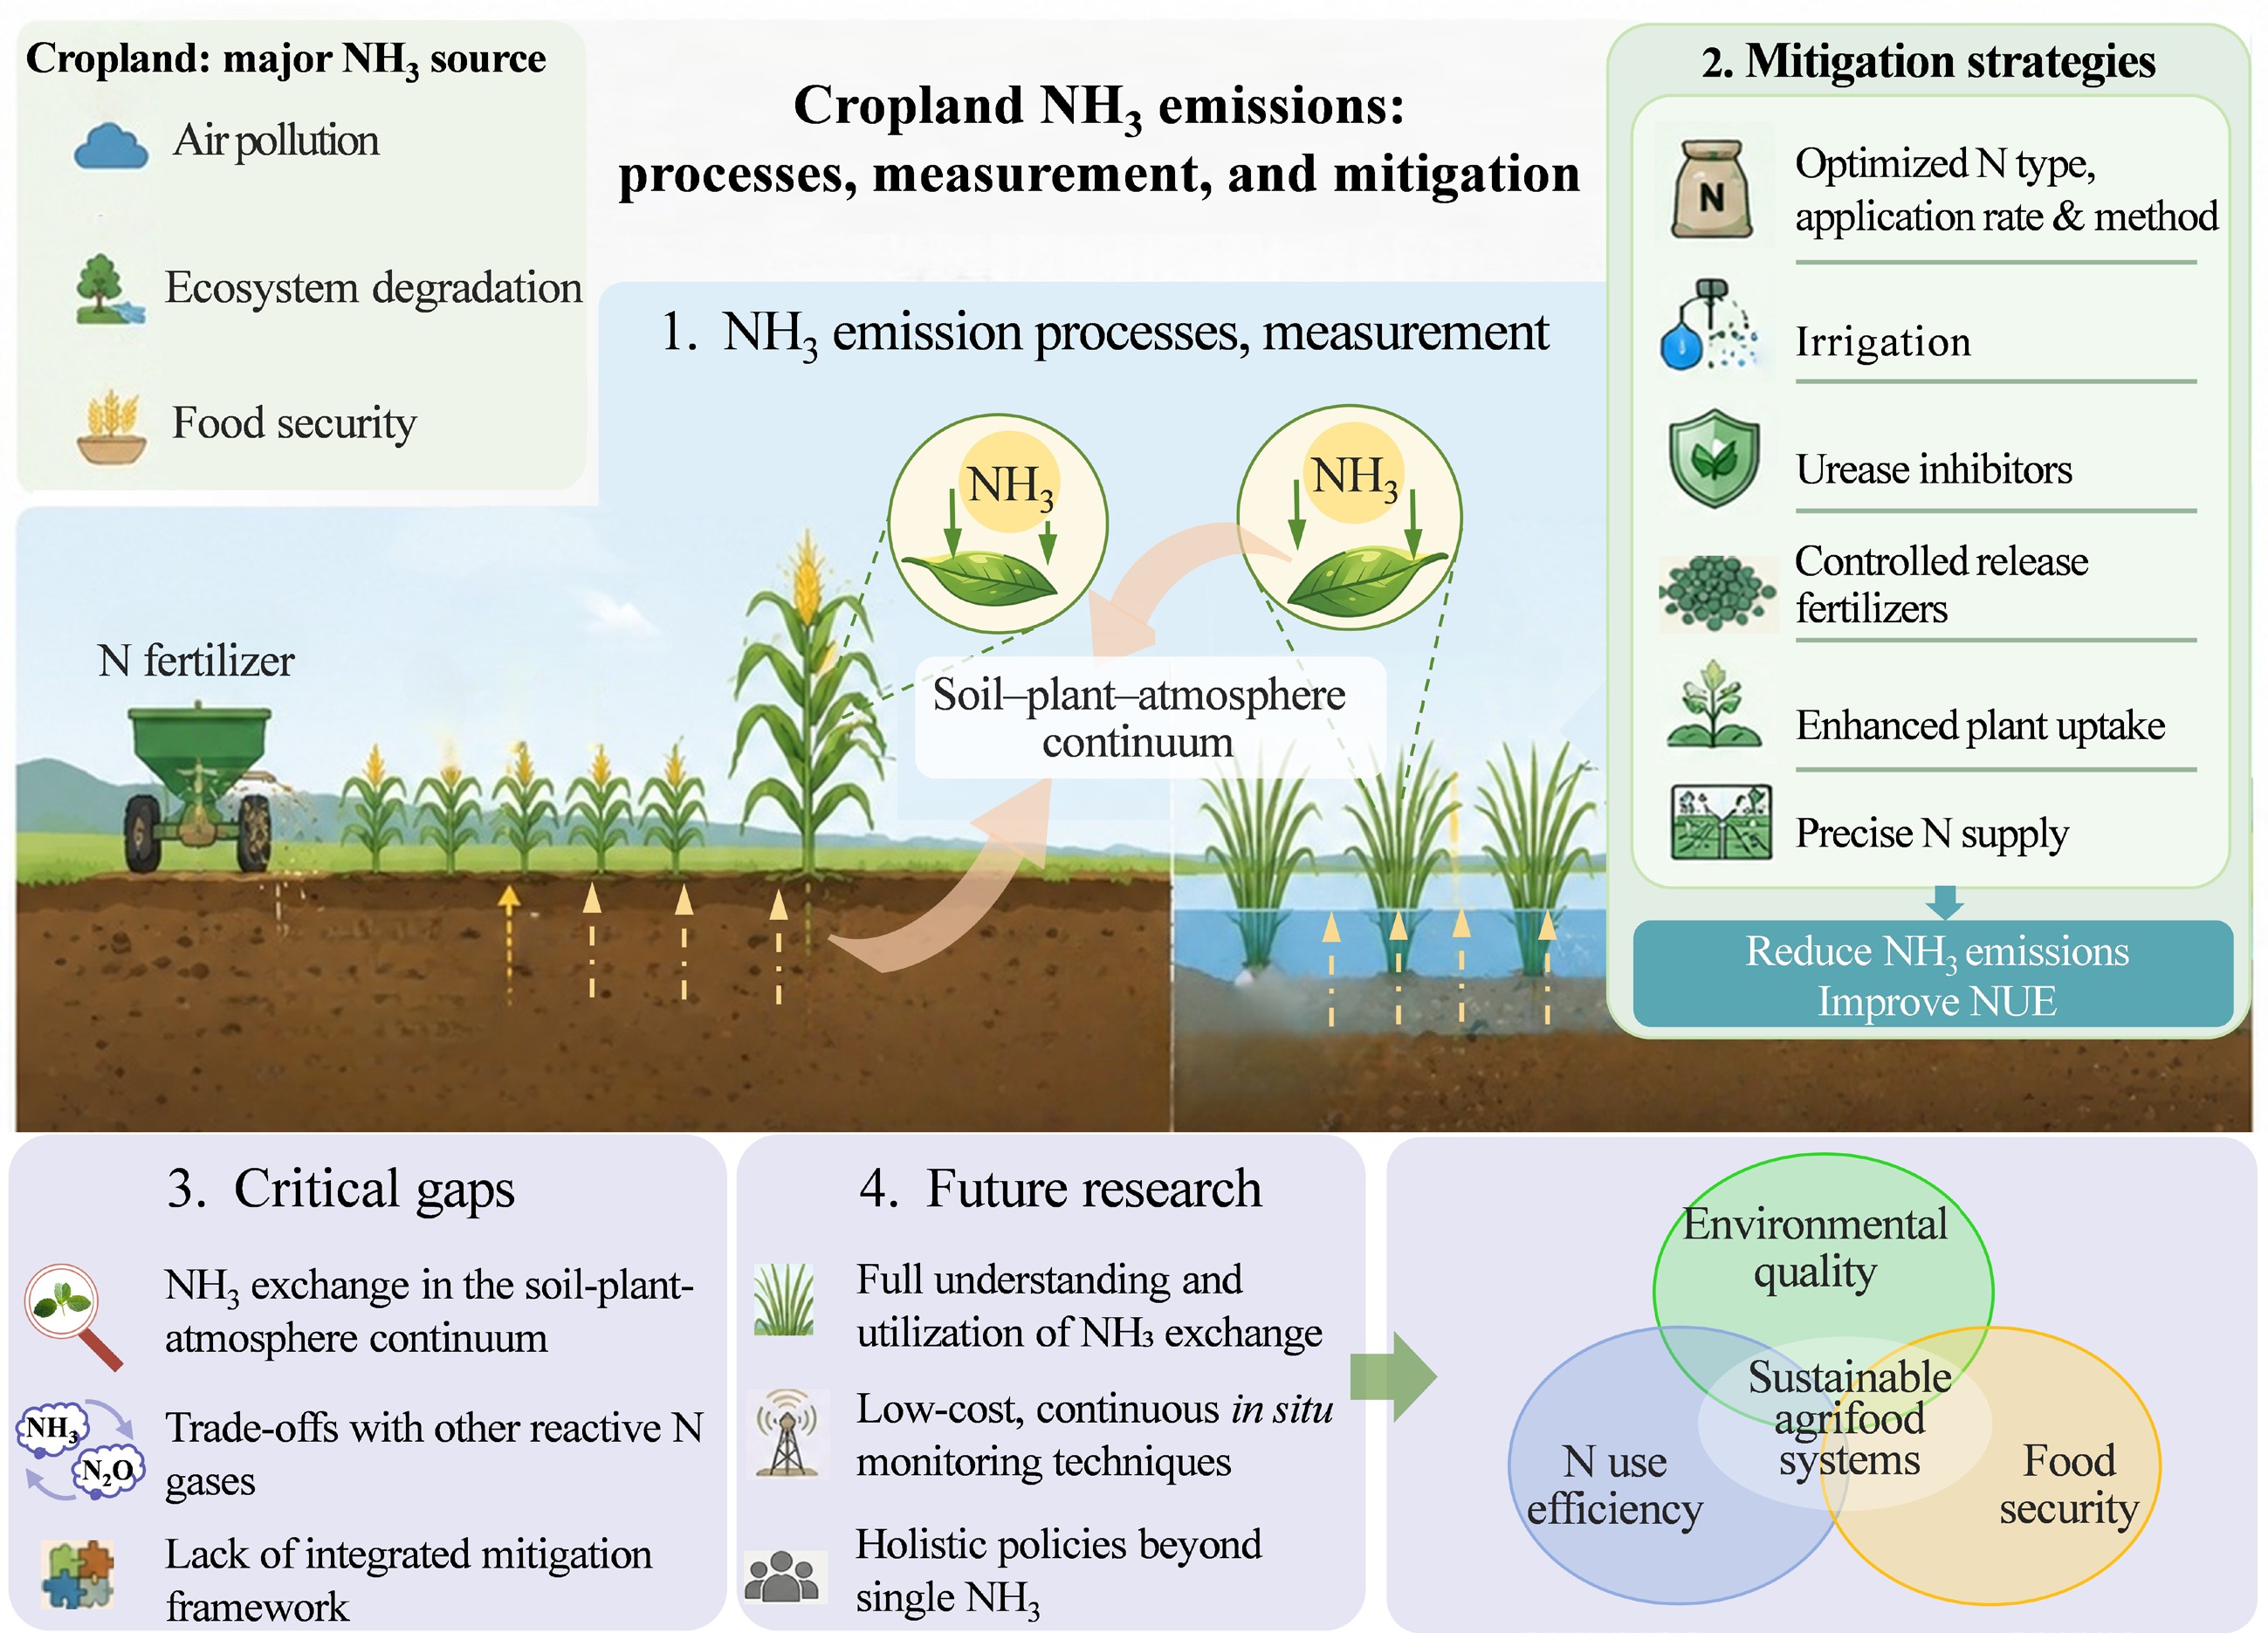
Ammonia (NH3) emissions from agricultural activities, particularly from croplands, account for more than 35% of total global emissions[1]. These substantial cropland NH3 emissions trigger a cascade of negative environmental impacts. These include the formation of fine particulate matter (PM2.5), which harms human health, as well as soil acidification, eutrophication of aquatic ecosystems, and biodiversity loss in natural ecosystems[2−5]. From an agronomic perspective, NH3 volatilization from croplands represents a significant loss of reactive nitrogen (N), undermining nitrogen use efficiency (NUE) and exacerbating environmental risks. Hence, accurately estimating and mitigating NH3 emissions is crucial for achieving sustainable agriculture, improving air quality, and addressing climate change. Moreover, elucidating the mechanistic drivers of NH3 emissions provides the fundamental scientific basis for developing evidence-based N management strategies that reconcile crop productivity with environmental protection.
Research on NH3 emissions from applied N fertilizers in croplands spans over 70 years (Fig. 1), during which methodologies for measuring NH3 emissions have evolved significantly. Early research primarily relied on chamber methods to detect NH3 losses[6−8]. As the demand for continuous field-scale monitoring grew, techniques evolved toward micrometeorological approaches, including the integrated horizontal flux (IHF) method, the aerodynamic gradient method (AGM), and the relaxed eddy accumulation (REA) method[9−11]. Most recently, the field has advanced to high-frequency, non-intrusive measurements employing sophisticated techniques such as eddy covariance (EC)[12] and the backward Lagrangian Stochastic (bLS) model[13], enabling a more accurate characterization of dynamic emission fluxes.
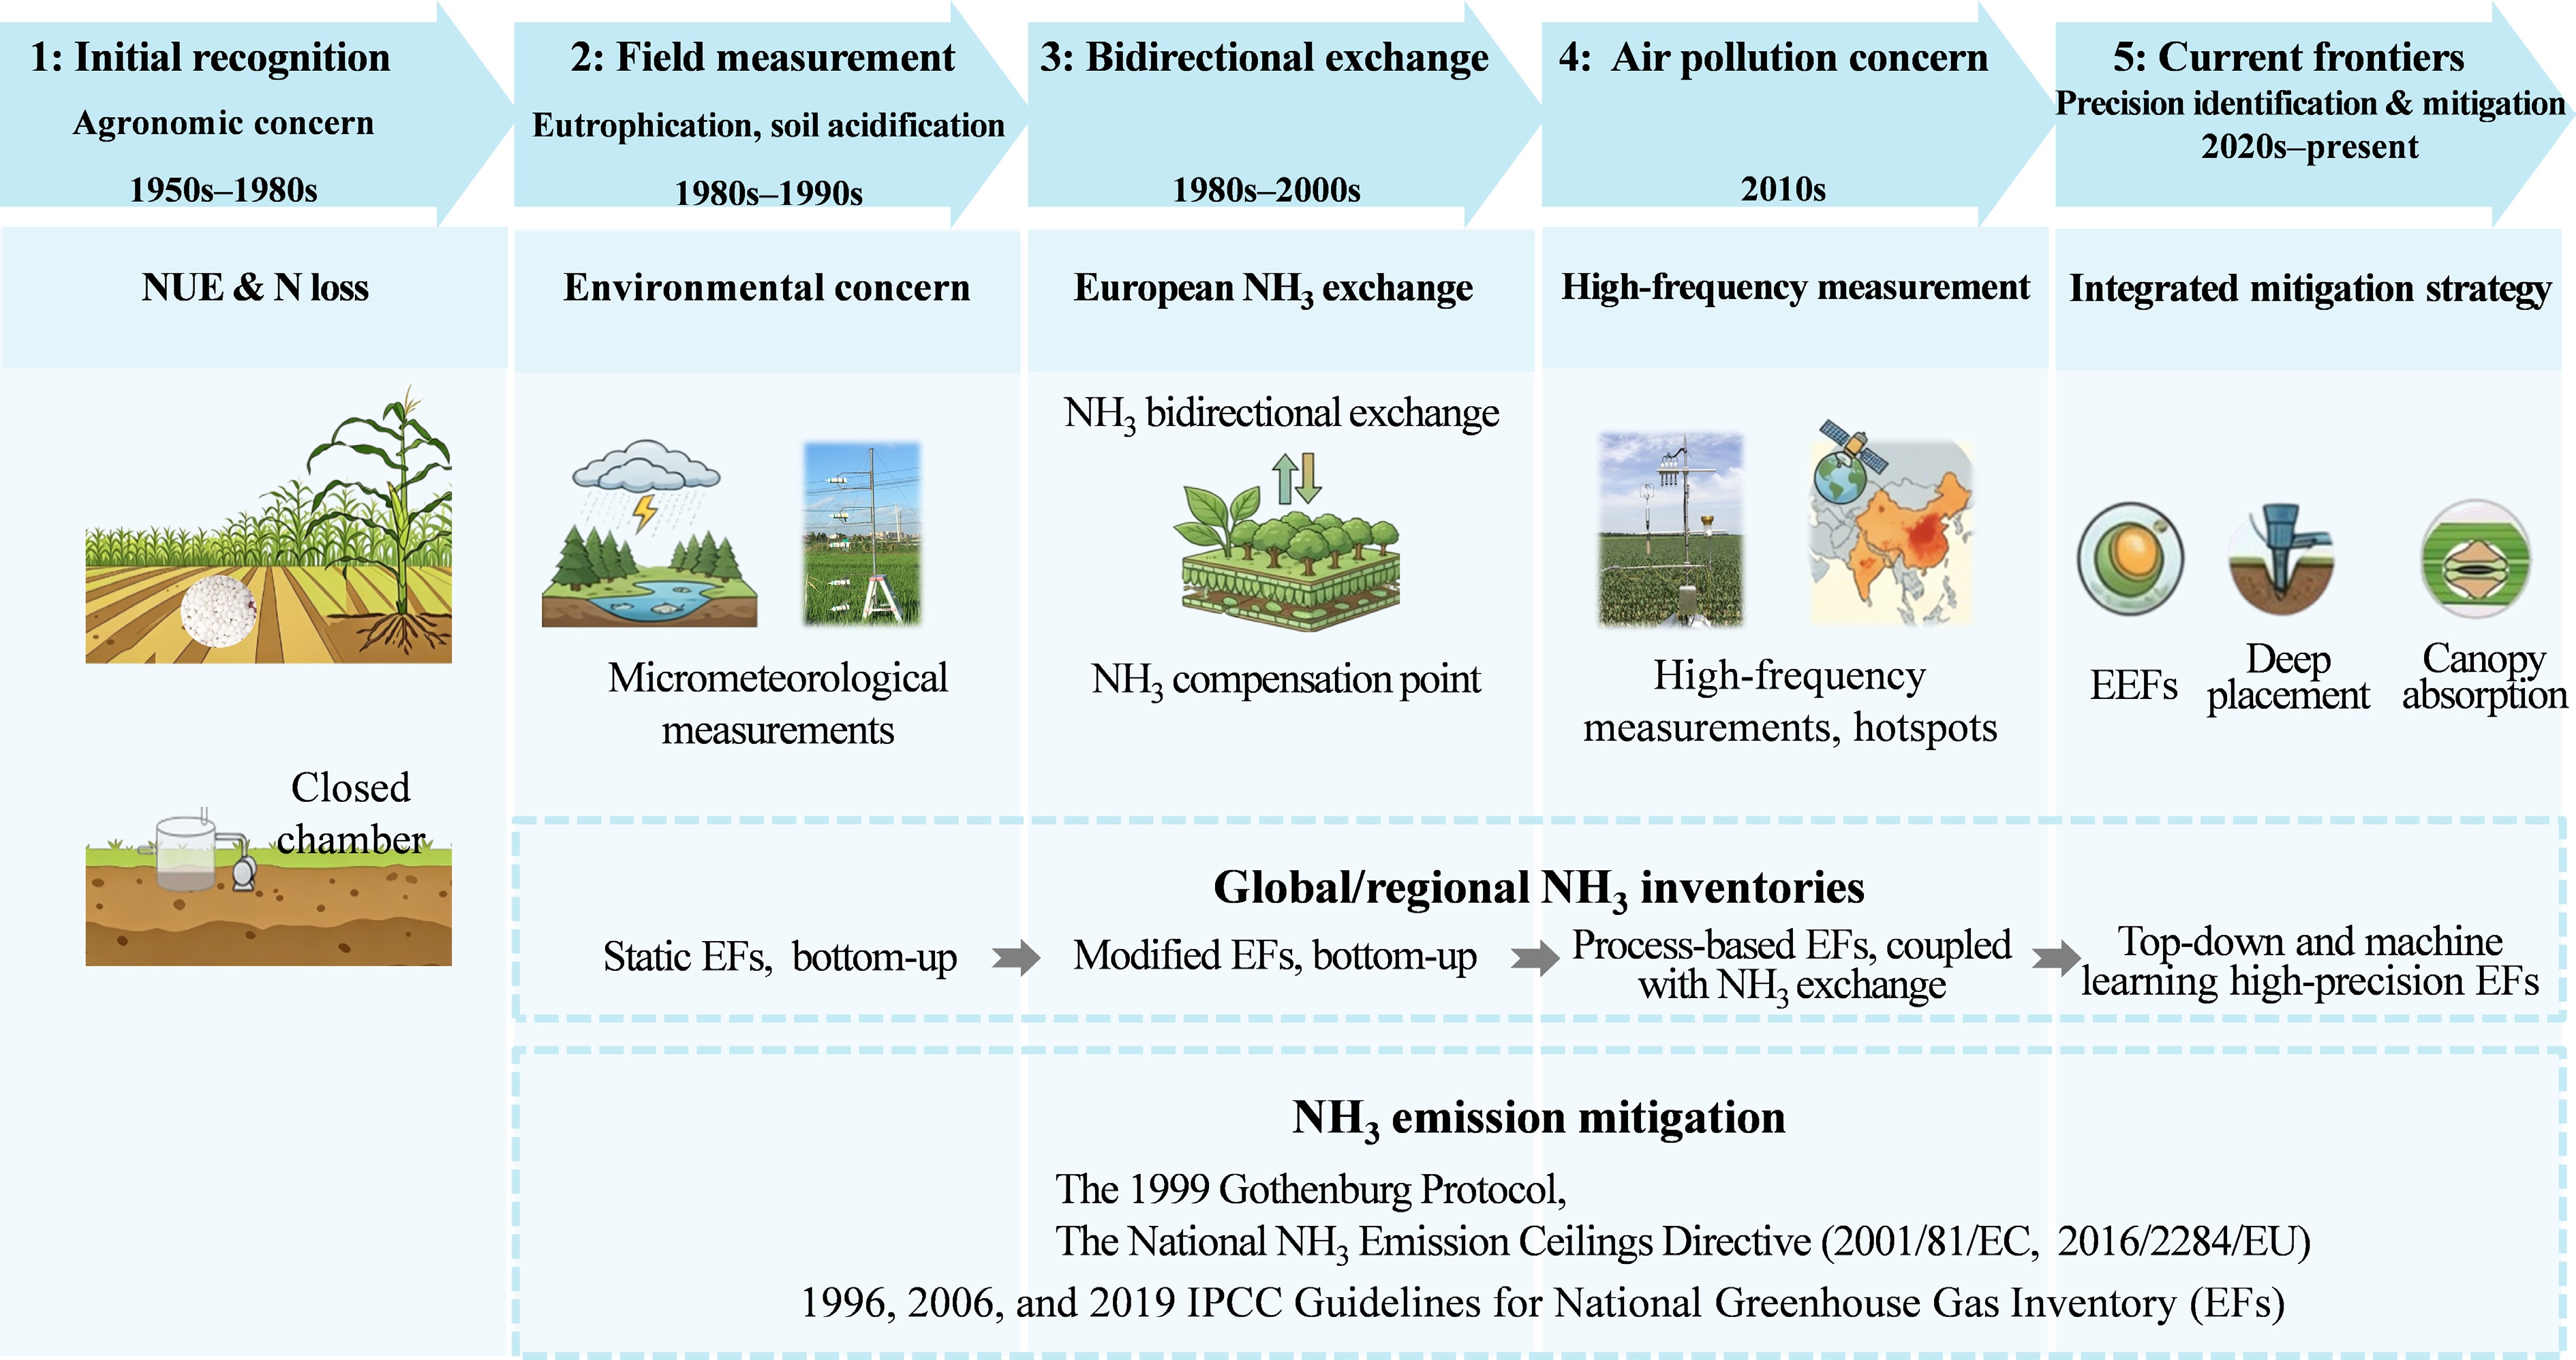
Figure 1.
An historical framework of research concerning NH3 emissions from croplands. NUE-nitrogen use efficiency; EEFs-enhanced efficiency fertilizers; EFs-emission factors; EC-European Commission; EU-European Union; IPCC-Intergovernmental Panel on Climate Change.
In addition, significant advancements in NH3 emission inventories, primarily through bottom-up estimates and top-down inversions, have been achieved. Traditional bottom-up approaches combine activity data with emission factors (EFs) derived from empirical emission rates, field observations, or process-based modeling. Foundational databases such as EDGAR (Emissions Database for Global Atmospheric Research) are regularly updated to improve their spatiotemporal resolution and provide comprehensive global baselines[14]. Since static bottom-up inventories often fail to capture rapid temporal fluctuations, recent studies have significantly refined NH3 inventories using dynamic, meteorology-dependent process models that integrate high-resolution climate data and soil–plant system parameters[15]. Additionally, incorporating bidirectional NH3 exchange methodology holds great potential to improve traditional estimates, though large uncertainties remain[16,17]. Concurrently, advancements in satellite remote sensing have revolutionized NH3 estimates. Satellite-based instrumentation, such as CrIS and IASI, now provides high-resolution column densities of NH3. Satellite-derived top-down observations, coupled with network measurements of NH3/NH4+ deposition, are increasingly used to calibrate and refine bottom-up inventories[15,18].
More recently, artificial intelligence (AI) and machine learning (ML) have emerged as powerful tools to overcome limitations of traditional NH3 estimation methods by capturing the complex, synergistic effects of meteorological factors and agricultural management practices. Data-driven algorithms process massive datasets to generate high-resolution NH3 flux estimates and identify emission hotspots. Notably, Xu et al. developed ML models to generate global crop-specific EFs, demonstrating that optimizing fertilizer management can reduce NH3 emissions by ~38% without altering total N inputs[19]. However, a major limitation of AI approaches is their heavy reliance on the quantity and quality of training data. Future research should target coupling AI with process-based models and robust observational datasets to achieve both predictive accuracy and mechanistic interpretability.
At the same time, the paradigm of NH3 emission control has shifted from solely an agronomic NUE concern to a dual objective of enhancing NUE while safeguarding air, water, and soil quality[20]. The concept of minimizing NH3 emissions has deep historical roots. Empirical knowledge from Chinese agriculture over 400 years ago recognized NH3 as a 'fertilizer gas' and advocated for deep soil incorporation[21], as documented in ancient agricultural texts: '深则肥气深入土中,徐徐讨力,且根派深远' (if fertilizer is applied deep into the soil, the 'fertilizer gas' penetrates the soil deeply, allowing nutrients to release gradually and promote extensive root development). Contemporary science has validated this ancient wisdom. Modern meta-analyses have demonstrated that deep placement of fertilizer can reduce NH3 emissions by 48.0%. Furthermore, the adoption of enhanced-efficiency fertilizers (EEFs), such as controlled-release fertilizers and urease inhibitors (UIs), can significantly reduce NH3 emissions by 56.8% and 53.1%, respectively[22]. At a macro level, implementing an ambitious, integrated management framework encompassing all known mitigation practices could abate global cropland NH3 emissions by up to 71%[23].
In response to the escalating environmental burden, governments and international organizations have enacted policies to regulate excessive N fertilizer use and curb NH3 emissions. For instance, the Gothenburg Protocol and the National NH3 Emission Ceilings Directives (2001/81/EC, 2016/2284/EU) in the European Union set strict NH3 reduction targets for member states. Similarly, China has launched action plans to cap synthetic fertilizer use and improve air quality, evolving from the 'Action Plan for Zero Increase in Fertilizer Use by 2020' (2015) to the 'Three-year Action Plan for Winning the Blue Sky War' (2018) and the 'Action Plan for Continuous Improvement of Air Quality' (2023).
Despite these research and policy advancements, critical knowledge gaps remain. These knowledge gaps include an incomplete mechanistic understanding of bidirectional NH3 exchange processes, discrepancies in field-scale observations across different measurement methods, and a lack of integrated strategies to co-mitigate the loss of multiple reactive N gases. Bridging these gaps is essential for reconciling agricultural productivity with ecosystem health. Consequently, this review aims to critically synthesize the current literature on NH3 emission processes across the soil–water–plant–atmosphere continuum in croplands. Specifically, we analyze the underlying mechanisms and influencing factors, evaluate the main techniques for measuring NH3 emissions, and assess the current mitigation strategies. Finally, we highlight key areas for future research. Overall, this review offers an integrated perspective on cropland NH3 emissions, aiming to facilitate the development of robust N management strategies that enhance NUE, mitigate NH3 emissions, and ultimately achieve agricultural sustainability.
-
NH3 emissions from croplands involve a complex, multi-step mass transfer process: the conversion of aqueous NH4+ to dissolved NH3 within the soil solution, the subsequent volatilization and diffusion of NH3 across the soil–air interface, the emission from the soil, and the final transport through the plant canopy into the free atmosphere (Fig. 2).
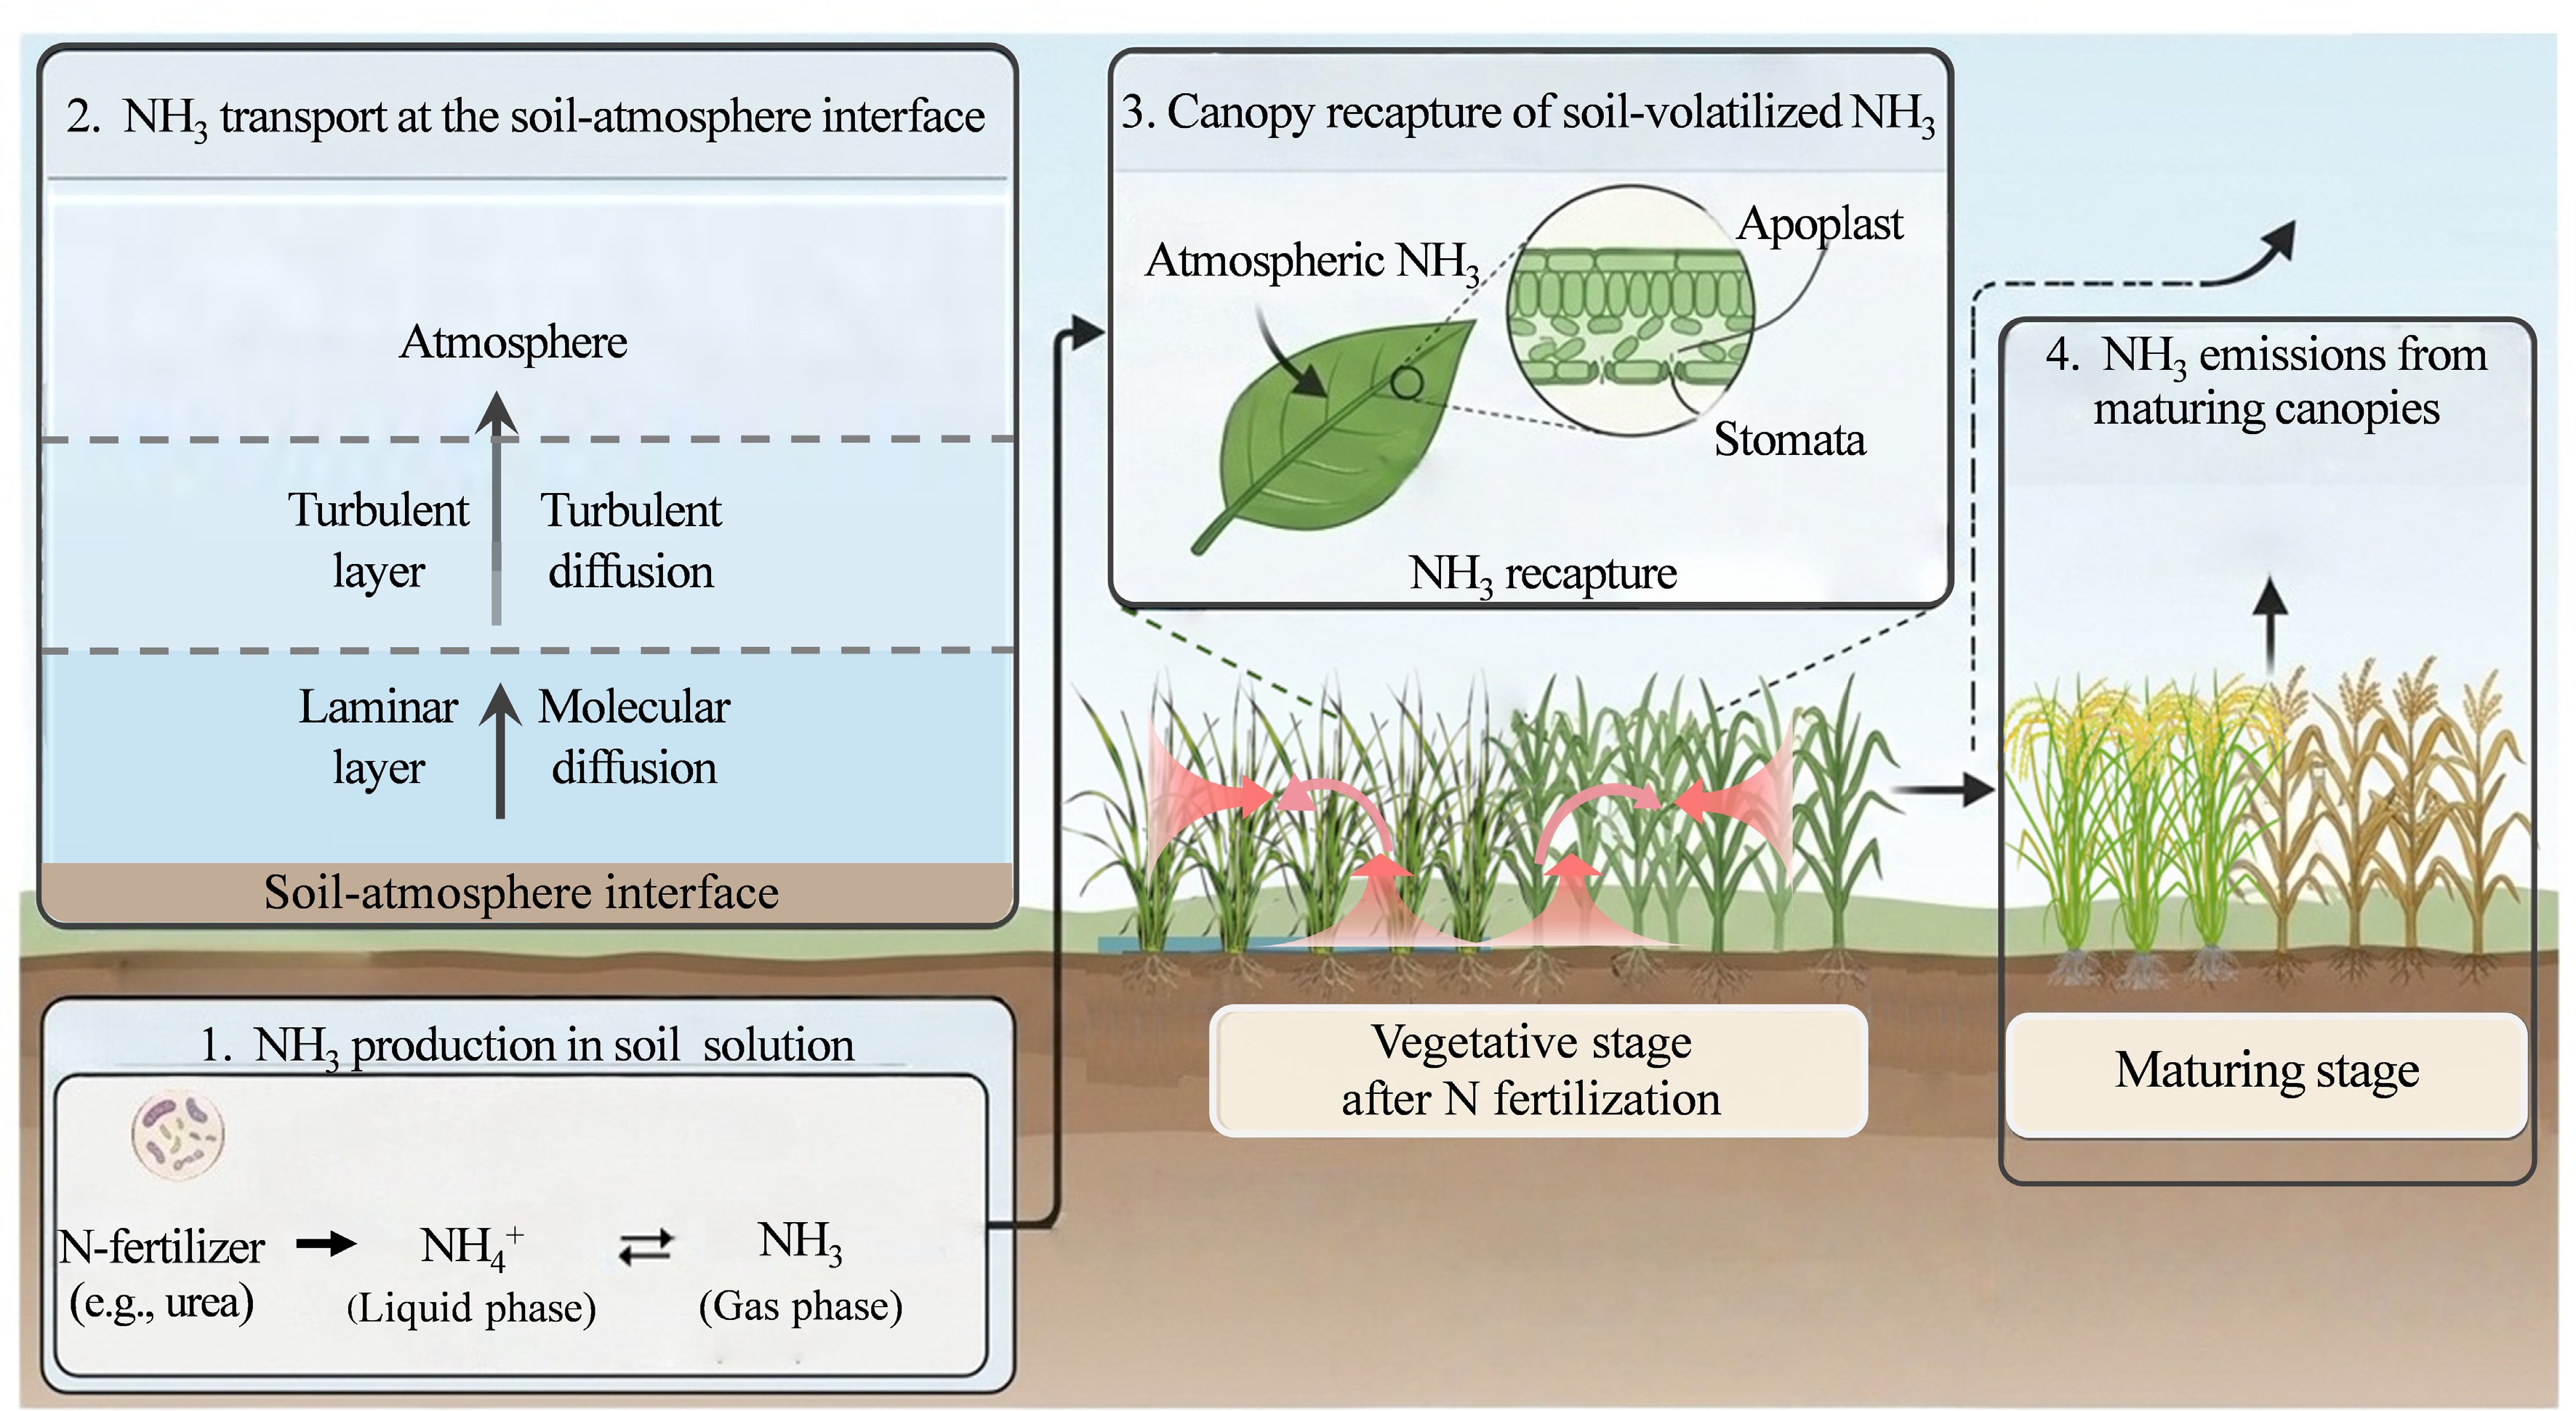
Figure 2.
Processes of NH3 emissions across the soil–water–plant–atmosphere continuum.
The magnitude and direction of NH3 flux are fundamentally governed by the concentration gradient and transport resistances between the emitting surface and the boundary layer. At the soil–atmosphere interface, the concentration gradient is driven by the total ammoniacal N pool and the thermodynamic equilibrium between NH4+ and NH3 in the soil solution, whereas transport resistances are primarily dictated by atmospheric turbulence[24]. At the canopy–atmosphere interface, NH3 exchange is a bidirectional process and is mainly governed by the NH3 compensation point, which depends on plant type, growth stage, and N status[25,26].
To assess these bidirectional fluxes and incorporate these processes into global or regional NH3 emission evaluations, resistance-based models have been developed[27,28]. Recent advances in these models have transitioned from initial static, empirical variables to process-based parameterizations of emission potentials. Furthermore, the implementation of multi-layer canopy architectures into these models can capture in-canopy turbulence. Ultimately, the incorporation of these resistance models into regional chemical transport models (CTMs) has the potential to reduce uncertainties in global NH3 inventories[16,29,30].
The production of gaseous NH3 in the soil solution
-
Following the application of NH4+ or urea-based N fertilizer to croplands, a series of physicochemical reactions occur at the soil–solution–gas interfaces. The chemical equilibrium equations governing NH3 volatilization are as follows:
$\begin{split}&\text{N fertilizer}\downarrow \\ & \text{NH}_{\text{4(substitutive)}}^+\rightleftharpoons\text{NH}_{\text{4(liquid phase)}}^+\leftrightharpoons{\text{NH}}_{\text{3(liquid phase)}}\\&\rightleftharpoons{\text{NH}}_{\text{3(gas phase)}}\leftrightharpoons{\text{NH}}_{\text{3(atmosphere)}} \end{split}$ (1) In dryland soil, the liquid phase refers to the soil solution[31]. In flooded rice fields, the liquid phase corresponds to shallow floodwater, and the gas phase refers to the air above it[24]. Factors that drive the above chemical equilibria to the right promote NH3 volatilization[31]. The equilibrium between NH4+ and NH3 is regulated by pH and temperature, shifting to the right in environments with high pH and elevated temperatures. Specifically, following the application of urea (CO[NH2]2), the urease-catalyzed hydrolysis process produces NH3, NH4+, and HCO3−. This reaction consumes H+, thereby raising soil pH and promoting NH3 volatilization[32].
Attention must be paid to NH3 volatilization processes in rice paddy fields, which occupy approximately 11% of the global cropland area and where production is predominantly concentrated in South and East Asia. NH3 volatilization in paddy fields differs fundamentally from that in dryland systems due to the presence of floodwater and underlying anaerobic conditions. Upon N fertilizer application, the lack of oxygen in the submerged soil layer suppresses nitrification, thereby maintaining high concentrations of NH4+-N in the floodwater. Furthermore, paddy fields exhibit unique pH dynamics in floodwater driven by algal activity. During the daytime, the intense photosynthetic consumption of dissolved CO2 by algae drives the floodwater to highly alkaline levels (often exceeding pH 8.5 and occasionally reaching 9.0–10.0), despite the soil pH remaining at 5.5–6.0[33,34]. This diurnal pH spike shifts the chemical equilibrium from aqueous NH4+ towards volatile NH3, triggering substantial pulses of NH3 volatilization.
The transport of NH3 at the soil–atmosphere interface
-
NH3 transport at the soil–atmosphere interface primarily depends on two factors: the NH3 concentration gradient between the soil surface and the atmosphere, and wind speed. A large concentration gradient is the primary driving force for volatilization, while high wind speed accelerates the removal of NH3 from the boundary layer[35]. The air above the soil surface consists of a laminar boundary layer topped by a turbulent layer. The NH3 at the soil–air interface is transported across the laminar layer via molecular diffusion, and subsequently through the turbulent layer to the atmosphere via turbulent diffusion.
NH3 exchange between the crop canopy and the atmosphere
Canopy recapture of soil-volatilized NH3
-
Following N fertilizer application to croplands with an established canopy, the recapture of volatilized NH3 by foliage plays a pivotal role in determining the magnitude of net atmospheric NH3 emissions[36,37]. The exchange of NH3 between plant canopies and the atmosphere is inherently bidirectional. Plant canopies act as a sink for NH3 when the ambient NH3 concentration exceeds the NH3 compensation point in the apoplast[20,26]. This compensation point is directly determined by leaf temperature and the emission potential (Γ), defined as the ratio of NH4+ to H+ concentration in the leaf apoplastic fluid[38].
Based on apoplastic extraction methods, wild and semi-natural plants typically exhibit very low compensation points of 0.5–2.0 nmol/mol[39,40], whereas fertilized crops generally display higher values of 2.0–10.0 nmol/mol[41−43]. However, an exception is observed in rice leaves during the vegetative growth stage, where NH3 compensation points can be as low as 0.4–0.6 nmol/mol, even under adequate N fertilization. This anomalously low compensation point is attributed to a high density of chloroplasts, which facilitate rapid assimilation of NH4+ in the mesophyll apoplast[44].
Canopy absorption has been shown to exhibit a linear response to ambient NH3 concentrations[45]. Furthermore, in pasture or wheat fields, the canopy's capacity to absorb volatilized NH3 increases with canopy height. For instance, the NH3 emission reduction rate has been estimated at 2.5%–5.0% per cm of crop height[46,47]. Mechanistically, the crop canopy alters the local microclimate, particularly by reducing wind speed, thereby prolonging the residence time of volatilized NH3 and facilitating its recapture.
A substantial proportion of soil-volatilized NH3 can be recaptured by the upper foliage, driving a significant internal NH3 cycle within the canopy[48]. Studies have demonstrated that a well-developed canopy can recapture over 50% of the NH3 volatilized from the soil surface[46,49,50]. However, such high recapture rates are not universally applicable across all ecosystems. While dense canopies like corn can absorb up to 70% of the volatilized NH3[36], efficiencies in other systems are often lower. For example, tomato canopies absorbed 24%–38% of the applied NH3 after the flowering stage[51], and coffee canopies reabsorbed 43% of enhanced soil-volatilized NH3[52].
Moreover, recapture efficiency varies considerably across plant growth stages and measurement techniques. In rice fields, at the early tillering stage, the canopy could only recapture 16.0% of the floodwater-volatilized NH3. When evaluated with a portable NH3 detector in a rice–wheat rotation, the rice and wheat canopy recaptured only 3%–5% of the soil-volatilized NH3[53]. In non-agricultural ecosystems, such as temperate grasslands or natural forests, recapture rates are highly dependent on canopy density and leaf area index[54,55]. Overall, canopy recapture is governed by complex conditions, underscoring the need for ecosystem- and growth stage-specific parameterization.
Canopy NH3 emissions
-
Whether a crop canopy emits NH3 depends on the difference between the leaf NH3 compensation point and the ambient NH3 concentration[56]. When the ambient levels fall below the NH3 compensation point, NH3 in the apoplast volatilizes through the stomata into the atmosphere. During leaf senescence or the post-anthesis period in cereals, the rapid degradation of Rubisco and other proteins leads to a significant accumulation of NH4+, triggering a surge in canopy NH3 emissions[57,58]. Generally, canopy NH3 emission potential increases with N application rate, and accumulated NH3 emissions over the growing season show a positive correlation with above-ground crop N content at anthesis[10].
-
Accurately measuring NH3 fluxes is challenging due to the gas's high solubility, chemical reactivity, and spatiotemporal variability[59]. Historically, methodologies have evolved from simple enclosure-based methods to sophisticated laser-based micrometeorological methods[60,61]. These approaches can be broadly classified into indirect methods, chamber methods at the plot scale, and micrometeorological methods at the field scale (Fig. 3). Detailed technical descriptions and flux calculation equations for each technique are provided in the Supplementary Text S1.
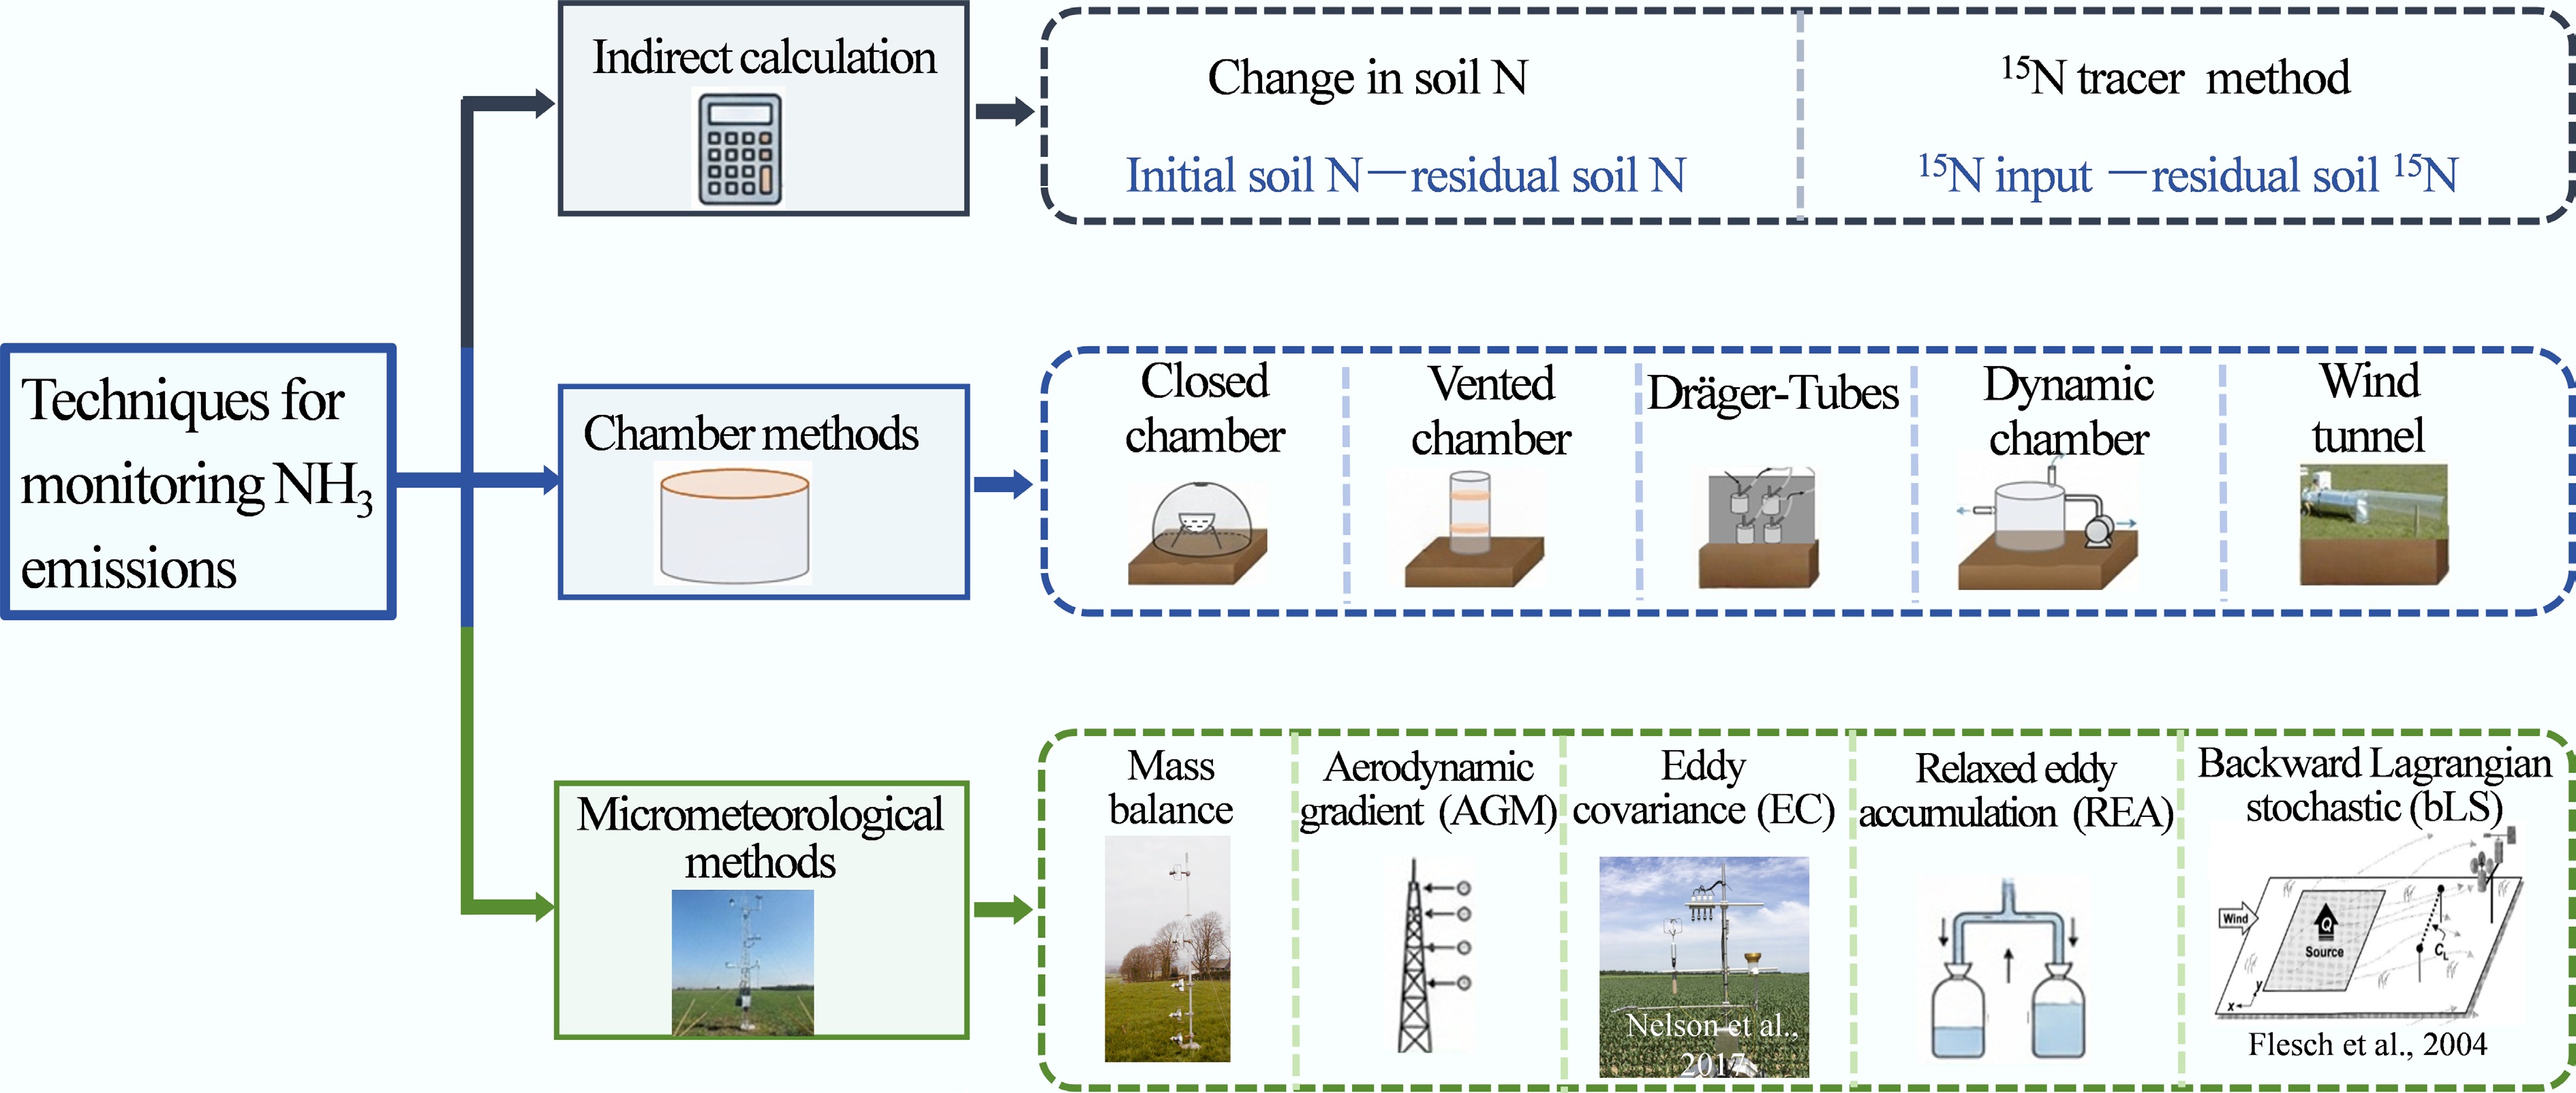
Figure 3.
Overview of techniques used to quantify NH3 emissions from croplands.
Indirect measurement methods
-
Indirect methods estimate NH3 emissions by calculating the unaccounted-for N pool in the soil–plant system using mass balance, rather than directly capturing the emitted gas. However, this approach frequently overestimates NH3 emissions[62] because it inadvertently includes other N-loss pathways (e.g., denitrification). The accuracy can be improved by employing the 15N-tracing technique[63].
Direct measurement methods
-
Direct measurement methods are currently the primary approaches used for monitoring NH3 emissions and are broadly categorized into chamber methods and micrometeorological methods.
Chamber methods
-
Chamber methods, encompassing closed chambers, vented chambers, dynamic chambers, Dräger-Tubes, and wind tunnels, are primarily used for comparative studies of different treatments across small field plots.
Passive chambers (closed and vented) are inexpensive, easy to operate, and require no power supply. However, they drastically alter the internal microclimate (e.g., wind speed and temperature), which often leads to a substantial underestimation of NH3 fluxes[64].
Active chambers (dynamic chambers and Dräger-Tubes) require active pumping to maintain airflow. In dynamic chambers, air is drawn through at a constant rate, and the exhausted air passes through acid traps[65]. A critical limitation here is that the estimated NH3 flux is highly dependent on the air exchange rate[66]. The Dräger-Tubes method is a portable variant in which ambient air is pulled through the chambers and analyzed instantly using colorimetric tubes[67,68]. To improve accuracy, fluxes derived from Dräger-Tubes must be empirically calibrated using ambient wind speeds at a 2.0 m height[69].
Wind tunnels utilize an automatic fan system to match the internal wind speed of a half-cylinder or rectangular tunnel to external environmental conditions. This method simulates field conditions and is suitable for small-scale, multi-treatment studies[70,71]. However, the equipment is relatively complex, and it cannot simulate calm wind conditions or precipitation.
Micrometeorological methods
-
Micrometeorological methods are explicitly designed for large, open-field areas. Their significant advantage is that they are non-intrusive and integrate spatial heterogeneity, thereby providing representative field-scale flux measurements. However, they generally require large, uniform areas, stable meteorological conditions, and capital-intensive equipment.
The integrated horizontal flux (IHF) method is widely considered a standard micrometeorological method for measuring NH3 emissions following fertilization[72]. It calculates vertical NH3 flux by integrating horizontal fluxes across a vertical cross-section of the plume[62]. The invention of the passive Leuning sampler has greatly simplified its operation[73].
The aerodynamic gradient method (AGM) and the relaxed eddy accumulation (REA) method are highly suitable for monitoring net bidirectional exchange (emission vs absorption) above crop canopies[11,74]. AGM derives fluxes from vertical concentration profiles and turbulence information[75,76], whereas REA segregates updrafts and downdrafts into separate reservoirs, avoiding the need for high-frequency gas analyzers[11].
The eddy covariance (EC) method can quantify both NH3 emissions and deposition fluxes by computing the covariance between simultaneous, high-frequency measurements of turbulent air movements and fast-response gas concentrations[12].
The backward Lagrangian stochastic (bLS) model is a robust, flexible dispersion modeling approach that calculates NH3 fluxes by simulating the backward trajectories of air parcels from downwind monitors back to the source area[77]. When coupled with open-path lasers (OP-TDLAS), it enables instantaneous, continuous, and non-intrusive monitoring without perturbing natural microclimates. However, it becomes unreliable under low-turbulence conditions or extreme atmospheric stability[13,78].
Comparative summary of measurement techniques
-
To provide a concise guide for selecting appropriate monitoring techniques, the spatial coverage, precision, cost, and suitability of the major NH3 measurement techniques are summarized in Table 1.
Table 1. Comparison of major techniques measuring NH3 emissions from croplands
Measurement technique Spatial coverage Precision Cost and labor requirement Suitability and limitation Indirect methods Plot to field scale Low to medium (overestimates NH3 losses. 15N tracing improves accuracy) Low to high cost (high for 15N isotopes), high labor (soil sampling) Suitable for estimating short-term losses under specific circumstances Passive chambers
(closed, vented)Small plot scale (0.01–0.2 m2) Low (underestimates NH3 fluxes by 26%–63% by dampening wind speed[13,79]) Very low cost, low labor, no power supply required Ideal for relative comparisons among treatments in remote areas. Not suitable for absolute emission quantification Active chambers (dynamic chambers, Dräger-Tubes) Small plot scale (0.01–0.2 m2) Medium to high (highly depends on air exchange rate and calibration) Medium cost, moderate labor; dynamic chambers require continuous power Suitable for plot-scale treatment comparisons Wind tunnels Small plot scale
(~1 m2)High (effectively simulates aerodynamic conditions) High cost, complex equipment setup, requires continuous power Suitable for plot-scale treatment comparisons. Cannot simulate calm winds Integrated horizontal flux
(IHF)Field scale
(15‒50 m radius)High (integrates spatial heterogeneity) Medium cost, high labor (frequent sampler replacement and lab analysis) Recommended standard for post-fertilization measurements in uniform, open fields Aerodynamic gradient
method (AGM)Field scale (ha) High (sensitive to atmospheric stability and NH3 gradient) Medium cost, high labor (depends on sampler type) Suitable for bidirectional exchange in large, uniform ecosystems Relaxed eddy accumulation (REA) Field scale (ha) Medium to high (provides time-averaged fluxes) Medium cost, high labor (depends on sampler type) Suitable for bidirectional exchange in large, uniform ecosystems Eddy covariance (EC) Field scale >(ha) High (provides high-frequency temporal resolution) High cost (requires fast-response laser spectrometers), high computational expertise Ideal for continuous, real-time, and long-term monitoring of bidirectional fluxes Backward Lagrangian stochastic model (bLS) Field-to-farm scale High (highly flexible source configuration) High cost (if using open-path lasers), high computational expertise Highly suitable for quantifying emissions from complex, distinct, or heterogeneous sources -
NH3 emissions from croplands are dynamically governed by the interplay among soil characteristics, environmental conditions, management practices, and crop/microbial assimilation[24,31,80] (Fig. 4). Soil properties dictate the internal thermodynamic and biochemical volatilization potential. Environmental factors act as external catalysts. Management practices determine the initial state and spatial distribution of the N source, and they also alter soil and environmental conditions.
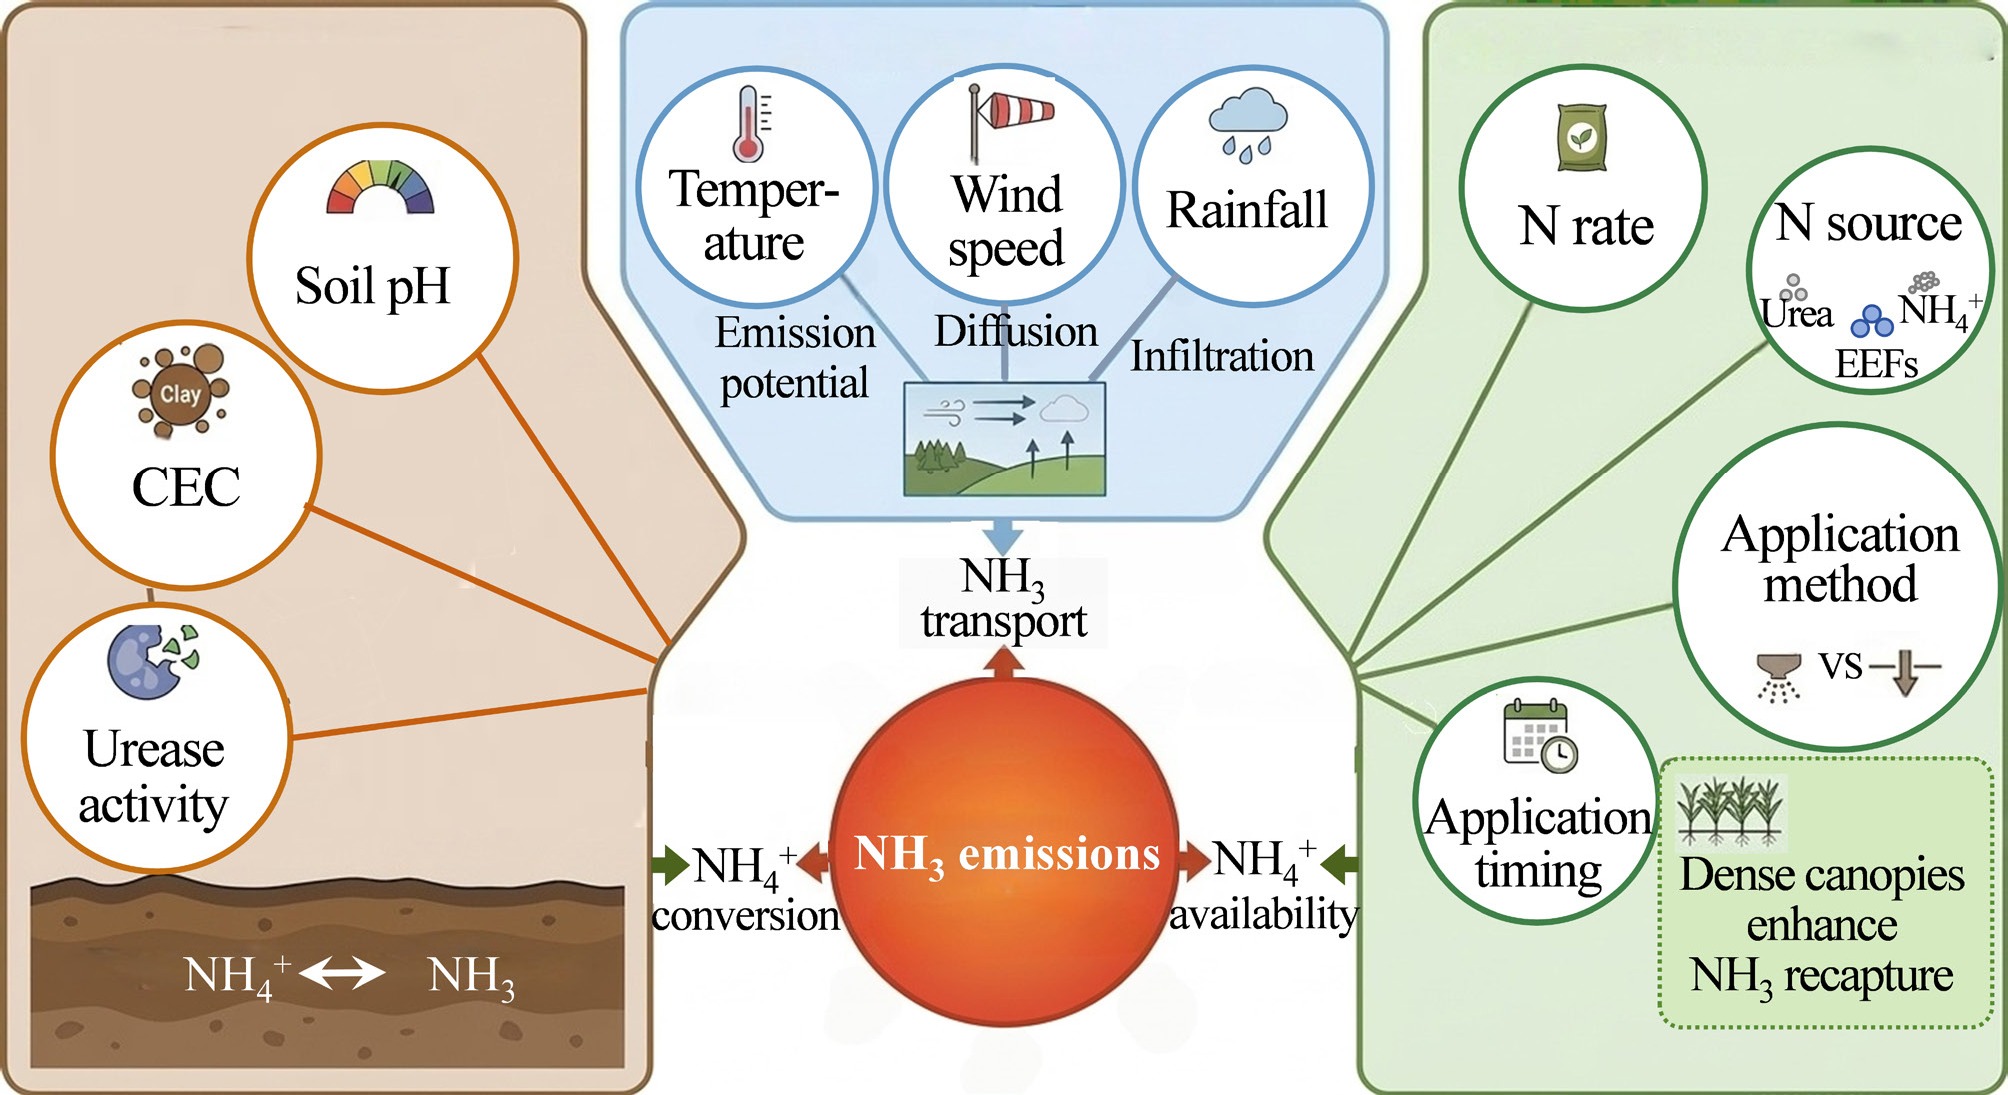
Figure 4.
Schematic diagram of factors modulating NH3 emissions from croplands. CEC-cation exchange capacity; EEFs-enhanced efficiency fertilizers.
Soil properties
-
Soil pH is the primary driver of NH3 volatilization. Elevated soil pH exponentially increases the potential for NH3 volatilization by accelerating the deprotonation of NH4+ to aqueous NH3[81]. Fertilizers such as urea inherently raise the local pH around the granule during hydrolysis, driving higher NH3 losses[82]. Soils with a high buffering capacity attenuate these localized pH spikes, thereby suppressing NH3 emissions.
Cation exchange capacity (CEC), determined by clay mineralogy, soil texture, and soil organic matter (SOM) content, regulates NH3 emissions by providing negatively charged sites. High-CEC soils electrostatically retain more NH4+, effectively buffering changes in the soil solution and reducing the size of the N pool susceptible to volatilization[83].
Soil urease activity is a key factor influencing NH3 volatilization rates following urea application. The initial phase involves the catalytic hydrolysis of urea into ammonium carbonate by extracellular urease (optimum pH 7.0‒9.0)[84]. Synthesized by diverse soil bacteria and fungi, this enzyme's capacity is frequently evaluated using the abundance of the ureC gene as a molecular marker. Notably, crop residues harbor high urease activity, up to 20 times that of the underlying soil, exacerbating rapid hydrolysis of applied urea when residues remain on the soil surface[85].
Soil nitrification, primarily driven by ammonia-oxidizing bacteria (AOB) and archaea (AOA), rapidly converts NH4+ into nitrite. When soil conditions favor the proliferation of AOB and AOA, the rapid consumption of NH4+ limits NH3 volatilization. The intricate balance between ureC-mediated hydrolysis and amoA-mediated nitrification is crucial for managing the biological drivers of NH3 dynamics.
Environmental conditions
-
Temperature: Post-fertilization temperature regulates NH3 emissions through three mechanisms: (1) stimulating urease activity; (2) shifting the NH4+/NH3 equilibrium towards gaseous NH3; and (3) promoting the diffusion rates of urea, NH4+, and NH3 within the soil[80,82].
Wind speed: High winds enhance NH3 emissions by altering the NH3 partial pressure gradient at the soil–atmosphere interface, swiftly removing emitted NH3 to the atmosphere[9,86]. However, this can be partially offset by wind-induced evaporative cooling, which lowers surface temperatures[87]. This can also explain why NH3 emission rates measured using dynamic chamber methods increase with higher air-exchange rates[8,66]. The wind speed effect is modified by soil surface conditions. If there is tall and dense vegetation, the vegetation effectively slows down the wind and reduces the wind effect on NH3 emissions.
Rainfall and irrigation: Light rain on moist soils without deep percolation accelerates urea hydrolysis, thereby exacerbating NH3 emissions[88]. Conversely, post-fertilization heavy rainfall or irrigation can leach surface-applied urea into deeper soil layers, promoting NH4+ adsorption and root uptake, thereby significantly suppressing NH3 losses[89,90].
Fertilizer management practices
N fertilizer rate
-
NH3 emissions frequently exhibit a nonlinear response to N application rates[91,92]. When N inputs exceed the crop uptake capacity and soil's biochemical buffering thresholds, unassimilated NH4+ accumulates in the topsoil, triggering a surge in NH3 volatilization.
N fertilizer type
-
Conventional urea exhibits high emission factors because its hydrolysis consumes H+, creating an alkaline microsite that favors NH3 formation. In contrast, ammonium sulfate and ammonium nitrate generally produce lower NH3 emissions, especially in neutral to acidic soils[93]. Enhanced efficiency fertilizers (EEFs) are highly effective at mitigating NH3 emissions. UIs (e.g., N-(n-butyl)thiophosphoric triamide [NBPT]) delay urea hydrolysis, minimize localized pH/NH4+ spikes, and reduce NH3 emissions by 50%–54%[22,94,95]. Alternatively, controlled-release fertilizers physically encapsulate urea, synchronizing the slow release of N with crop demand, thereby largely eliminating NH3 emissions[96].
Application method
-
Surface broadcasting of urea consistently yields the highest NH3 losses, especially when applied over crop residues[83,97] or in Asian paddy fields, where high temperatures and algal-induced pH spikes can drive losses by up to 46%–54% of applied urea-N[34,79,86,98,99]. Conversely, deep placement (> 5–10 cm) or subsurface banding physically isolates the fertilizer from surface urease, wind, and heat. This globally recognized management practice effectively reduces NH3 emissions by 35%–55%[22,100,101].
Timing of application
-
In upland cropping systems, timing the application (if using broadcast application) before a heavy rainfall event to allow the urea to be washed into the soil will reduce NH3 emissions. Splitting N applications to align with critical crop growth stages synchronizes nutrient supply with crop demand, preventing transient NH4+ accumulation in the topsoil[102]. Furthermore, strategically timing the application of N when the crop canopy is fully developed and dense will allow the overlying foliage to recapture 30%–50% of the soil-volatilized NH3, thereby reducing net atmospheric emissions[36,46,49].
-
A series of comprehensive reviews and meta-analyses have summarized strategies to reduce NH3 emissions from croplands[19,22,100,103−105]. However, because most field monitoring studies have focused on NH3 fluxes from the soil surface, existing mitigation strategies primarily target the soil–atmosphere interface. Consequently, the role of the crop canopy, a critical component of the agroecosystem, in mitigating NH3 emissions has historically received disproportionately limited attention.
Developing and implementing effective NH3 mitigation strategies is essential for enhancing NUE in agriculture. Although NUE encompasses a wide array of definitions[106], enhancing NUE, in the context of NH3 mitigation, primarily refers to improving crop N uptake. The synchronization of N supply with crop N demand is the most adoptable framework to mitigate NH3 emissions. We summarize the emission reduction efficiencies of major mitigation strategies based on recent meta-analyses in Table 2. The integrated adoption of these strategies—ranging from rate optimization and deep placement to the adoption of EEFs, urea substitution, post-fertilization irrigation, split applications, and fertilizer amendments—offers a viable pathway to balance high crop productivity with a minimal environmental footprint (Fig. 5).
Table 2. A summary of NH3 emission reduction efficiencies for major mitigation techniques based on existing meta-analyses
Mitigation technique Primary mechanism Reduction efficiency (%) Ref. N rate optimization Reduces substrate availability for NH3 emissions 30.7 [107] Deep placement Acts as a physical barrier; enhances soil adsorption 48.0
54.7
34.6[22]
[100]
[107]UIs Delays urea hydrolysis to avoid rapid pH increases 53.1
53.7
50.0
52.0[22]
[100]
[107]
[95]Controlled-release fertilizers Regulates N release to prevent high NH4+ concentrations 56.8
68.0
60.8[22]
[100]
[107]Nitrification inhibitors (NIs) Inhibits nitrification, leading to NH4+ accumulation and increasing NH3 emission potential −42.6*
−38.0*
−27.5*[22]
[100]
[107]Split applications of fertilizer Avoids NH4+ accumulation and synchronizes N supply with crop needs 0
23.6
0
31.7[22]
[108]
[100]
[107]Post-fertilization irrigation Transports urea and NH4+ downward into the soil profile 38.8
34.5[22]
[100]Substitution of Urea by ammonium sulfate or ammonium nitrate in drylands Eliminates hydrolysis-induced pH increases 51.2–88.3
63.5[22]
[100]Reducing basal fertilizer proportion Avoids NH4+ accumulation 61.5 [107] Delaying early
tillering fertilizerEnhances canopy NH3 recapture and root uptake of NH4+ 31.0 [46] Amendments Promotes temporal adsorption of NH4+ 31.4 [100] * Negative values in association with NIs indicate an increase in NH3 emissions. 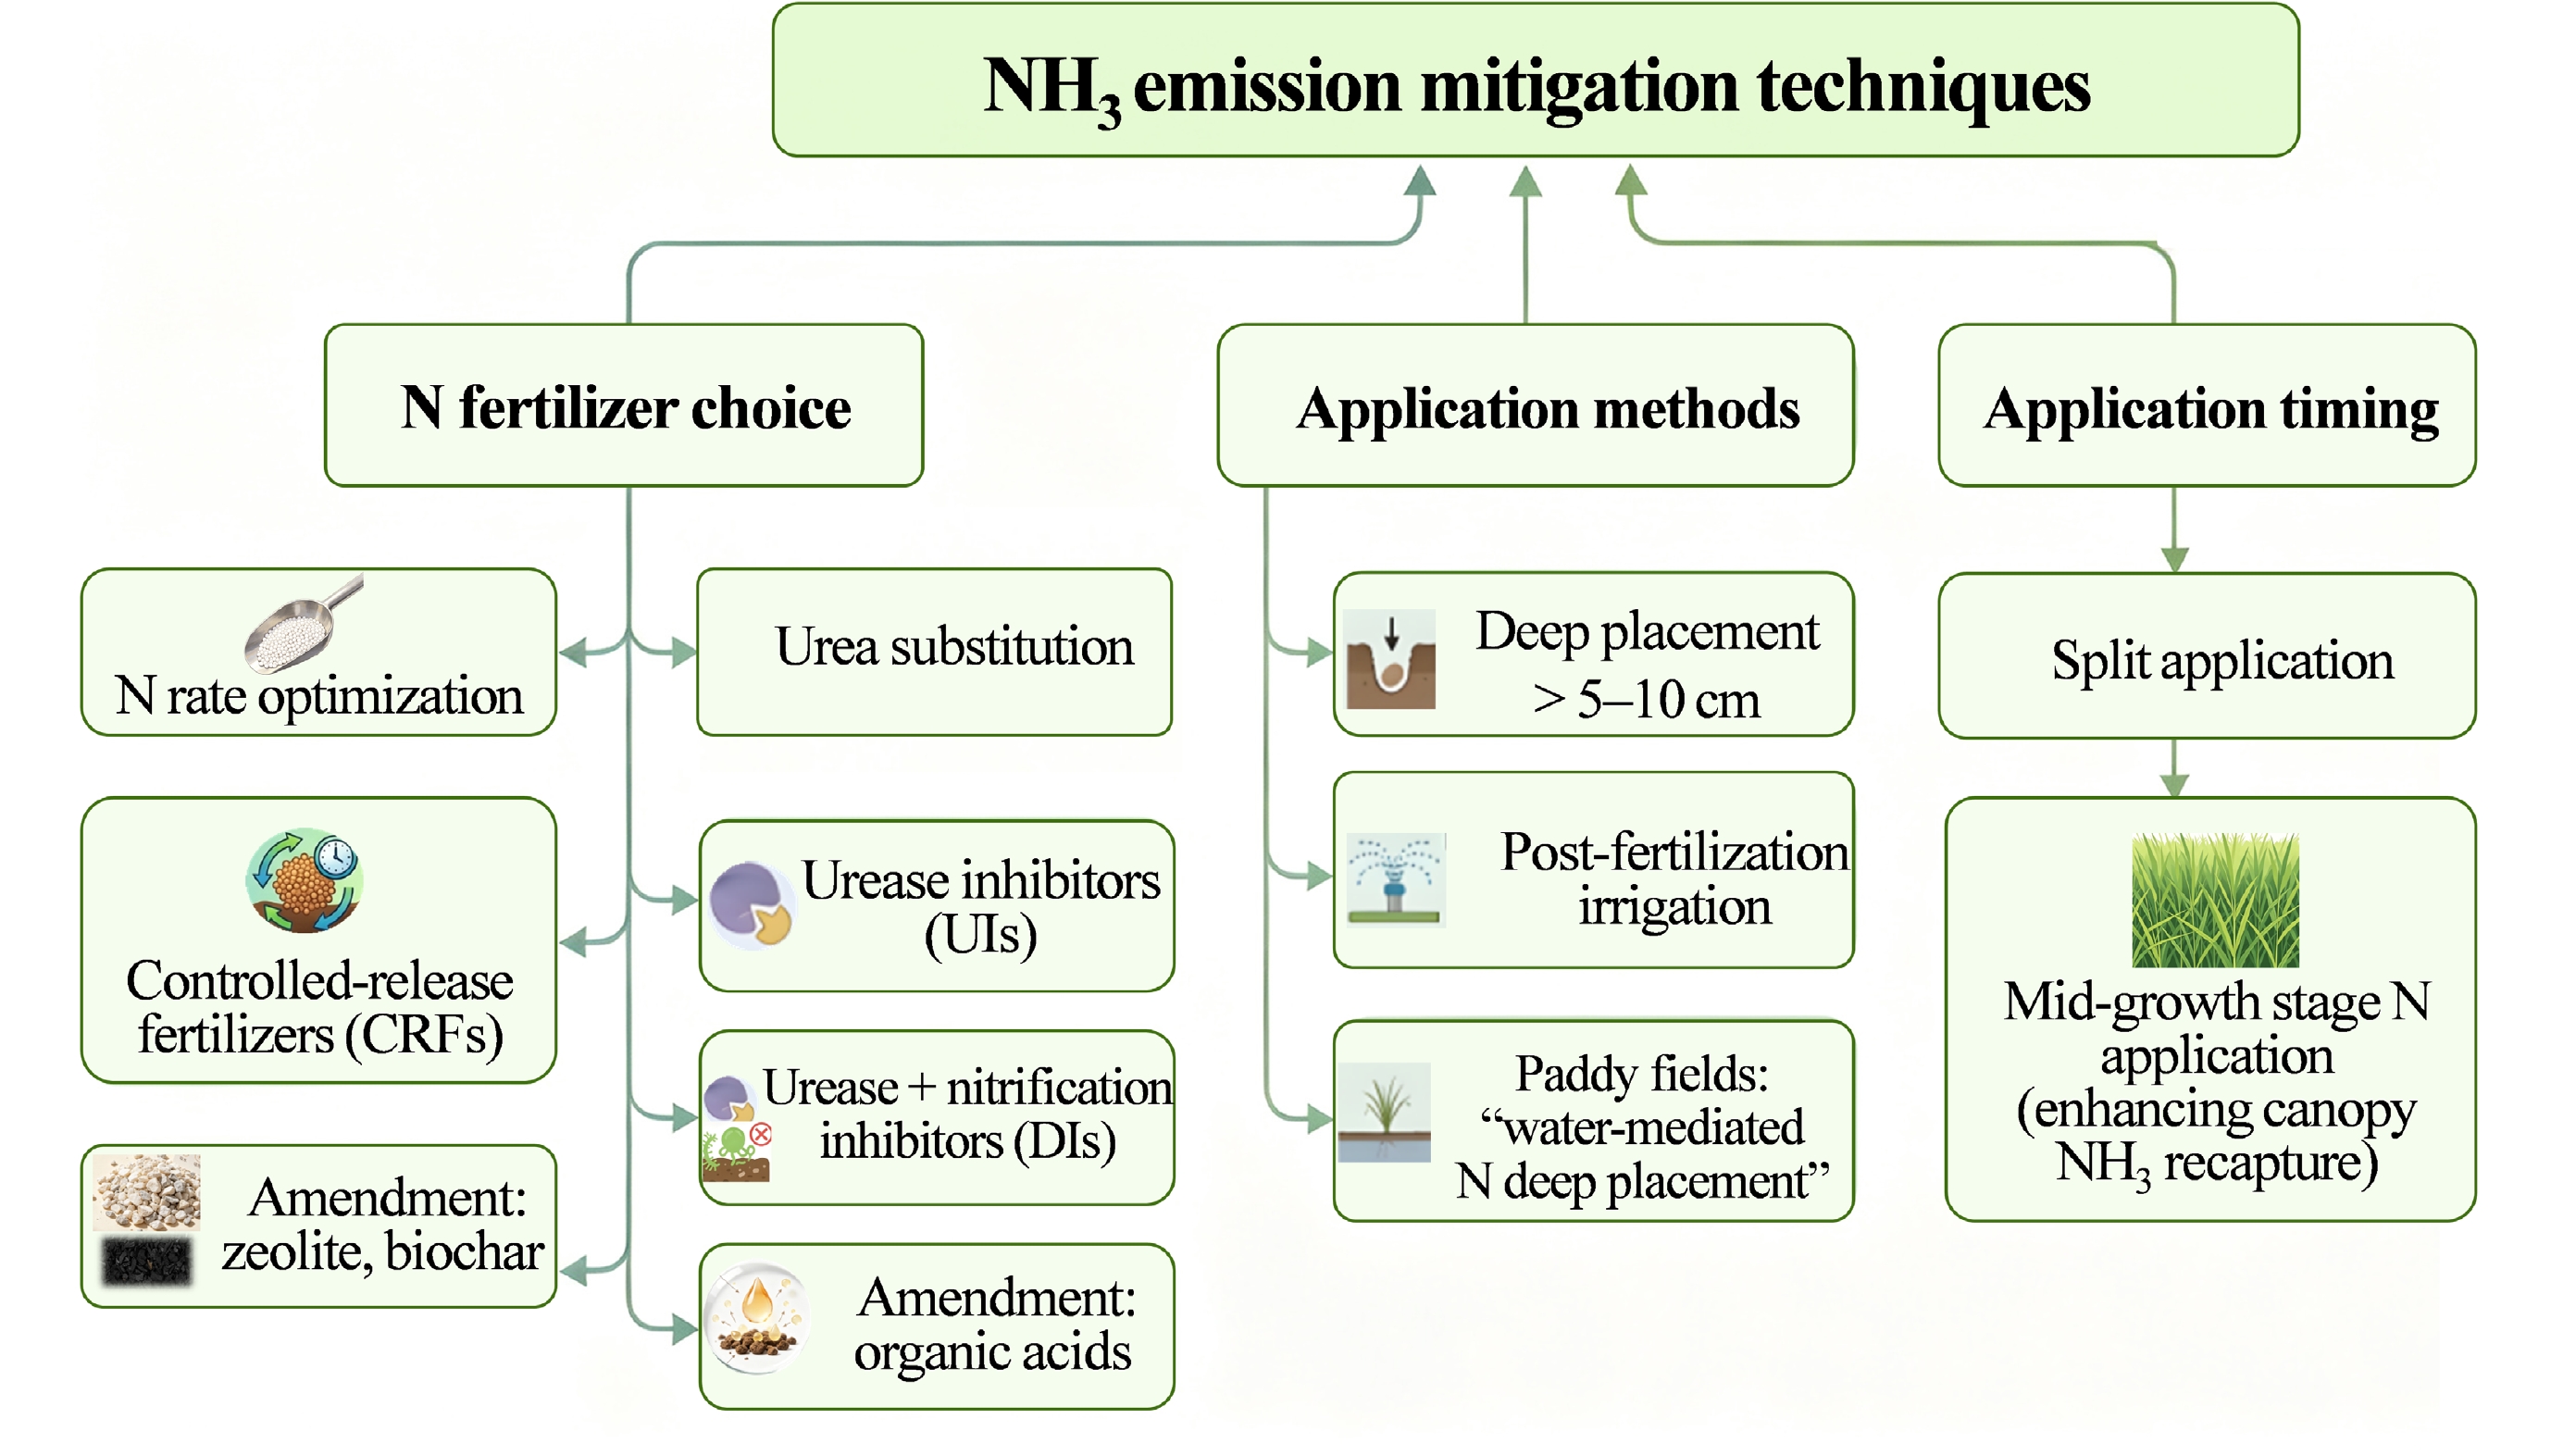
Figure 5.
Diagram illustrating cropland NH3 emission reduction strategies.
Optimizing the N application rate
-
Implementing site-specific N management to determine the optimum N application rate is the fundamental prerequisite for reducing NH3 emissions without penalizing crop yield. Accurately determining optimal N rates remains an active research area, moving away from empirical estimations toward precision agriculture. Numerous quantitative models and approaches have been proposed to define the optimum N application rate for specific crop types and regions. Notable examples include the Regional Mean Optimal N approach (RMON)[109], the theoretical N rate method[110], the Stanford Theoretical Equation (STE)[111], and integrated soil and crop testing approaches[112].
Use suitable N fertilizer types to reduce NH3 emissions
-
Different N fertilizers exhibit varying intrinsic potentials for NH3 volatilization. Urea is highly susceptible to NH3 loss because its rapid hydrolysis consumes H+, thereby increasing the microsite pH[24,113]. Substituting urea with ammonium sulfate or ammonium nitrate, which do not induce significant pH elevations, can substantially reduce NH3 emissions, particularly in neutral or alkaline soils. This approach is strongly recommended in Europe's Framework Code for Good Agricultural Practice for Reducing Ammonia Emissions[114]. However, it is critical to note that ammonium sulfate and ammonium nitrate are generally unsuitable for flooded paddy fields, where enhanced urea formulations (e.g., controlled-release fertilizers or UIs) and deep placement remain the preferred options.
Deep placement of N fertilizers to reduce NH3 emissions
-
Mechanically incorporating or banding fertilizer deep into the soil profile (e.g., > 5–10 cm) is consistently recognized as one of the most robust physical mitigation techniques[19,22]. Deep placement protects the applied N fertilizer from atmospheric contact. More importantly, NH3 produced within the soil profile encounters significant resistance to diffusion upward; it is intercepted, dissolved in the soil solution, and adsorbed by the soil's CEC. In paddy fields, this method is particularly effective because it isolates the fertilizer from floodwater, thereby bypassing NH3 volatilization triggered by algal-driven pH elevations in floodwater.
Deep placement of urea below 10 cm, whether in paddy fields or dryland, can reduce NH3 volatilization by up to 70%–90% compared to surface broadcasting[115,116]. Mechanical side-deep placement of fertilizer has been shown to reduce NH3 emissions by 30%–50%; the lower rate of reduction is due to some urea remaining exposed to the atmosphere or diffusing into the floodwater[101,117,118]. Despite its high efficacy, the substantial labor and machinery costs associated with deep placement hinder its widespread adoption.
Post-fertilization irrigation to reduce NH3 emissions
-
Irrigation immediately following N application is a highly effective operational strategy to reduce NH3 emissions[71]. Applying sufficient water post-fertilization through irrigation drives dissolved N deep into the rooting zone[90]. Studies indicate that irrigation or rainfall exceeding 10 mm is the critical threshold for effectively suppressing NH3 volatilization[119].
Split application and enhancement of canopy recapture
-
Shifting a larger proportion of N fertilizer to mid-growth stages (e.g., panicle initiation) serves dual purposes. First, it synchronizes N supply with peak crop demand, minimizing the availability of substrate NH4+ prone to volatilization[112]. Second, applying N beneath a well-developed crop canopy reduces wind speed at the soil surface. Furthermore, the extensive leaf area acts as a biological sink, directly recapturing a substantial fraction of volatilized NH3 through the stomata[36,120].
However, it is imperative to highlight that current canopy recapture models rely predominantly on empirical data from dryland crops. The canopy recapture dynamics in paddy ecosystems differ fundamentally from those in drylands due to the distinct morpho-physiological traits of rice leaves[44] and the exceptionally high NH3 volatilization occurring above the floodwater. Consequently, quantifying canopy recapture in paddy systems represents a critical and unaddressed gap in current mitigation research.
Adoption of EEFs for reducing NH3 emissions
-
Extensive research has validated the efficacy of UIs in delaying urea hydrolysis, thereby preventing rapid, localized pH increases and subsequent NH3 volatilization[22,95,121,122]. Among commercially available UIs, NBPT is the most widely adopted due to its high efficiency at a low dosage. An NBPT application can reduce NH3 fluxes from pastures by 40%‒60%[94]. In northern China, NBPT/NPPT (N-[n-propyl] thiophosphoric triamide) formulations decreased NH3 emissions from maize and wheat fields by 65%–100%[68].
Nevertheless, the efficacy of NBPT declines in paddy fields, resulting in an average reduction of 40%‒50%. This diminished performance may be attributed to the anaerobic conditions caused by floodwater coverage, which hinder the essential oxidation of NBPT to its active form, NBPTO[123].
Regarding NIs, while they successfully abate N2O emissions, their suppression of nitrification prolongs the residence time of NH4+ in soils, inadvertently increasing the potential for NH3 emissions[124,125]. To counteract this, the co-application of NIs and UIs is recommended; however, determining their optimal ratios, elucidating synergistic mechanisms, and evaluating pollution trade-offs require further research.
Controlled-release fertilizers, such as polymer-coated urea, physically encapsulate the N core. By regulating N release in response to soil temperature and moisture, controlled-release fertilizers prevent sudden accumulation of high NH4+ concentrations. This can achieve substantial NH3 reductions while synchronously matching plant N demand[96]. However, the high price of controlled-release fertilizers hinders their widespread adoption.
Other amendments for reducing NH3 emissions
-
Biochar has gained attention as a soil amendment for reducing greenhouse gas emissions, improving carbon sequestration, and enhancing soil fertility. Its porous structure and high surface area enable the adsorption of NH4+[126]. However, because unmodified biochar is typically alkaline, the use of acidified or surface-modified biochar is recommended to prevent inadvertently raising soil pH[127]. Additionally, when co-applied with fertilizers, amendments such as zeolite, pyrite, and organic acids have been shown to decrease NH3 volatilization by 43.5%, 20.9%, and 15.9%, respectively[100].
-
The direction and magnitude of NH3 exchange between crop canopies and the atmosphere represent one of the most profound uncertainties in understanding cropland NH3 emissions. An accurate, integrated assessment of this bidirectional exchange is crucial for evaluating ecosystem-level NH3 budgets and developing cost-effective mitigation strategies (Fig. 6). Due to methodological constraints, the vast majority of current field measurements, regional inventories, and mitigation evaluations focus almost exclusively on NH3 volatilized from the soil or the floodwater surface[19,91,92,128−130]. Although several advanced inventories have incorporated NH3 compensation points, these models rely heavily on empirical values derived from dryland ecosystems in Europe and North America[16,131,132], leaving rice-specific data remarkably scarce.
Determining the NH3 compensation point of rice leaves is highly challenging compared to dryland crops due to the distinctive morpho-physiological traits, including pronounced surface hydrophobicity, restricted stomatal aperture, and a disproportionately high density of chloroplasts in the cell periphery[44,133]. These factors complicate the precise quantification of the bidirectional NH3 exchange in submerged paddy systems. Consequently, there remains a severe paucity of research on localized, growth-stage-specific parameters for canopy NH3 exchange tailored to rice cropping systems.
Advancing NH3 emission monitoring and estimation techniques
-
Current methodologies for quantifying cropland NH3 emissions rely heavily on small dynamic or vented chambers designed to capture volatilization from the soil/floodwater surface[44,117,124,134,135]. Consequently, continuous, in situ monitoring of NH3 fluxes from the entire soil–water–plant–atmosphere continuum throughout the full growing season remains severely limited. While small chamber methods are suitable for comparative evaluations of emission potentials among treatments, they fail to capture the actual net fluxes under natural field conditions. Therefore, developing and validating low-cost, highly automated micrometeorological techniques is urgently needed for ecosystem-scale measurements. Promising approaches include the deployment of miniaturized tunable diode laser absorption spectroscopy (TDLAS) and IoT-enabled electrochemical sensor networks.
Furthermore, to bridge the gap between plot-scale observations and regional inventories, future research should embrace emerging macro-scale technologies. While research on global and regional NH3 inventories has advanced considerably, existing inventories continue to show substantial discrepancies (Supplementary Table S1) and are subject to certain uncertainties. Such limitations are primarily driven by field observations that generally overlook canopy NH3 exchange, as well as the incomplete compilation of emission source activity data. Recent advancements in satellite-based remote sensing techniques offer vital top-down constraints for regional NH3 estimation and validation. Concurrently, ML and AI algorithms are emerging as powerful tools to decipher the complex relationships between NH3 emissions and multidimensional environmental/management drivers. Integrating continuous ground-based monitoring with satellite observations and AI-driven models will revolutionize the spatiotemporal prediction of cropland NH3 emissions. It is hypothesized that coupling high-density ground data with satellite retrievals via AI can significantly reduce regional inventory uncertainties.
Integrated co-mitigation of multi-pollutants and smart governance
-
Cropland NH3 management faces a complex environmental paradox: single-pollutant targeted reduction strategies often inadvertently trigger 'pollution swapping'—increasing the emissions of other reactive N gases. For example, N2O, nitrogen oxides (NOx), and nitrous acid (HONO) are produced through interconnected biochemical pathways, making isolated mitigation approaches insufficient. For example, while NIs reduce N2O production, they can alter soil pH and NH4+ retention, inadvertently promoting NH3 emissions[124]. This demonstrates that addressing individual pollutants in isolation achieves limited environmental gains.
Transitioning to a co-mitigation framework that simultaneously addresses the mitigation of the entire suite of reactive N gases is essential. In terms of field management, priority should be given to practices that couple the deep placement of EEFs (e.g., dual inhibitors) as basal fertilization with variable-rate, precise N topdressing, guided by crop N status derived from canopy remote sensing. We hypothesized that this integrated co-mitigation strategy can simultaneously minimize the total reactive N gas footprint without compromising crop yield, thereby overcoming the 'pollution swapping' effect.
Beyond resolving outstanding scientific questions, future policy and governance development should transition from single-pollutant regulations to holistic N-loss accounting and market-driven governance. National NH3 emission caps should be established synergistically with carbon neutrality goals, supported by financial mechanisms, such as a 'Nitrogen Credit Trading System' or the integration of N-surplus penalties into agricultural subsidies, to incentivize the adoption of low-emission technologies. At the management level, smart agriculture management platforms leveraging AI, big data, and sensors can enable real-time monitoring of soil–crop N dynamics, providing intelligent decision support for precise fertilization. Concurrently, systematic agricultural extension programs must be deployed to empower farmers with the skills required to operate smart equipment and implement precision N management. This integrated socio-technical approach will ensure the effective field-level execution of mitigation strategies, securing environmental sustainability without compromising food security.
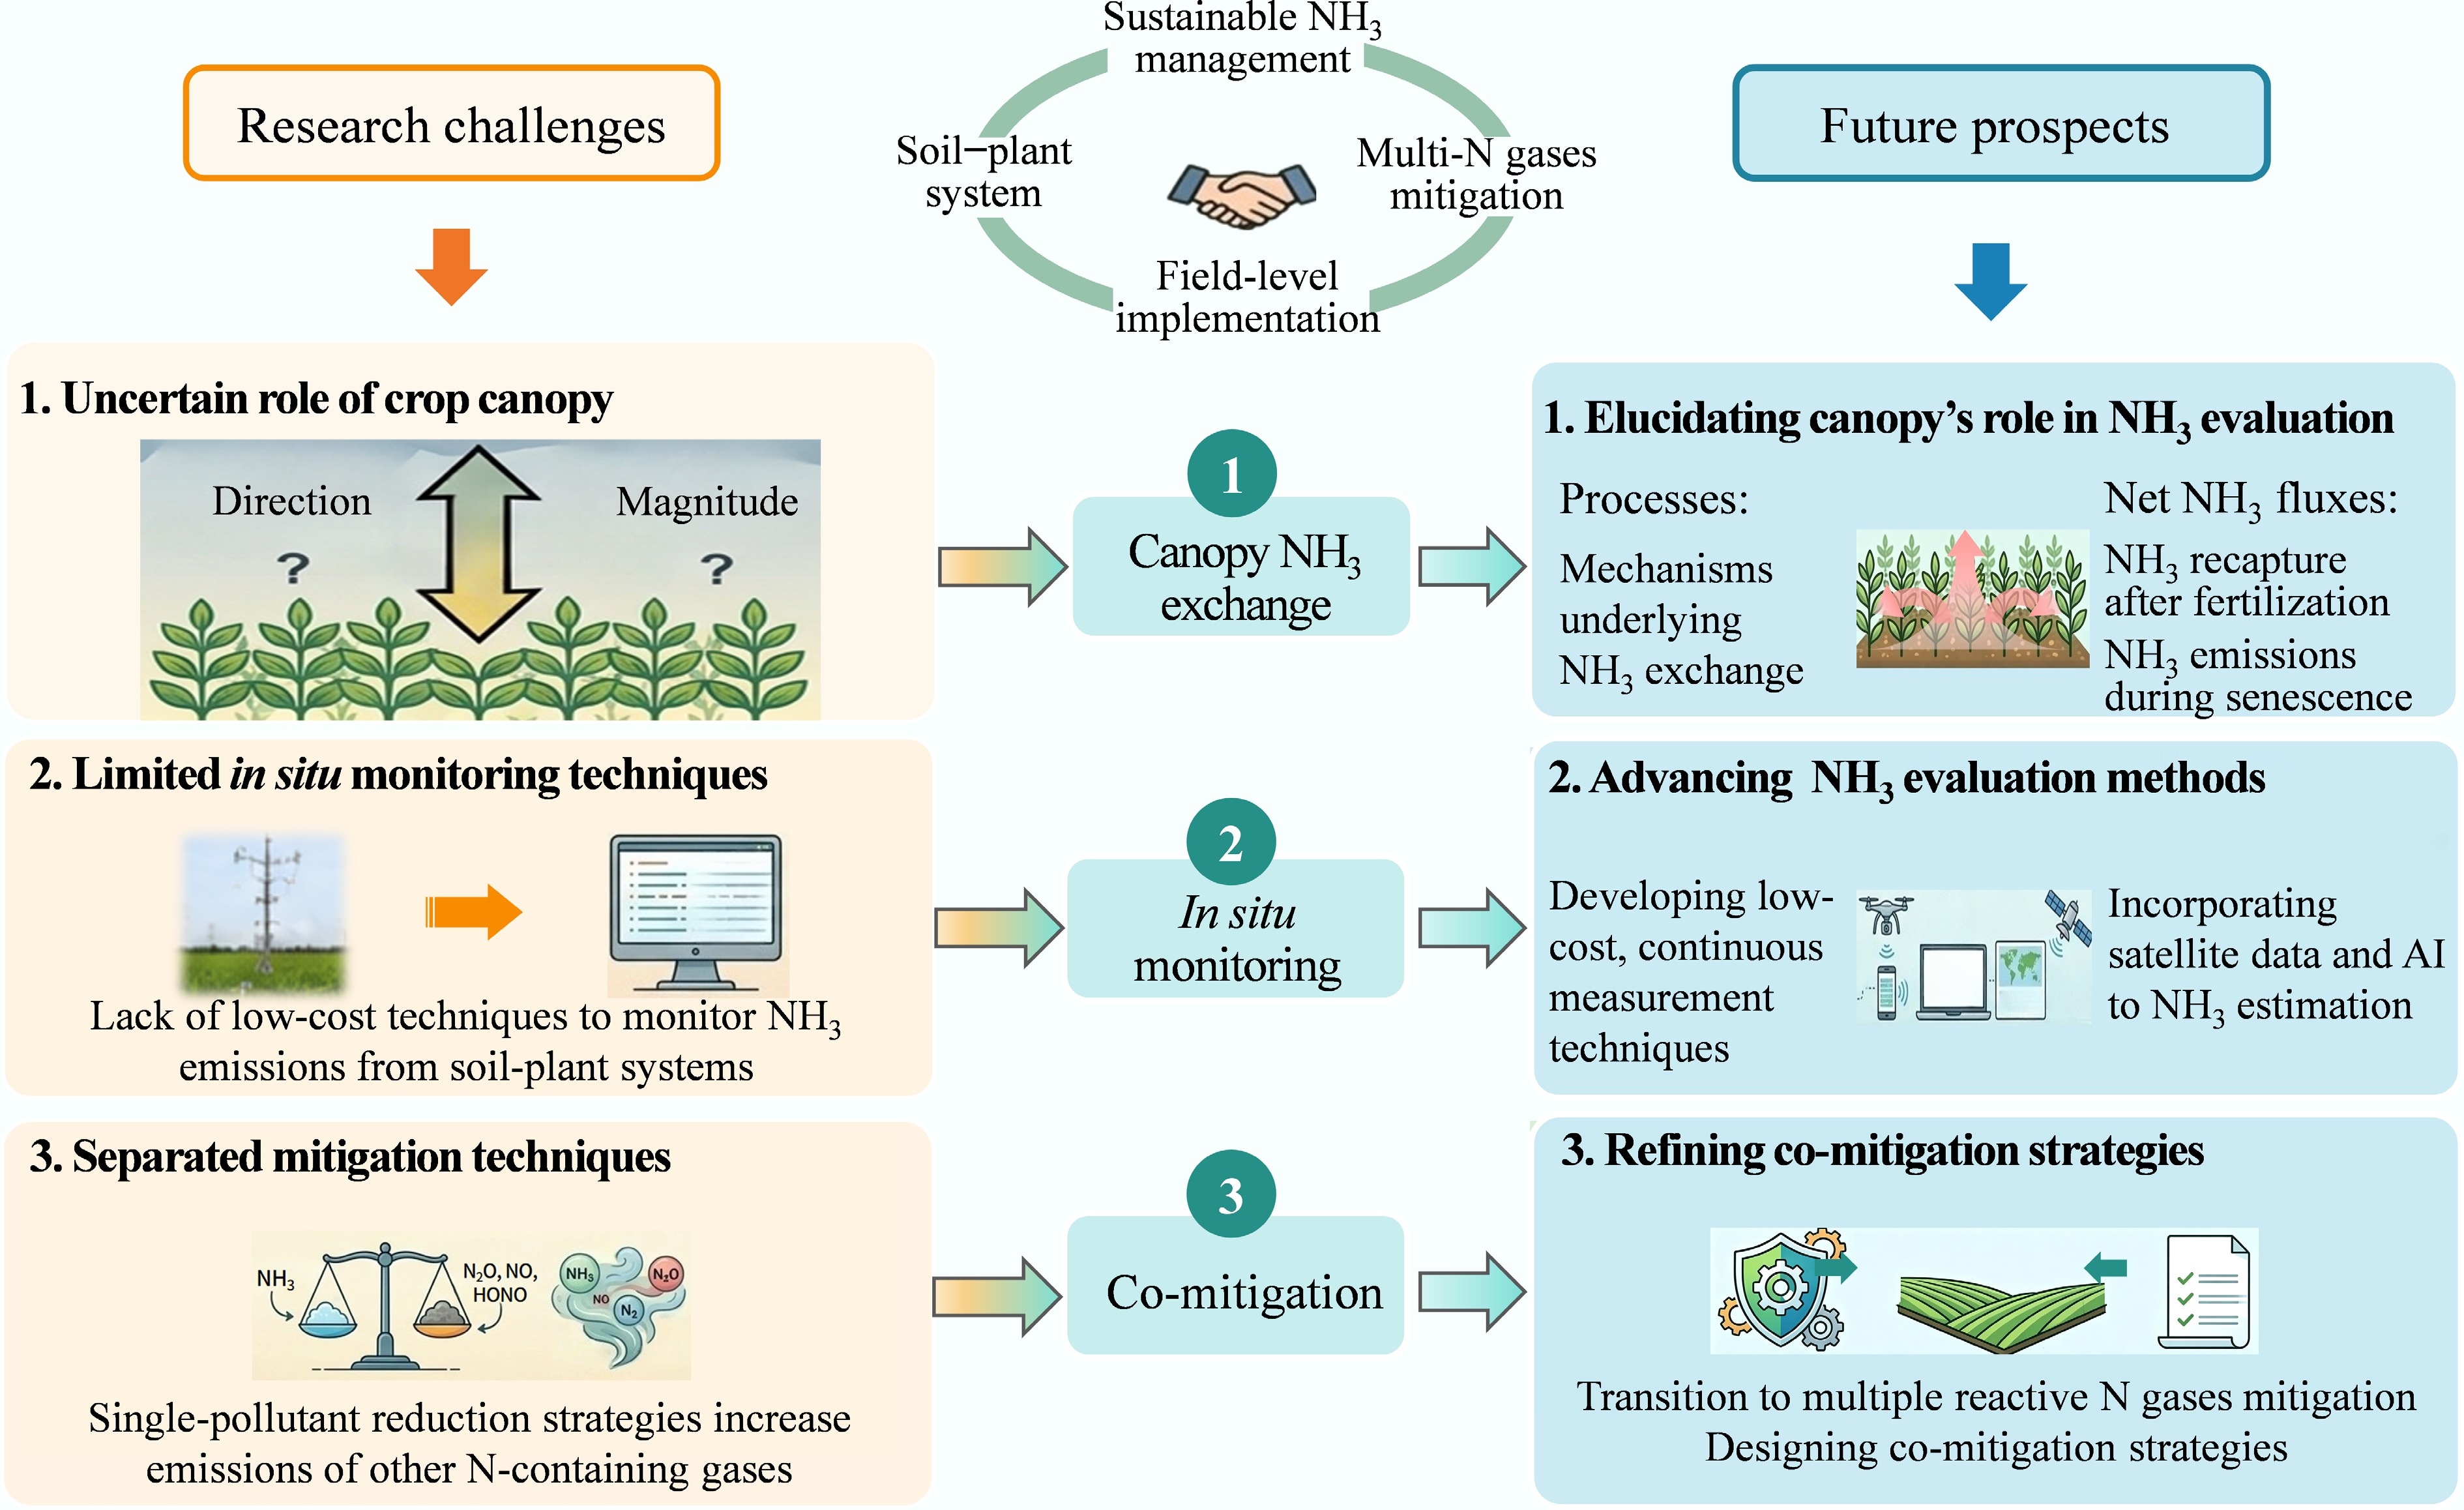
Figure 6.
Schematic diagram of the main research challenges and future prospects for research on cropland NH3 emissions.
No acknowledgments are applicable for this work.
-
It accompanies this paper at: https://doi.org/10.48130/nc-0026-0016.
-
Not applicable.
-
The authors confirm their contributions to the paper as follows: Yuhua Tian: data curation, formal analysis, writing − original draft preparation, writing − review and editing, visualization; Lingyun Peng: data curation; Bin Yin: conceptualization; Chaopu Ti: conceptualization, methodology, writing − review and editing; Scott X. Chang: conceptualization, writing − review and editing. All authors reviewed the results and approved the final version of the manuscript.
-
The datasets used or analyzed in the current study are available from the corresponding author upon reasonable request.
-
The authors declare that they have no known competing financial interests or personal relationships that could have influenced the work reported in this paper.
-
Full list of author information is available at the end of the article.
- The supplementary files can be downloaded from here.
- Copyright: © 2026 by the author(s). Published by Maximum Academic Press, Fayetteville, GA. This article is an open access article distributed under Creative Commons Attribution License (CC BY 4.0), visit https://creativecommons.org/licenses/by/4.0/.
-
About this article
Cite this article
Tian Y, Peng L, Yin B, Ti C, Chang SX. 2026. Ammonia emissions from croplands: processes, measurement, and mitigation. Nitrogen Cycling 2: e028 doi: 10.48130/nc-0026-0016 

Ammonia emissions from croplands: processes, measurement, and mitigation
- Received: 26 June 2026
- Revised: 27 August 2026
- Accepted: 21 September 2026
- Published online: 10 October 2026
Abstract: Croplands are the primary source of anthropogenic ammonia (NH3) emissions, contributing significantly to soil nitrogen (N) loss and air pollution. In this review, we synthesize recent advancements in understanding cropland NH3 emission processes, influential factors, measurement techniques, and mitigation strategies. We emphasize the critical, yet historically underestimated, biological sink provided by the crop canopy, which can recapture approximately 50% of soil-volatilized NH3 following N fertilization. While current canopy exchange research has focused heavily on dryland crops, research quantifying NH3 recapture by rice canopies remains severely lacking. Furthermore, we evaluate the efficacy of key mitigation strategies, including deep fertilizer placement, N rate optimization, post-fertilization irrigation, and the use of enhanced-efficiency fertilizers (EEFs), in reducing NH3 emissions. We highlight the pressing need for integrated, multi-pollutant mitigation frameworks to prevent 'pollution swapping', in which NH3 emission reductions inadvertently exacerbate emissions of other reactive N species, such as N2O. Future research should focus on coupling low-cost, continuous monitoring technologies with artificial intelligence (AI) and satellite-based remote sensing, alongside the implementation of holistic governance, to move beyond single-pollutant control. Ultimately, a systems-level approach is essential to reduce NH3 emissions, optimize N use efficiency, safeguard environmental quality, and ensure global food security.
-
Key words:
- Cropland /
- Ammonia emission /
- Measurement methods /
- Canopy NH3 exchange /
- Rice paddy fields /
- Co-mitigation