


-
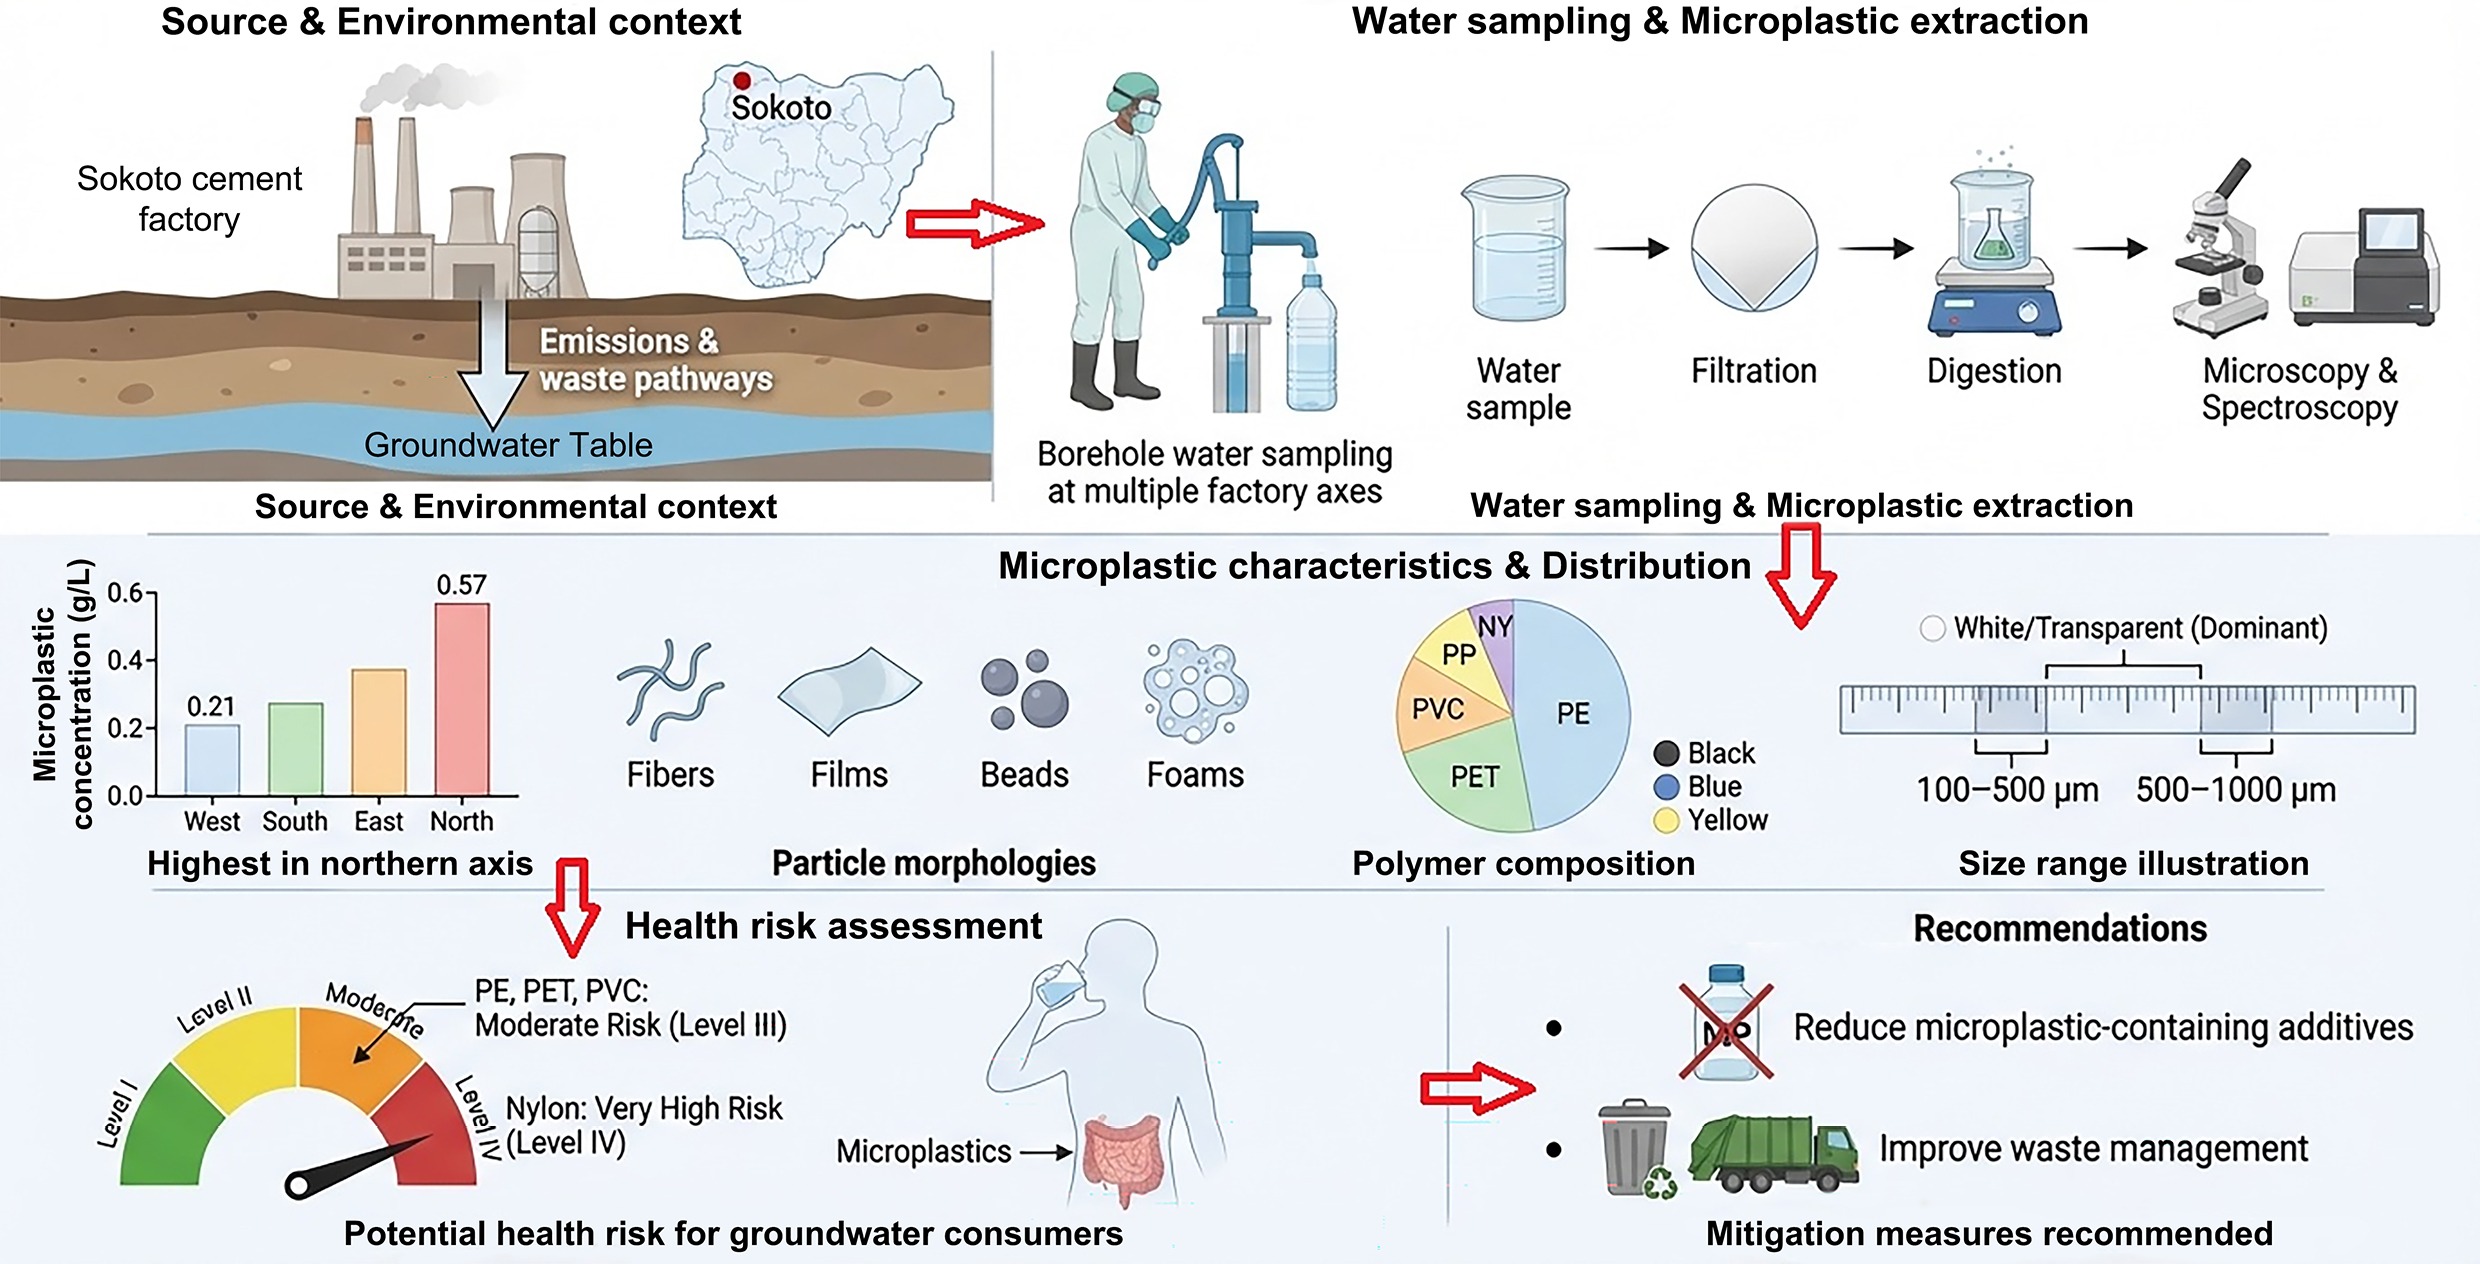
The increasing production of plastics and poor waste management have made microplastic pollution one of the fastest-growing environmental problems worldwide. Microplastics are tiny plastic materials smaller than 5 mm, produced directly for industrial purposes (primary microplastics), or generated indirectly through the photodegradation of larger plastic materials (secondary microplastics)[1]. They are mainly composed of synthetic polymers, such as polyvinyl chloride (PVC), polystyrene (PS), polypropylene (PP), polyethylene terephthalate (PET), and polyethylene (PE)[2]. Microplastics come in many different sizes and shapes, such as fragments, fibers, foams, films, and beads[3]. Because of their small size, persistence, low density, ability to accumulate and magnify through the food chain, and capacity to adsorb other pollutants, microplastics pose significant environmental and public health risks[4,5]. They also act as vectors, increasing the toxicity of persistent organic pollutants and heavy metals[6]. Humans can be exposed through oral and dermal exposure and inhalation, leading to a range of health effects, including cellular damage, endocrine disruption, cardiovascular disorders, and increased risks of cancer and diabetes[7,8]. Microplastics also affect terrestrial and aquatic ecosystems, disrupting soil structure, impairing plant growth, and reducing crop yields[9]. These environmental and health concerns demonstrate the value of monitoring microplastics across environmental compartments and human settings.
The cement industry is a major global sector that supports economic growth and provides livelihood for millions of people. It forms the backbone of modern infrastructure, supplying essential construction materials such as concrete and mortar. However, cement production is energy-intensive and emits various pollutants including heavy metals, particulate matter, and dioxins[10]. Recently, the industry has increasingly incorporated plastic materials, particularly as alternative fuels through co-processing in high-temperature kilns to reduce fossil fuel use and carbon emissions, and as secondary raw materials (e.g., plastic aggregates or fibers) in concrete production. While these practices may support waste valorization and climate goals, they also introduce potential environmental risks. If plastic-containing materials are not handled, processed, or thrown away properly, they can break down into microplastics through fragmentation, combustion residues, dust emissions, wastewater discharge, and runoff from storage or waste disposal sites[11]. Consequently, cement plants may act as point sources of microplastic emissions through identifiable discharge pathways, such as stack emissions and effluents. They may also serve as a non-point source via diffuse pathways, including atmospheric deposition, surface runoff, and wind dispersion of plastic particles[11]. To promote sustainable development that balances cement production with human and environmental health, many studies have evaluated the pollution potential of cement plants. However, most of these studies have focused on heavy metals, particulate matter, carbon dioxide, and other greenhouse gases[12,13]. Given the growing concerns about the spread and toxicity of microplastics, it is necessary to assess and characterize them in various environmental matrices surrounding cement plants. Microplastics are analyzed using several techniques, including Fourier-transform infrared (FTIR) spectroscopy, dynamic light scattering, scanning electron microscopy, Raman spectroscopy, thermal analysis, mass spectrometry, laser diffraction analysis, aptamer-based detection, and flow cytometry[14]. Among these methods, FTIR spectroscopy offers distinct advantages because it provides a unique molecular 'fingerprint' for each polymer, identifies chemical bonds and functional groups, and enables rapid, non-destructive analysis[15].
Sokoto Cement Factory is one of the largest cement production facilities in Northern Nigeria. The factory significantly contributes to the economy of Sokoto State and Nigeria by promoting industrialization, creating jobs, generating government revenue, and supporting infrastructure development. However, like other cement plants, its potential environmental impacts require continuous monitoring to protect workers, nearby residents, and surrounding ecosystems. A review of existing literature reveals no documented information on microplastic pollution from this factory. This gap is critical given the rising global concern over microplastic distribution and toxicity. Furthermore, the factory is located near communities that rely on surface and groundwater resources, making microplastic monitoring relevant to Sustainable Development Goal (SDG) 6, which promotes sustainable water management. This study seeks to ascertain the prevalence and attributes of microplastics in borehole water within residential zones adjacent to the Sokoto Cement Factory. It also seeks to evaluate the associated health risks of detected microplastics. As the first documented investigation of microplastic pollution linked to a Nigerian cement plant, the study is expected to provide baseline data for environmental monitoring, risk assessment, and the development of management policies to mitigate plastic pollution.
-
The Sokoto Cement Company is situated in Wamakko Local Government Area of Sokoto State in Northwestern Nigeria, at approximately 13°03'42.49" N latitude, and 5°10'15.89" E longitude (Fig. 1). The Republic of Niger borders the state to the north, Kebbi State to the south, and, on the eastern border, Zamfara. The dominant ethnic groups in Wamakko are the Hausa, and Fulani. The surrounding area consists of semi-arid savannah with sparse vegetation and seasonal rivers that supply water for domestic use, irrigation, and fishing. The region experiences a short wet season (May to September/October), and a long dry season (October to May/June). The climate is generally hot year-round, with a mean annual temperature of around 28.3 °C and mean annual rainfall of approximately 685 mm[16]. Wind circulation in the area is seasonally governed by the West African monsoon system, with moist southwesterly winds blowing northward during the rainy season, while dry northeasterly (Harmattan) breezes prevail during the dry season, advecting air masses southward (Fig. 2).
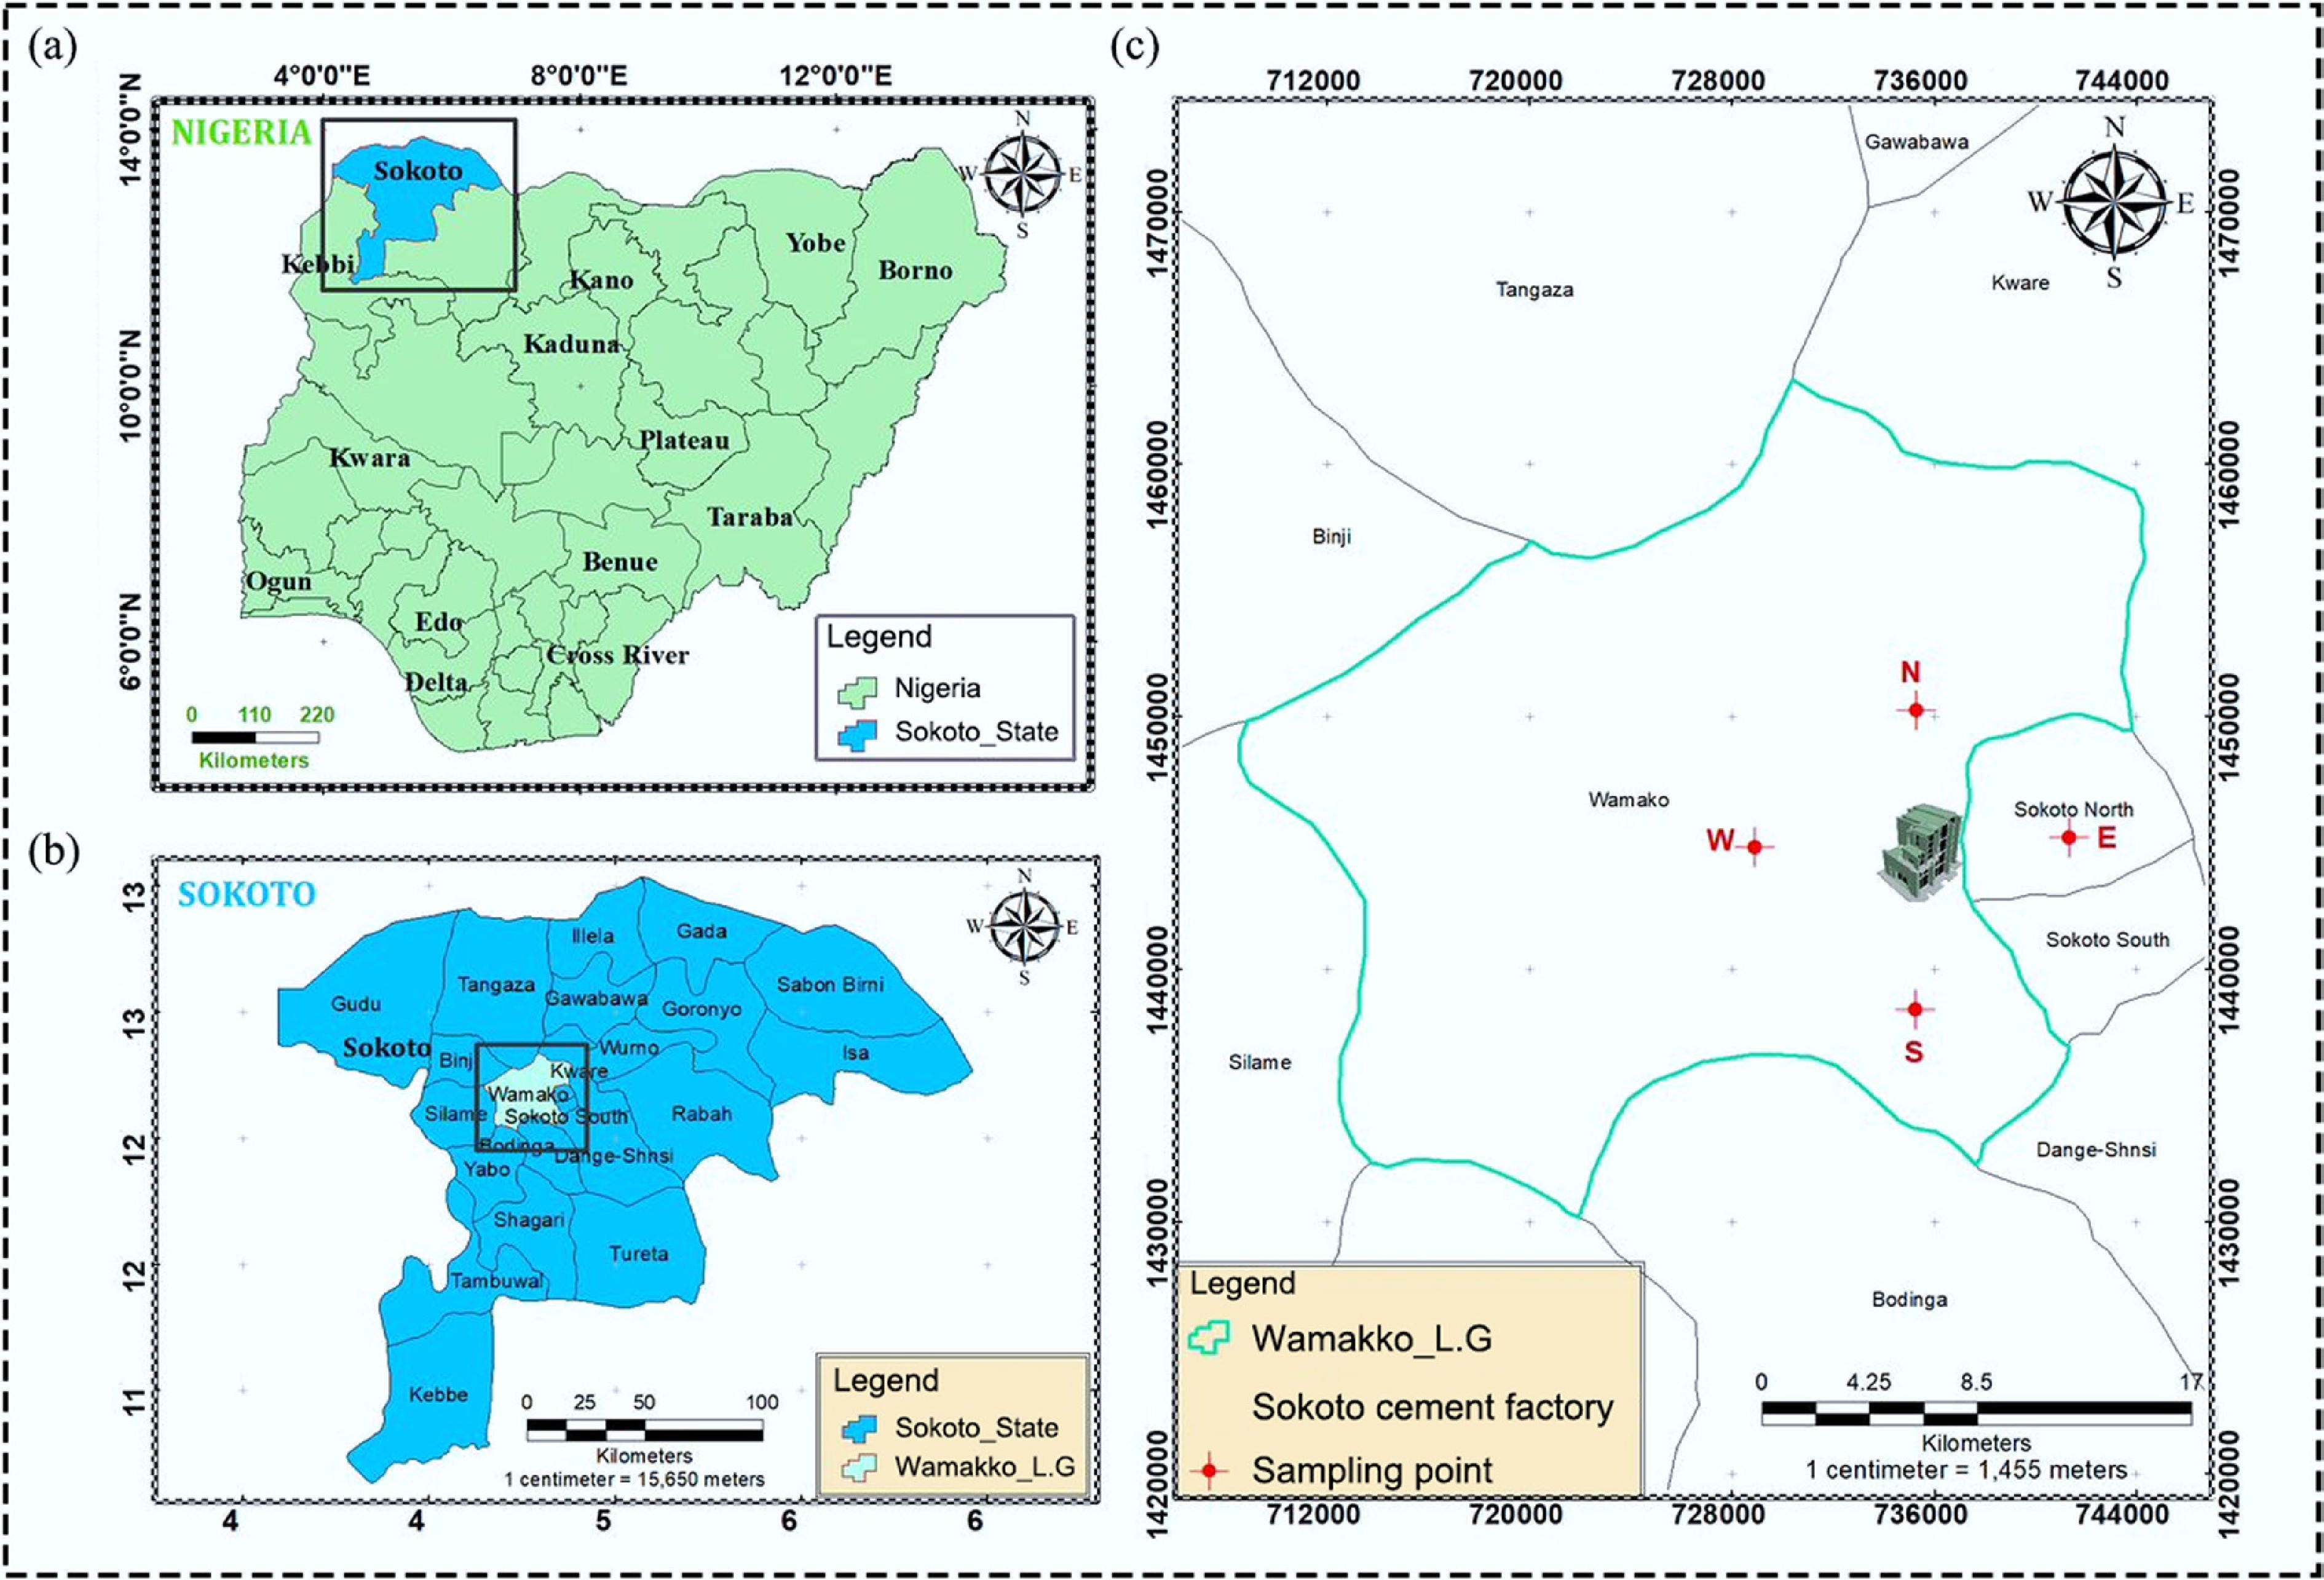
Figure 1.
Map of the study area showing (a) Nigeria, (b) Sokoto State, and (c) sampling points (drawn using ArcGIS 10.3 software).
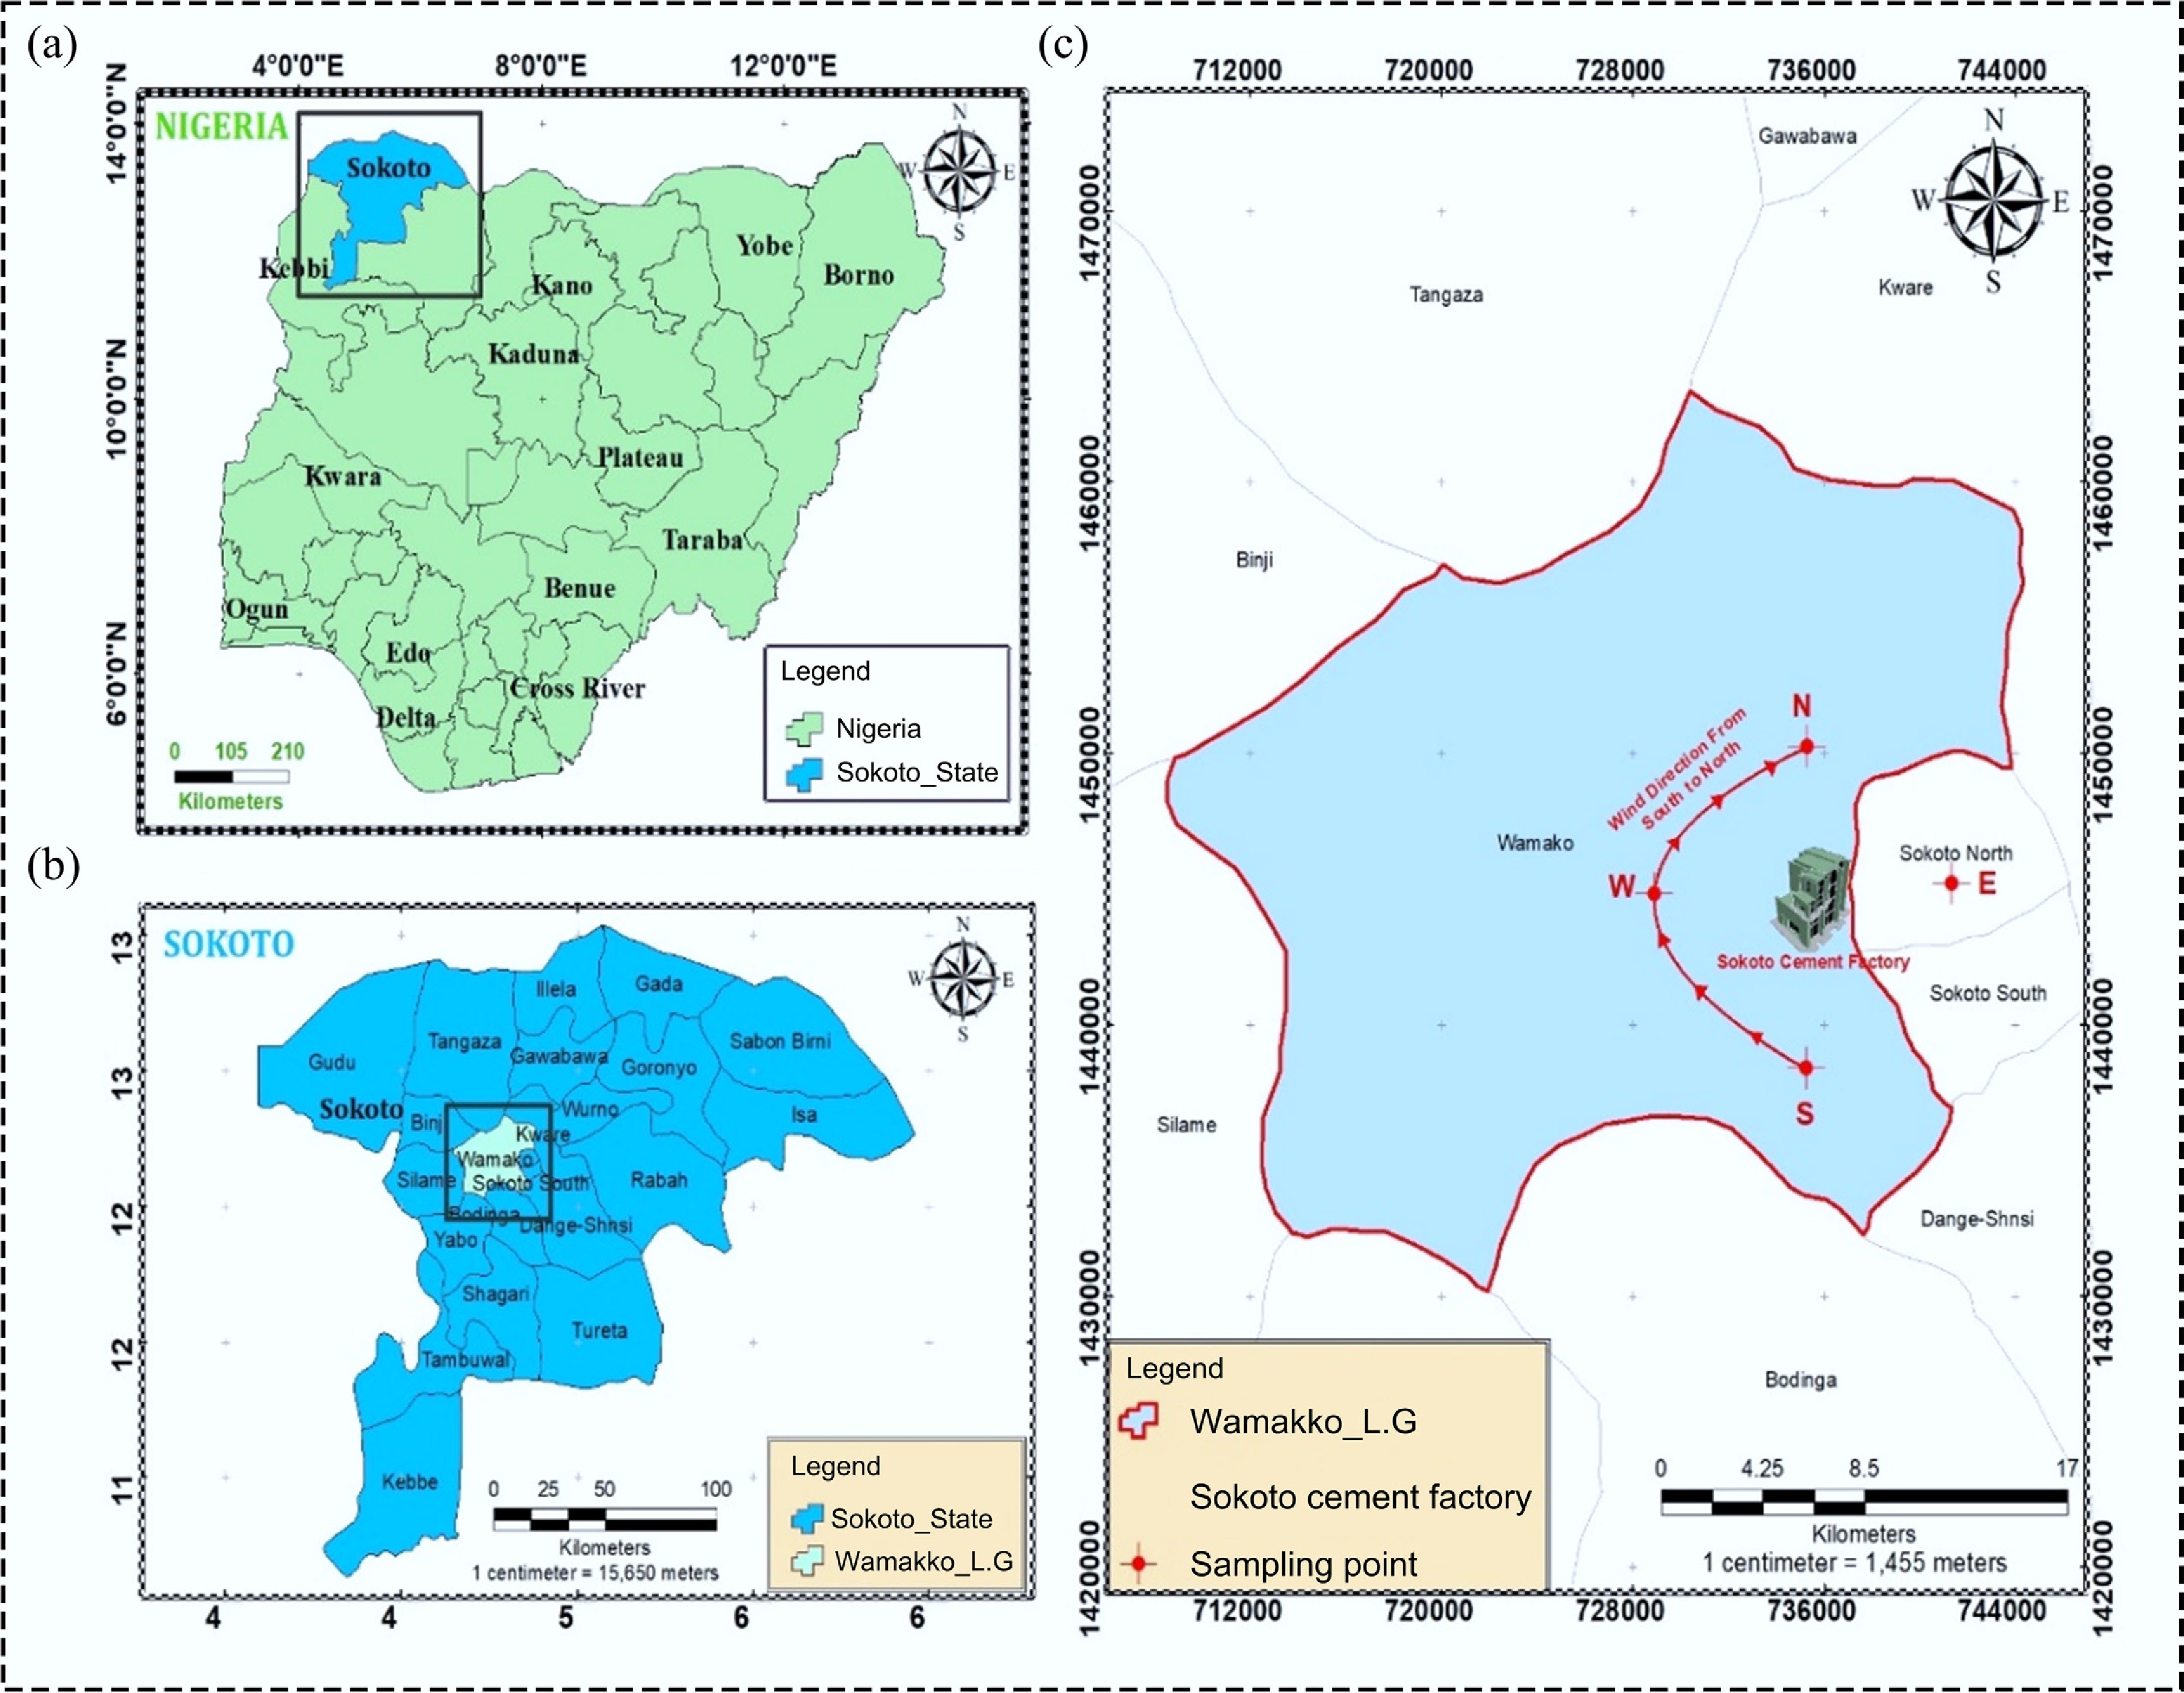
Figure 2.
Map showing wind direction during the study period. (a) Nigeria, (b) Sokoto State, and (c) sampling points (drawn using ArcGIS 10.3 software).
Limestone is plentiful in Wamakko because it is located in the Sokoto Basin, which used to be a shallow sea millions of years ago, leading to a lot of calcium carbonate being deposited and turned into rock[17]. This abundance of limestone influenced the siting of the cement factory in the area. The factory is one of the largest cement factories in Nigeria, and its operations, including quarrying, crushing, and processing, release various pollutants into the environment. The extensive use of plastics for packaging and other industrial processes makes it a potential hot spot for microplastic contamination. Given that nearby communities rely heavily on surface and groundwater resources, assessing microplastic pollution in environmental matrices around the factory is necessary to safeguard human health and the environment.
Water sample collection
-
Water samples were collected between May and July 2025 from boreholes located within a 1–2 km radius in each of the four cardinal directions (north, south, east, and west) around the cement factory. In each direction, three boreholes were randomly selected, and one sample was collected from each borehole every month. Thus, 12 samples were obtained monthly across the four directions, and a total of 36 samples were collected over the three-month sampling period (nine samples per direction). To prevent contamination, pre-cleaned 1 L amber glass bottles were used for sample collection to avoid plastic interference. All bottles were washed with laboratory-grade detergent, rinsed with distilled water, and combusted to remove organic residues. Before collection, each bottle was rinsed thrice with the borehole water. Cotton lab coats and nitrile gloves (changed between sites) were worn to minimize fiber shedding. The boreholes were allowed to run for 3–5 min to flush stagnant water before sample collection. Sampling was done against the flow direction to reduce disturbances. Plastic materials, including funnels and buckets, were strictly avoided; instead, stainless-steel or glass sampling aids were used only when necessary. Immediately after collection, bottles were tightly sealed with aluminum-lined caps; labeled with sampling codes, date, and coordinates, and stored in insulated ice chests at approximately 4 °C to prevent microbial degradation or particle loss. Samples were processed and analyzed in the laboratory the same day.
Microplastic extraction
-
Water samples (1 L per site) were filtered under vacuum through pre-heated (450 °C, 4 h) glass fiber filters (0.7 µm pore size, 47 mm diameter) to collect suspended particles. All glassware was washed with pure deionized water before use, and blank samples were analyzed to check and prevent background contamination. The retained materials were transferred into clean glass beakers and subjected to oxidative digestion by diluting with 50 mL of 30% hydrogen peroxide (H2O2). The mixture was covered with aluminum foil and agitated at 150 rpm at 60 °C for 5 d to remove organic debris[18]. Additional H2O2 was added where necessary until complete digestion was achieved. After digestion, the extract was poured into a 500 mL glass separating funnel containing a saturated potassium formate (HCOOK) solution (density ≈ 1.6 g/cm3) for density separation. The funnel was vigorously shaken for 2 min, and the content was left to settle undisturbed for 24 h. Because of their lower density, microplastic particles floated in the upper phase of the solution, which was carefully decanted and vacuum-filtered via a 0.2 µm inorganic nanopore membrane filter. The filters were put in covered glass Petri dishes, air-dried at room temperature in a dust-free cabinet, and stored in sealed containers until microscopic and spectroscopic analyses. Nitrile gloves and a cotton laboratory coats were worn throughout the procedures to minimize airborne fiber contamination.
Microplastic identification and characterization
-
Microplastics were identified and characterized following established protocols[3]. After filtration, filters were transferred into clean glass Petri dishes, covered with aluminum foil, and oven-dried at 40–50 °C for 24–48 h until constant weight was achieved. Procedural blanks (filtered distilled water exposed to laboratory conditions) were analyzed along with the samples to monitor airborne contamination. All analyses were conducted under a laminar airflow hood to minimize secondary contamination. Filters containing the retained particles were examined using a Nikon SMZ745 stereomicroscope at 40× magnification (with magnification range adjustable between 10× and 50×). Illumination was provided by an integrated LED light source, and particles were identified through visual examination based on color, morphology, and absence of cellular or organic structures. Potential microplastic particles were verified using the hot needle test (formation of melting or curling upon contact with a heated stainless-steel needle). Particles were manually picked using stainless steel forceps and counted, and abundance was expressed as items per liter (items/L). They were classified based on shapes (fragments, fibers, foams, microbeads, and microfilms), colors (transparent, black, blue, red, green, and white), and sizes (0–100, 100–500, and 500–1,000 µm). The size of each particle was determined using calibrated imaging software attached to the microscope, and measurements were recorded as the longest dimension (maximum Feret diameter). Images of isolated microplastics were captured using an 18.0 MP digital camera coupled to the microscope. For polymer identification, particles from each sampling site were pooled, rinsed with distilled water to remove adhering debris, air-dried, and analyzed using a Nicolet Nexus 470 Attenuated Total Reflection Fourier Transform Infrared (ATR-FTIR) spectrometer (Thermo, USA) equipped with OMNIC software. Before analysis, the ATR crystal (diamond/ZnSe) was wiped clean using ethanol and a lint-free tissue. For each particle, spectra were generated by averaging 32 scans across the 650–4,000 cm−1 range at a resolution of 4 cm−1, with a scan time of approximately 1–2 min per particle. Background air spectra were recorded before each batch of measurements to minimize atmospheric interference (CO2 and H2O vapor). Spectral data were baseline-corrected and normalized prior to interpretation. Polymer types were identified based on characteristic absorbance peaks and functional groups, and confirmation was achieved through comparison with reference libraries within OMNIC software and published spectra[3]. A match quality threshold of ≥ 70%–80% similarity index was used for polymer confirmation. Detected polymers were classified as polyethylene terephthalate (PET), polypropylene (PP), polyvinyl chloride (PVC), polyethylene (PE), and polyamide/nylon (NY). Only spectra meeting quality control criteria were included in the final dataset.
Quality control and contamination prevention
-
Strict measures were implemented to minimize contamination during the extraction and quantification of microplastics. All instruments and materials used were free of plastic and thoroughly rinsed with ultrapure water before analysis. Laboratory procedures were carried out under controlled conditions, with personnel wearing non-synthetic protective clothing such as cotton lab coats, nitrile gloves, and safety goggles. Each sample was carefully labeled with detailed information, including exact GPS coordinates and sampling sites, to maintain proper traceability. Additionally, procedural blanks containing ultrapure water were analyzed alongside the samples to monitor potential contamination. The absence of microplastic particles in these blanks demonstrated the reliability and effectiveness of the quality assurance protocols.
Microplastic health risk assessment
-
The health risks associated with microplastics in the water were evaluated from their polymer risk index (PRI), pollution load index (PLI), and pollution load zone, as shown in Eqs (1), (2), and (3)[3,19].
$ \mathrm{PRI=\sum PMP\times PS} $ (1) $ \mathrm{PLI=Cn/Cb} $ (2) $ \mathrm{PLIzone=(PLI1\times PLI2\times PLI3\times PLI4)1/4} $ (3) In Eq. (1), PMP refers to the proportion of each microplastic polymer present in the water samples, while PS indicates the hazard score assigned to each polymer based on values reported in the literature. The corresponding scores are: polyethylene (PE) = 11, polypropylene (PP) = 1, polyethylene terephthalate (PET) = 4, nylon (NY) = 47, and polyvinyl chloride (PVC) = 35[3]. The potential risk index (PRI) was classified into four categories: values below 10 indicate risk level I; 10–100 correspond to level II; 100–1,000 represent level III; and values exceeding 1,000 fall under level IV[3].
In Eq. (2), Cn denotes the measured concentration of microplastics in a given sample, whereas Cb represents the baseline concentration, defined as the lowest value recorded in the study. A pollution load index (PLI) greater than 1 signifies contamination, while values less than or equal to 1 indicate that the water is not polluted[19].
Data analysis
-
Microplastic abundance data were analyzed using SPSS v26.0 and expressed as mean ± standard deviation (SD) (n = 9 per axis). Data normality and homogeneity of variance were evaluated using the Shapiro–Wilk and Levene's tests, respectively. Spatial differences in microplastic concentrations among sampling axes were assessed using one-way ANOVA, followed by Tukey's HSD post-hoc test when assumptions were satisfied; otherwise, the Kruskal–Wallis test with appropriate pairwise comparisons was applied. Statistical significance was set at p < 0.05, with 95% confidence intervals and effect sizes (η2) reported.
-
Table 1 presents the concentrations of microplastics in borehole water around the Sokoto cement factory. Boreholes located north of the factory recorded the highest microplastic concentrations at 460 ± 20 items/L, followed by those in the southern axis (200 ± 20 items/L) and the west (150 ± 10 items/L). Spatial differences in microplastic concentrations were highly significant (Table 2), with concentrations along the northern axis significantly exceeding those recorded along the other axes (all p < 0.001). Post-hoc analysis using Tukey's HSD test further confirmed that the north axis had significantly higher microplastic concentrations than the south, east, and west axes (p < 0.001). However, no statistically significant differences were observed among the south, east, and west axes (p > 0.05), indicating relatively similar microplastic levels in these directions.
Table 1. Concentrations of microplastics in water samples
Location GPS coordinate Concentration (items/L) North N 13°0842, E 5°24′3289 460 ± 20 South N 13°0652, E 5°23′7822 200 ± 20 East N 13°0342, E 5°10′1549 180 ± 10 West N 13°0721, E 5°22′3259 150 ± 10 Values are presented as mean ± SD (n = 9). Table 2. Spatial distribution of microplastics around the axes of the cement plant
Source SS df MS F p-value η2 Between groups
(sampling axes)553,275.0 3 184,425.0 737.7 1.33 × 10⁻²⁹ 0.986 Within groups (error) 8,000.0 32 250.0 Total 561,275.0 35 One-way ANOVA testing spatial differences in microplastic concentration (items/L) among sampling axes (north n = 9, south n = 9, east n = 9, west n = 9). F (3,32) = 737.7, p < 0.001, η2 = 0.986 indicates 98.6% of variance explained by location. Tukey HSD post hoc: north significantly higher than all others (p < 0.001); no differences among south/east/west (p > 0.05). Concentrations of microplastics in water around the Sokoto cement plant compared with cement-free environments
-
The concentrations of microplastics in water samples collected from the vicinity of the Sokoto cement plant and cement-free environments are presented in Table 3. The highest microplastic concentration was recorded at the cement plant site (510 ± 110 items/g), indicating substantial microplastic contamination in the immediate vicinity of cement production activities. In contrast, significantly lower concentrations were observed at locations 2 km away from the cement plant, with values of 110 ± 20 items/g at the northern site and 90 ± 10 items/g at the southern site.
Table 3. Concentrations of microplastics in water around the Sokoto cement plant compared with cement-free environments
Location GPS coordinate Concentration (items/L) Cement plant N 13°0618, E 5°17'1114 510 ± 110 2 km north of cement plant N 13°0798, E 5°17'1114 110 ± 20 2 km south of cement plant N 13°0876°, E 5°23'3411 90 ± 10 Characteristics of microplastics in the water samples
-
The percentage distribution of microplastic shapes in the water samples is shown in Table 4. Samples collected from the western boreholes exhibited the highest diversity of microplastic shapes, dominated by microbeads (38%), followed by foams (21%), fibers (23%), pellets (10%), and microfilms (8%). In the southern boreholes, fibers accounted for the highest proportion (42%), followed by microfilms (33%), foams (10%), microbeads (10%), and pellets (5%). The northern boreholes showed a uniform composition, consisting entirely of fibers (100% fibers). Samples from eastern boreholes exhibited a heterogeneous distribution of microplastic shapes, dominated by fibers (35%), followed by microbeads (25%), microfilms (20%), foams (10%), and pellets (10%). Photomicrographs of these microplastic shapes are presented in Fig. 3.
Table 4. Distribution of microplastic shapes in the water samples
Microplastic shape North South East West Fiber 100 42 35 23 Microfilm 0 33 20 8 Microbead 0 10 25 38 Foam 0 10 10 21 Pellet 0 5 10 10 Total (%) 100 100 100 100 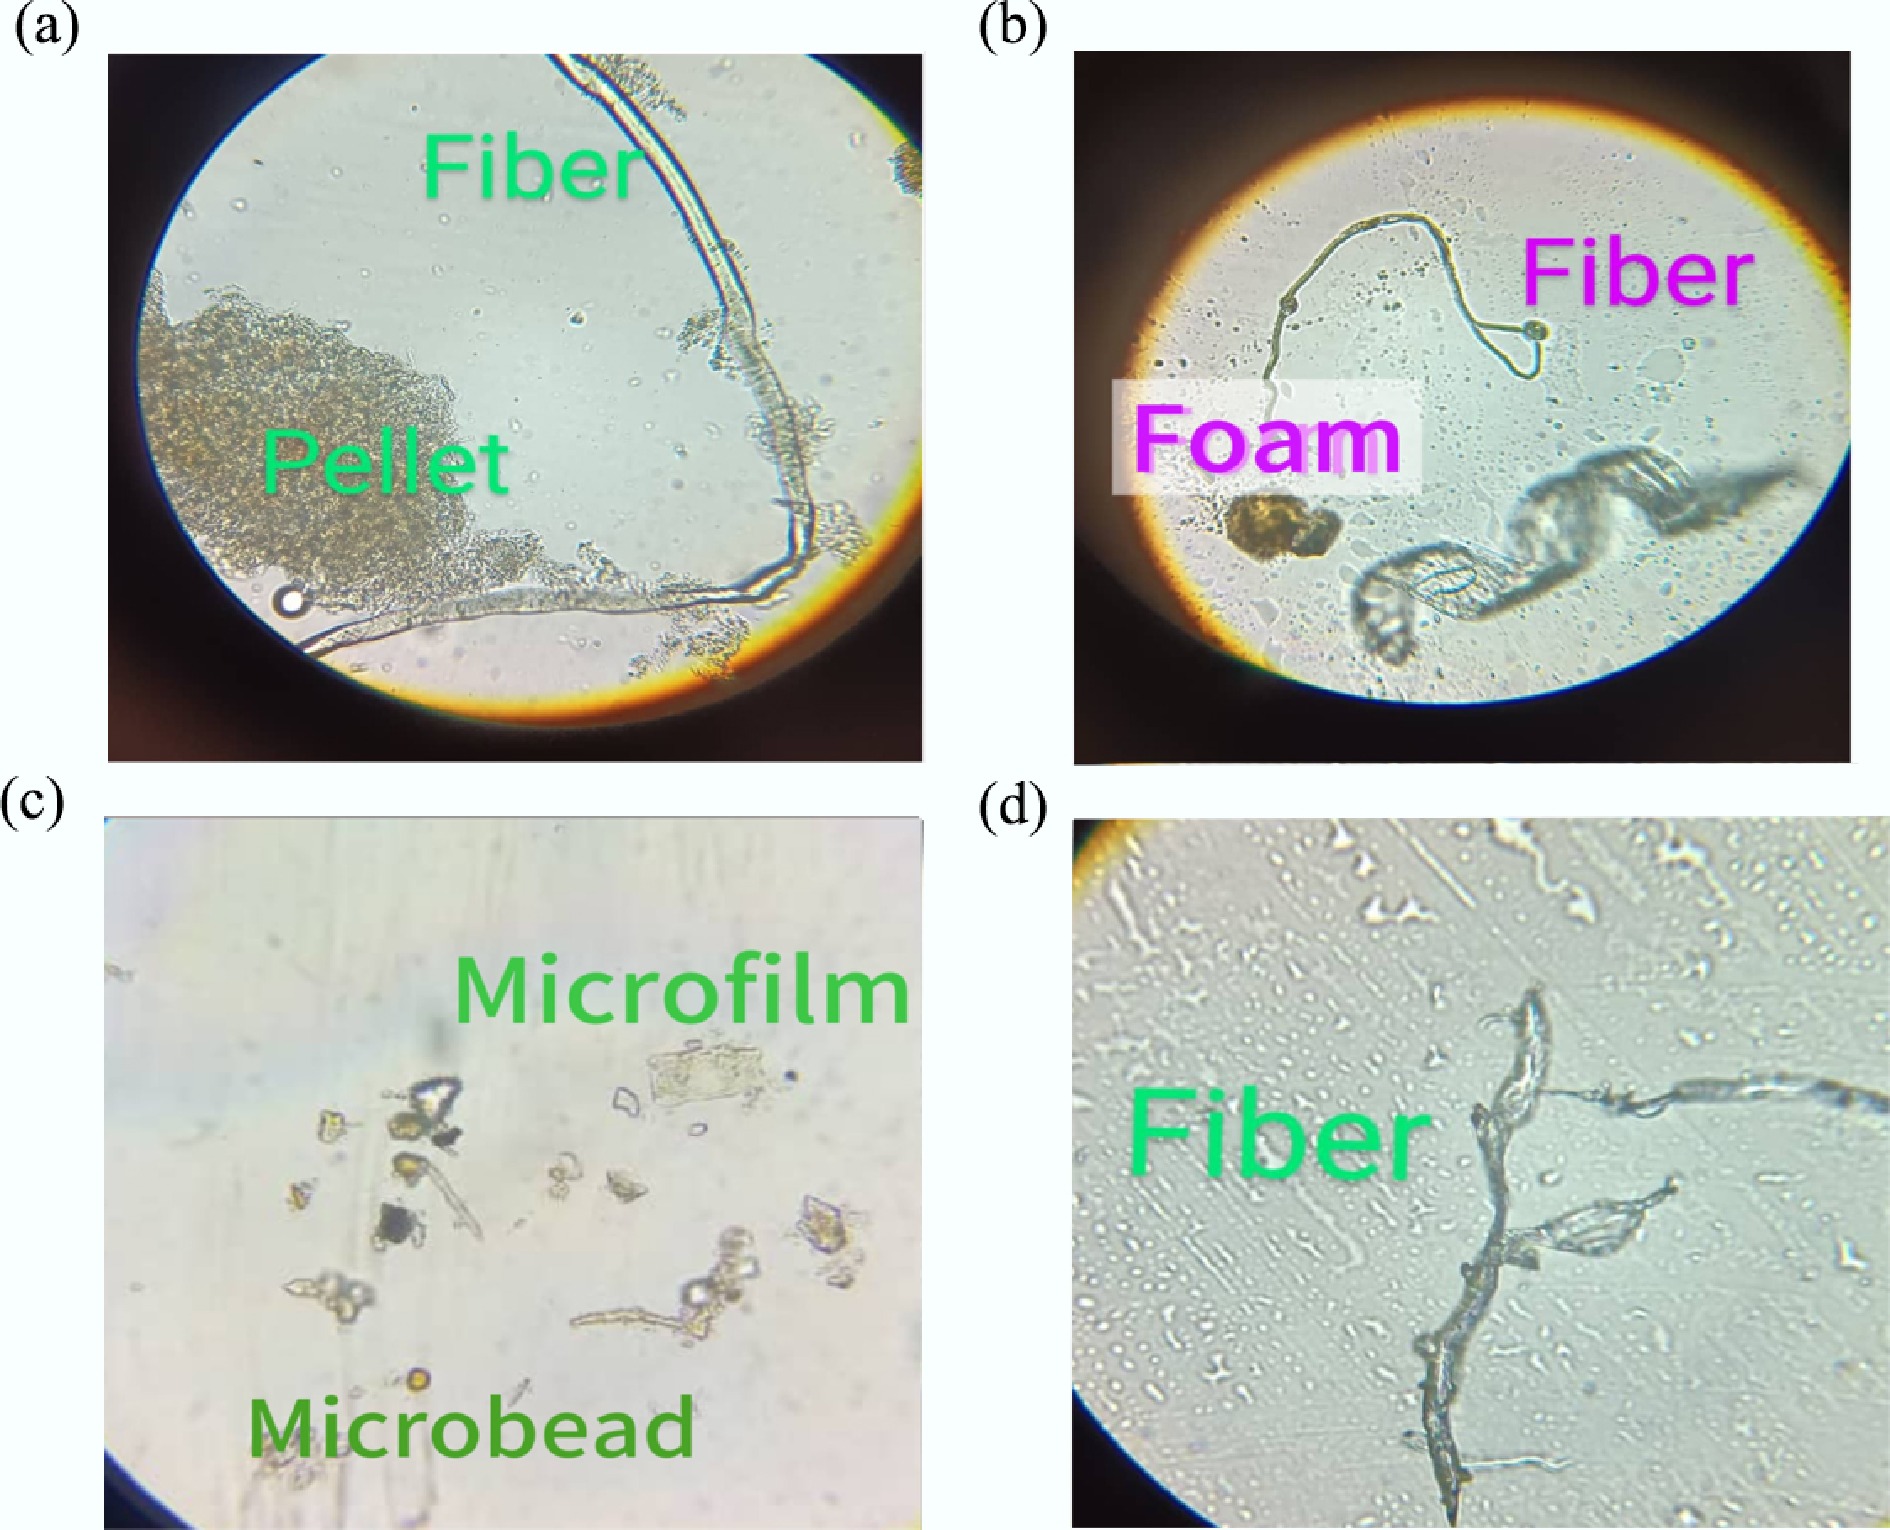
Figure 3.
Microplastic shapes identified in the water samples showing (a) fiber and pellet, (b) fiber and foam, (c) microbead and microfilm and (d) fiber.
Figure 4 presents the percentage distribution of microplastic sizes in the water samples. In northern boreholes, the size of the majority of microplastics was 500–1,000 µm, followed by 0–100, 100–500, and 1,000–1500 µm, respectively. In southern boreholes, the predominant size was 100–500 µm, followed by 0–100, 500–1,000, and 1,000–1,500 µm. In eastern boreholes, 100–500 µm constituted the largest proportion, followed by 500–1,000, 0–100, and 1,000–1,500 µm, respectively. In western boreholes, the dominance of microplastics was 500–1,000 µm, followed by 100–500, 1,000–1,500, and 0–100 µm, respectively.
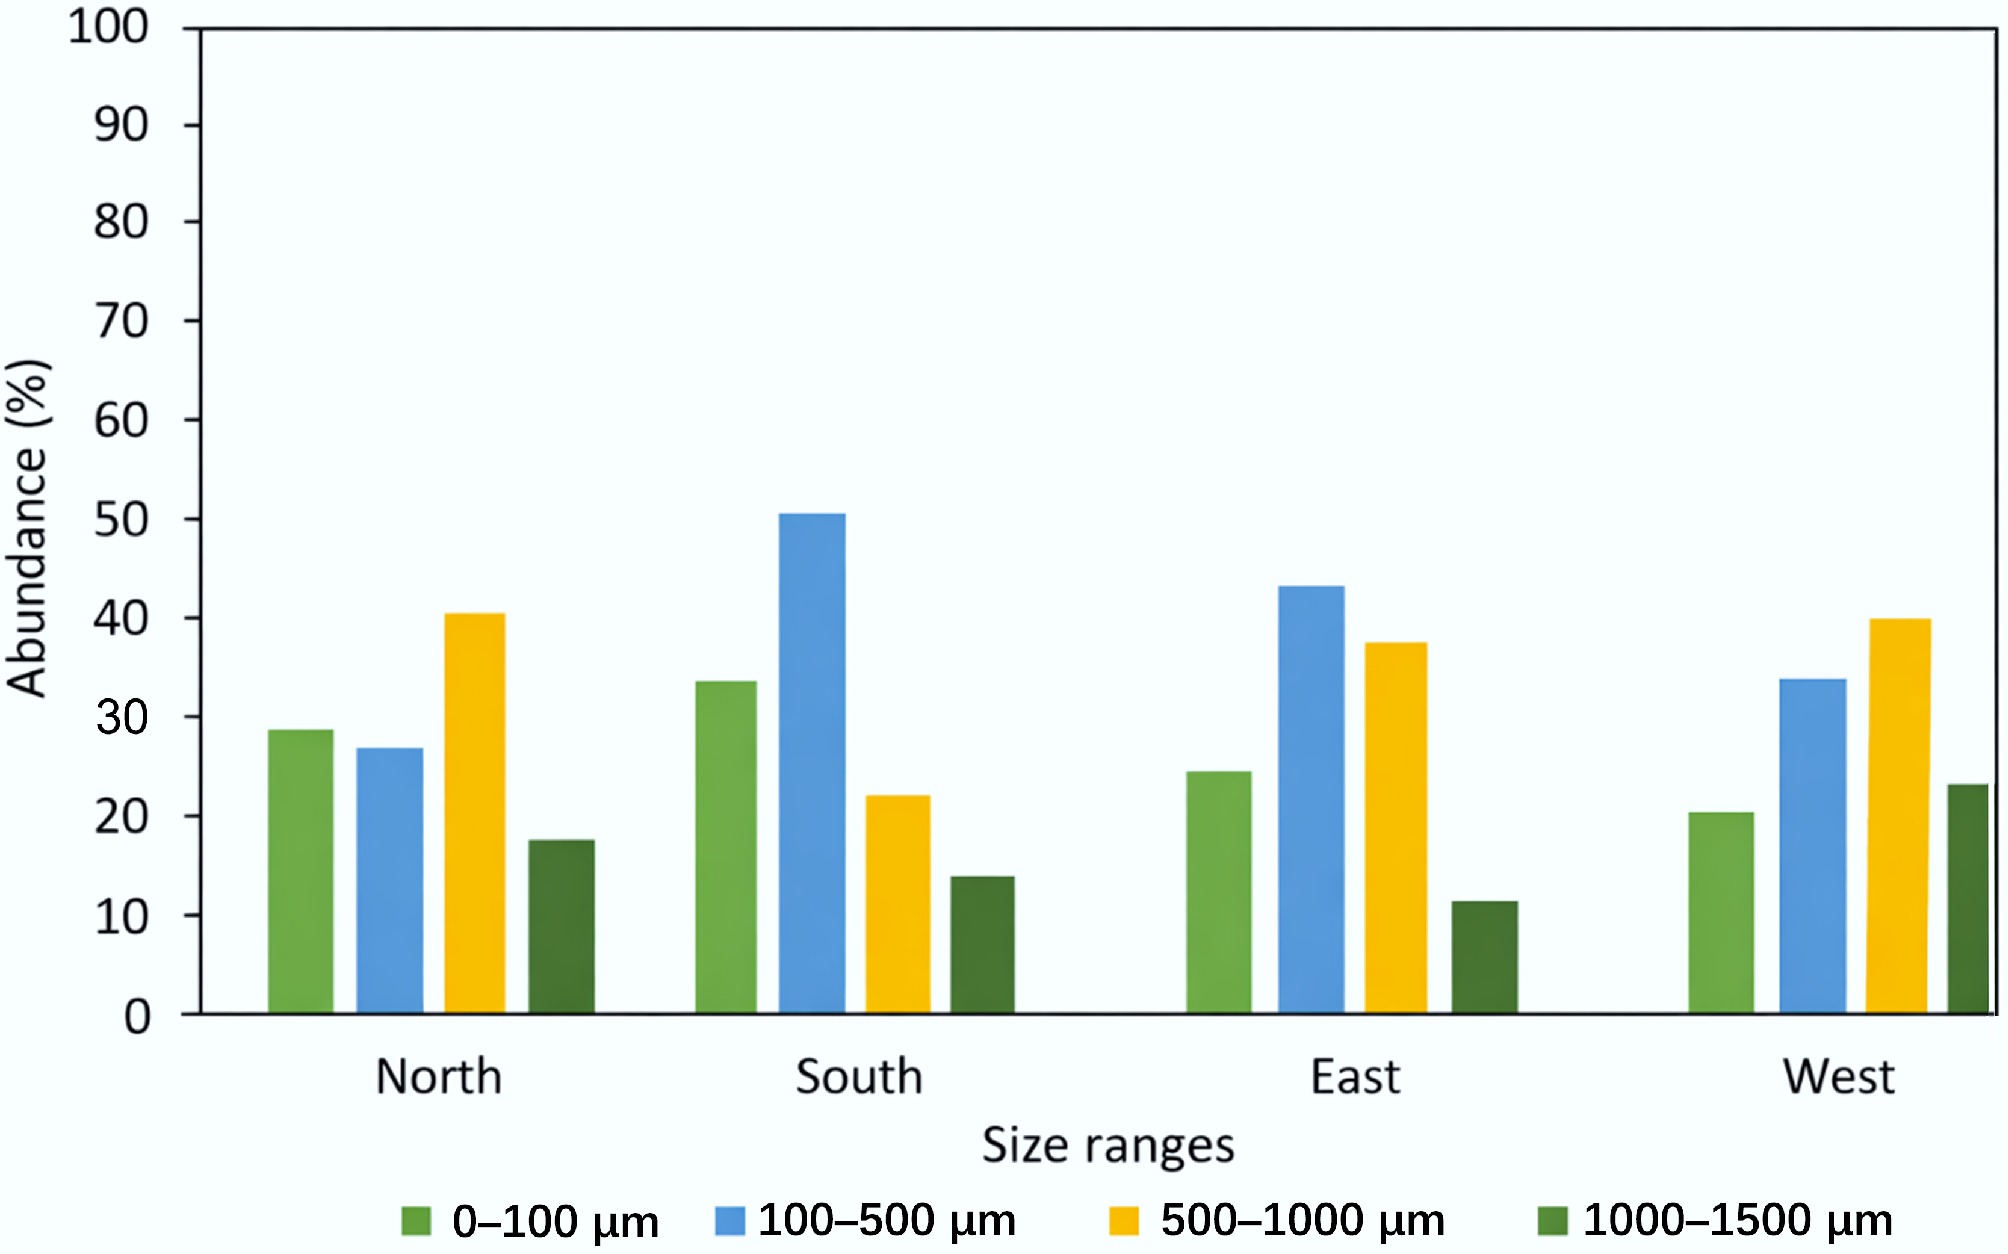
Figure 4.
Distribution (%) of microplastic size in the water samples.
The percentage distribution of microplastic colors in the water samples is shown in Fig. 5. Transparent was the dominant color in the water samples, followed by white, black, blue, and yellow.
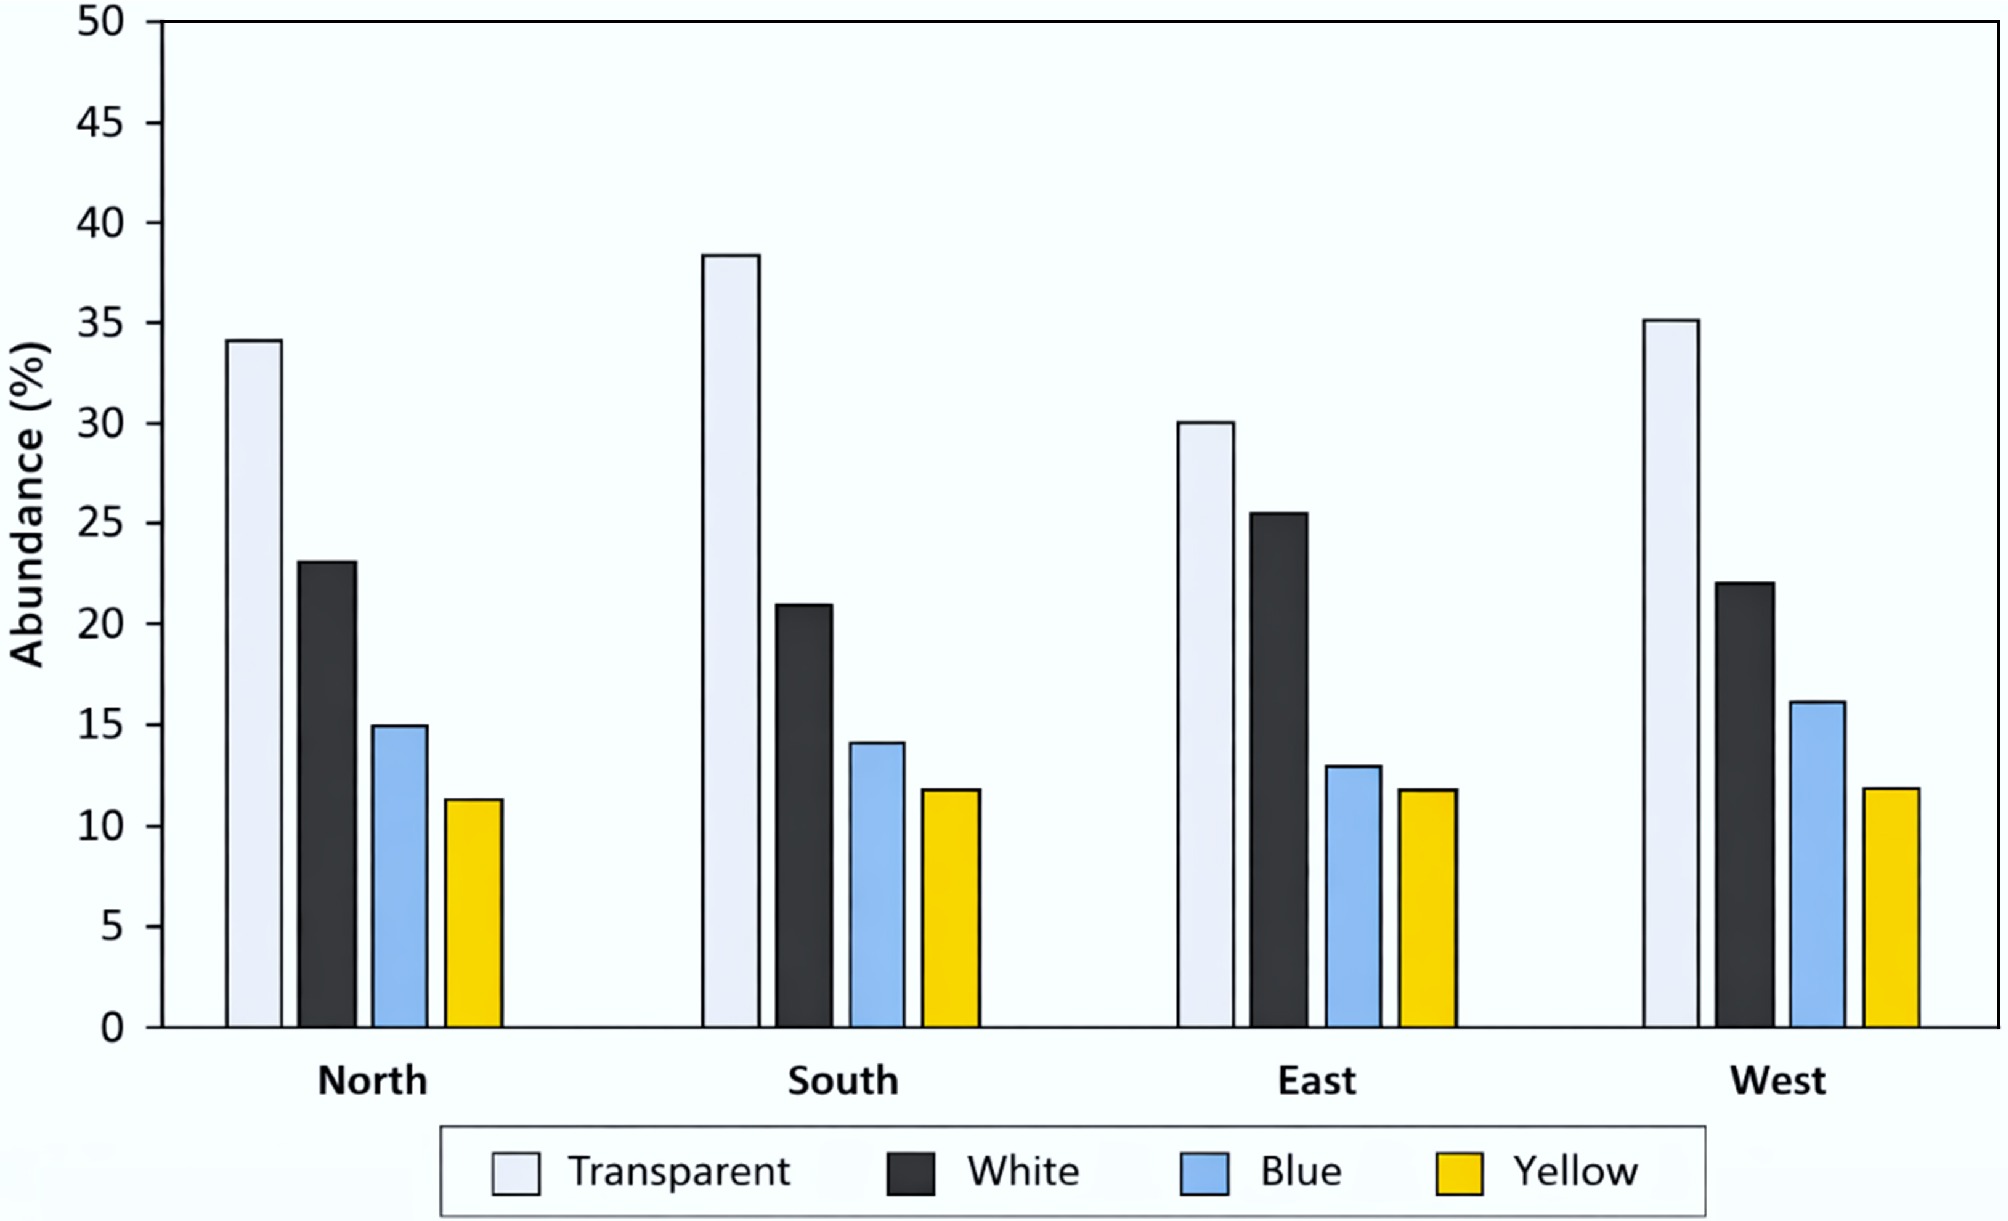
Figure 5.
Distribution (%) of microplastic colors in the water samples.
Polymer types and distribution in the water samples
-
The spectral characteristics and functional groups of the polymers detected in the water samples are presented in Table 5 and Fig. 6. Samples from the southern boreholes showed absorption peaks at approximately 2,915–2,848 cm−1, corresponding to C–H stretching vibrations of aliphatic hydrocarbons, indicating the presence of polyethylene (PE) and polypropylene (PP). Peaks around 1,630–1,680 cm−1 region correspond to Amide I and II bands typical of polyamide (nylon). Absorption peaks at 1,715–1,730 cm−1 are associated with the C=O stretching of ester groups, confirming the presence of polyethylene terephthalate (PET). Additionally, peaks within the 600–700 cm−1 correspond to C–Cl stretching vibrations, signifying the presence of polyvinyl chloride (PVC).
Table 5. Absorbance peaks, functional groups, and polymers identified in the water samples
Sample Absorbance
peak (cm−1)Functional group Polymer type[3] South 2,915–2,848 C–H stretching
(aliphatic hydrocarbons)PE, PP 1,630–1,680 Amide I and II bands NY 1,715–1,730 C=O stretching
(ester group)PET 600–700 C–Cl stretching PVC West 2,915, 2,848 C–H stretching PE 989.6, 907.6 C–H bending/rocking PE 793.9, 743.6 C–Cl stretching PVC 1,715–1,730 C=O stretching (ester) PET North 2,915–2,848 C–H stretching PE 1,715–1,730 C=O stretching
(ester group)PET 993.3, 903.9 C–H bending PVC 782.7, 743.6 C–Cl stretching PVC East 2,915-2,848 C–H stretching PE 1,728.6 C=O stretching
(ester group)PET 989.1, 908.3 C–H bending, C–Cl stretching PVC 1,450–1,375 CH3 bending PP PP = Polypropylene, PE = Polyethylene, PVC = Polyvinyl Chloride, PET = Polyethylene Terephthalate, NY = Nylon. 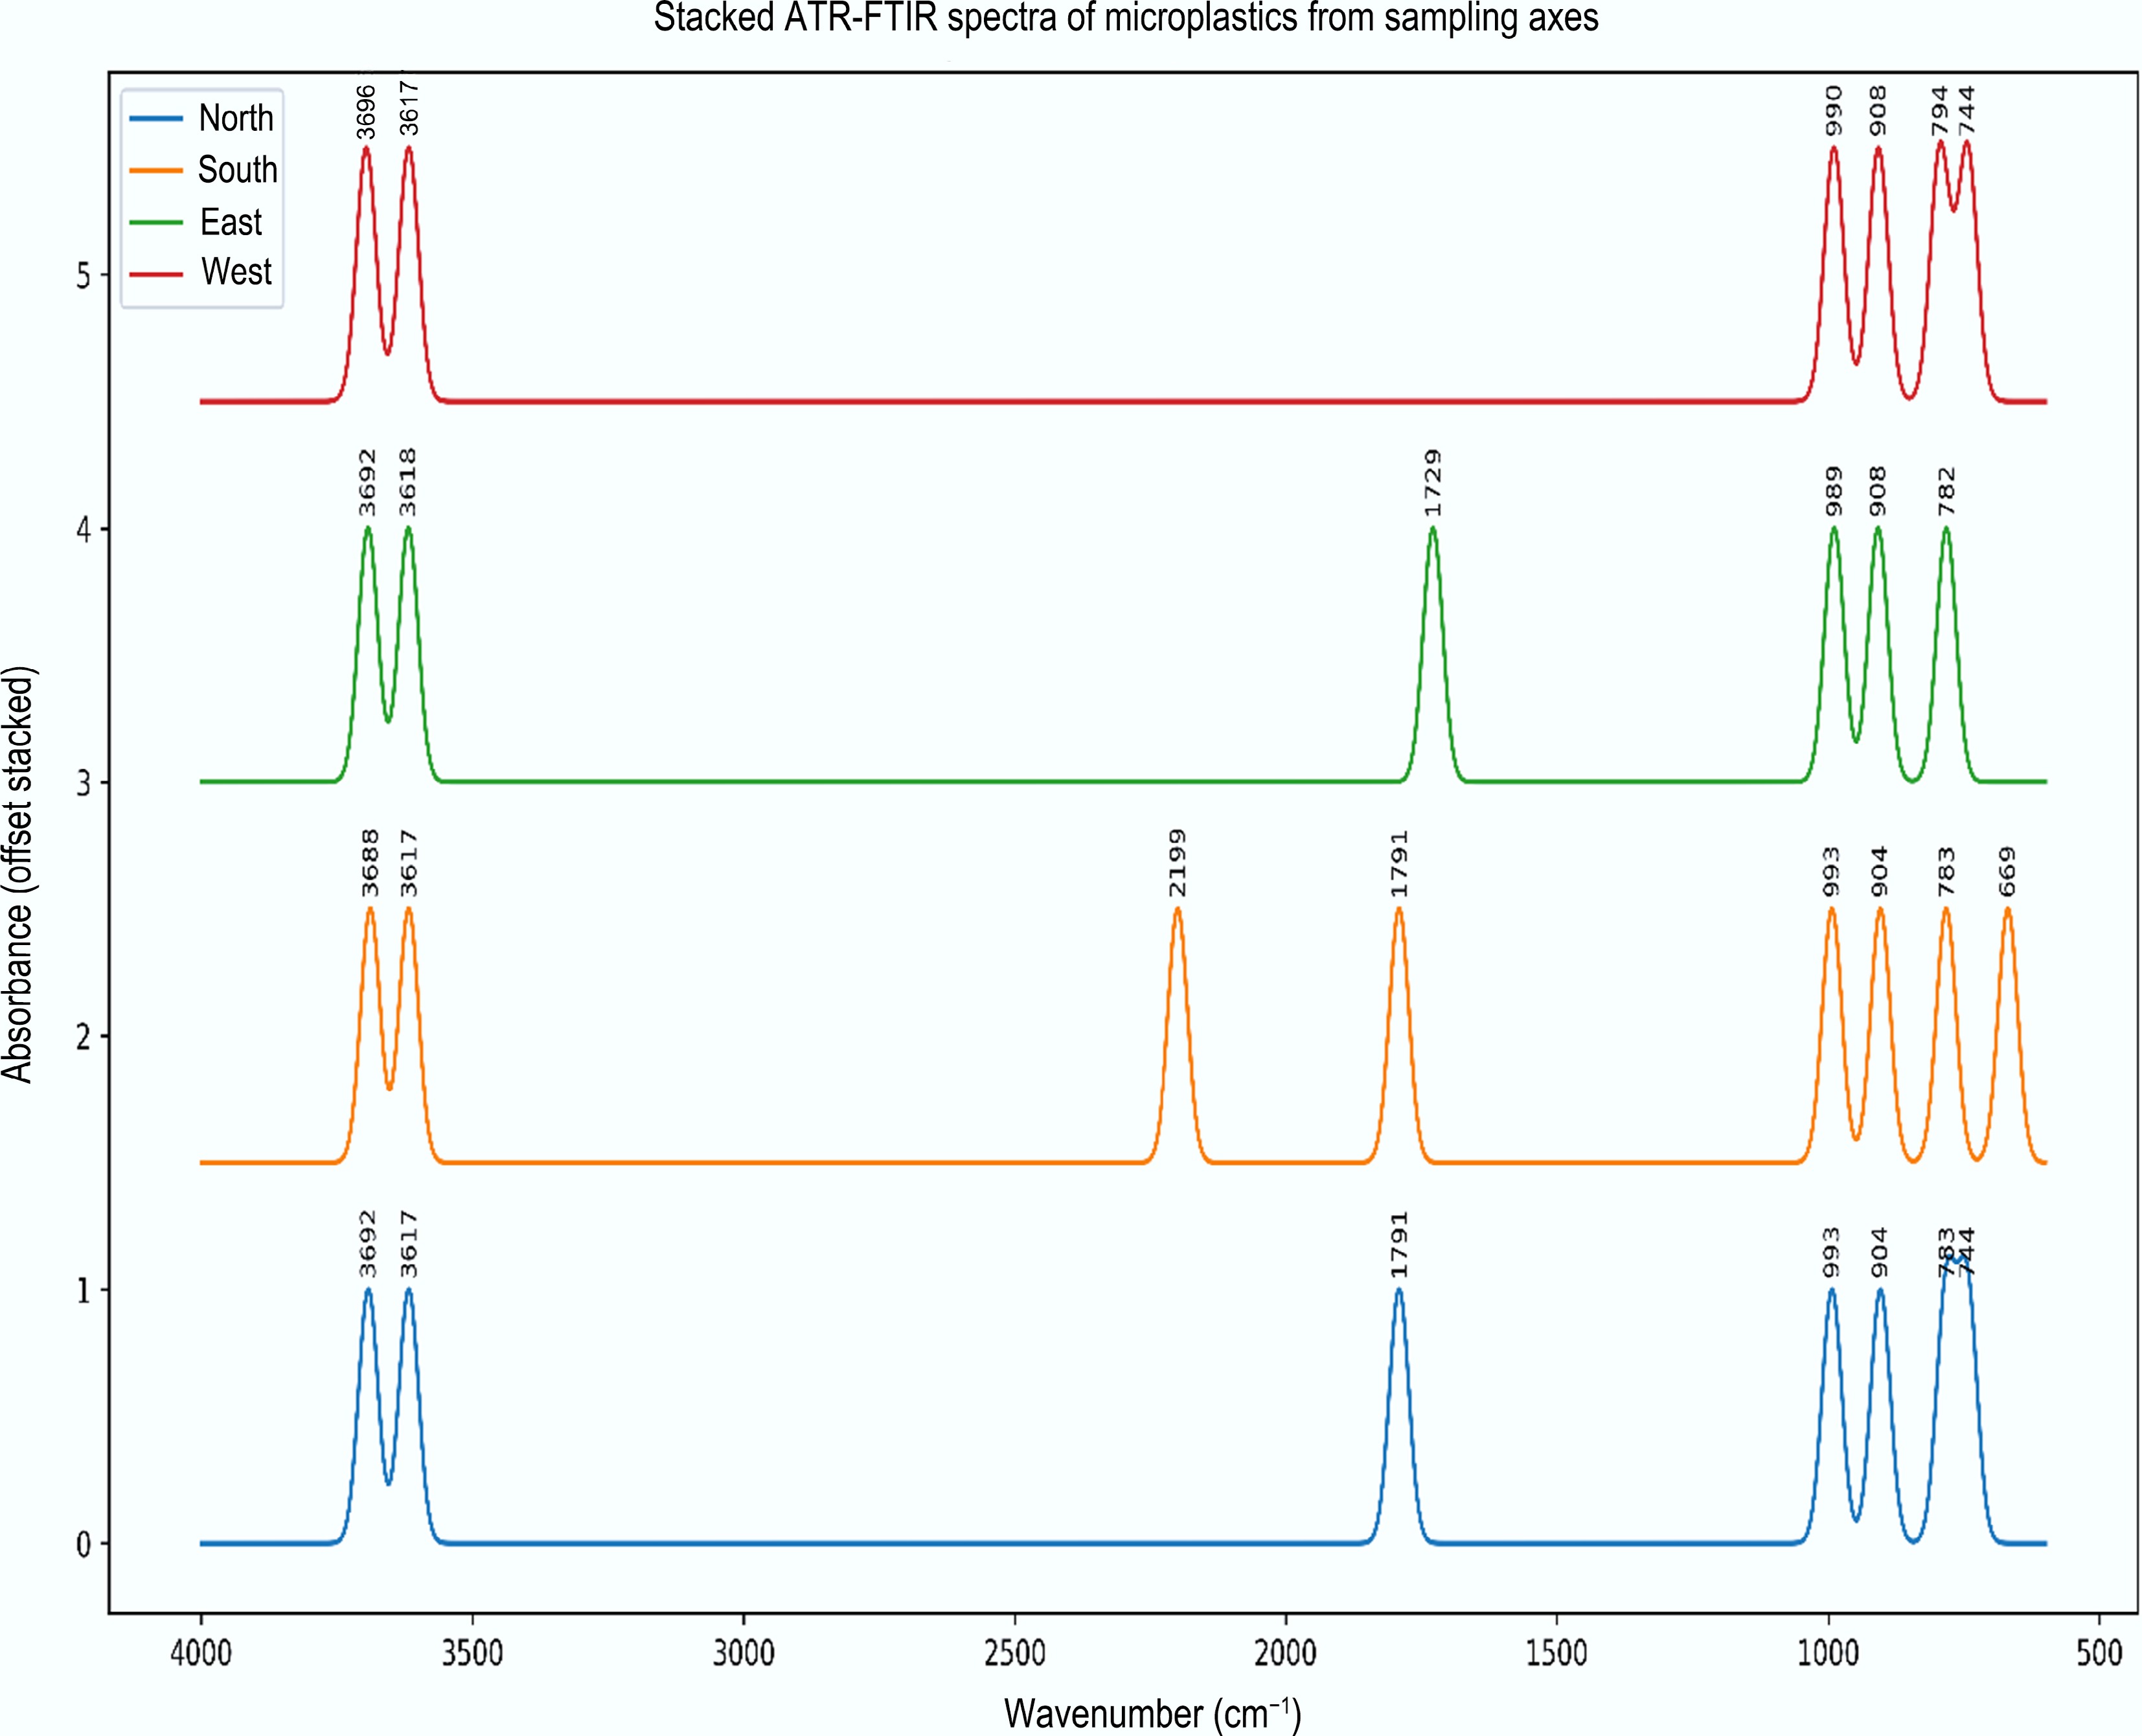
Figure 6.
Representative ATR-FTIR spectra of microplastics from each sampling axis.
Samples from the western boreholes exhibited strong absorption peaks at 2,915 and 2,848 cm−1, which indicate C–H stretching vibrations, confirming the presence of PE. Additional peaks at 989.6 cm−1 and 907.6 cm−1 represent C–H stretching vibrations, further supporting PE identification. Absorption peaks at 793.9 cm−1 and 743.6 cm−1 correspond to C–Cl stretching, indicating PVC. Peaks observed near 1,715–1,730 cm−1 are attributed to ester carbonyl (C=O) stretching, indicating polyethylene terephthalate (PET).
Samples from the northern boreholes showed distinct peaks at 2,915–2,848 cm−1, corresponding to aliphatic C–H stretching vibrations characteristic of polyethylene (PE). A peak at 1,715–1,730 cm−1 corresponds to C=O stretching vibrations typical of ester linkages, indicating the presence of PET. Additional peaks at 993.3 cm−1 and 903.9 cm−1 represent C–H bending vibrations, while peaks at 782.7 cm−1 and 743.6 cm−1 correspond to C–Cl bending, confirming the presence of PVC.
Samples from the eastern boreholes exhibited broad absorption peaks at 2,915–2,848 cm−1 corresponding to C–H stretching vibrations, confirming the presence of PE. Additional peaks at 1,728.6 cm−1 represent C=O stretching vibrations, indicating the presence of PET. Absorption peaks at 989.1 and 908.3 cm−1 correspond to C–H bending and C–Cl stretching vibrations, respectively, indicating PVC. An additional peak at 1,450–1,375 cm−1 is characteristic of CH3 bending vibrations, confirming the presence of polypropylene (PP).
Figure 7 illustrates the percentage distributions of polymer types in the water samples. PE emerges as the dominant polymer, constituting 40.00% in the northern boreholes, 43.30% in the western boreholes, 33.30% in the eastern boreholes, and 30.00% in the southern boreholes. This distribution is followed by PET with percentages of 33.30% in the northern boreholes, 30.00% in western boreholes, 23.30% in eastern boreholes, and 17.70% in the southern boreholes. PVC accounts for 26.70% in northern, eastern, and western boreholes, and 16.70% in the southern boreholes. PP accounts for 20.00% in the southern boreholes and 16.70% in the eastern boreholes. NY constitutes 15.60% in southern boreholes.
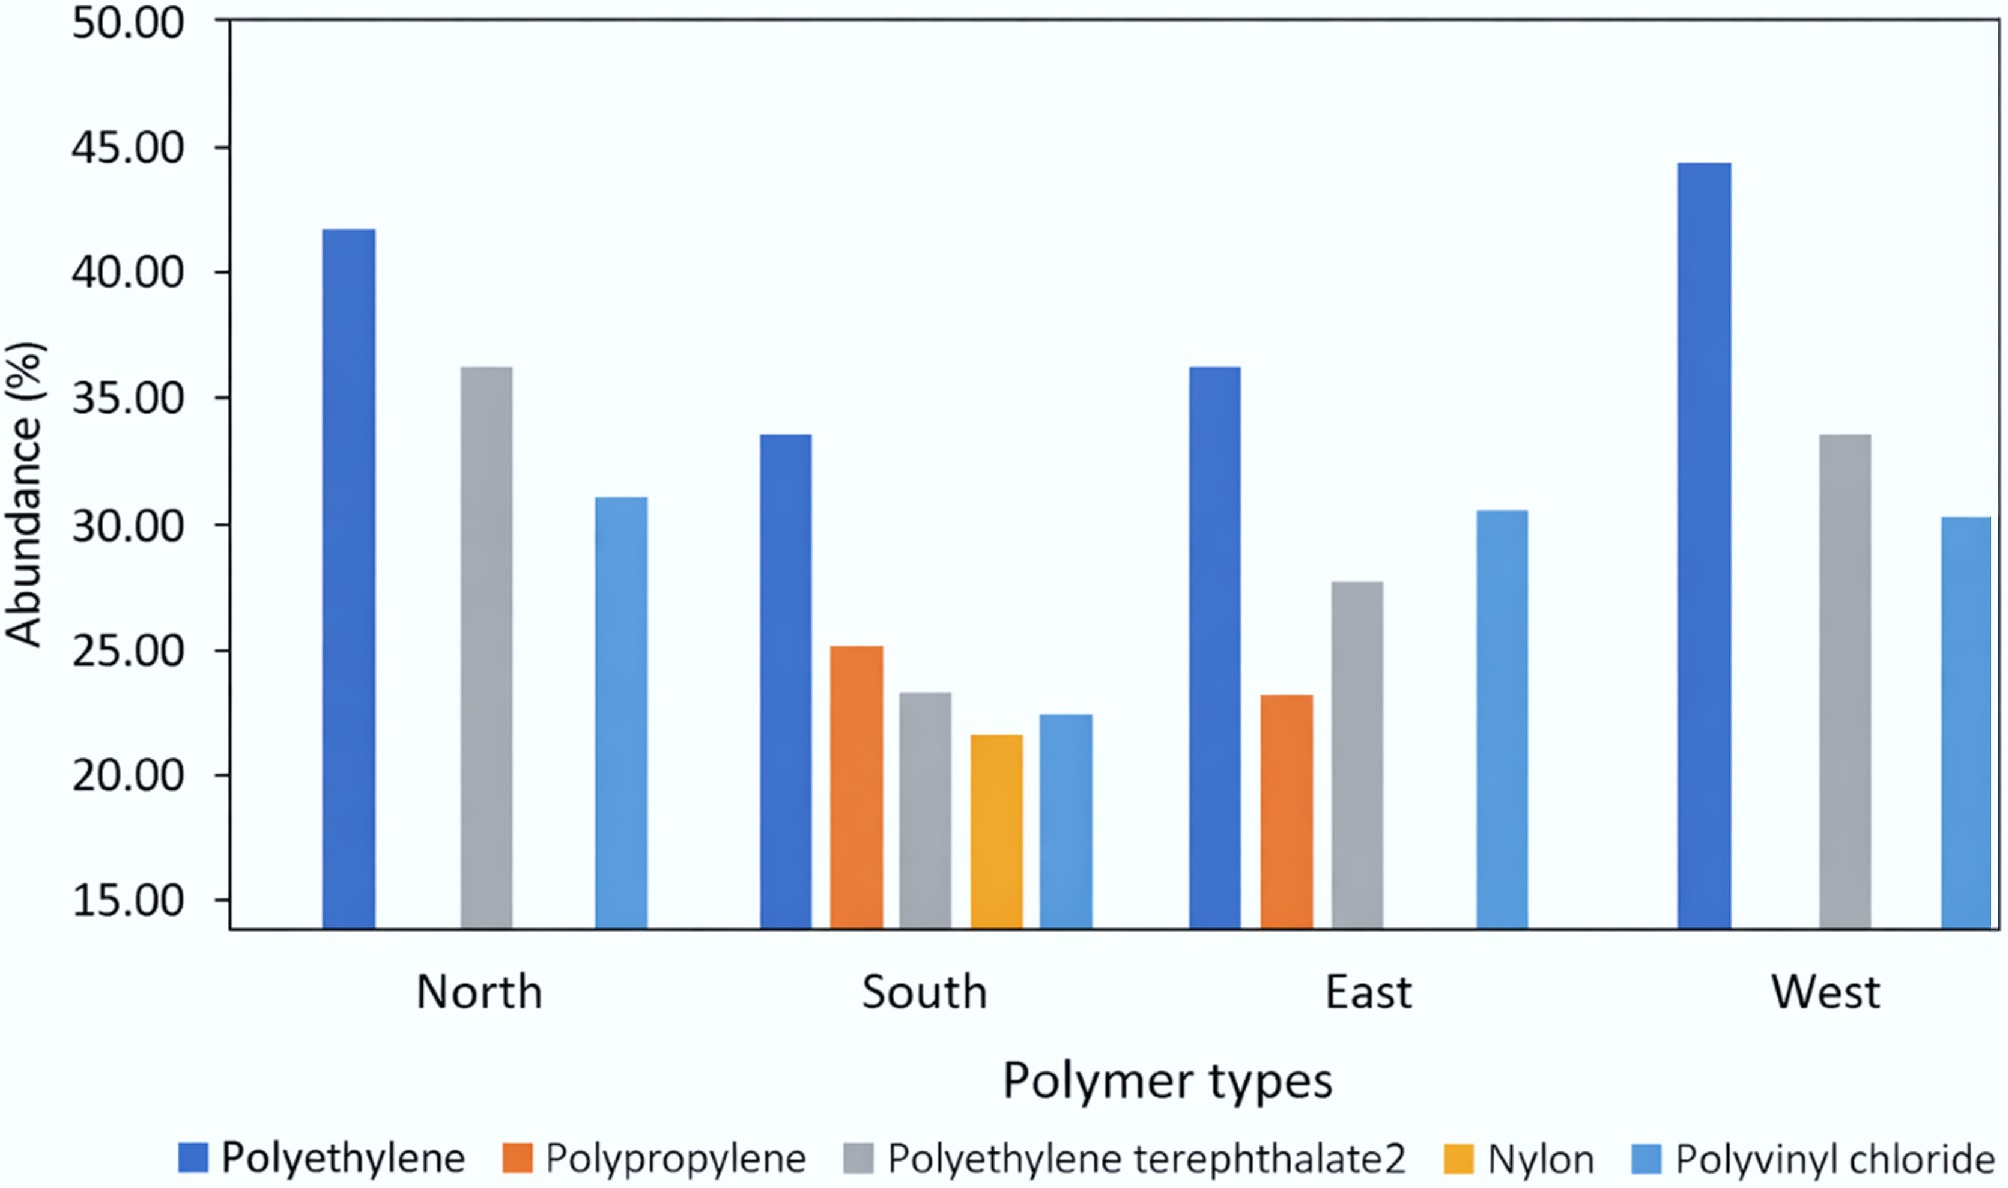
Figure 7.
Distribution (%) of polymer types in the water samples.
Associated health risks of the water samples
-
Table 6 presents the Polymer Risk Index (PRI) of the detected polymers in groundwater samples across the study locations. The calculated total PRI values for all locations (north, south, east, and west) ranged from 1,410.7 to 1,738.5, indicating a risk level IV (> 1,000). This high-risk classification is primarily influenced by the presence and relative proportions of polymers such as polyethylene (PE), polyethylene terephthalate (PET), polyvinyl chloride (PVC), polypropylene (PP), and nylon (NY), which contributes differently to the overall PRI based on their respective hazard scores, with some polymers posing significantly higher risks than others due to their toxicity and persistence in the environment. The pollution load index (PLI) of microplastics in the water samples is presented in Table 7. The north, south, and east sampling locations recorded PLI values greater than 1, indicating higher levels of contamination, whereas the west location showed the lowest value (1.00).
Table 6. Risk index of polymers in the water samples
Location PE (%) PET (%) PVC
(%)PP
(%)NY
(%)Total PRI Risk level North 40.0 33.3 26.7 0.0 0.0 1507.7 IV (> 1,000) South 30.0 17.7 16.7 20.0 15.6 1738.5 IV (> 1,000) East 33.3 23.3 26.7 16.7 0.0 1410.7 IV (> 1,000) West 43.3 30.0 26.7 0.0 0.0 1530.8 IV (> 1,000) Risk level IV indicates very high risk. The PRI indicates relative polymer hazard potential and does not represent a quantitative drinking water exposure risk assessment. Table 7. Pollution load index (PLI) of the water samples
Location PLI North 3.07 South 1.33 East 1.20 West 1.00 PLI zone 1.54 Pollution load index greater than 1 signifies water pollution. -
The present study assessed the abundance, characteristics, and associated risks of microplastics in borehole water around the Sokoto Cement Factory, Nigeria. Microplastics were detected in all analyzed samples, with concentrations ranging from 150 to 460 items/L (Table 1), indicating widespread contamination of groundwater in the study area. These concentrations are higher than the 103.73 ± 2.28 particles/L detected in groundwater in urban areas in India[20] and the 18 to 94 particles/L detected in groundwater around a landfill in Thailand[21]. However, they are lower than the 2,250 ± 469 items/L detected in a river close to a plastic factory in China[22]. These variations suggest that the release of microplastics from anthropogenic sources depends on the intensity of human activity, the type of industry, and the effectiveness of waste management infrastructure.
Cement production facilities can release microplastics into the surrounding environment through several pathways. One important source noticed at the cement factory is the degradation of plastic packaging materials, particularly PE and PP cement bags, which can fragment into smaller particles over time. Microplastics may also originate from the incorporation of synthetic fiber additives, such as NY and PP used in concrete to improve strength and durability. In addition, the co-processing of recycled plastic materials in cement kilns can contribute to microplastic emissions if particles are not completely degraded during combustion. Another potential source is the wear and tear of vehicle tires from heavy-duty haul trucks operating within the plant premises, which generate black rubber fragments that can enter the surrounding environment. The movement of these microplastics into groundwater systems is influenced by the geological characteristics of the area, which falls under the Sokoto Basin. The limestone formations in this region enhance rapid infiltration of surface contaminants into subsurface water systems[23]. Seasonal Harmattan winds further facilitate the atmospheric transport and deposition of microplastic particles (Fig. 2). During the rainy season, monsoon runoff can mobilize deposited particles, allowing them to migrate through soil macropores and reach shallow aquifers that supply community boreholes, typically less than 30 m deep[24]. Source apportionment based on polymer composition provides additional evidence of the contribution of cement plant activities. For example, elevated concentrations of PE and PVC detected near the plant compared with regional background levels suggest that the cement production process and associated activities are significant sources of microplastic contamination in the area.
The spatial decline in microplastic concentrations with increasing distance from the cement plant (Table 2) suggests that the factory's operations contribute significantly to microplastic pollution, thereby posing potential health risks to local consumers. The relatively similar microplastic levels observed at the two cement-free locations indicate minimal background contamination in the absence of direct industrial influence. Overall, these findings demonstrate that activities associated with the Sokoto Cement Factory are a major source of elevated microplastic levels in nearby water sources. The highest microplastic concentrations detected along the northern axis of the cement plant may be attributed to seasonal meteorological conditions, as sampling was conducted during the rainy season when prevailing southerly winds could have facilitated the northward transport and deposition of particulate matter, including microplastics. The northern hotspot aligns with prevailing winds during sampling (Fig. 2), confirmed by ANOVA (F[3,32] = 737.7, p < 0.001; Table 2).
There are currently no published studies on microplastic contamination specific to the Sokoto Cement Factory for direct comparison. However, previous investigations in the same vicinity reported non-permissible concentrations of heavy metals, particularly Pb, Fe, Cu, Ni, Cd, Cr, and Zn in groundwater and tomato plants cultivated near the cement plant[25,26]. These findings indicate substantial environmental pollution and suggest a potential association between heavy metal contamination and the presence of microplastics, given the ability of microplastics to adsorb and transport metals. Furthermore, another study reported compromised physicochemical parameters in groundwater from the same area, further supporting the likelihood of interactions between altered water quality parameters and microplastic contamination[27].
Characterization of the detected microplastics showed fibers, microbeads, and films as the dominant shapes in the water, consistent with findings in borehole water in Birnin Kebbi, Nigeria[28] and in Ilishan-Remo, Ogun State, Nigeria[29]. A similar finding was also observed in groundwater in Indonesia[30]. However, this contrasts with findings of studies which reported fragments as the dominant shape in surface water in southeast Nigeria[31] and in borehole water in Lagos, Nigeria[32]. These differences highlight the diversity of microplastic shapes and their sources in the Nigerian water system. Cement plants use synthetic fibers to enhance material properties[33], which could be a source of the microplastic fibers detected in the present study. The industry may also introduce fibers through the use of recycled plastic waste and sewage sludge in concrete mixtures[33]. Microbeads may enter the cement and construction sectors through the intentional addition of polymers to concrete and the degradation of plastic materials used during construction[33]. Microplastic films, on the other hand, primarily originate from the degradation and mismanagement of plastic materials used in production and cement packaging, rather than intentional incorporation[33].
Secondary microplastics are typically characterized by non-uniform size distributions[34]. Therefore, the occurrence of multiple size classes, dominated by 500–1,000 µm and 100–500 µm fractions, with lower proportions of 0–100 µm and 1,000–1,500 µm, indicates that the groundwater around the cement facility is predominantly impacted by secondary microplastics generated through the fragmentation of larger plastic materials. The presence of both smaller (0–100 µm) and larger (1,000–1,500 µm) particles further suggest continuous degradation processes and multiple input pathways, confirming heterogeneous sources and diverse types of microplastics in the groundwater environment. Comparable microplastic size distributions were reported in borehole water in Birnin Kebbi[28], a neighboring state. Similar particle size ranges were also documented in surface water and sediments in Lagos, Nigeria[35]. In contrast, studies in Edo State[36] and in Abakaliki, Nigeria[37], reported a dominance of smaller-sized (0–100 µm) microplastics. Although some studies suggest that microplastics may be expelled from the body relatively quickly, their potential for accumulation, particularly larger particles, remains a significant concern. Larger microplastics, as obtained in this study, may become lodged in the gastrointestinal tract and other tissues, potentially causing inflammation and tissue damage[38].
The detection of varied colors, predominantly transparent, white, black, blue, and yellow, further indicate diverse sources of microplastics in the groundwater around the cement facility. Transparent and white microplastics are commonly associated with the fragmentation and leaching of general plastic waste[33]. Black microplastics are likely to originate from tire wear associated with haulage trucks or from tires used in energy generation within the cement factory, and these particles may migrate through soil layers into underlying aquifers[39]. Blue and yellow microplastics likely originate from plastic packaging materials, paints and coatings, and industrial abrasives used within the cement production environment[40].
Further analysis revealed that the dominant polymers in the water samples, in order of occurrence, are polyethylene (PE), polyethylene terephthalate (PET), polyvinyl chloride (PVC), polypropylene (PP), and nylon (PA). This study demonstrates the diversity of polymers present in the samples and suggests multiple sources of microplastics, likely linked to the factory's operations. These findings are consistent with studies that reported PE and PET as dominant polymers in borehole and river water in Nigeria[28,41]. However, they contrast with some studies that identified PP as the predominant polymer in borehole and river water in southwest Nigeria[32,42]. PE is intentionally used in cement production to improve the mechanical properties, durability, and corrosion resistance of cement-based materials[43]. PET may originate from recycled plastic waste incorporated into construction materials as an environmentally friendly method of reducing plastic pollution[44]. PVC could have leached from pipes and conduits used in constructing the facilities. PP is commonly added to cement, typically as fibers, to enhance mechanical strength, durability, resistance to cracking and shrinkage, and performance under freeze-thaw cycles, abrasion, and fire exposure[45]. Nylon is not a primary raw material in cement production, but may enter the process as a recycled waste product used for reinforcing fibers[46].
The risks posed by the detected polymers, as indicated by the polymer risk index assessment, are concerning, particularly NY, which exhibited a very high risk (Level IV). Upon ingestion, NY has been reported to induce oxidative stress, inflammation, and potential damage to the gastrointestinal tract and other organs[47]. Ingestion of PE through drinking water may also lead to adverse health effects, including inflammation, oxidative stress, liver injury, and potential endocrine disruption due to the associated chemical additives[48]. Polyethylene terephthalate (PET) ingestion via drinking water represents an important human exposure pathway and has been linked in experimental studies to inflammation, oxidative stress, immune system dysregulation, and hormonal imbalance[49]. Likewise, the ingestion of water contaminated with PVC has been linked to heightened risks of carcinogenicity, immune system dysfunction, endocrine disruption, and neurotoxicity[50]. Although PP exhibited a very low risk in the present study, exposure has still been associated with oxidative stress, inflammatory responses, and impairment of the intestinal barrier[51]. Further analysis showed that PLI of the microplastics in the water samples from all the axes was greater than 1, implying that the water was contaminated and could contribute to health and ecological problems.
-
Microplastics were detected in borehole water across all sampling axes surrounding the Sokoto Cement Factory, with concentrations ranging from 150 ± 10 to 460 ± 20 items/L, and significantly higher levels were recorded in the northern axis (ANOVA F[3, 32] = 737.7, p < 0.001). Fibers and films were the dominant particle types, while the most frequently identified polymers were PE, PET, PVC, PP, and NY. Polymer hazard screening using the PRI indicated high hazard potential across locations (PRI = 1,410–1,739; Risk Level IV). The PLI of the detected microplastics was greater than 1, which further revealed the potential risk of the water samples. These findings suggest that cement production activities and associated plastic handling practices, such as packaging degradation, plastic additives, and waste management practices, may contribute to microplastic inputs into the surrounding groundwater. Mitigation strategies should therefore include plastic packaging recycling, substitution of fiber-based additives, improved stormwater and waste management, and routine groundwater monitoring. However, the study is limited by the use of pooled-site FTIR analysis, which prevents particle-specific polymer distribution assessment, and by the absence of supporting meteorological and hydrogeological data, indicating the need for future studies incorporating individual particle polymer identification and exposure-based health risk assessment.
-
The authors confirm their contributions to the paper as follows: Tajudeen Olanrewaju Yahaya: conceptualization, original draft preparation, writing—review and editing; Faidat Onozasi Abdulrahaman: data acquisition, analysis, and supervision; Mutiyat Kehinde Adewale: writing—review and editing, software, and visualization; Odunlade Albert Kolawole: data curation and validation; Abdulrazaq Izuafa: writing and editing; Jamilu Bala Danjuma: investigation, analysis, methodologies. All authors reviewed the results and approved the final version of the manuscript.
-
The authors received no financial support for the research, authorship, and/or publication of this article.
-
The authors declare that they have no known competing financial interests or personal relationships that could have appeared to influence the work reported in this paper.
-
Full list of author information is available at the end of the article.
- Copyright: © 2026 by the author(s). Published by Maximum Academic Press, Fayetteville, GA. This article is an open access article distributed under Creative Commons Attribution License (CC BY 4.0), visit https://creativecommons.org/licenses/by/4.0/.
-
About this article
Cite this article
Yahaya TO, Abdulrahaman FO, Adewale MK, Kolawole OA, Izuafa A, et al. 2026. Cement production as a source of groundwater microplastic pollution: occurrence, characteristics, and health risks in Sokoto, Nigeria. New Contaminants 2: e014 doi: 10.48130/newcontam-0026-0011 

Cement production as a source of groundwater microplastic pollution: occurrence, characteristics, and health risks in Sokoto, Nigeria
- Received: 09 February 2026
- Revised: 28 March 2026
- Accepted: 10 April 2026
- Published online: 29 April 2026
Abstract: Groundwater pollution has been investigated in various environments; however, limited studies have focused on microplastic contamination of groundwater surrounding cement production facilities. The current study aimed to quantify, characterize, and determine the associated health risks of microplastics in borehole water around the Sokoto Cement Factory, Nigeria. Samples of borehole water were obtained from all axes of the factory, following standard protocols. Microplastics were extracted by filtration using glass fiber filter papers, chemically digested, and analyzed using microscopy and spectroscopic techniques to determine their abundance, sizes, shapes, colors, and polymer compositions. Associated health risks of the detected microplastics were estimated using the pollution load index (PLI) and polymer risk index (PRI). Microplastic concentrations ranged from 150 ± 10 items/L in the western axis to 460 ± 20 items/L in the northern axis. The dominant shapes identified were fibers, microfilms, microbeads, and foams, while the most abundant polymers were polyethylene (PE), polyethylene terephthalate (PET), polyvinyl chloride (PVC), polypropylene (PP), and nylon (NY). Most microplastics were transparent or white, and were predominantly within the 500–1,000 µm and 100–500 µm size fractions. All detected polymers were classified under very high risk (risk level IV), with NY posing the highest risk. In addition, samples from all axes recorded PLI values greater than 1, indicating significant contamination of the groundwater. Conclusively, cement production activities may be a source of microplastic pollution in groundwater and could pose potential health risks to consumers. Reducing the use of microplastic-containing materials and strengthening waste management practices are therefore recommended.
-
Key words:
- Cement factory /
- Fibers /
- Microplastics /
- Polymer-hazard /
- Polyethylene (PE)