












-
Chrysanthemum (Chrysanthemum × morifolium Ramat.) is a traditional Chinese flower with cultural significance, ornamental value, and economic importance[1,2]. Flower change is not only correlated with pollinator behavior but also serves to improve the ornamental value. However, most chrysanthemum cultivars exhibit flower fading during the post-flowering stage, which has become a key bottleneck restricting the industrial development of chrysanthemums[3,4]. In contrast, only a few of the chrysanthemum cultivars show deepening of flower color during the post-flowering stage. The molecular regulatory mechanism of flower color change in chrysanthemum remains poorly understood and requires targeted research.
The flower color change during senescence is primarily driven by the dynamic changes in anthocyanin metabolism. Variations in pigment composition and content directly determine the flower color change[5,6]. Studies have shown that flower fading in some species is caused by the inhibition of anthocyanin biosynthesis or the acceleration of its degradation, such as in Brunfelsia latifolia[7], Michelia crassipes[8], and Paeonia lactiflora[9]. The flower color change from white to pink in Oenothera tetraptera is caused by the increase of anthocyanin content, particularly cyanidin-3-glucoside (Cy3G) and isosorbide glycoside[10]. The flower color change of Oenothera laciniata and Oenothera stricta follows a comparable pattern. The deepening orange-red color of Lonicera tellmanniana petals is associated with the content changes in two cyanidin glycosides and two peonidin glycosides[11]. Previous studies have demonstrated that anthocyanin glycosides are synthesized from phenylalanine through catalysis by phenylalanine ammonia-lyase (PAL), chalcone synthase (CHS), chalcone isomerase (CHI), flavanone 3-hydroxylase (F3H), flavonoid 3'-hydroxylase (F3'H), flavonoid 3',5'-hydroxylase (F3'5'H), dihydroflavonol 4-reductase (DFR), and anthocyanidin synthase (ANS)[12,13]. They are modified by flavonoid 3-O-glucosyltransferase (UFGT), other methyltransferases (MT), and acyltransferases (AT), before being transported to vacuoles for coloration[14−16]. The entire process is regulated by the MBW complex formed by the MYB, bHLH, and WD40 transcription factors (TFs)[17−19]. For example, XsMYB113s in Xanthoceras sorbifolium activate XsF3'H and XsANS to promote anthocyanin accumulation at the petal base, causing a color change from yellow to purple[20]. Flower fading in Nelumbo nucifera is associated with the downregulated expression of NnMYB5, NnCHS, NnANS, and NnUFGT[21]. However, regulatory networks vary significantly among species. As an allopolyploid plant, the molecular mechanism underlying flower color change during the post-flowering stage in chrysanthemum has not been fully elucidated.
Recent studies indicate that abscisic acid (ABA) mediates the interplay between senescence signals and anthocyanin glycoside metabolism to regulate flower color[22−24]. Exogenous ABA application can induce anthocyanin accumulation in Vaccinium corymbosum seedlings[25]. LcNAC90 in Litchi chinensis activates anthocyanin biosynthesis in response to ABA[26]. Under salt stress, LrMYB1 in Lycium ruthenicum mediates ABA-dependent anthocyanin accumulation[27]. By comparison, most chrysanthemum research focuses on senescence and flower fading mechanisms. For example, the cut chrysanthemum 'Dante Purple' regulates flower fading via the sucrose-CmMYB6/CmMYB#7 pathway[28]. Whereas 'Nannong Fencui'[29] and 'Anastasia Pink'[30] suppress CmANS and CmDFR expression through CmMYB3-like or CmMYB21 to reduce anthocyanin synthesis. Only Wang et al.[31] found that CmNAC25 activates CmMYB6/CmDFR to regulate anthocyanin biosynthesis during the post-flowering stage in 'Arctic Queen'. Despite these advances, the underlying molecular regulatory network remains poorly understood, especially the specific role of the ABA signaling pathway in flower color change during the post-flowering stage.
This study identified a unique chrysanthemum cultivar 'f23'. Its flower color changes significantly from white to reddish-purple during the post-flowering stage, with obvious differences in pigment changes between inner and outer ray florets. This cultivar, therefore, represents an ideal material for exploring the molecular mechanisms of flower color change (with deepening flower color) during the post-flowering stage. In this study, we performed HPLC to analyze the dynamic changes of anthocyanin glycosides and flavonoids in inner and outer ray florets of 'f23' throughout the whole flowering process (S1–S7). Combined with transcriptomic analysis, we identified transcription factors and anthocyanin biosynthetic genes involved in flower color change during the post-flowering stage. Focusing on the ABA signal transduction gene CmSnRK2.6, we analyzed its sequence characteristics, phylogenetic relationships, subcellular localization, and protein–protein interaction with CmbHLH2.1. Meanwhile, preliminary functional verification of CmSnRK2.6 was conducted via ectopic overexpression in tobacco. The study aims to clarify the molecular mechanism of flower color change during the post-flowering stage in chrysanthemum, and provide insights into the theoretical framework for flower color change in other ornamental plants.
-
The chrysanthemum cultivar 'f23' used in this study was obtained from the Chrysanthemum Resource Garden of Beijing Forestry University. Its capitulum development was divided into seven stages (S1−S7): pre-bud burst stage (S1, ray florets fully protruding from involucres but not expanded, all curved inward), late bud burst stage (S2, outer ray florets erect but not expanded), initial bloom (S3, outer 1–2 whorls of ray florets expanded), middle bloom stage (S4, outer 3–5 whorls of ray florets expanded), final bloom stage (S5, outer 6–8 whorls of ray florets fully expanded, inner tubular florets fully open), early post-flowering stage (S6, ray and tubular florets fully expanded, inner ray florets white, outer ray florets turning reddish-purple), and late post-flowering stage (S7, ray and tubular florets fully expanded, both inner and outer ray florets turning reddish-purple). Inner ray florets (IR) at each stage were denoted as IR1–IR7, and outer ray florets (OR) as OR1–OR7 (Fig. 1a, b).
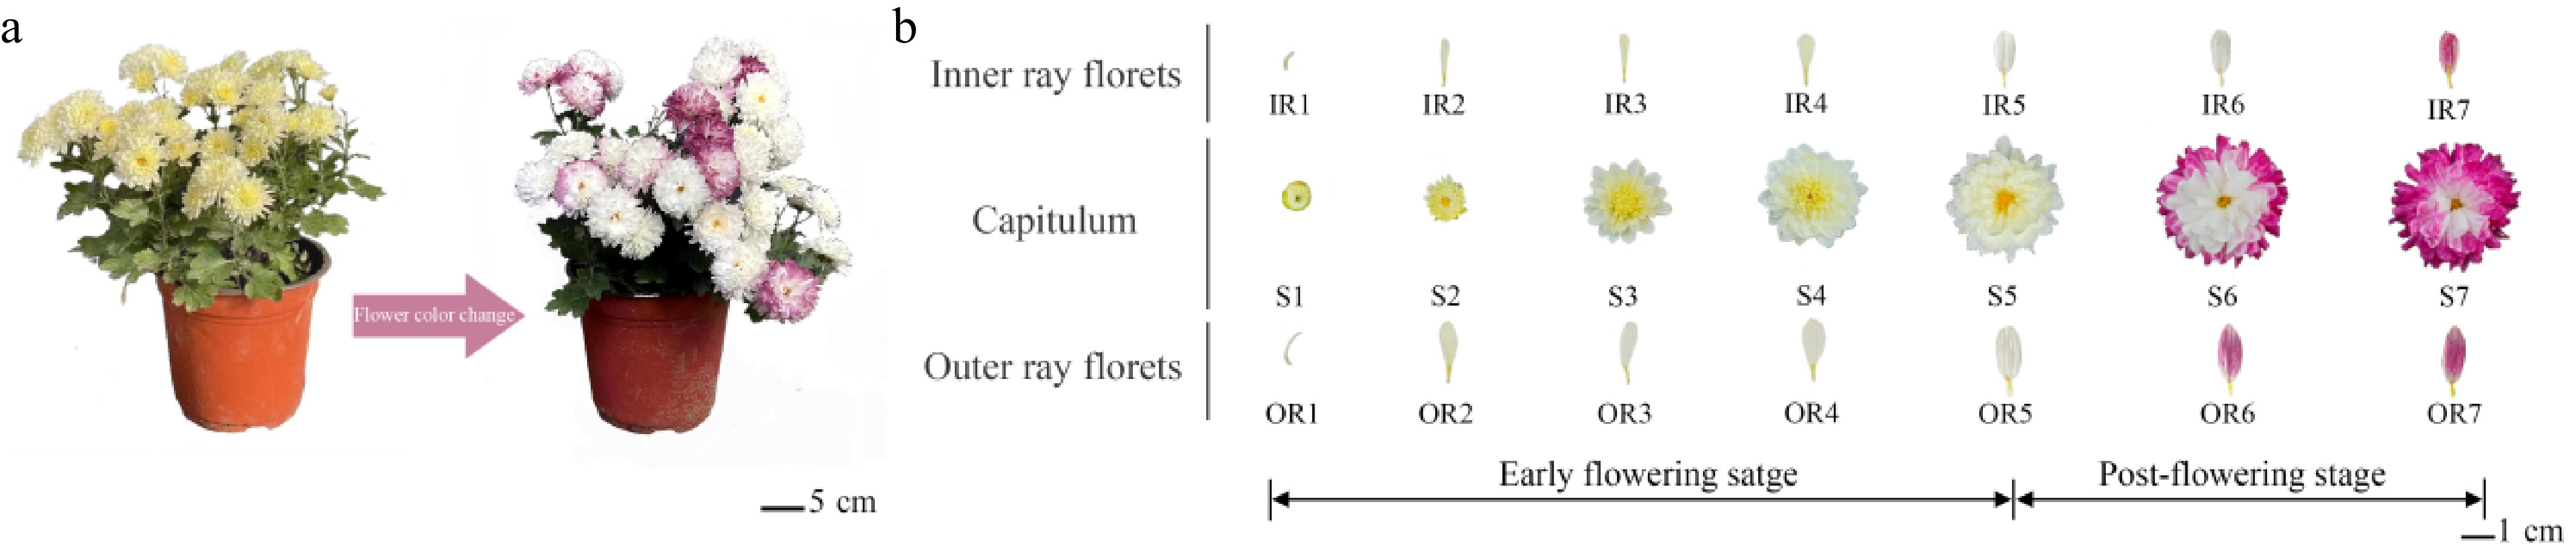
Figure 1.
The flower color change of cultivar chrysanthemum 'f23'. (a) The whole plants of 'f23' during flower phases (top view). (b) Flower color changes of inner and outer ray florets at different developmental stages in 'f23'.
Experiments were conducted from November 2022 to June 2025 at the Beijing Key Laboratory of Ornamental Plants Germplasm Innovation and Molecular Breeding (Beijing, China), National Engineering Research Center for Floriculture (Beijing, China), and School of Landscape Architecture, Beijing Forestry University (Beijing, China). To ensure the consistency of experimental materials, ray florets of chrysanthemum 'f23' were collected under the same growth conditions. Petals were harvested from three individual plants of chrysanthemum 'f23' at each developmental stage, respectively, and mixed as one biological replicate. Three biological replicates were prepared. Tobacco plants were cultivated in growth chambers under consistent long-day conditions (16-h light/8-h dark) and used for transient expression assays at 4 weeks post-germination. All samples were quickly frozen in liquid nitrogen and stored at −80 °C.
Determination of anthocyanin and accessory pigments
-
Approximately 0.1 g of ray florets from each sample was weighed and ground into powder in liquid nitrogen. One mL of extraction solution was added (methanol : double-distilled water : formic acid : trifluoroacetic acid = 70:27:2:1, v/v/v/v) at 4 °C, and shaken once every 6 h, for 24 h. Subsequently, the extract was filtered through a 0.22 μm nylon membrane, and the supernatant was collected for determination. Each sample was extracted three times. A Tu-1901 double-beam UV-visible spectrophotometer (Persee, Beijing, China) was used for scanning in the ranges of 220–700 nm and 400–500 nm to initially identify pigment components in the ray floret samples. HPLC analysis was performed using an Agilent 1100 liquid chromatograph (Agilent Technologies Inc., La Jolla, CA, USA). The column temperature was 35 °C, and the injection volume was 10 μL. Each sample was repeated three times, and chromatographic peak values were read at 350 nm (for accessory pigments), and 525 nm (for anthocyanin). The standard preparation method referred to Sun et al.[32], and the quantitative analysis method referred to Lin & Harnly[33].
Sample preparation, transcriptome sequencing, and DEGs analysis
-
Total RNA was extracted from inner and outer ray florets of 'f23' at capitulum development stages S5 to S7 using an RNA extraction kit (Vazyme, Nanjing, China) for RNA-seq. Each sample had three biological replicates. Eighteen 'f23' cDNA libraries were constructed from these samples and sequenced on the Illumina HiSeq2500 platform (Gene Denovo, Guangzhou, China). After quality control with fastp, high-quality clean reads were aligned to the C. morifolium reference genome (
https://doi.org/10.6084/m9.figshare.21655364 ) using HISAT2 (v2.1.0)[34] with alignment rates > 85%, and the filtered reads were further assembled with Trinity (v2.15.1)[35]. Blastx was used to align assembled sequences to the KEGG protein databases (e-value < 0.00001) to obtain functional annotation information. RSEM[36] was used to calculate gene expression levels in each sample. Poisson Dis[37] was used for DEGs analysis with parameters set to FDR-adjusted ≤ 0.05 and |LOG2FC| ≥ 1. To identify the expression trends of DEGs in all analyzed samples, we used the K-means clustering approach[38]. A total of 19,911 genes (with FPKM ≥ 1) were utilized for analysis. First, the sum of the squared error (SSE) estimation was used to determine the optimal number of clusters. The expression value of these genes was then scaled and centered to fit into the range (−3.0 to 3.0) and subjected to the K-means clustering procedure. Subsequently, the correlation of each gene from the clusters with cluster centroid (cluster core) values was calculated. Genes with correlation scores below 0.8 were filtered out. The results were visualized using the R packages pheatmap and ggplot2[39].Weighted gene co-expression network analysis (WGCNA)
-
Genes with FPKM ≥ 1 in the transcriptome of 'f23' ray florets were selected for WGCNA[40]. First, a gene co-expression network was constructed using weighted gene expression correlations. Hierarchical clustering analysis was performed based on weighted correlations, and clustering results were divided according to set criteria to obtain different gene modules. Hierarchical clustering was performed using the topological overlap matrix, and modules were delineated using the dynamic tree-cutting algorithm with a binary eigengene-based approach to define module boundaries. Each module was assigned a unique color and represented as a branch in the dendrogram. Module-trait associations were assessed by correlating module eigengenes with anthocyanin content across samples, enabling the identification of modules significantly associated with pigment biosynthesis. Cytoscape software was used to analyze the interaction network of genes in related modules to screen genes with high connectivity in the regulatory network. TBtools software was used for heatmap analysis for the expression patterns of key candidate genes.
Quantitative real-time polymerase chain reaction (qRT-PCR) analysis
-
qRT-PCR technology was used to analyze the expression patterns of candidate genes in ray florets at different flowering stages. A plant RNA rapid extraction kit (Huayueyang Biotechnology Co., Ltd., Beijing, China) was used to extract total RNA from all samples. qPCR was performed using a CFX Connect PCR instrument (Bio-Rad, USA) with reaction conditions: 95 °C pre-denaturation for 30 s, 95 °C denaturation for 5 s, annealing for 30 s, 72 °C extension for 30 s, and then increasing by 0.5 °C every 5 s within the range of 65–95 °C. After 40 cycles, the melting curve was recorded. CmPP2A was used as the reference gene, and gene expression levels were determined using the 2−ΔΔCᴛ method[41]. Each sample had three biological replicates and three technical replicates. Primer sequences are shown in Supplementary Table S1.
Phylogenetic and conserved domain analysis of CmSnRK2.6 and CmbHLH2.1
-
Homologs of CmSnRK2 were identified by BLAST (v2.15) with an e-value cutoff of 1e−5 against the constructed protein database. The protein sequences in the constructed protein database include the genomic protein of chrysanthemum (
https://cgd.njau.edu.cn ), Arabidopsis (https://phytozome.jgi ), rice (https://phytozome.jgi ), and the assembled protein sequences of the 'f23' transcriptome. Then, the multiple sequence alignments and phylogenetic relationships of SnRK2 proteins were analyzed using DNAMAN 7.0 and MEGA 11.0 software. The neighbor-joining phylogenetic tree was constructed in MEGA 11.0 with 1,000 bootstrap replicates to assess node reliability. The same method was used to construct an unrooted tree of protein sequences of CmSNRK2.6 and its homologous genes from 14 other species. To identify conserved motifs of the CmSNRK2.6 protein, the MEME online tool (https://meme.sdsc.edu/meme/intro.html ) was first used for conserved motif prediction. Then, the Pfam database (https://pfam.xfam.org ) was used to check whether all obtained SnRK2 amino acid sequences contained SnRK2 family domains.Similarly, the Arabidopsis thaliana genome and transcriptome-assembled proteins of 'f23' were used to screen for bHLH family proteins. DNAMAN 7.0 and MEGA 11.0 software were employed to analyze the multiple sequence alignment and phylogenetic relationships of bHLH proteins. The same method was adopted to construct an unrooted phylogenetic tree based on the protein sequences of CmbHLH2.1 and its homologous genes from ten other plant species.
Subcellular localization
-
The CDS of CmSnRK2.6 and CmbHLH2.1 was cloned into the pBI121-GFP vector. Plasmids containing pBI121-GFP and pBI121-CmSnRK2.6-GFP were transformed into Agrobacterium tumefaciens GV3101, which was then used to infect tobacco leaves. Three days after inoculation, GFP (green fluorescent protein) signals were detected using a Leica TCS SP8 confocal microscope (Leica, Wetzlar, Germany).
Yeast two-hybrid (Y2H) assay
-
The CDSs of CmSnRK2.6 and CmbHLH1.1, CmbHLH2.1, CmbHLH147-like, CmMYB2.1, and CmPHL7 were individually cloned into the pGADT7 and pGBKT7 vectors via homologous recombination. The pGBKT7-53/pGADT7-T and pGBKT7-lam/pGADT7-T served as the positive and negative controls, respectively. All bait constructs were first tested for autoactivation. Recombinant pGBKT7 plasmids were co-transformed with the empty pGADT7 vector into Y2H Gold yeast cells, which were then incubated on DDO (SD/-Leu/-Trp) and QDO (SD/-Leu/-Trp/-His/-Ade) plates at 30 °C for 3 d to observe colony growth. After ruling out bait autoactivation, pairwise Y2H interaction assays were initiated. Pairs of pGBKT7 and pGADT7 recombinant constructs were co-transformed into Y2H Gold cells and cultivated on DDO plates for 3 d. Well-grown yeast colonies were serially diluted into four gradients and spotted onto QDO plates. The physical interactions between the tested proteins were determined based on the growth status of yeast.
Yeast one-hybrid (Y1H) assay
-
The promoter regions of CmCHI, CmCHS, CmF3H, CmANS, and CmDFR were cloned into the pAbAi vector to generate bait constructs, and the CDS of CmbHLH2.1 was inserted into the pGADT7 vector to generate the prey construct. The resulting bait vectors were linearized and transformed into Y1H Gold yeast cells to obtain bait strains. Prior to prey vector transformation, the minimum inhibitory concentration of Aureobasidin A (AbA) for each bait strain was determined to define the optimal screening stringency. Subsequently, competent yeast cells were prepared for each bait strain and separately transformed with the empty pGADT7 vector (serving as the negative control) and prey construct. The transformed cells were spread onto SD/-Leu plates and incubated at 30 °C for 3 d. Single colonies were picked, serially diluted to four gradients, and spotted onto SD/-Leu plates supplemented with the optimal AbA concentration. Yeast colony growth was then observed to verify the binding of the target protein to these promoters.
Dual-luciferase activity assays
-
The CmDFR promoter fragment and CmbHLH2.1 CDS were cloned into pGreenII 0800-LUC and pGreenII 62-SK vectors to generate reporter and effector constructs, respectively. The recombinant plasmids were transformed into Agrobacterium tumefaciens GV3101 (pSoup). Agrobacterium cultures containing CmDFRpro-LUC plus empty SK (control) or CmDFRpro-LUC plus CmbHLH2.1-SK were mixed at a 1:1 ratio to infect tobacco leaves. After 72 h, LUC fluorescence was detected using an in vivo imaging system. Subsequently, the infiltrated leaf tissues were fully ground, and the luciferase activities were determined using the Dual Luciferase Reporter Assay Kit (Vazyme, Nanjing, China) according to the manufacturer's protocol. The firefly luciferase (LUC) and Renilla luciferase (REN) activities were measured with a multimode microplate reader, and the relative transcriptional activity was calculated as the ratio of LUC to REN.
-
The continuous 3-year observations (October 11–24, 2022; October 16–31, 2023; and October 20–November 11, 2024) of the cultivated chrysanthemum 'f23' showed that 'f23' had pale-yellow or white flowers in the early flowering stage. The color of ray florets gradually deepened from the outer to the inner whorls with flower aging. CIEL*a*b* measurements showed that the lightness of the inner and outer ray florets remained stable during the flowering phase, but decreased significantly during the post-flowering stage in chrysanthemum 'f23'. Yellowness b* declined continuously, while redness a* increased markedly, consistent with the darkening of flower color. At the S7 developmental stage, L*, a*, and b* color coordinates were determined separately for the inner and outer ray florets of chrysanthemum capitula (Supplementary Fig. S1). These values were subsequently converted to the Munsell Color System (HVC). The inner and outer ray florets corresponded to 10RP 5/14 and 5RP 5/11, respectively, which represent the ISCC-NBS color designations Strong reddish purple and Reddish purple. Visual comparison with the Royal Horticultural Society (RHS) Colour Chart assigned the overall floret color at S7 to the Red-Purple Group (code N66B), indicative of a typical reddish-purple color phenotype (Fig. 1a, Supplementary Fig. S1).
As shown in Fig. 1b, among the seven stages of 'f23' capitulum development, stages S1–S5 represent the early flowering stages, with flower color appearing pale yellow or white (Fig. 1b). During the post-flowering stage (S6–S7), the flower color begins to deepen. These observations confirm 'f23' is a unique chrysanthemum germplasm that showed flower color deepening during the post-flowering stage (Fig. 1a).
Anthocyanin accumulation leads to reddish-purple flower color of chrysanthemum 'f23' during the post-flowering stage
-
Petals from chrysanthemum 'f23' stages S1–S7 were sampled for pigment composition and quantitative analysis. HPLC detection showed two main absorption peaks at 525 nm (anthocyanin detection wavelength), and eight absorption peaks at 350 nm (accessory pigment detection wavelength) (Fig. 2a, b). Combining retention time, maximum absorption wavelength, and positive ion mode mass spectrometry information, two anthocyanin glycosides were identified: cyanidin-3-O-(6''-O-malonyl-glucoside) and cyanidin-3-O-(3'',6''-O-dimalonyl-glucoside). Accessory pigments included three phenolic acids and five flavonoid derivatives (e.g., luteolin glycoside, apigenin glycoside, diosmetin glycoside) (Fig. 2b). Quantitative pigment results showed no anthocyanin accumulation in the early flowering stage (S1–S5). Anthocyanins began to accumulate in outer ray florets at S6, and both inner and outer ray florets showed significantly increased accumulation at S7 (Supplementary Fig. S2a), with outer ray florets having significantly higher levels than inner ray florets (Fig. 2c). This pattern of anthocyanin content change was consistent with the pattern of capitulum color change. Flavonoids accumulated throughout the flowering period, with generally higher content in inner ray florets than in outer ray florets, and higher content during the early flowering stages (S1–S4) than during the post-flowering stage (S6–S7) (no significant difference was observed among the samples) (Fig. 2d, Supplementary Fig. S2b). These results indicate that 'f23' only accumulates accessory pigments (such as flavonoids) in early flowering, resulting in a pale-yellow or white color. During the post-flowering stage, the relative content of flavonoid decreases while anthocyanin specifically accumulates, driving the flower color deepening (Fig. 2e, f).
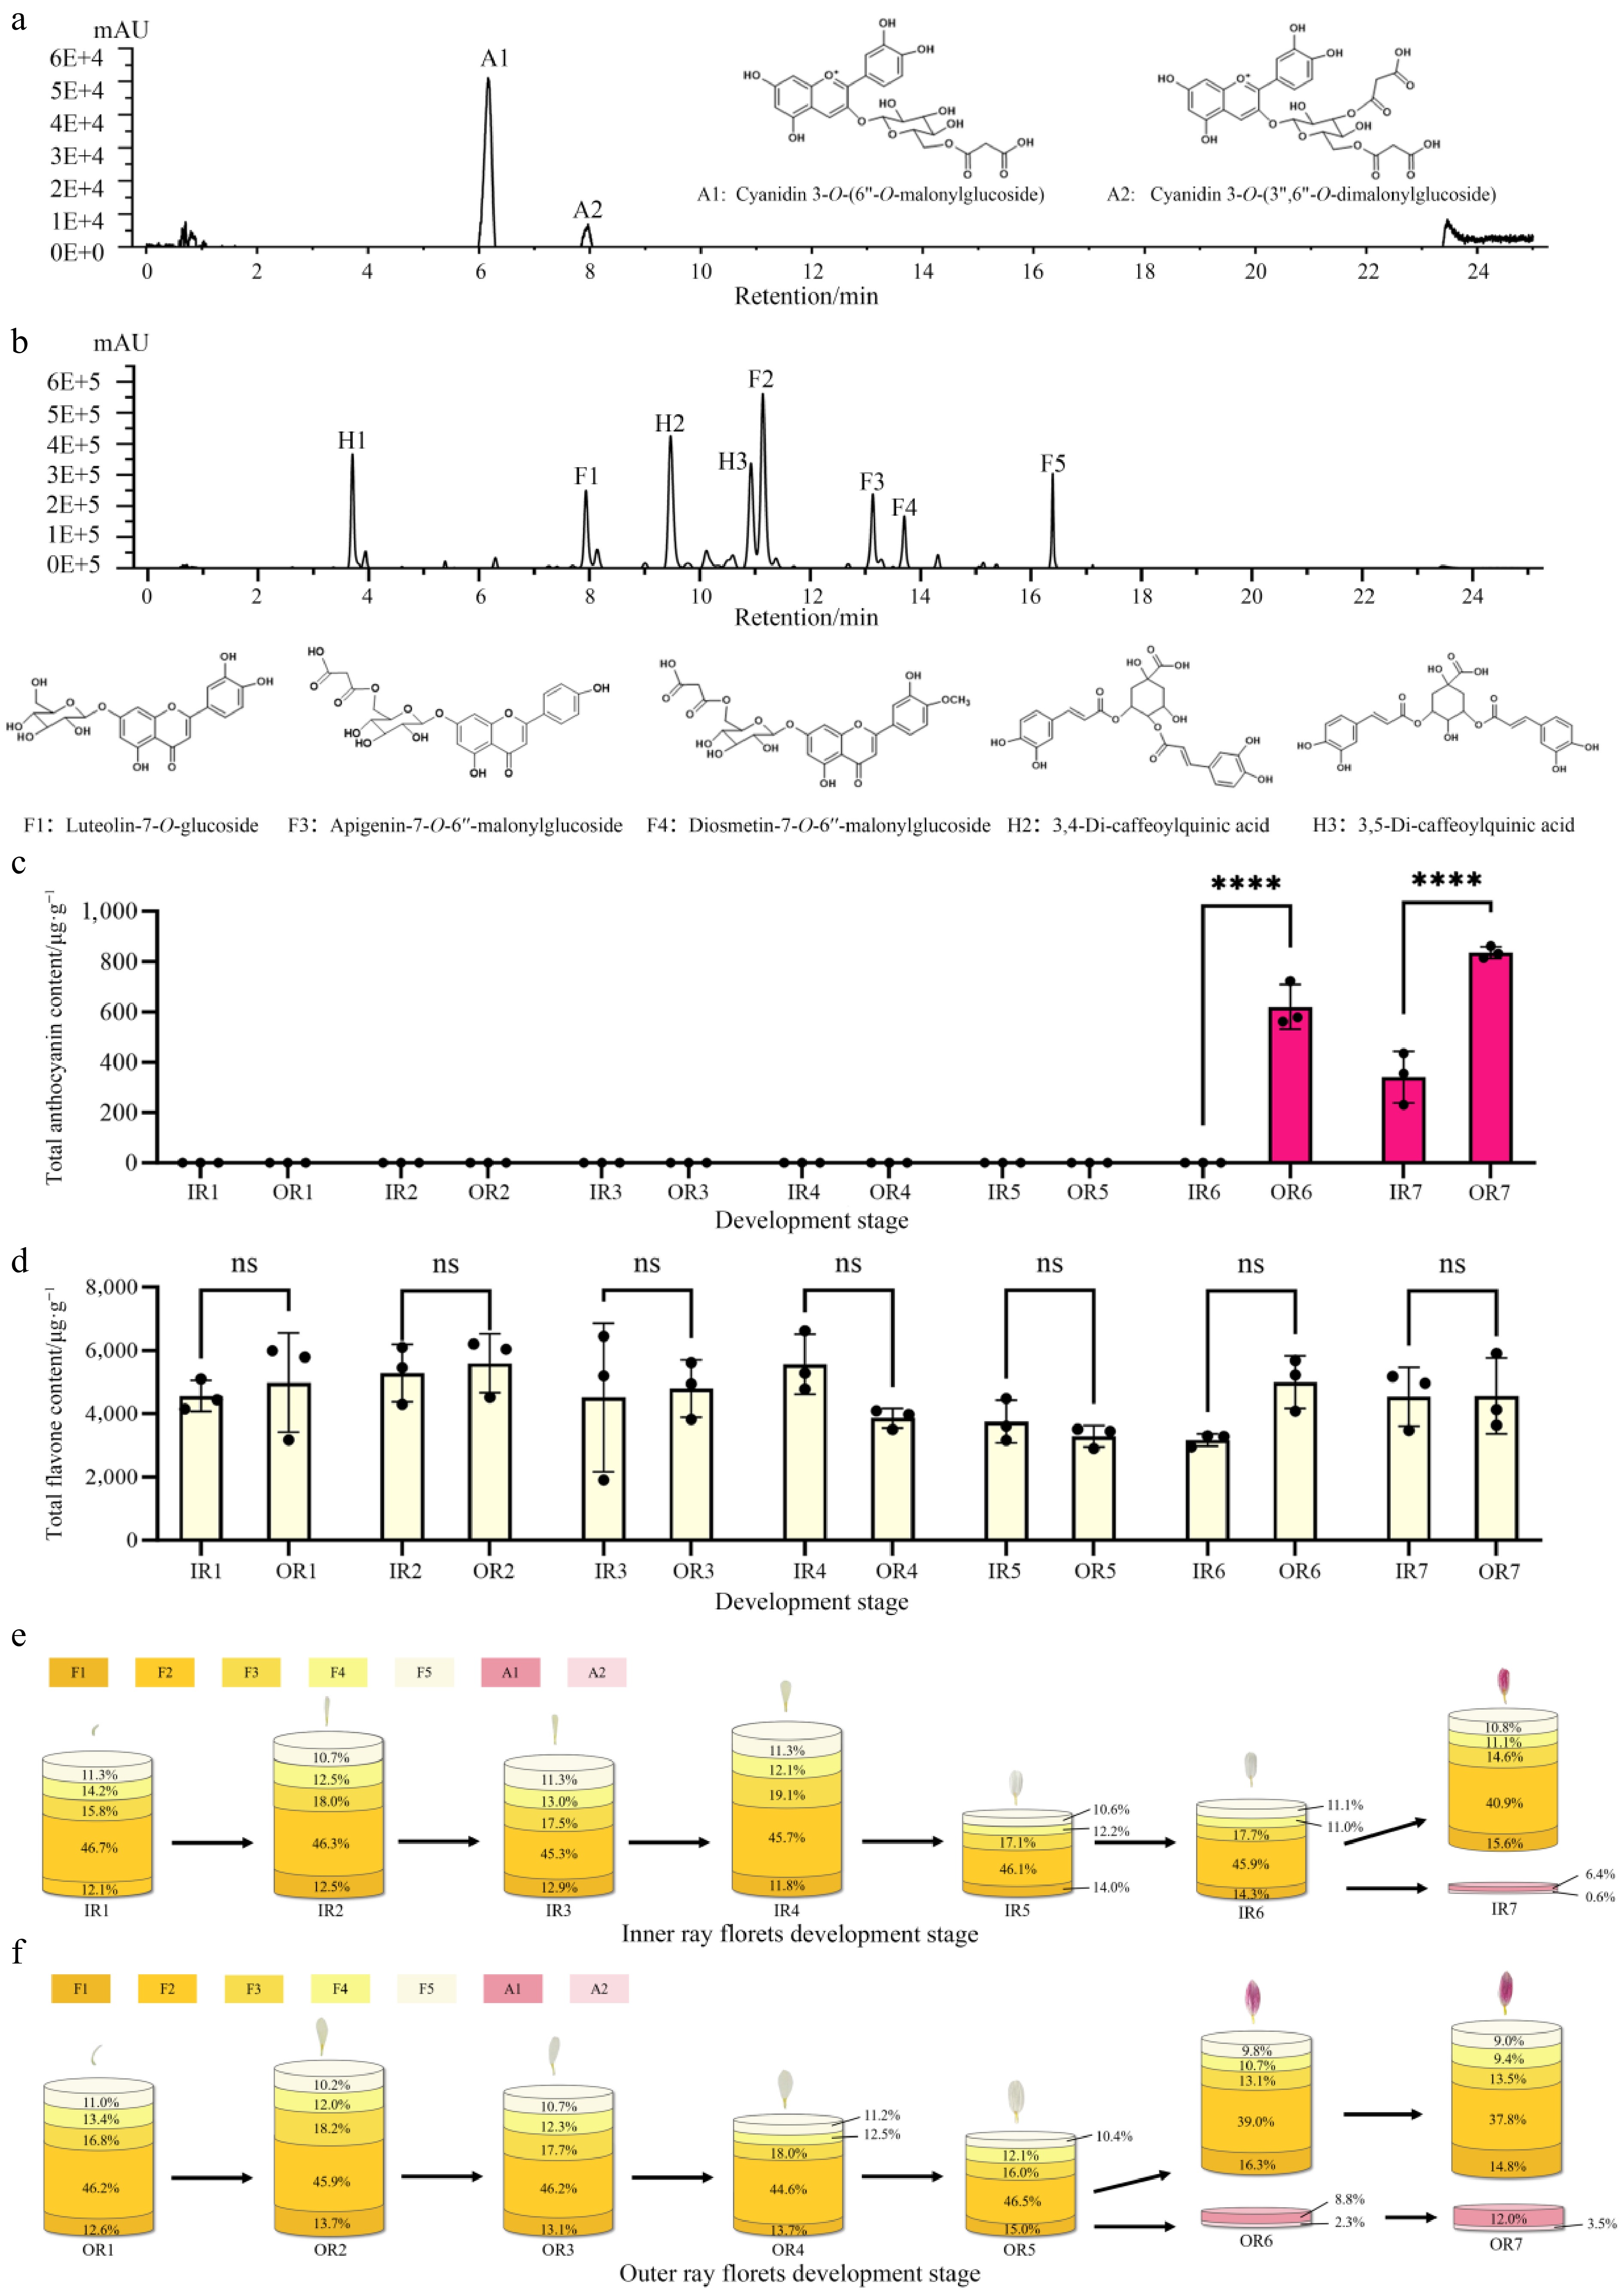
Figure 2.
Qualitative and quantitative analysis of ray floret pigments in 'f23'. (a) HPLC identification of anthocyanin glycoside components. (b) HPLC identification of accessory pigment components. (c) Anthocyanin content in inner and outer ray florets across seven capitulum developmental stages; **** p < 0.0001. (d) Total flavonoid content in inner and outer ray florets across seven capitulum developmental stages, ns = no significant difference. (e) Metabolic flux of anthocyanin and flavonoid contents in inner ray florets across seven stages. (f) Metabolic flux of anthocyanin and flavonoid contents in outer ray florets across seven stages.
Screening of DEGs involved in flower color change during the post-flowering stage
-
To elucidate the molecular mechanism of flower color changes in 'f23' flowers, transcriptome sequencing was performed using inner and outer ray florets at stages S5, S6, and S7. Analysis of stage-specific heatmaps and DEGs screening identified 2,473 genes differentially expressed in 'f23' ray florets across different flowering stages (|Log2FC| ≥ 1, Log10FPKM ≥ 1) (Fig. 3a, Supplementary Fig. S3a). KEGG pathway enrichment analysis revealed that these DEGs were significantly enriched in the 'Global and overview maps' category (Fig. 3b). UPSET analysis of DEGs screened via volcano plots showed that the OR5 vs. OR7 group had the highest number of DEGs (1,282), including 240 upregulated and 1,042 downregulated genes. The OR5 vs. OR6 group had the fewest DEGs (241), including 122 upregulated and 119 downregulated genes (Fig. 3c, Supplementary Fig. S3b). DEGs in the IR5 vs. IR7, IR6 vs. IR7, OR5 vs. OR6, and OR5 vs. OR7 comparisons may be associated with flower color change during the post-flowering stage, with 60 overlapping DEGs across these four groups. Nineteen genes were upregulated, and 41 were downregulated during the post-flowering stage (Supplementary Fig. S4). The upregulated set included the structural gene F3H (evm.TU.scaffold_382.23) from the anthocyanin synthesis pathway, which exhibited increased expression in both inner and outer ray florets during the post-flowering stage (Fig. 3c). Additionally, the MAPKK gene (evm.TU.scaffold_asm16_new.2853), and other upregulated genes with unknown functions (e.g., evm.TU.scaffold_1240.90, evm.TU.scaffold_36.170) may be closely associated with flower color change during the post-flowering stage in 'f23' (Supplementary Fig. S4).
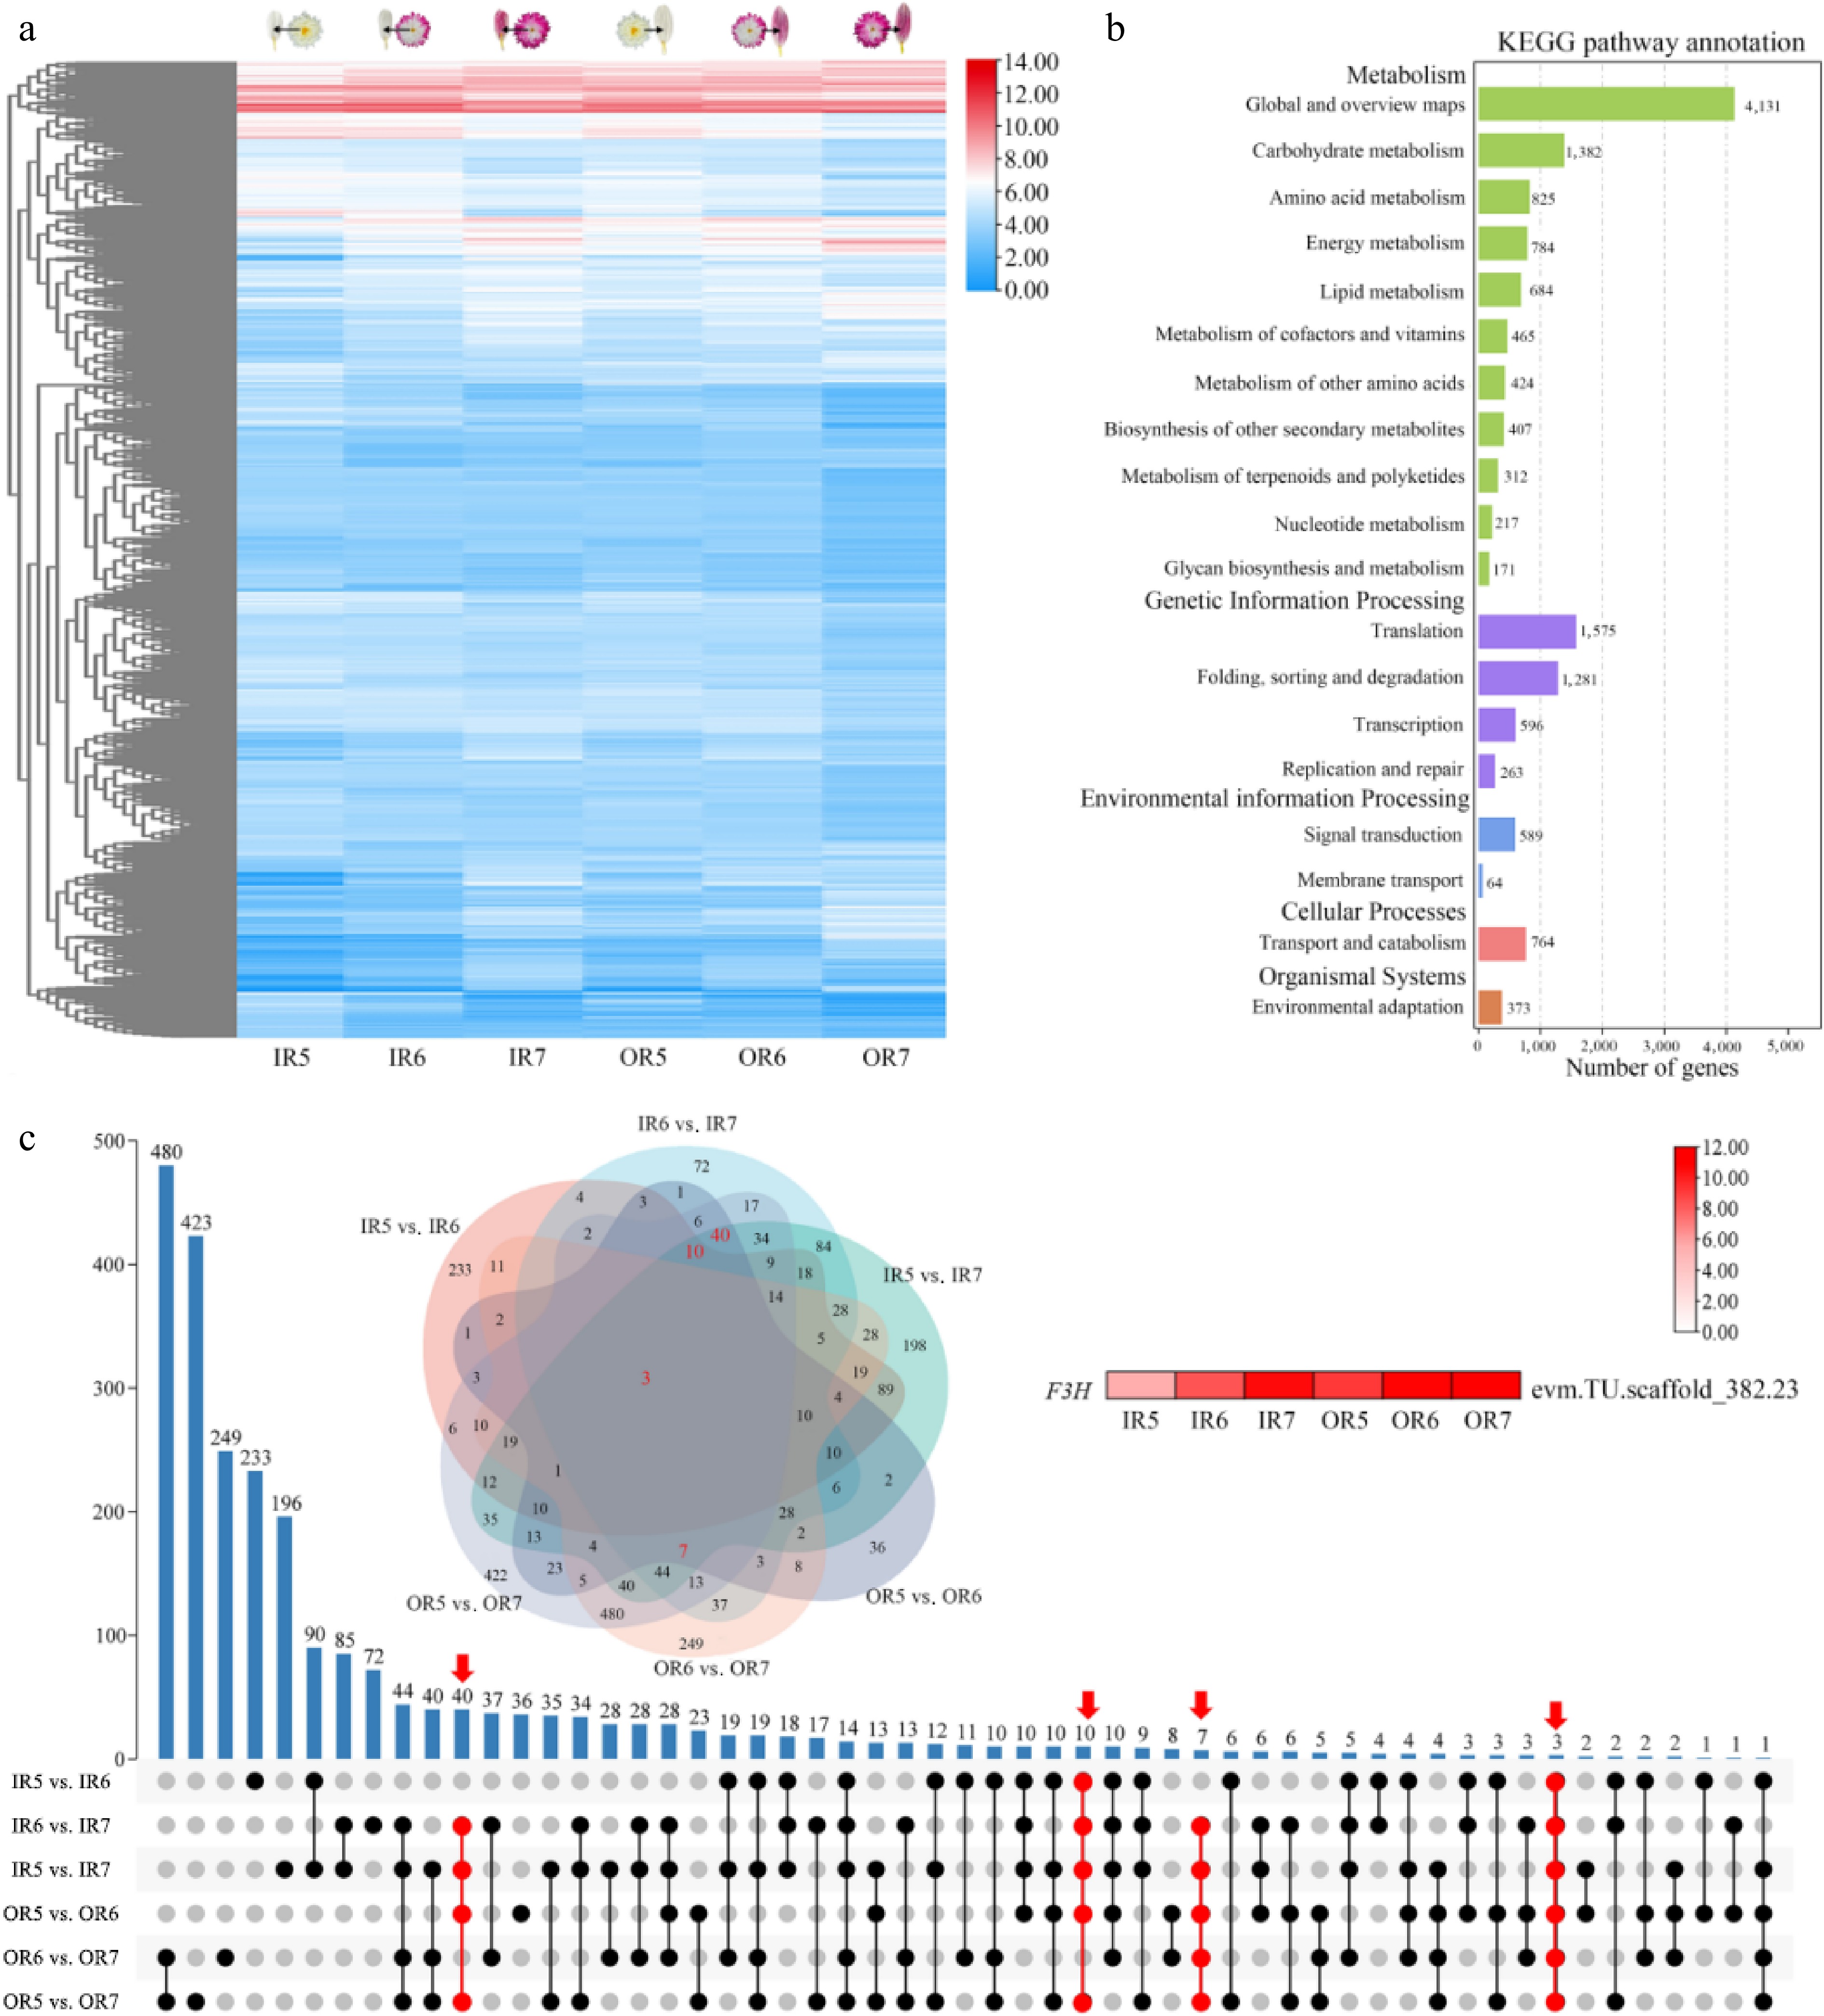
Figure 3.
Screening and functional enrichment analysis of DEGs in inner and outer ray florets during the post-flowering stage in 'f23'. (a) Expression heatmap of DEGs. (b) KEGG enrichment analysis of DEGs. (c) UPSET plot of DEGs.
Co-expression clustering of DEGs involved in flower color change during the post-flowering stage
-
A total of 19,911 DEGs were divided into eight clusters (Supplementary Fig. S5a). Genes grouped in IR-clusters 4, 6, and 7 showed increased expression trends during the post-flowering stage. Those in IR-clusters 6 and 7 were enriched in plant hormone signal transduction, while genes in IR-clusters 4 and 7 were additionally enriched in flavonoid biosynthesis (Supplementary Fig. S5b). Similarly, genes in OR-cluster 2, 3, and 4 were upregulated during the post-flowering stage, with genes grouped into OR-cluster 2 showing significant enrichment in the flavonoid biosynthesis pathway (Supplementary Fig. S5b). Candidate genes were identified to be involved in pathways associated with anthocyanin biosynthesis and plant hormone signal transduction (Fig. 4a). Key anthocyanin biosynthetic genes (CHS, CHI, F3H, F3′H, DFR, ANS, etc.) were continuously upregulated during the post-flowering stage (Fig. 4b). In the ABA pathway, four DEGs were consistently upregulated, including two NCEDs, one PP2C, and one SnRK2, while four others (ZEP, NCED, UGT, and PP2C) were steadily downregulated. Additionally, 12 auxin-related, seven ethylene-related, and five jasmonic acid-related genes were identified as candidate genes involved in flower color change during the post-flowering stage (Supplementary Fig. S6a).
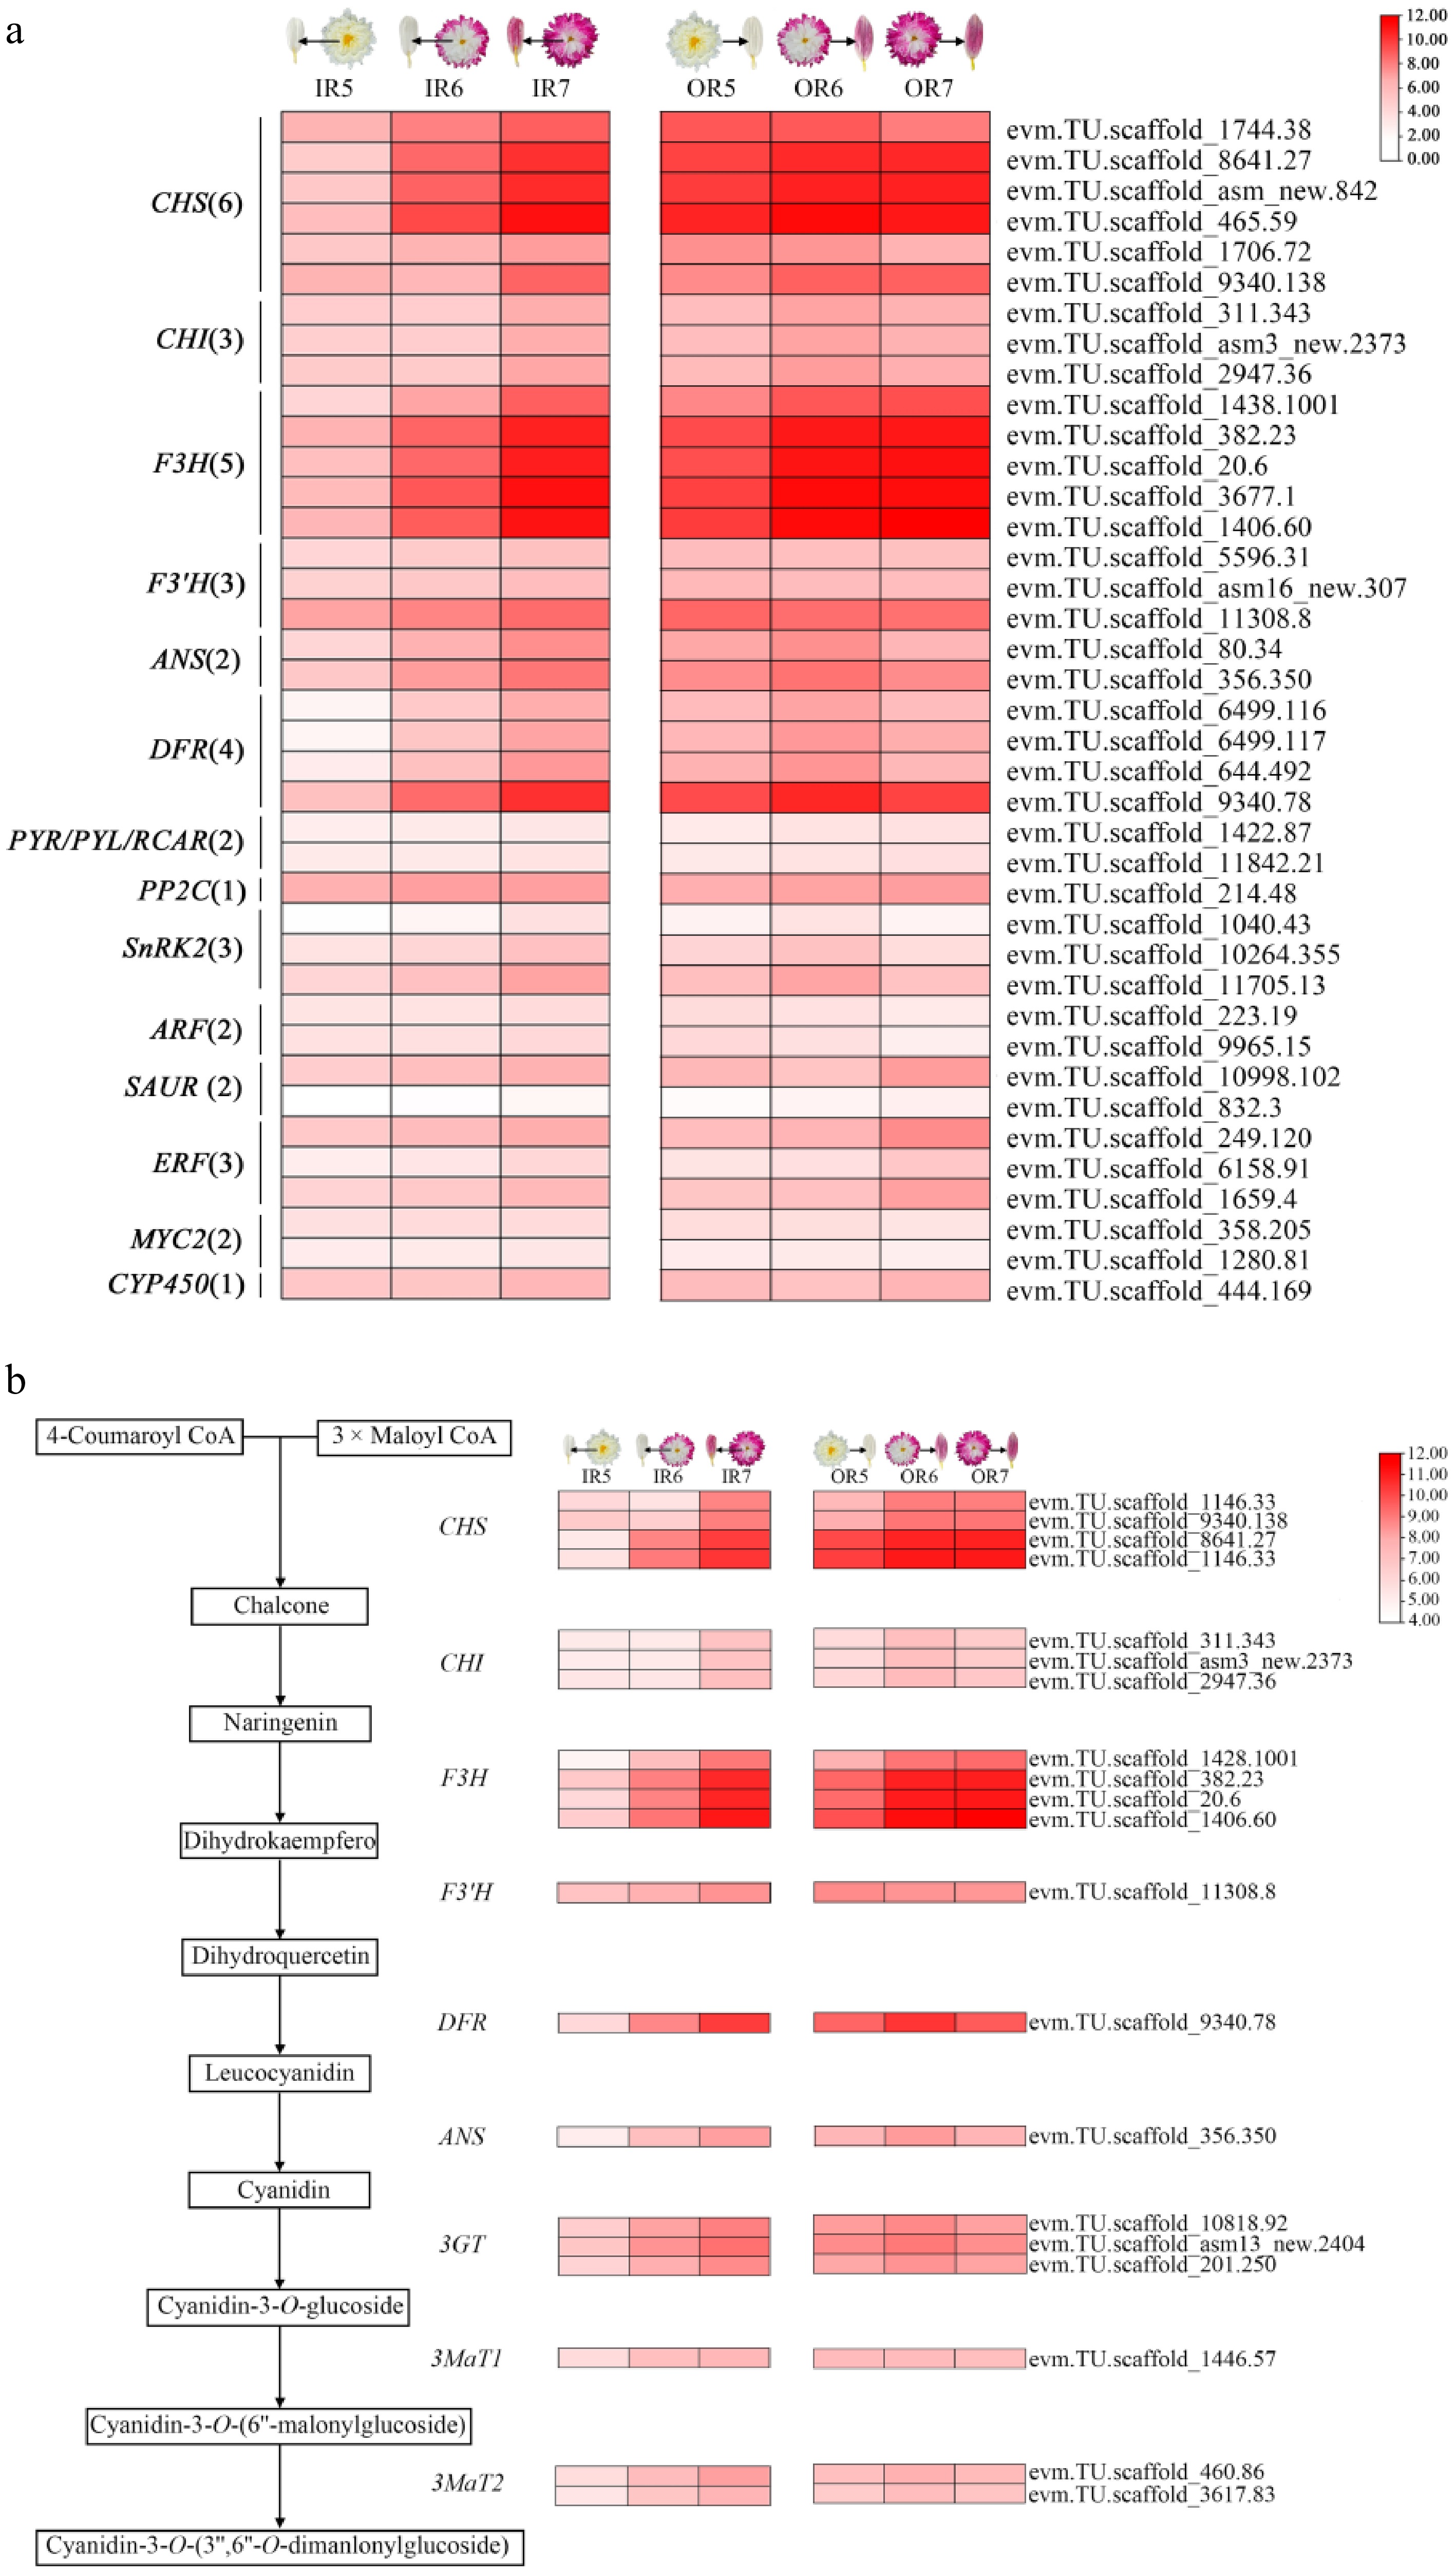
Figure 4.
Screening of DEGs in anthocyanin biosynthesis pathways in inner and outer ray florets during the post-flowering stage in 'f23'. (a) Screening of genes related to flavonoid biosynthesis and plant hormone signal transduction pathways. (b) Heatmap of DEGs in the anthocyanin biosynthesis pathway.
In summary, key anthocyanin biosynthesis structural genes are significantly upregulated during the post-flowering stage in 'f23', promoting anthocyanin accumulation. Many plant hormone-related genes, especially those in the ABA pathway, may contribute to anthocyanin accumulation during the post-flowering stage (Supplementary Fig. S6b).
WGCNA-based identification of hub genes involved in flower color change during the post-flowering stage
-
A total of 19,911 DEGs were clustered into nine gene modules based on WGCNA (Fig. 5a). Considering the significant anthocyanin accumulation in IR7, OR6, and OR7, we further analyzed the gene modules correlated with these samples (Figs. 1b, 2c). The magenta module (1,502 genes) correlated with IR7 (correlation coefficient r = 0.73) and OR6 (r = 0.39), including ANS, 3MaT2, SnRK2, and seven upregulated TFs (Fig. 5b, Supplementary Fig. S7c). The blue module (4,912 genes) showed the highest correlation with OR7 (r = 0.98), identifying ABA3, PP2C, and 13 TFs (nine up, four down) (Fig. 5b, Supplementary Fig. S7c). Notably, the pink module (9,076 genes) exhibited negative or low correlations with key coloration samples (IR7: r = −0.17; OR6: r = −0.15; OR7: r = −0.74). In contrast, it displayed positive correlations with white ray floret samples (IR5: r = 0.73; IR6: r = 0.2; OR5: r = 0.13) (Supplementary Fig. S7b). In the pink module, 21 anthocyanin biosynthetic genes, 15 ABA metabolism structural genes, and 57 TFs were identified as negative regulators of anthocyanin accumulation during the post-flowering stage (Supplementary Fig. S7a, S7b).
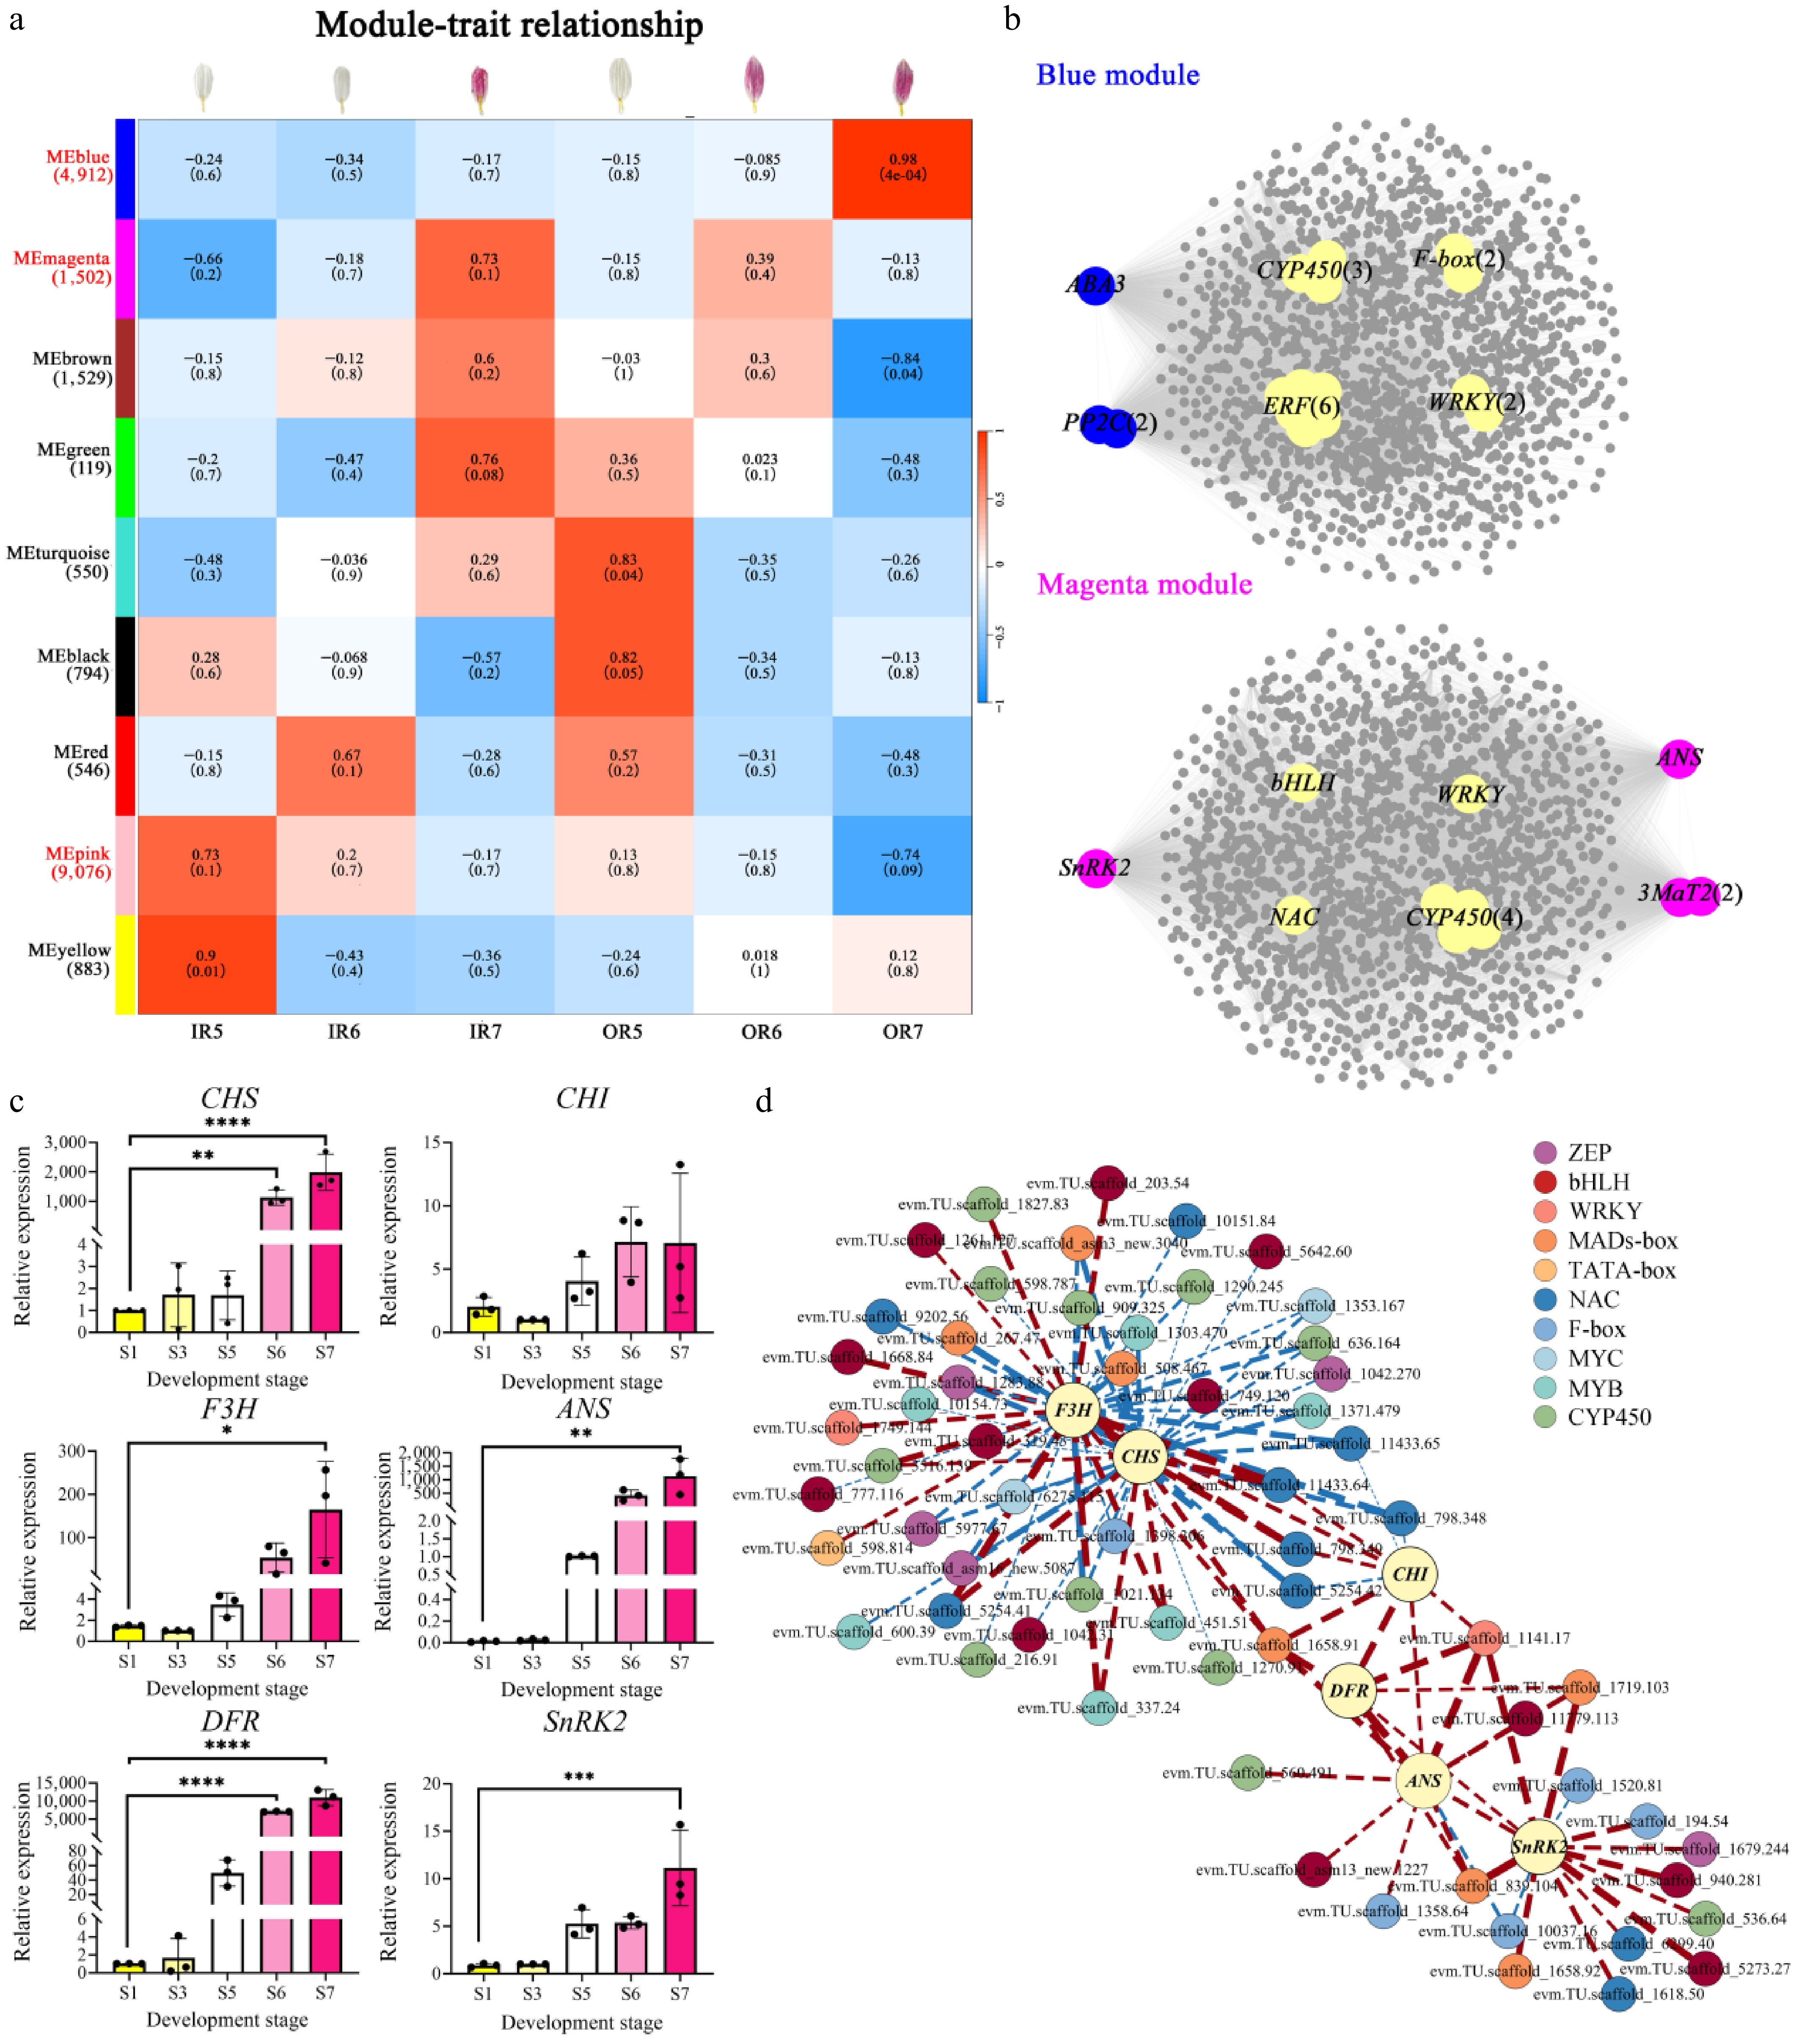
Figure 5.
WGCNA analysis of genes involved in flower color change during the post-flowering stage in 'f23'and validation of key gene expression patterns. (a) Module-trait correlation and corresponding p-values for WGCNA modules in inner and outer ray florets during the post-flowering stage. (b) Co-expression regulatory networks in the blue and magenta modules. (c) The validation of gene expression for key candidate genes by qRT-PCR, ** p < 0.01, *** p < 0.001, **** p < 0.0001. (d) The co-expression network analysis of TFs selected in WGCNA and the six genes screened in the ABA and anthocyanin biosynthesis pathways.
Taken together, five anthocyanin biosynthetic genes (CmCHS, CmCHI, CmANS, CmDFR, and CmF3H) and one ABA-related gene (CmSnRK2.6) were obtained by integrating and analyzing gene sets screened via three methods (Supplementary Fig. S8). qRT-PCR verified the expression pattern of these six genes across 'f23' developmental stages S1, S3, S5, S6, and S7. CmCHS, CmANS, CmDFR, and CmF3H showed upregulated expression (Fig. 5c). While CmCHI had the highest expression at the S6 stage, it also showed an overall upregulated trend (Fig. 5c). These results were consistent with transcriptome data and positively correlated with anthocyanin accumulation. Co-expression analysis revealed potential interactions for these six hub genes with MYB, bHLH, MYC, NAC, WRKY, and other TF families (Fig. 5d).
Functional verification of CmSnRK2.6 in regulating anthocyanin biosynthesis
-
Besides the structural genes and transcription factors known be involved in anthocyanin biosynthesis, CmSnRK2.6, which encodes a core kinase in the ABA signaling pathway, was also enriched in the magenta module (Fig. 5b). Phylogenetic analysis showed that CmSnRK2.6 belongs to subgroup IId of the SnRK2 family and is homologous to AtSnRK2.6 (Supplementary Fig. S9). Sequence and motif analysis indicated that Motifs 1/2/4/5/6/8/9/11 are shared by CmSnRK2.6 and its homologous genes (Fig. 6a). Motifs 1/2/3/4/5/10/11 constitute the conserved protein kinase domain PF00069. Both the N-and C-terminus of CmSnRK2.6 are relatively conserved. The N-terminal region contains two conserved kinase domains: the ATP-binding domain (Motif 4) and the serine/threonine kinase activity domain (Motif 1). The C-terminus contains two different domains: Domain I (Motif 6) and Domain II (Motifs 8 and 9) (Fig. 6a, Supplementary Fig. S10). Domain II is the binding region of PP2C and SnRK2 in the ABA-dependent pathway, indicating that CmSnRK2.6 may be implicated in ABA signal transduction. Notably, the absence of Motif 7 in both CmSnRK2.6 and AtSnRK2.6 may lead to their lower N-terminal conservation compared with other homologs. Subcellular localization analysis showed that CmSnRK2.6 localizes to the cytoplasm and nucleus, consistent with the localization patterns of similar proteins reported by Han et al.[42] and Huang et al.[43] (Fig. 6b).
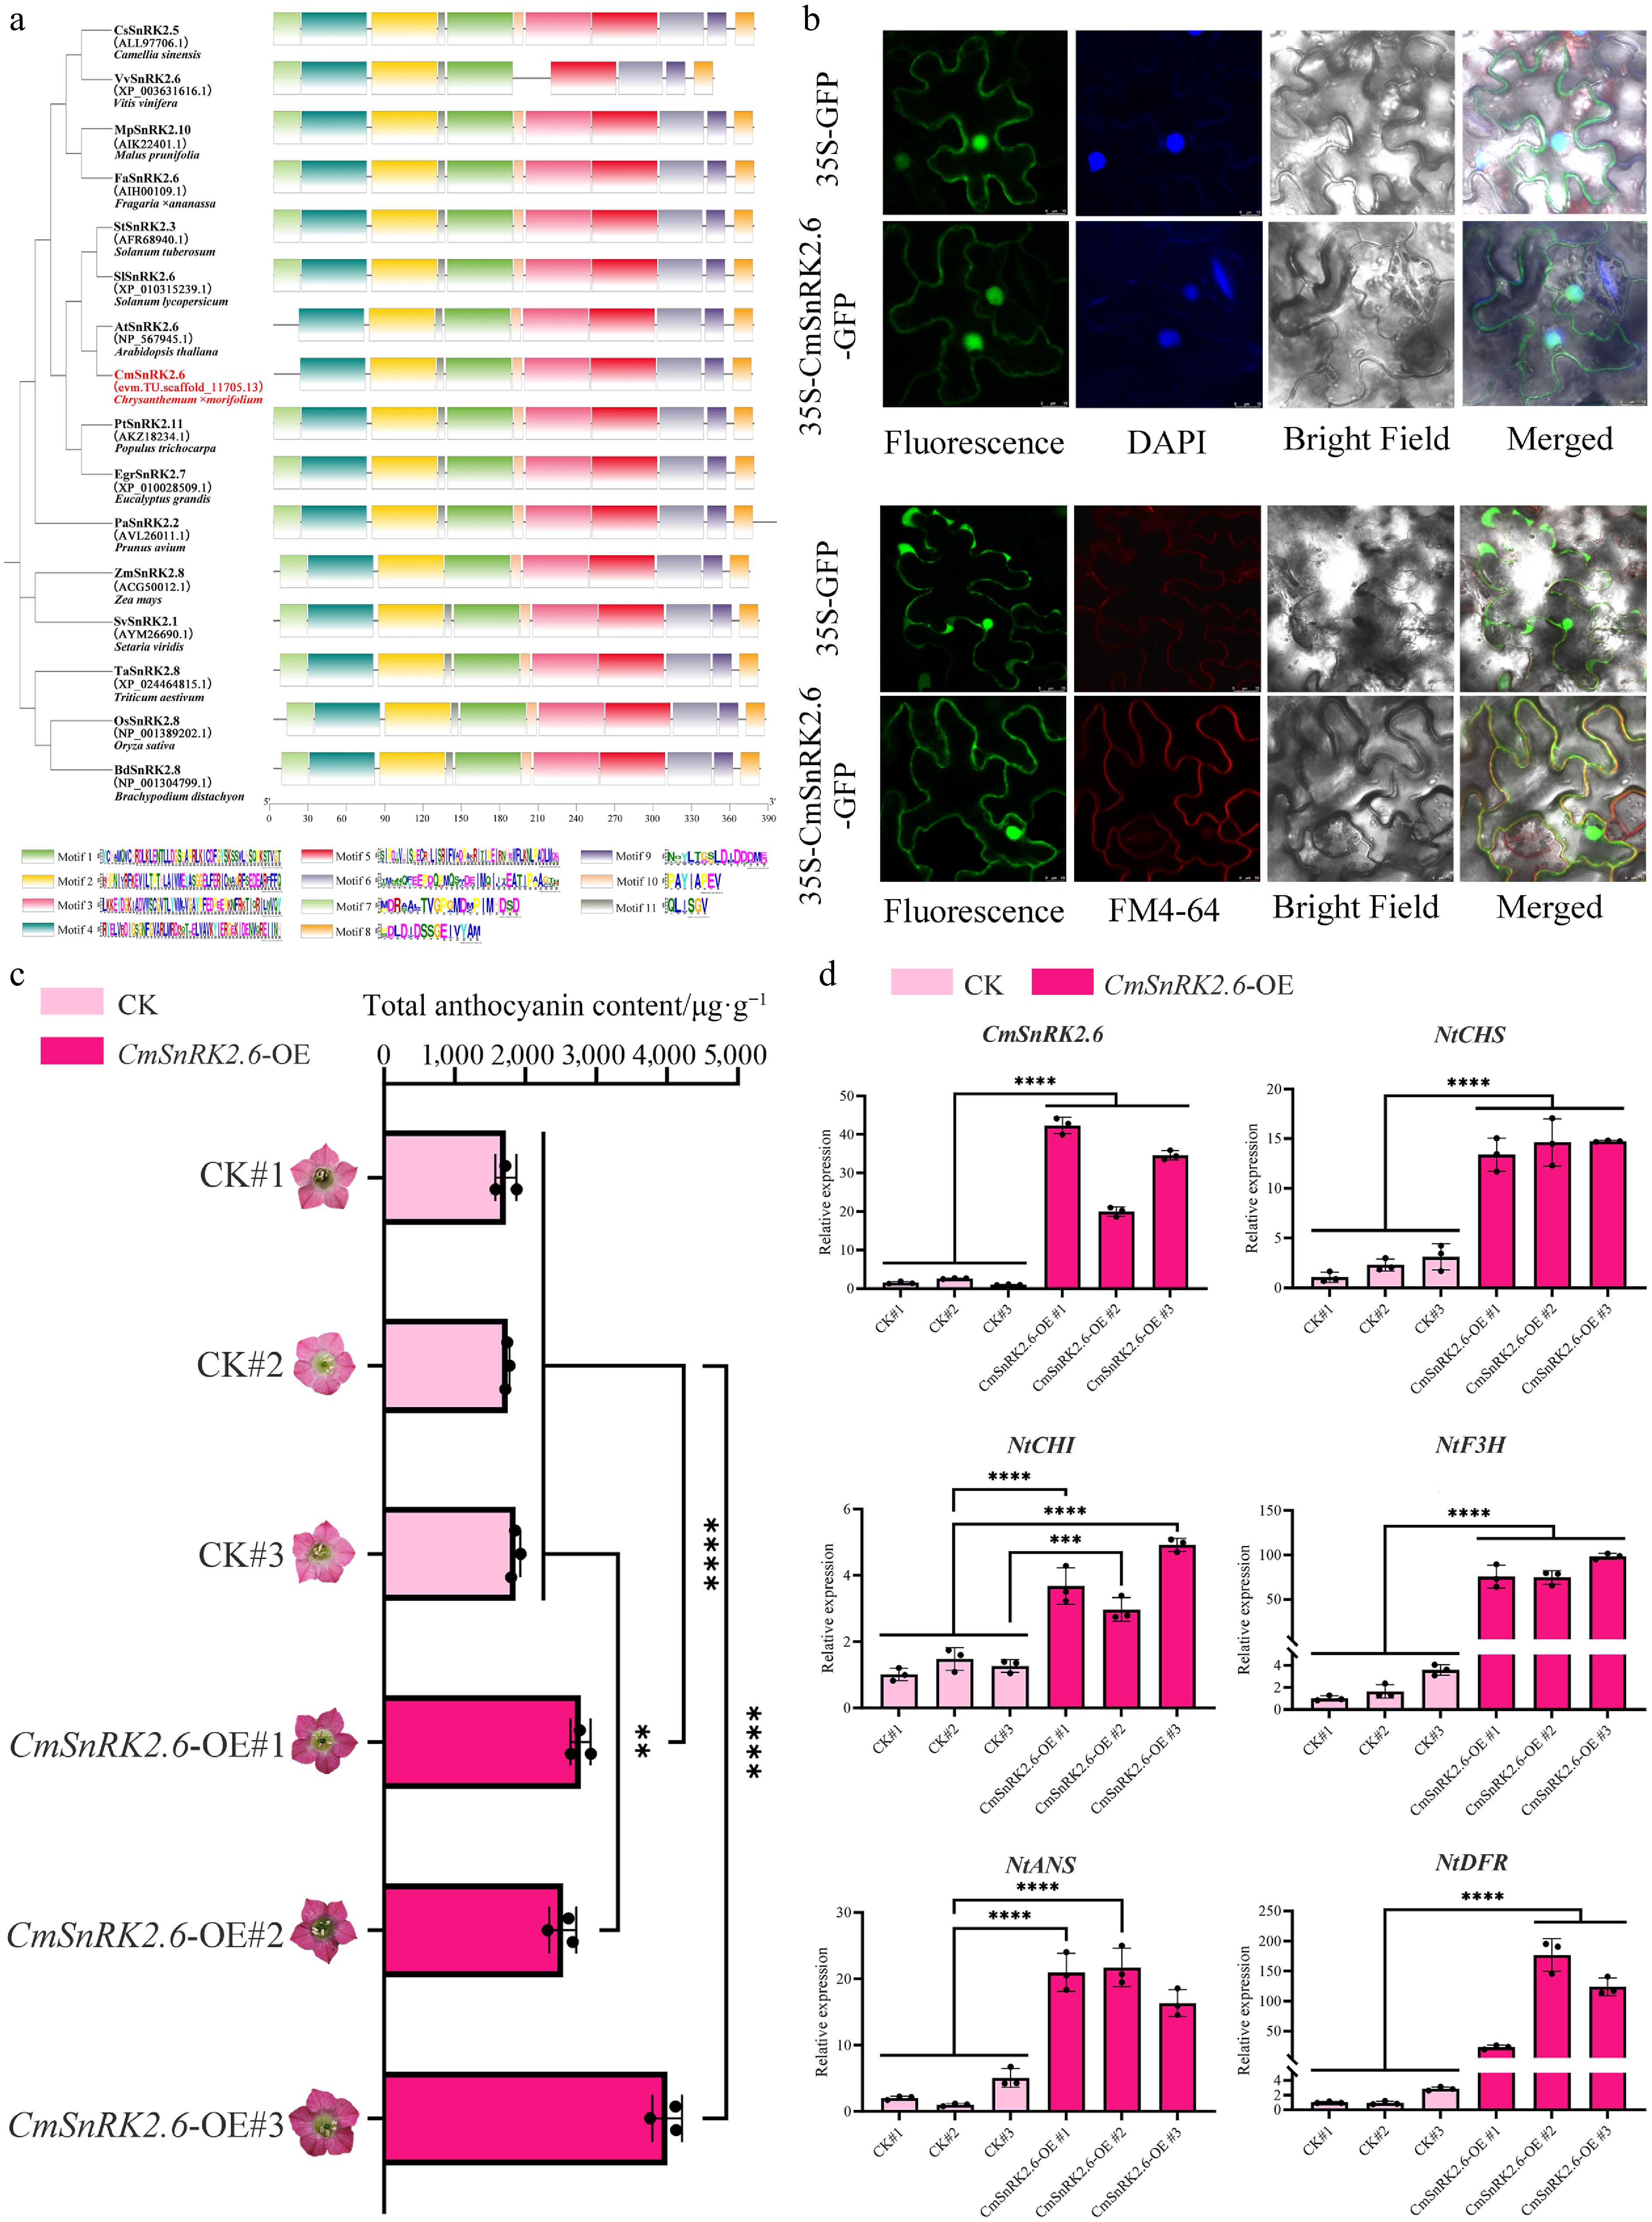
Figure 6.
Functional characterization of CmSnRK2.6 involved in anthocyanin biosynthesis. (a) Phylogenetic and conserved motif analysis of CmSnRK2.6 and homologous genes of AtSnRK2.6 from 14 species. (b) Subcellular localization analysis of CmSnRK2.6 in tobacco leaves. (c) Total anthocyanin content in CmSnRK2.6-overexpressing tobacco. (d) Expression pattern of CmSnRK2.6, CmbHLH2.1, and anthocyanin biosynthesis-related genes in transgenic tobacco.
To further explore the functional role of CmSnRK2.6 in anthocyanin biosynthesis, we performed ectopic overexpression of CmSnRK2.6 in transgenic tobacco. Our results showed that the flower color of transgenic plants was significantly deepened (Fig. 6c). The measurement of anthocyanin content in T1 transgenic plants showed higher accumulation than in the control (Fig. 6c). Meanwhile, the five structural genes (NtCHS, NtCHI, NtF3H, NtDFR, and NtANS) exhibited synchronized upregulation, consistent with the anthocyanin accumulation (Fig. 6c, d).
CmSnRK2.6 interacts with CmbHLH2.1 to promote anthocyanin accumulation during the post-flowering stage in 'f23'
-
The above results collectively demonstrated that CmSnRK2.6 could promote anthocyanin accumulation and may serve as a key gene responsible for the flower color change during the post-flowering stage in 'f23'. To elucidate the molecular mechanism by which CmSnRK2.6 regulates anthocyanin biosynthesis, five transcription factors were screened as candidate interacting proteins for Y2H assays based on the transcriptome co-expression network (Fig. 5d). The results revealed a physical interaction between CmSnRK2.6 and CmbHLH2.1 (evm.TU.scaffold_11779.113) (Fig. 7a). Phylogenetic analysis of CmbHLH2.1 showed that it is most closely related to CmbHLH2 in chrysanthemum (Supplementary Fig. S11). Subcellular localization assays indicated that CmbHLH2.1 was localized in the nucleus, suggesting a co-localization with CmSnRK2.6, which provides the spatial basis for their interaction (Fig. 7b).
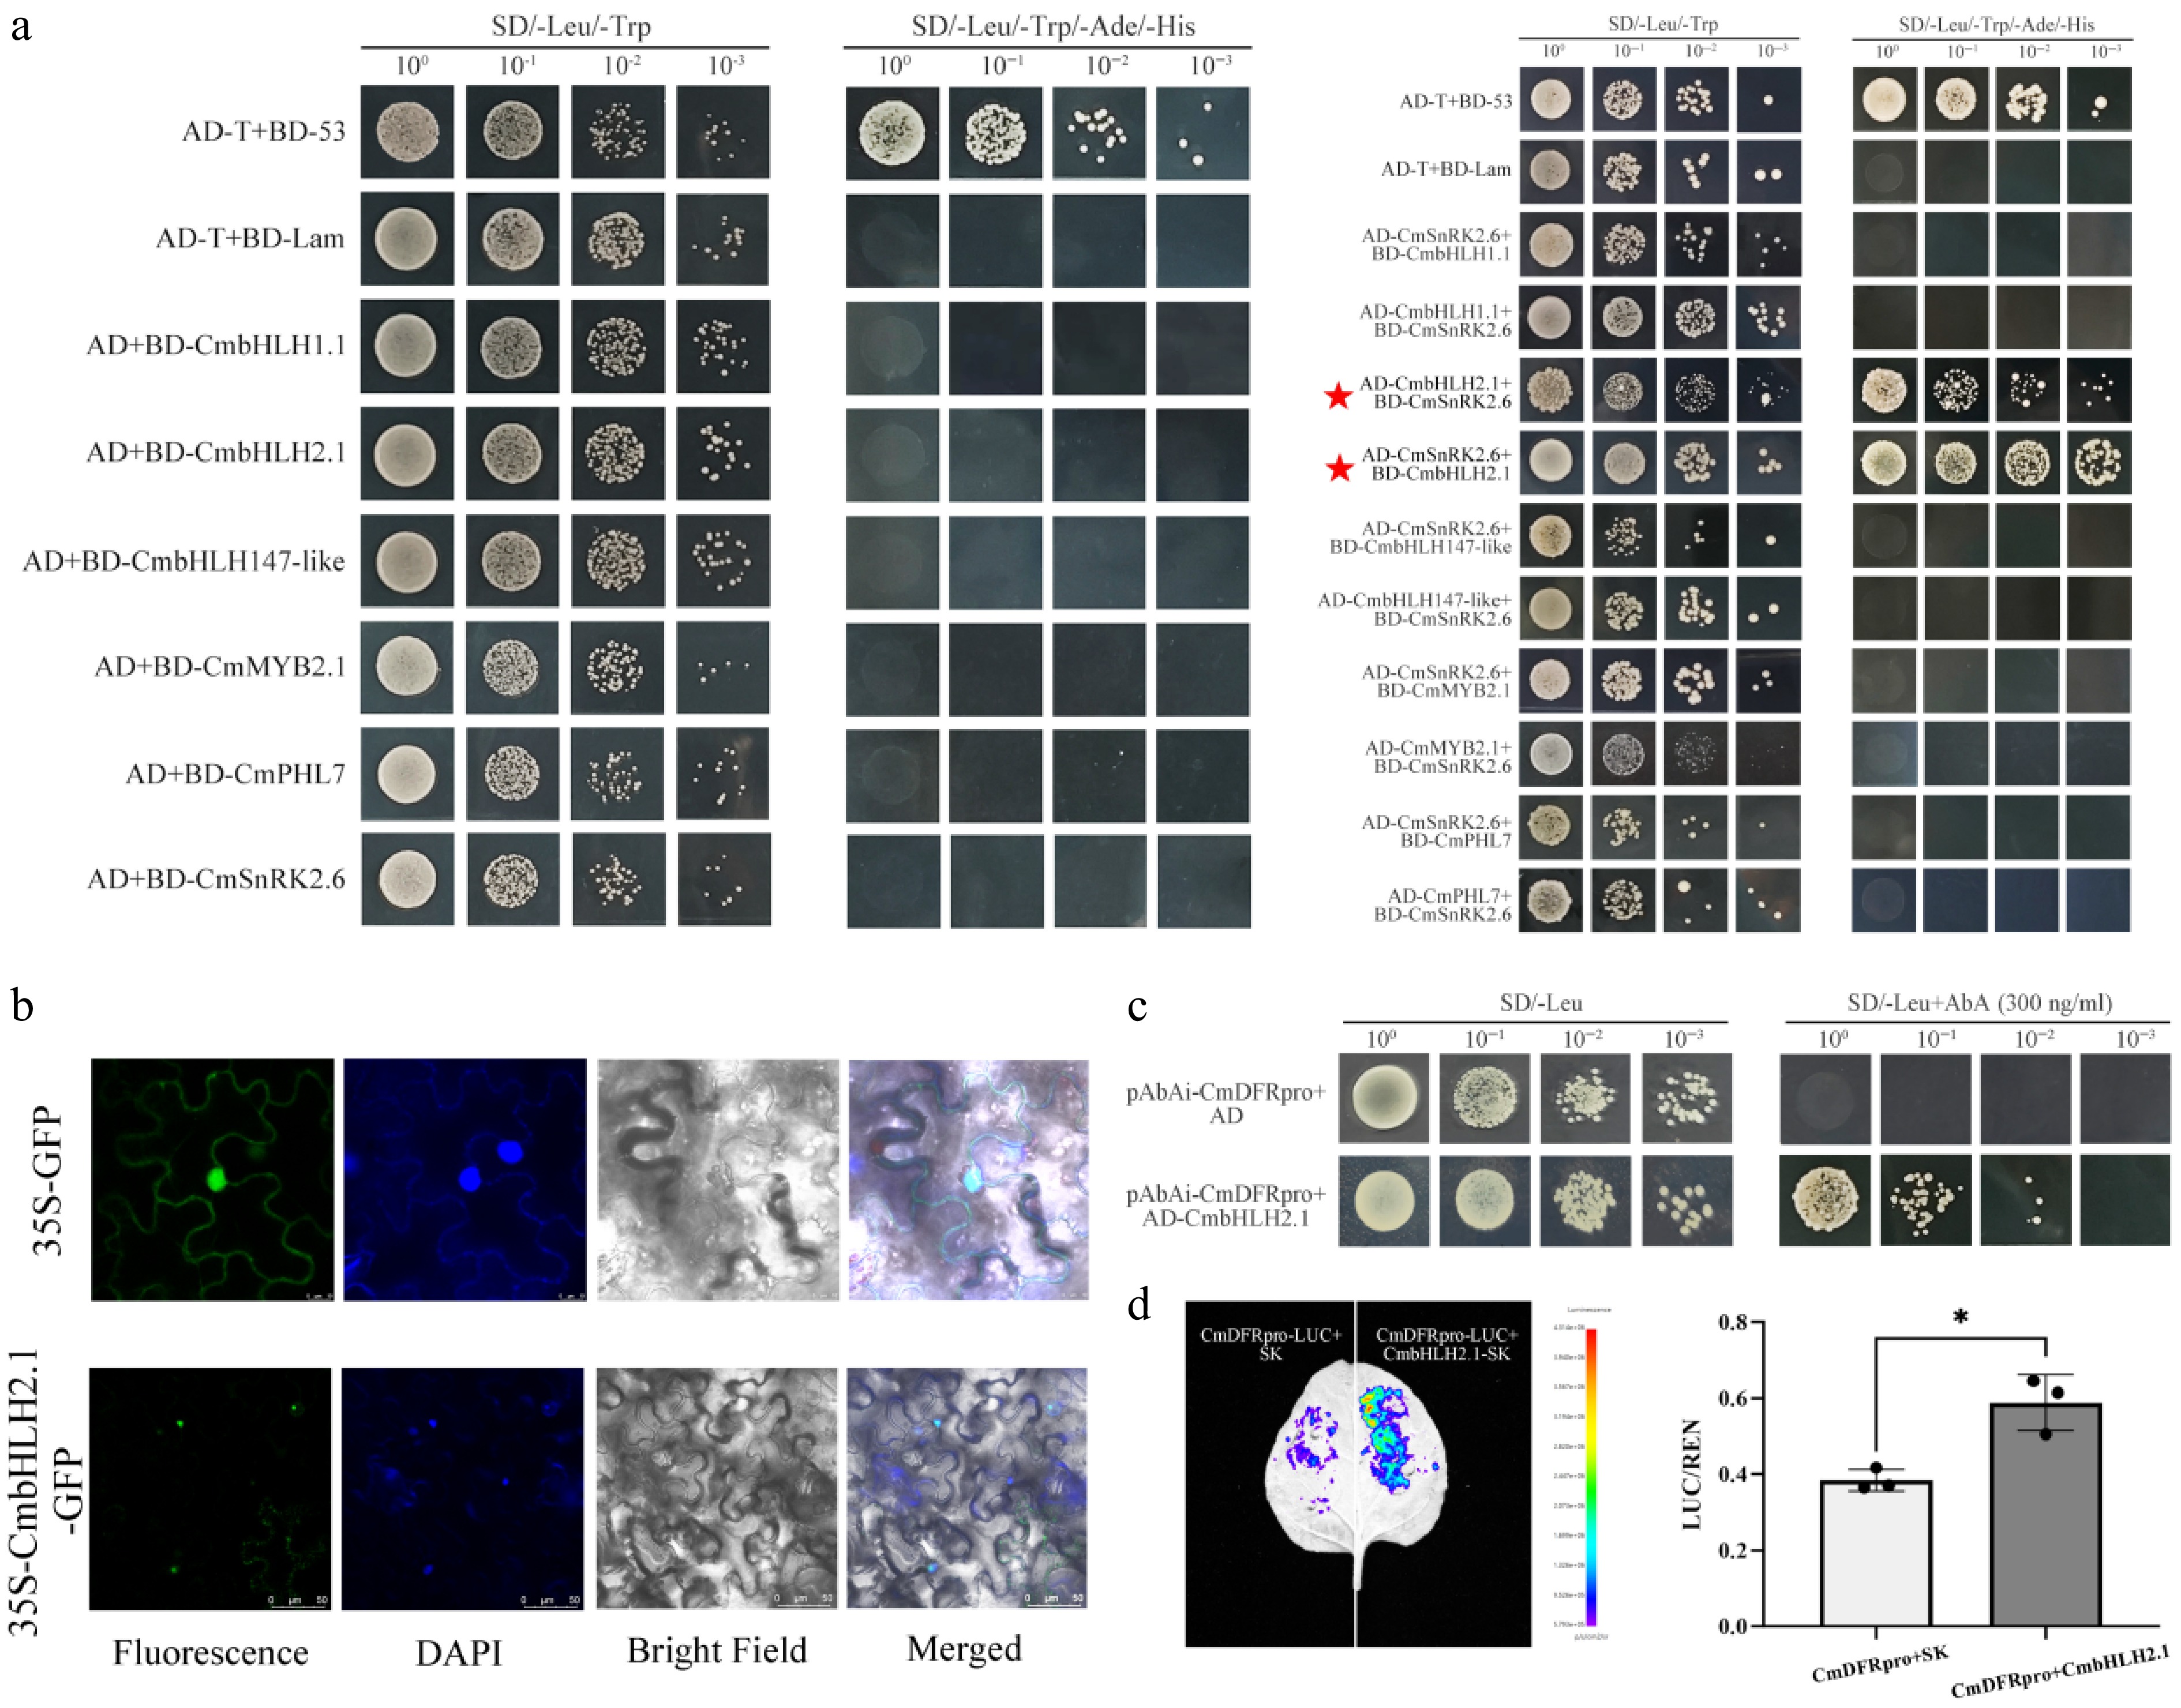
Figure 7.
Functional verification of the interaction between CmSnRK2.6 and CmbHLH2.1 and the transcriptional activation of the CmDFR promoter in chrysanthemum 'f23'. (a) Y2H assay verifying the protein–protein interaction between CmSnRK2.6 and CmbHLH2.1. (b) Subcellular localization analysis of CmbHLH2.1 in tobacco leaves. (c) Y1H assay confirming the direct binding of CmbHLH2.1 to the CmDFR promoter. (d) Dual-luciferase reporter assay verifying the transcriptional activation of the CmDFR promoter by CmbHLH2.1.
Cis-element analysis of the promoter regions of five anthocyanin biosynthetic structural genes revealed that the promoters of CmCHS, CmCHI, CmF3H, and CmDFR all contained the core binding elements for bHLH transcription factors (G-box/MYC binding sites) (Supplementary Fig. S12, Table S2). This result suggested that CmbHLH2.1 could regulate the transcriptional expression of the above structural genes by targeting and binding to their promoter regions. Subsequent Y1H and dual-luciferase reporter assays confirmed that CmbHLH2.1 could directly bind to the promoter of CmDFR and activate its transcription (Fig. 7c, d). In summary, CmSnRK2.6 may activate the expression of the downstream CmDFR through interacting with CmbHLH2.1, thereby promoting anthocyanin biosynthesis and accumulation during the post-flowering stage in 'f23'.
-
Flower color of ornamental plants often undergoes dynamic changes with flower aging. In most cultivars, flower fading is a consequence of both blocked anthocyanin synthesis and the wilting of cell structures, leading to a reduction in their ornamental value[31]. However, the chrysanthemum 'f23' used in this study shows deepening flower color during the post-flowering stage. Its flower color changes from white to reddish purple at stages S5–S7. Our findings demonstrate that the specific accumulation of cyanidin-3-O-(6''-O-malonyl-glucoside) and cyanidin-3-O-(3'',6''-O-dimalonyl-glucoside) is the primary driver of flower color change during the post-flowering stage. Flavonoids, highly expressed in the early flowering stages, decrease in relative content during the post-flowering stage, and the change in their ratio together drives flower color change. These identified anthocyanin components are highly consistent with the main cyanidin glycoside types reported in chrysanthemums by Nakayama et al.[44]. Unlike most chrysanthemums that exhibit flower fading during the post-flowering stage, cultivar 'f23' exhibits deepening flower color during the post-flowering stage. This unique germplasm serves as an ideal model for deciphering the molecular regulatory mechanism of positive anthocyanin accumulation during the post-flowering stage.
Changes in anthocyanin content are the result of the synergistic effect of multiple processes such as biosynthesis, transport, and degradation[45]. The biosynthesis process is controlled by the expression of structural genes and is precisely regulated by transcription factors. It has been confirmed that the upregulated expression of key structural genes for anthocyanin synthesis, such as CHI, F3H, and ANS, can promote anthocyanin accumulation in Lagerstroemia indica[46] and Lonicera japonica[47]. Transcriptome analysis in this study showed that expression levels of structural genes across the entire anthocyanin biosynthesis pathway (CHS, CHI, F3H, F3'H, DFR, ANS, 3MaT) increased during the post-flowering stage in 'f23'. Notably, the high expression of 3MaT1/2 corresponds to the synthesis of two unique cyanidin glycosides in 'f23', providing direct metabolic evidence for the deepening flower color during the post-flowering stage. Furthermore, MYBs, bHLHs, WD40s, and the MBW complex formed by them are the core regulatory modules of structural genes for anthocyanin glycoside synthesis[48]. In this study, we identified a set of candidate genes, including core MBW complex members (MYBs, bHLHs) and transcription factors from the NAC and WRKY families. Furthermore, these regulators displayed distinct co-expression patterns with the candidate structural genes. This suggests that different transcription factor families may play different roles in regulating anthocyanin glycoside biosynthesis and related signaling pathways. In addition to classical MBW complex regulation, there may be a complex transcriptional regulatory network similar to MdNAC42-MdMYB10 in Malus domestica[49]and PbWRKY75-PbMYB10b in Pyrus bretschneideri[50] that affects the expression of downstream structural genes and flower color changes.
Plant hormones play important roles in regulating anthocyanin synthesis and plant senescence[51,52]. As an ethylene-insensitive plant[53,54], ABA is the main regulatory hormone for chrysanthemum senescence[55]. However, the combined regulation of multiple hormones was involved in flower aging. For example, ABA and ethylene synergistically promote senescence in Rosa hybrida[56] and Rosa chinensis[57]. KEGG pathway analysis in this study showed that plant hormone signal transduction pathways (ethylene, ABA, auxin, jasmonic acid, etc.) were significantly enriched in DEGs. A core gene of the ABA signal transduction pathway, CmSnRK2 (evm.TU.scaffold_11705.13), might regulate anthocyanin biosynthesis during the post-flowering stage. It is speculated that ABA might regulate the anthocyanin biosynthesis during the post-flowering stage via regulating endogenous hormone levels and synergizing with other phytohormones.
Notably, SnRK2 (SNF1-related protein kinase 2) is an important signal component of the ABA signal transduction pathway PYR/PYL/RCAR-PP2Cs-SnRK2s-ABFs[58]. In addition to participating in osmotic stress and ABA response[59,60], SnRK2 family genes have also been reported to be involved in regulating anthocyanin biosynthesis in Vaccinium corymbosum[61], Prunus avium[62], Fragaria × ananassa[63], and Vitis vinifera[64]. CmSnRK2.6 (evm.TU.scaffold_11705.13) identified in this study is a homolog of AtSnRK2.6. Its N-terminus contains a conserved ATP-binding domain and a serine/threonine kinase activity domain, and its C-terminus contains an ABA-dependent PP2C-binding domain (Domain II), which has the core function of mediating ABA signal transduction. Compared with other homologous genes, CmSnRK2 lacks Motif 7, which may lead to certain specificities in substrate binding or kinase activity regulation. Subcellular localization showed that CmSnRK2.6 localizes to the nucleus and cytoplasm, which is consistent with its requirement to phosphorylate ABF-type TFs in the nucleus to activate downstream genes and regulate metabolic enzyme activity in the cytoplasm for ABA signal transduction. Thus, CmSnRK2.6 is a key candidate gene that regulates anthocyanin biosynthesis during the post-flowering stage in chrysantheum, which could affect ABA signal transduction and anthocyanin biosynthesis. It is well established that most SnRK2 proteins exert their core function through kinase activity rather than direct DNA binding[65,66]. SnRK2 regulates downstream gene expression via a canonical mode by phosphorylating TFs (e.g., MYBs, bHLHs), which in turn mediates the binding of these TFs to target gene promoters. Consistent with this, prior studies in blueberry[61] and strawberry[42] have confirmed that SnRK2 modulates anthocyanin accumulation by regulating TFs such as VcMYB1 and FabHLH3. In the present study, ectopic overexpression of CmSnRK2.6 in tobacco led to increased anthocyanin accumulation, coupled with significantly increased transcript levels of five core anthocyanin biosynthetic structural genes. Based on the results of the co-expression network and Y2H assay, we verified the physical interaction between CmSnRK2.6 and CmbHLH2.1. Meanwhile, CmbHLH2.1 was localized in the nucleus, allowing spatial co-localization with CmSnRK2.6 and laying the foundation for their interaction. Furthermore, promoter cis-element analysis further revealed that the promoters of CmCHS, CmCHI, CmF3H, and CmDFR possess conserved bHLH-binding motifs. Y1H and dual-luciferase assays demonstrated that CmbHLH2.1 could bind to the CmDFR promoter and activate its expression. Integrating these results, CmSnRK2.6 may function by interacting with CmbHLH2.1 to modulate downstream the anthocyanin biosynthetic gene CmDFR, thereby regulating the anthocyanin biosynthesis during the post-flowering stage in chrysanthemum. Future research should focus on validating the in vivo interaction between CmSnRK2.6 and CmbHLH2.1, as well as their phosphorylation regulatory mechanism.
-
The chrysanthemum cultivar 'f23' shows a unique reddish-purple coloration during the post-flowering stage. This coloration is primarily caused by the accumulation of two cyanidin glycosides and a reduction in flavonoid accumulation. In this study, CmSnRK2.6, a core gene in the ABA signaling pathway, was verified to positively regulate anthocyanin biosynthesis during the post-flowering stage in chrysanthemum. CmSnRK2.6 is localized in both the cytoplasm and nucleus, and its ectopic overexpression in tobacco significantly promotes anthocyanin accumulation. Meanwhile, the transcript levels of core anthocyanin biosynthetic genes are significantly upregulated in transgenic lines. Y2H assays provided preliminary evidence supporting the physical interaction between CmSnRK2.6 and CmbHLH2.1. Furthermore, CmbHLH2.1 can directly bind to the promoter of CmDFR and activate its transcription. Taken together, our findings demonstrate that CmSnRK2.6 could interact with CmbHLH2.1 to transcriptionally activate the downstream gene CmDFR to promote anthocyanin biosynthesis and accumulation, thereby deepening the flower color during the post-flowering stage in chrysanthemum 'f23'. This study enriches the germplasm resources of chrysanthemum and provides a theoretical foundation for molecular breeding of flower color modification in ornamental plants.
-
The authors confirm their contributions to the paper as follows: research conception and design: Hong Y, Wen X, Wei Y; provision of germplasm resources: Dai S; bioinformatic analysis: Wei Y, Wen X, Wang B; experimental preparation and execution: Wei Y, Fu B, Song X, Zhao W, Wang L, Cai Q; data analysis and manuscript writing: Wei Y, Wen X. All authors reviewed the results and approved the final version of the manuscript.
-
The transcriptomic sequencing data have been deposited in the National Center for Biotechnology Information Sequence Read Archive database repository with accession numbers PRJNA1017809.
-
This work was supported by the National Natural Science Foundation of China (32271946).
-
The authors declare that they have no conflict of interest.
-
# Authors contributed equally: Yuanyuan Wei, Xiaohui Wen
- Supplementary Table S1 Primer sequence information for qRT-PCR.
- Supplementary Table S2 Positions of predicted cis-elements in the promoter sequences of five anthocyanin biosynthetic genes.
- Supplementary Fig. S1 Determination of CIE L*a*b* color parameters in inner and outer ray florets of chrysanthemum 'f23' at different developmental stages.
- Supplementary Fig. S2 Comparison of flavonoid and anthocyanin glycoside contents in inner and outer ray florets of chrysanthemum 'f23' at different developmental stages.
- Supplementary Fig. S3 Volcano plots and statistical charts of DEGs between inner and outer of ray florets in chrysanthemum 'f23' at S5, S6, and S7 developmental stages.
- Supplementary Fig. S4 Heatmap of significantly DEGs screened via volcano plots.
- Supplementary Fig. S5 Co-expression clustering analysis of inner and outer ray florets during the post-flowering stage in 'f23'.
- Supplementary Fig. S6 Four classes of plant hormones may be involved in regulating flower color deepening during the post-flowering stage in 'f23'.
- Supplementary Fig. S7 Candidate factors and co-expression network of the Pink module, and expression heatmap of TFs in Blue, Magenta, and Pink modules.
- Supplementary Fig. S8 Expression heatmap of key candidate genes associated with flower color deepening during the post-flowering stage in 'f23'.
- Supplementary Fig. S9 Phylogenetic tree of SnRK2 proteins from the 'f23' transcriptome, Arabidopsis, and rice based on kinase domain amino acid sequences (Poisson correction model).
- Supplementary Fig. S10 Analysis of amino acid sequences of 16 SnRK2 proteins.
- Supplementary Fig. S11 Phylogenetic tree of CmbHLH2.1 (evm.TU.scaffold_11779.113) and homologous proteins from ten other species.
- Supplementary Fig. S12 Cis-element analysis of promoters for five anthocyanin biosynthetic genes.
- Copyright: © 2026 by the author(s). Published by Maximum Academic Press, Fayetteville, GA. This article is an open access article distributed under Creative Commons Attribution License (CC BY 4.0), visit https://creativecommons.org/licenses/by/4.0/.
-
About this article
Cite this article
Wei Y, Wen X, Fu B, Wang B, Song X, et al. 2026. Integrative transcriptome and pigment profiling reveal the molecular mechanism of flower color deepening during the post-flowering stage in chrysanthemum. Ornamental Plant Research 6: e018 doi: 10.48130/opr-0026-0013 

Integrative transcriptome and pigment profiling reveal the molecular mechanism of flower color deepening during the post-flowering stage in chrysanthemum
- Received: 06 January 2026
- Revised: 14 April 2026
- Accepted: 07 May 2026
- Published online: 26 May 2026
Abstract: Flower color is a key trait determining the commercial value of ornamental plants. As changes in flower color are increasingly appealing to home gardening consumers, they have become a key trendsetter for future breeding. However, the molecular mechanism underlying flower color change during the post-flowering stage in flowers remains unclear. In this study, the chrysanthemum cultivar 'f23' (exhibiting deepening flower color with flower aging) was used to explore post-flowering flower color change via an integrated approach of HPLC and transcriptomic analyses. HPLC results showed that two cyanidin glycosides accumulated significantly in ray florets during the post-flowering stage, whereas the total flavonoid content decreased. Transcriptomic analysis revealed that differentially expressed genes were mainly enriched in flavonoid biosynthesis and plant hormone signal transduction pathways. Notably, the ABA signal transduction gene CmSnRK2.6 was identified as a hub gene regulating anthocyanin biosynthesis during the post-flowering stage. Overexpression of CmSnRK2.6 in tobacco resulted in deepened flower color and increased anthocyanin accumulation, accompanied by significant upregulation of core anthocyanin biosynthetic genes. Yeast two-hybrid (Y2H) assays verified a direct physical interaction between CmSnRK2.6 and CmbHLH2.1. Yeast one-hybrid (Y1H) and dual-luciferase assays further confirmed that CmbHLH2.1 directly binds to the promoter of CmDFR and activates its transcription. This study provides a theoretical basis and abundant genetic resources for molecular breeding aimed at flower color improvement in chrysanthemums.
-
Key words:
- Flower color change /
- Anthocyanin biosynthesis /
- Chrysanthemums /
- Pigment composition /
- SnRK2.6