


-
In recent years, biomass has received considerable attention as a new type of energy. It originates from a wide range of sources, has a large storage capacity, and can be recycled. Meanwhile, it does not have the problems of randomness, intermittency, and volatility that are associated with renewable energy sources, such as solar energy and wind energy[1]. The prospect of converting biomass to high-value biofuels is significant[2]. Pyrolysis is a thermochemical reaction involving the decomposition of biomass at high temperatures in an anaerobic or anoxic environment[3].
Sugarcane is one of the world's major crops, and is produced in temperate and subtropical regions. Every year, approximately 1.6 billion tons of sugarcane are produced around the world[4]. Traditional disposal methods (e.g., incineration and open piles) not only utilize resources poorly, but also cause environmental pollution. The incineration of bagasse emits greenhouse gases such as carbon dioxide and is characterized by an energy utilization efficiency of less than 30%[5]. Furthermore, the decomposition of organic matter present in bagasse can generate methane, a potent greenhouse gas, or result in groundwater contamination through leachate infiltration[6]. Bagasse is mainly composed of cellulose, hemicellulose, and lignin, with high volatile content and low ash content, and is an ideal raw material for the preparation of hydrogen-rich gases by pyrolysis. Notably, microwave pyrolysis presents significant advantages over conventional pyrolysis for biomass processing. Its primary benefit stems from the use of electromagnetic waves to achieve rapid and uniform internal heating of the material, resulting in high heating rates, reduced temperature gradients, and lower pretreatment costs[7,8]. Moreover, the integration of microwave absorbers and catalysts enables the effective heating of feedstocks with low dielectric properties and precise control over the product distribution[9].
Catalytic pyrolysis technology is considered an effective method for improving H2 quality. In catalytic pyrolysis processes, catalysts can lower the decomposition temperature and promote a series of reactions such as deoxygenation, decarboxylation, decarbonylation, water vapor reforming, and water-gas shift. The catalytic effects of alkali metals on pyrolysis have also been extensively studied. Pan et al.[10] demonstrated that adding CaO greatly increased the H2 yield at 800 °C during bamboo pyrolysis, while also reducing the generation of CO2 and CO. Jordan & Akay[11] found that increasing the amount of CaO from 2% to 6% could increase the bagasse syngas yield by 17%–37%. Mishra et al.[12] investigated the effect of alkali metal catalysts on the production of hydrogen in a biomass/plastic mixture. They found that the catalysts increased the gas-phase volatility, improved steam reforming, and increased the H2 yield of the product. Ferreira & Saores[13] carried out pyrolysis on two species of microalgae (Chlorella vulgaris and Porphyra obliqua) in a fixed-bed reactor at 375 °C. They found that Na2CO3 significantly reduced coke yield while increasing bio-oil yield.
A single catalyst has limitations for the catalytic pyrolysis of biomass for hydrogen production. In the low-temperature pyrolysis stage, CaO is weakly regulated and susceptible to deactivation due to carbonation (CaO → CaCO3). Na2CO3 is prone to decomposition at elevated temperatures, possesses a limited adsorption capacity for CO2, and is not adequately selective for H2. The coupling of dual catalysts is beneficial for the hydrogen enrichment during biomass pyrolysis. Al-asadi & Miskolczi[14] employed a Me/Ni-ZSM-5 catalyst combined with dolomite for the pyrolysis of plastics. The primary components of the resulting pyrolysis gas included hydrocarbons with fewer than six carbon atoms (C6 and below), H2, CH4, CO2, and CO. Bunma & Kuchonthara[15] investigated the synergistic effects of CaO and MgO during sugarcane pyrolysis gasification. When the catalyst ratio was set at 2:1, the CO2 concentration reached its minimum value, and the H2 yield was measured at 16.8 mmol/g of biomass. Hu et al.[16] reported that the use of a bimetallic catalyst, Ni1Ca-Co4, significantly enhanced hydrogen production efficiency during bamboo pyrolysis compared to non-catalytic pyrolysis, increasing the H2 concentration from 17.93 vol.% to 40.32 vol.%. Similarly, Liu et al.[17] demonstrated that the use of a bimetallic catalyst (RHC@Fe/K) for rice husk pyrolysis resulted in an H2 concentration of 58.54 vol.%. Compared to the non-catalytic condition, the Fe/K bimetallic catalyst increased the H2 production by 229%. This study involved the coupled design of CaO/Na2CO3 to achieve synergy between low-temperature deoxygenation and high-temperature CO2 adsorption. This approach overcomes the performance limitations of a single catalyst. The issues of incomplete deoxygenation, CO2 residue, and low H2 selectivity in biomass pyrolysis were resolved. Additionally, ReaxFF molecular dynamics simulations and experiments were combined to reveal the differential effects of temperature on the pyrolysis pathways of the three bagasse components (cellulose, hemicellulose, and lignin).
Ex-situ microwave-assisted catalytic pyrolysis experiments were carried out on bagasse with catalysts of CaO, and Na2CO3, and their combinations in different ratios. The optimum conditions for hydrogen generation are explored by altering the type of catalyst to continuously increase the concentration of hydrogen components. Bagasse pyrolysis is investigated through thermogravimetric experiments and simulations. The catalysts are characterized using XRD, XPS, SEM, TEM, and Raman analysis to investigate their influence on the pyrolysis process. The synergistic mechanism and pyrolysis reaction pathway of the mixed CaO/Na2CO3 catalysts are systematically investigated through multi-dimensional studies combining experiments, simulations, and characterization.
-
The bagasse was collected from Guangxi Province of China. The bagasse was heated to 80 °C and dried for 4 h with a particle size of 0.5–1 mm. The proximate analysis and ultimate analysis of bagasse are listed in a previous work[18]. The CaO (AR) and Na2CO3 (AR) were purchased from Aladdin.
Thermogravimetric and pyrolysis experiments
-
Thermogravimetric experiments were carried out using a METTLERTGA2 thermogravimetric analyzer, with temperature increase rates of 5, 10, and 20 °C/min and a temperature range of 30–800 °C. The experiments were divided into three groups: (1) adding a bagasse and CaO mass ratio of 1:1; (2) adding a bagasse and Na2CO3 mass ratio of 1:1; (3) adding bagasse and a mixed catalyst mass ratio of 1:1, and a mixed catalyst with CaO and Na2CO3 mass ratio of 1:1. The CaO-to-biomass ratio of 1:1 ensures complete coverage of the biomass surface's active sites by CaO, while preventing catalyst sintering and pore blockage that may result from excessive CaO loading. Wang et al.[19], and Berthold et al.[20] also adopted this ratio in their experimental studies. To systematically investigate the synergistic mechanism between CaO and Na2CO3, comparative experiments were conducted using individual catalysts (pure CaO or Na2CO3), and mixed catalysts. The catalyst ratios were initially set at 1:1, and subsequently adjusted to 1:2, 1:3, 2:1, and 3:1. The mass of each sample was 5 mg and the experiments were carried out under a nitrogen atmosphere at a flow rate of 50 mL/min.
Catalytic pyrolysis experiments were performed using ex-situ microwave heating, and the pyrolysis temperature was 550 °C. The experimental setup included a pyrolysis device, a condensation device, and a gas collection device. The pyrolysis device comprised a three-neck flask containing a specific quantity of silicon carbide. Silicon carbide was a kind of microwave-absorbing material with great potential due to its good semi-conductivity, high thermal conductivity and high-temperature resistance. The use of silicon carbide enabled rapid heating. Before assembling the apparatus, the catalyst was positioned at the neck of the three-neck flask. Before starting the reaction, the gas tightness of the apparatus was tested. Nitrogen (50 mL/min) was passed in to expel the air present in the device, creating a nitrogen atmosphere. Following a 30-min wait, the temperature of the reaction was established, and the microwave was switched on for the heating process. The setting of the temperature to the required level was followed by waiting for the temperature to stabilize. It was due to the intermittent nature of microwave heating, which resulted in some fluctuation when the set temperature was just reached. Add a certain amount of raw materials to the middle of the feed pipe (while nitrogen is continuously passed through to facilitate the collection of gas) and control the flow of nitrogen during the reaction process using the flowmeter (50 mL/min). Connect the conical flask outlet to the gas bag (standard capacity 2 L) with a hose at the conical flask interface. After 5–10 min, close the nitrogen valve, then close and remove the gas bag. Turn off the microwave and allow the temperature to cool down. The proportions of the raw materials and the catalyst are shown in Table 1.
Table 1. Experimental feedstock and catalyst ratios.
Serial number Feedstock Catalyst Feedstock catalyst ratio 1 Bagasse CaO Feedstock : catalyst = 3:1 2 Bagasse Na2CO3 3 Bagasse CaO : Na2CO3 = 1:1 4 Bagasse CaO : Na2CO3 = 1:2 5 Bagasse CaO : Na2CO3 = 2:1 6 Bagasse CaO : Na2CO3 = 3:1 7 Bagasse CaO : Na2CO3 = 1:3 Model construction and reaction calculation
-
The content of each component in bagasse was as follows: cellulose (32% to 48%), hemicellulose (19% to 24%), lignin (23% to 32%), and ash (about 4%). Cellulose was a polymer formed by the condensation of many glucose molecules undergoing β-1,4 glycosidic bonding. The lignin in bagasse mainly consisted of somberol alcohol, while the hemicellulose was predominantly made up of xylose. The glycosidic bonds in the long chains of cellulose and xylose were broken to produce D-glucose and D-xylose during pyrolysis. The corresponding monomers of each part—D-glucose, D-xylose, and somberol alcohol—were selected as the modal compounds of cellulose, hemicellulose, and lignin in this study.
To determine the ratio of monomeric compounds, the cellulose, hemicellulose and lignin content of bagasse was known and the median ratio was calculated as 40:22:27. Through stoichiometric conversion of the mass ratio of the three monomers to their molar ratio, it was determined that their molar ratios were approximately 42.8:28.3:28.9. This was approximated as an integer ratio and obtained a D-glucose: D-xylose: somberol alcohol ratio of about 14:9:9. The deviations were obtained by proportional validation of the respective mass fractions. The deviations were as follows: cellulose: –1.0% (relative error: 2.5%); hemicellulose: +0.4% (relative error: 1.8%), and the lignin deviation was +1.0% (relative error: 3.7%). These deviations were smaller than the natural coefficient of variation of bagasse (CV = 5.2%–7.8%).
Based on the molecular formulae of the main components of bagasse, the monomer models were built separately using the Visualizer module, and these are shown in Fig. 1. The selected substances were then polymerized together at a temperature of 298 K using the AmorphousCell module. The module formed a three-dimensional periodic structure, which was constructed by an algorithm similar to the polymerization process, where molecules were 'grown' one by one into a simulation box. The cubic simulation box had a side length of 18.42 Å, and a density of 1.46 g/cm3. To rationalize the model structure, the aggregated model used the Forcite module to perform operations such as geometry optimization and annealing cycles. Annealing involves heating the molecules to a higher temperature, allowing the molecular structure to stretch and relax fully. The molecules were then cooled down to calculate the optimal structure. It allowed the global energy minimum to be reached, and the three-dimensional optimal structure to be obtained, achieving the most stable state without imaginary frequency. Imaginary frequencies were negative eigenvalues of the second-order derivative matrix of energy (Hessian matrix). In this direction of vibration, the architecture was at the maximum value of energy. Therefore, structures with imaginary frequencies were unstable structures. The annealing cycle was performed at temperatures between 300 K and 500 K, and the final model of the stable structure (denoted as Model A) was obtained using the NPT system. The model is shown in Fig. 2. and contains 219 C atoms, 366 H atoms, and 156 O atoms.
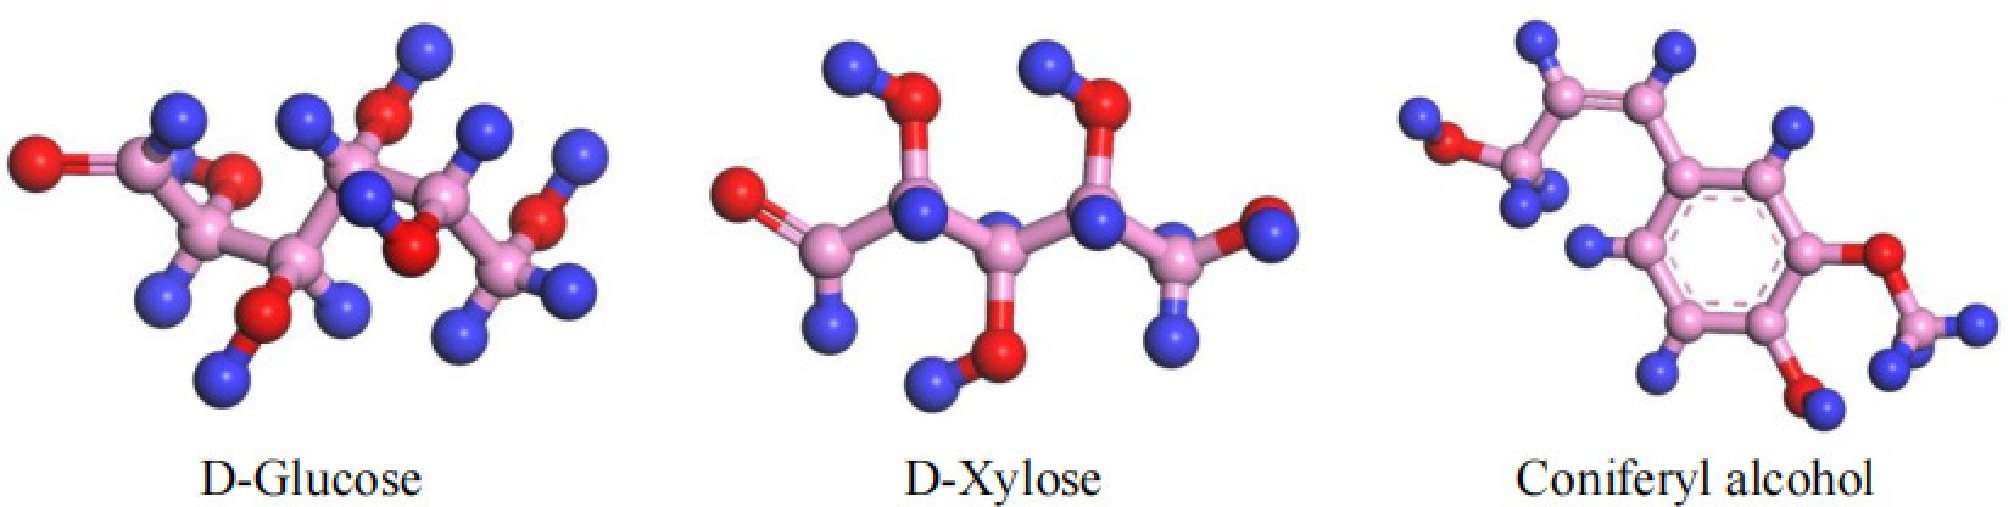
Figure 1.
Three modular models.
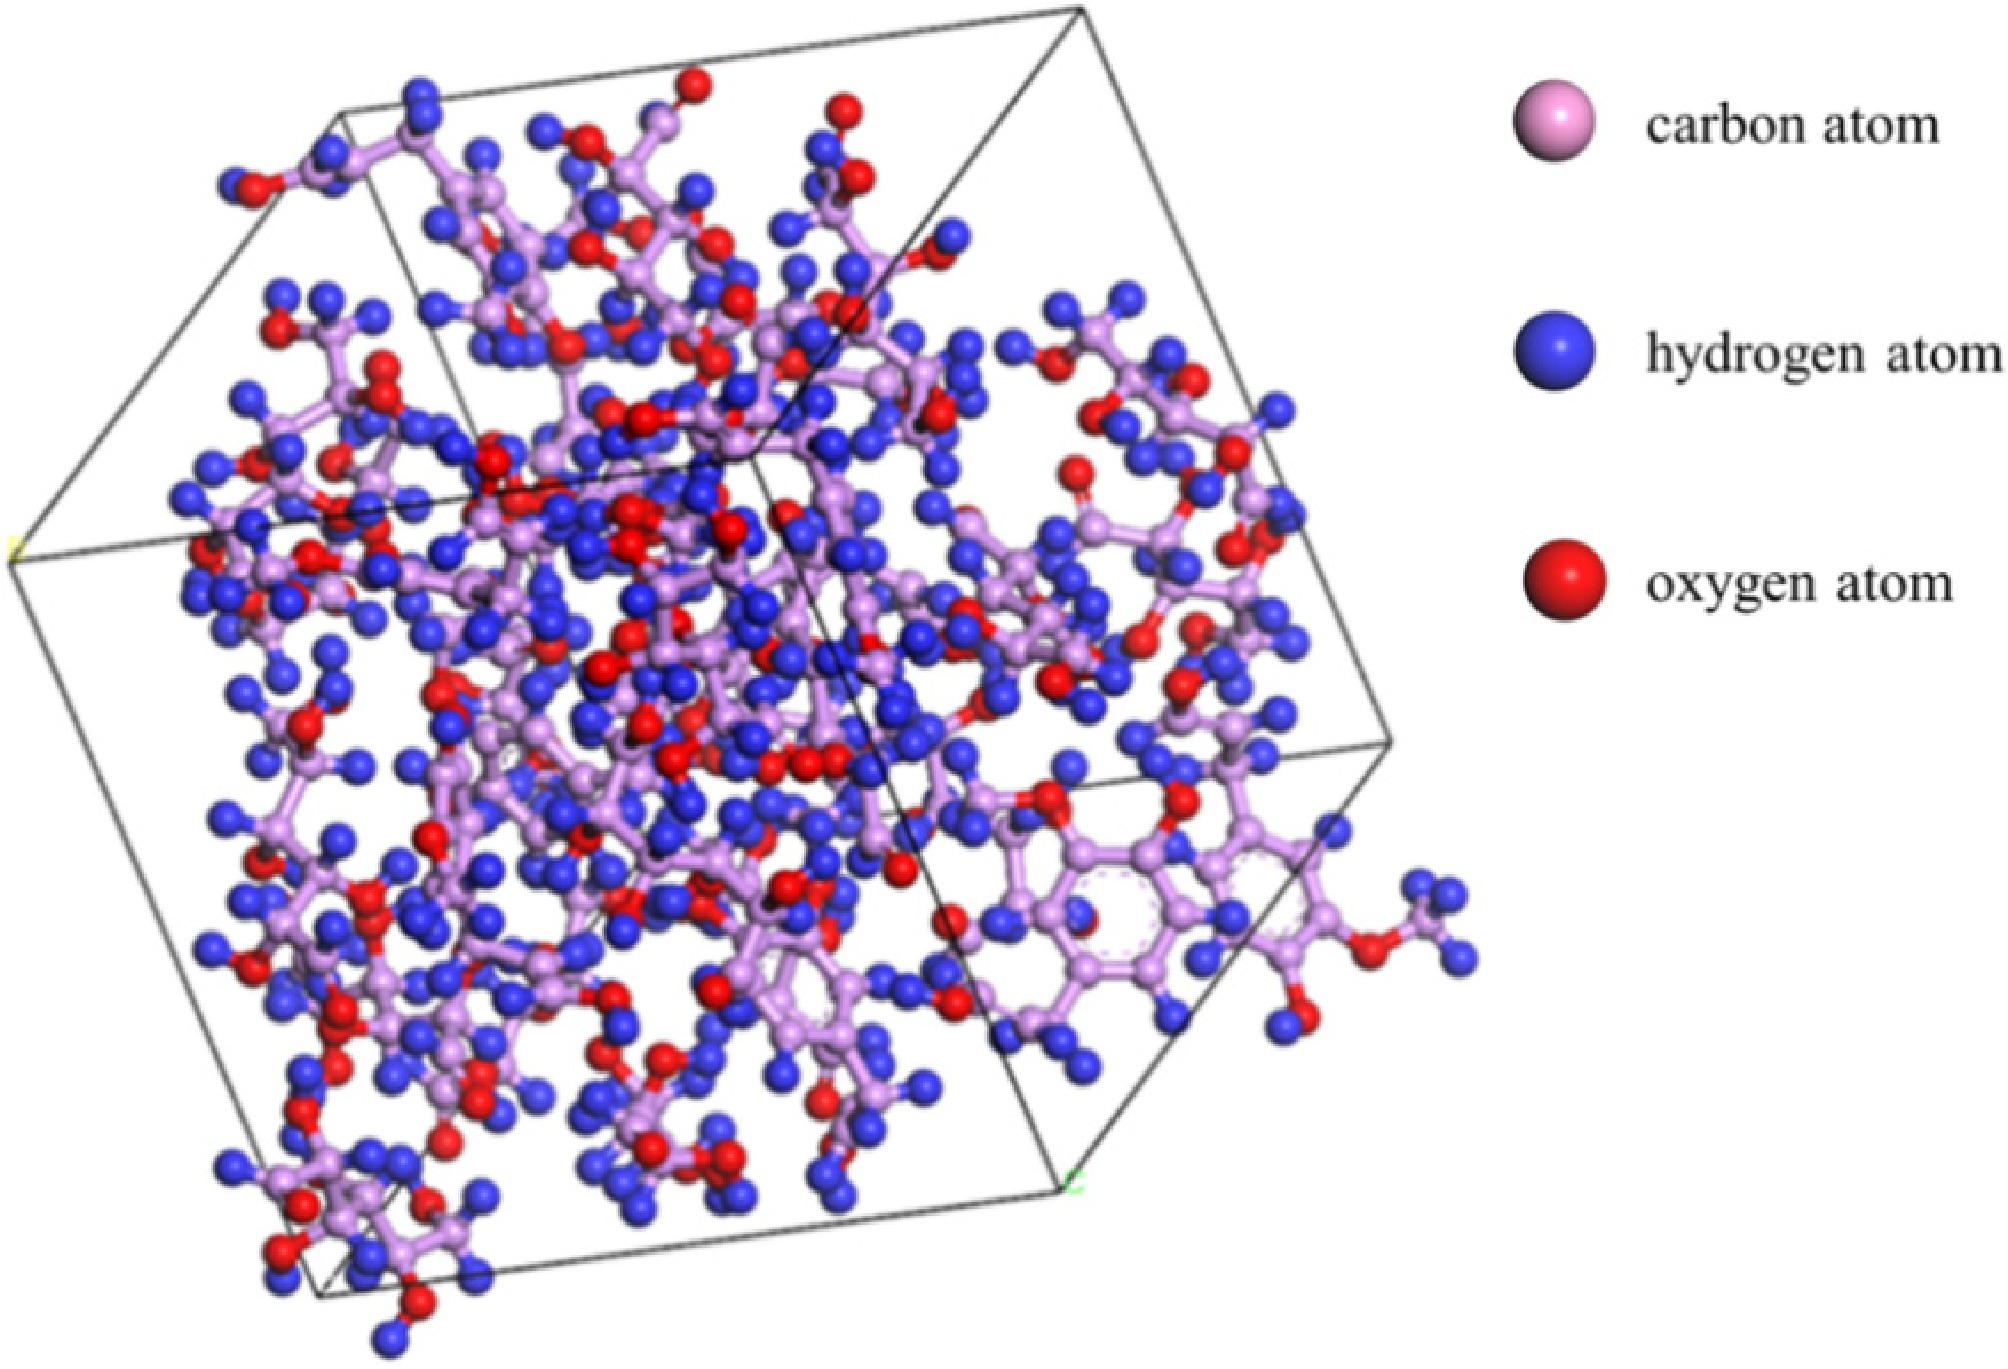
Figure 2.
Bagasse model (Model A).
For Model A, the ReaxFF force field and the NVT system were selected through the GULP module in Materials Studio 2020. The pyrolysis simulation was started at a temperature of 1,000 K and gradually increased until Model A had completely pyrolyzed into small molecules, and no macromolecular polymers remained. The products obtained at different temperatures were observed and identified. The pyrolysis results at five temperatures (1,000, 1,300, 1,500, 2,000, and 2,500 K) were selected for statistical analysis of the number of pyrolysis products. Due to limitations in current molecular dynamics software, the time step in the simulation was set to 1 fs, and the total simulation time to 100 ps. This ensured that the model received sufficient energy in a short period to initiate pyrolysis, resulting in a significantly higher simulated temperature than the actual temperature. However, according to molecular dynamics theory, temperature only affected the rate of a chemical reaction, not its chemical energy[21], and this kind of temperature setting was widely used in various heating simulations.
Catalyst characterization
-
X-ray diffraction (XRD) testing was performed with the German Bruker D8Advance. The scanning angle range was set to 2θ = 5°–90°, the step size to 0.02°, and the scanning speed to 5.0°/min.
Scanning electron microscope (SEM) used a Schottky field-emission electron gun with a magnification range of 20,000–100,000, and an accelerating voltage of 200–300 kV. The SEM equipment was a TESCAN MIRAL MS produced in the Czech Republic, and the scanning electron microscope target was platinum.
X-ray electron spectroscopy (XPS) tests were performed using an ESCALAB250Xi from Thermo Fisher Scientific in the USA. Monochromatic Al Ka radiation (hv = 1,486.6 eV) was used, with a power of 150 W, a beam spot diameter of 500 μm, and a binding energy calibrated at C1s of 284.8 eV.
Transmission electron microscopy (TEM) was performed using a Tecnai G2 F30 field emission transmission electron microscope from FEI, USA, with a voltage of 300 kV. The TEM sample preparation and observation steps were as follows: first, the sample was added to absolute ethanol or another suitable solvent and subjected to ultrasonic dispersion treatment. Then, the sample was dropped onto a copper, molybdenum, or nickel net and dried naturally. It was then placed in a high vacuum to observe the morphology. Next, voltage was added, and a better morphology was selected to take pictures, which were then saved.
Raman analysis was carried out using a LabRAM HR800 laser confocal micro-Raman spectroscopy system from Horiba Jobin Yon in France. A 633 nm laser was used, and the test range was from 100 to 4,000 cm−1. The required volume of the powder sample was more than 10 mg.
N2 adsorption and desorption tests were performed on the sample under liquid nitrogen conditions at 77 K using an American Quantachrome Autosorb IQ3 three-station fully automatic specific surface area analyzer. Upon completion of the instrumental analysis, isothermal adsorption, and desorption curves were obtained, and the total specific surface area of the material was calculated using the BET method.
-
Figure 3 shows the TG and DTG curves of bagasse for different catalysts and heating rates. (a), (b), and (c) use a heating rate of 5 °C/min; (d), (e), and (f) use a heating rate of 10 °C/min; and (c), (h), and (i) use a heating rate of 20 °C/min. (a), (d), and (g) used a CaO catalyst; (b), (e), and (h) used a Na2CO3 catalyst; and (g), (f), and (i) used a mixed catalyst (CaO : Na2CO3 = 1:1). As can be seen from Fig. 3, pyrolysis can be divided into three stages: drying and dehydration, rapid pyrolysis, and carbonization.
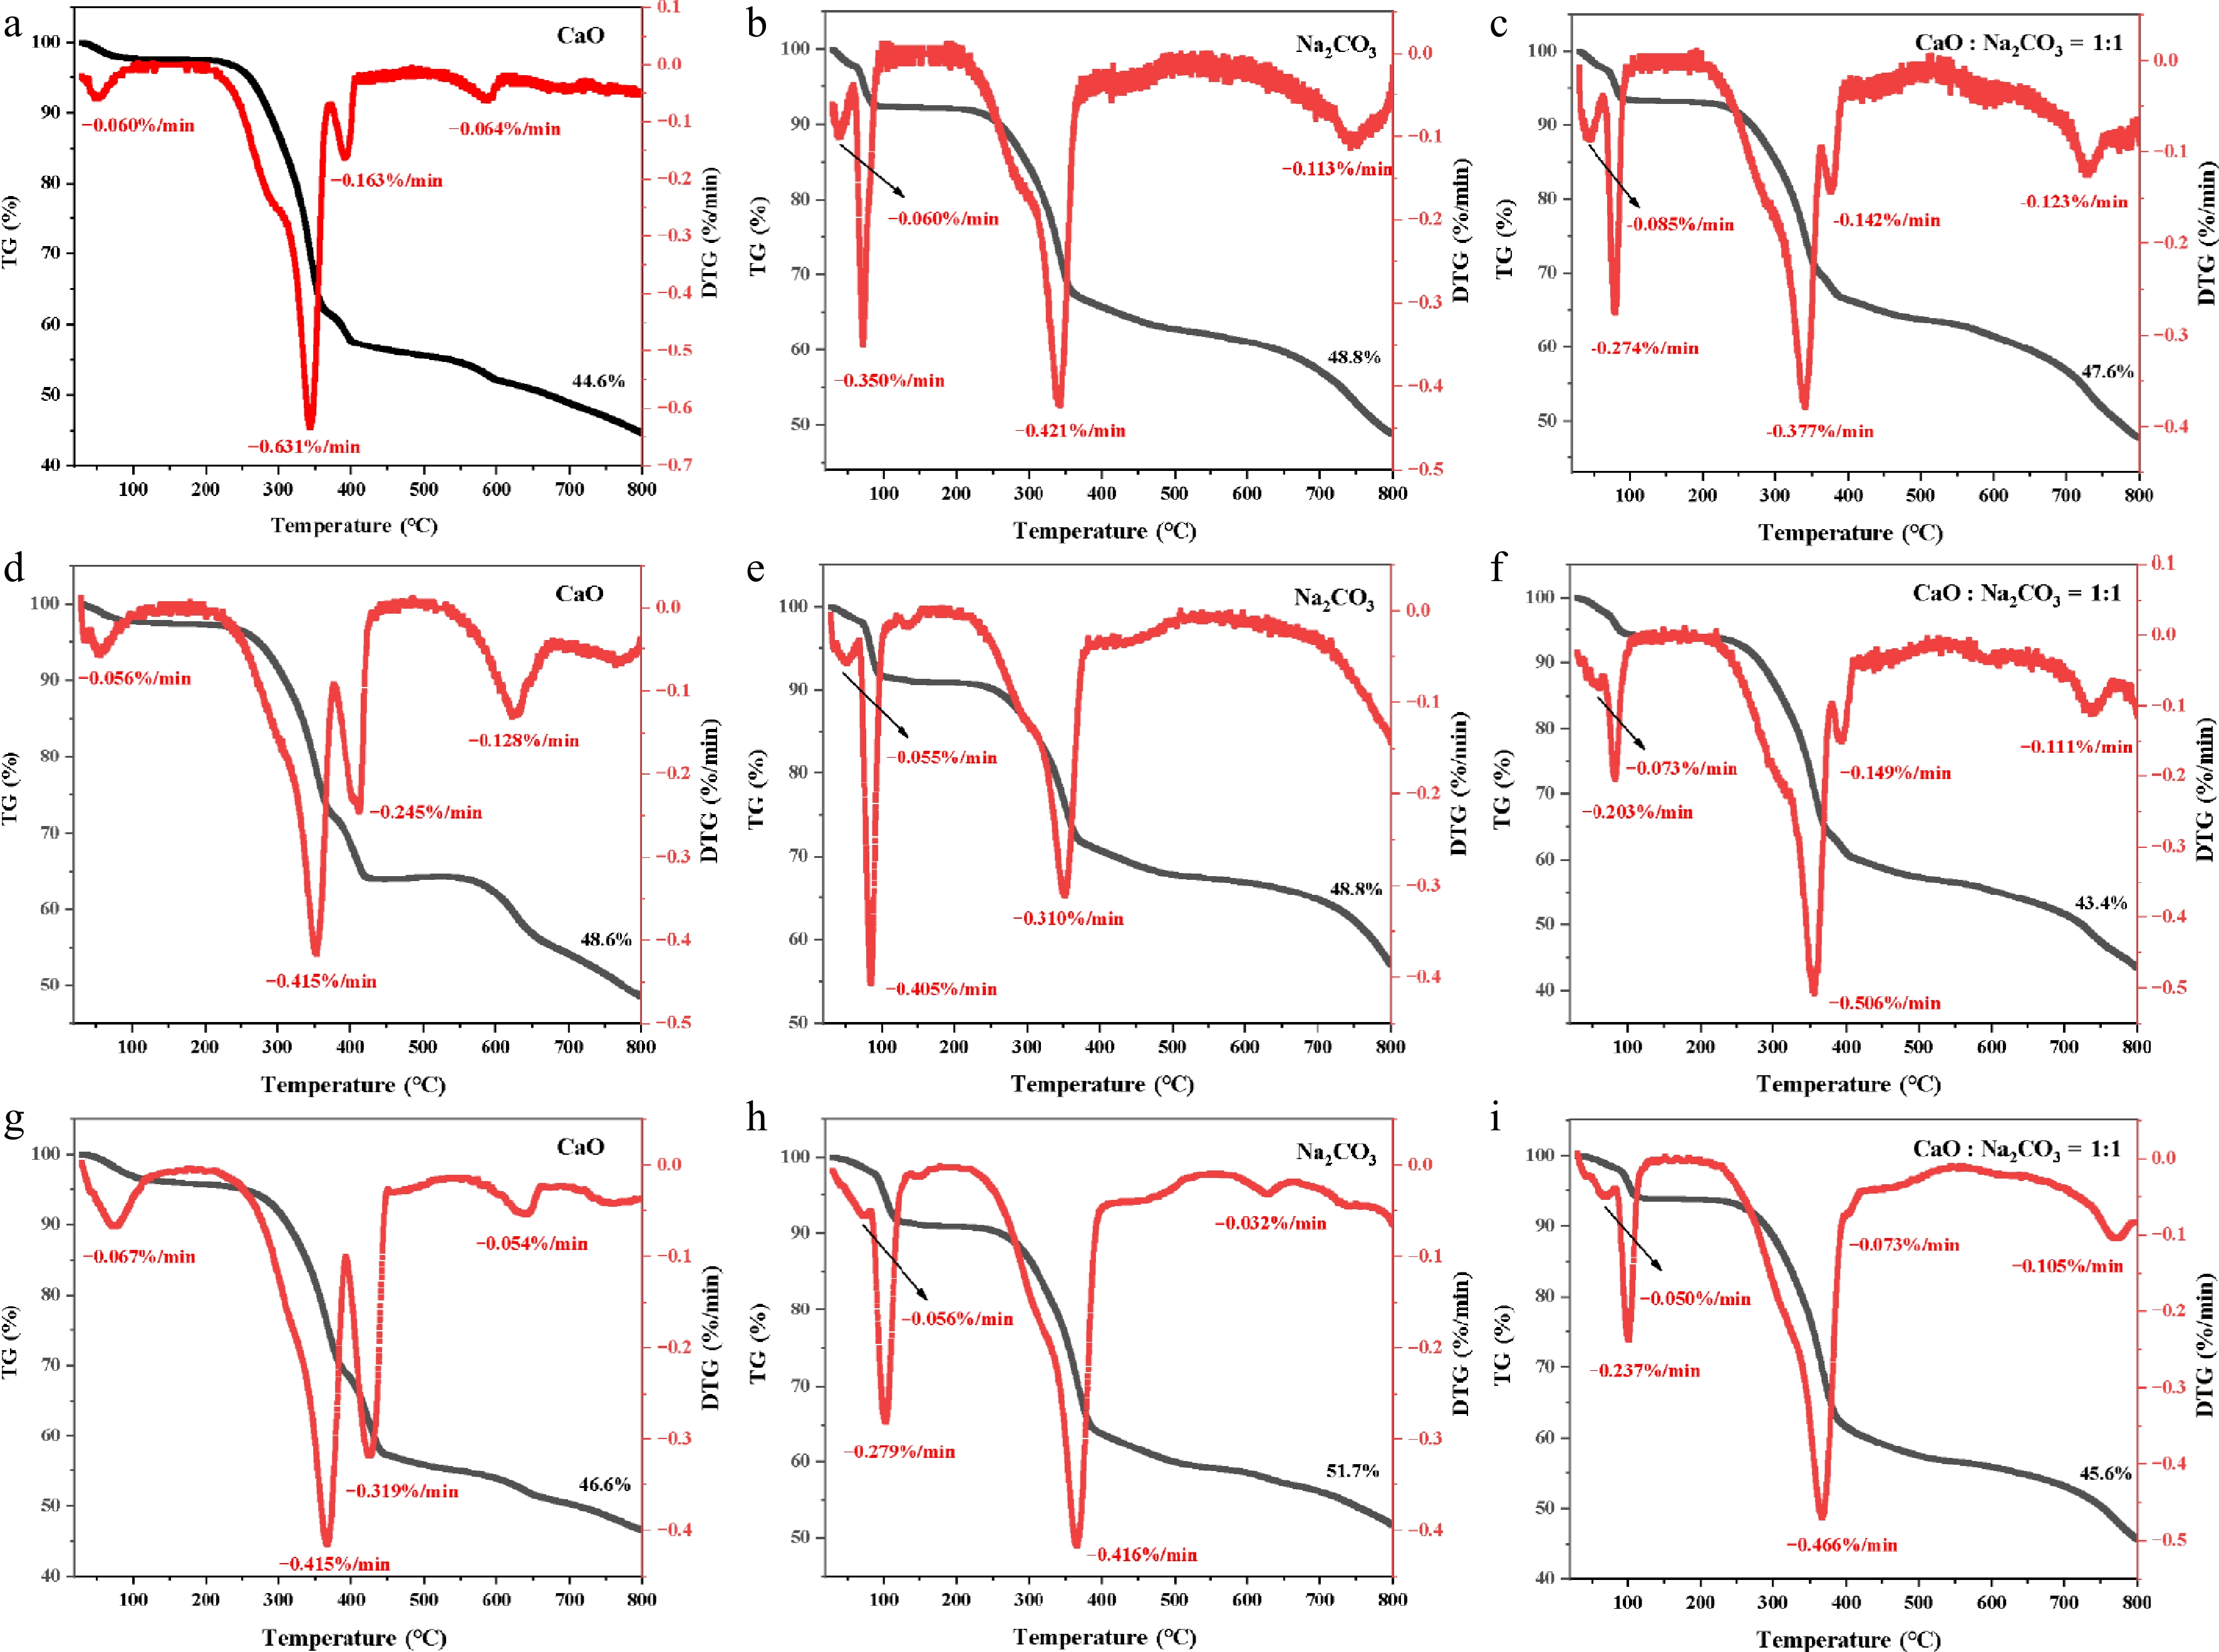
Figure 3.
TG and DTG curves of bagasse and catalyst: (a) CaO, 5 °C/min; (b) Na2CO3, 5 °C/min; (c) CaO : Na2CO3 = 1:1, 5 °C/min; (d) CaO, 10 °C/min; (e) Na2CO3, 10 °C/min; (f) CaO : Na2CO3 = 1:1, 10 °C/min; (g) CaO, 20 °C/min; (h) Na2CO3, 20 °C/min; (i) CaO : Na2CO3 = 1:1, 20 °C/min.
The first stage occurs between room temperature and approximately 200 °C. During this stage, drying, dehydration, and volatilization of small-molecule impurities occurs. These are primarily physical changes. Du et al.[22] investigated the pyrolysis properties of camphor wood and pure glycerol mixtures using TG/DSC-MS. The results showed that water was released during the early stages of pyrolysis. Furthermore, the peak in the first stage might also be caused by the absorption of moisture from the atmosphere by the biomass. Using a CaO catalyst, the first weight loss peak appears in the DTG at approximately 49, 55, and 73 °C at heating rates of 5, 10, and 20 °C/min, respectively. The first and second weight-loss peaks were observed in the DTG of the Na2CO3 catalyst. The first weight loss peak was reached at temperatures of approximately 38, 51, and 72 °C at heating rates of 5, 10, and 20 °C/min, respectively. The second weight loss peak was reached at approximately 72, 85, and 102 °C. DTG showed the first and second weight loss peaks when using a mixed catalyst (CaO : Na2CO3 = 1:1). The first weight loss peak occurred at approximately 44, 59, and 69 °C at heating rates of 5, 10, and 20 °C/min, respectively. The second weight loss peak occurred at approximately 79, 83, and 101 °C. In the first stage of pyrolysis, the peak DTG temperature increased with the heating rate. The use of a Na2CO3 catalyst significantly increased the weight loss in the first stage, splitting one peak into two.
The second stage occurs between 200 °C and approximately 550 °C and is the main weight loss stage for bagasse. The CaO catalyst showed the second and third weight loss peaks. The second weight loss peak occurred at approximately 343, 353, and 366 °C at heating rates of 5, 10, and 20 °C/min, respectively. The third weight loss peak occurred at approximately 393, 410, and 425 °C. Using the Na2CO3 catalyst, the third weight loss peak occurred at approximately 341, 352, and 367 °C for heating rates of 5, 10, and 20 °C/min, respectively. The third and fourth weight loss peaks appeared in the DTG profile of the mixed catalyst (CaO : Na2CO3 = 1:1). The third weight loss peak occurred at approximately 341, 356, and 366 °C at heating rates of 5, 10, and 20 °C/min, respectively. The fourth weight loss peak occurred at approximately 377, 394, and 407 °C. During pyrolysis, hemicellulose is easily degraded, with a temperature range of 220–315 °C, and the main product produced was CO2. The degradation temperature range of cellulose was 315–400 °C, and the main product was CO. Lignin has an aromatic ring structure and a wide degradation temperature range of 200–900 °C, with H2 and CH4 as the main products[23]. Bagasse is pyrolyzed under different conditions, and the DTG peaks are between 340–370 °C, mainly cellulose pyrolysis. Peng et al.[24] combined particle swarm optimization with TG-FTIR-GC/MS technology to pyrolyze pine sawdust. They found that the DTG peaks occurred at approximately 350 °C, attributable to the rapid decomposition of its cellulose-dominated structure.
Compared to the CaO catalyst alone, the addition of the Na2CO3 catalyst was found to diminish the fourth weight-loss peak. Pyrolysis produces small molecule gases, alcohols, acids, and phenols. Decarboxylation reactions may occur during pyrolysis to produce CO2 and CO, and undergo demethylation of methoxy groups to produce CH4. Lu et al.[25] conducted catalytic pyrolysis experiments on poplar wood using CaO and found that the content of most heavy products (e.g., anhydrous sugars and phenols) was reduced, and acid removal was significant. The production of hydrocarbons, cyclopentanone, and methane was also promoted, and the contents of the four light products (acetaldehyde, acetone, 2-butanone, and methanol) increased. The second and third weight loss peaks of DTG using a CaO catalyst may be due to CaO reacting with acids during pyrolysis to form calcium carboxylate or capturing CO2 to form CaCO3. As pyrolysis proceeded, the temperature increased, causing calcium carboxylate and CaCO3 to decompose and release CO2. The fourth weight loss peak of DTG using mixed catalysts was not obvious, probably because the addition of Na2CO3 strengthened the branched structure of hemicellulose. This reduces the possibility of a primary pyrolysis reaction and promotes a high-temperature secondary reaction.
The third stage occurred above 550 °C, where the last weight-loss peak appeared in the DTG curve. This was the slow pyrolysis stage, during which ash and fixed carbon were produced from the residue. For the CaO catalysts with heating rates of 5, 10, and 20 °C/min, the weight loss peaks occurred at approximately 589, 626, and 643 °C, respectively. Using the Na2CO3 catalyst, weight loss peaks occurred at approximately 745 °C and 626 °C at 5 °C/min and 20 °C/min, respectively. The weight loss peak was not evident at 10 °C/min. Using a mixed catalyst (CaO : Na2CO3 = 1:1), weight loss peaks occurred at approximately 731, 737, and 772 °C at heating rates of 5, 10, and 20 °C/min, respectively. As the heating rate increased, there was a small shift in the pyrolysis temperature interval towards higher temperatures, and thermal hysteresis occurred. Peng et al.[24] found that the TG and DTG curves of wheat straw and pine sawdust moved towards higher temperatures as the heating rate increased. At higher heating rates, the core temperature of the sample particles is usually much lower than the surface temperature, resulting in a thermal hysteresis effect.
Bagasse pyrolysis, simulation results, and discussion
-
Si et al.[26] constructed a model based on the simplified structure of a cellulose β-D-glucose monomer unit. The same idea was adopted in this study to simulate the bagasse pyrolysis using a combination of three monomer molecular models (D-glucose, D-xylose, and somberol alcohol). As can be seen in Fig. 4a, the bagasse model at 1,000 K hardly experienced any bond breaking, and the pyrolysis effect was not obvious. Therefore, the temperature must be further increased for the bagasse model. When the temperature was increased to 1,300 K, the molecular groups in Fig. 4b started to exhibit chemical bond breaking. At this temperature, the generation of small molecule radicals (such as H radicals [H·]) and gas products (including water molecules [H2O]), can be observed. These results indicate that an increase in temperature has a substantial impact on the pyrolysis reaction of bagasse. This process makes it easier for intermolecular chemical bonds to break down, which in turn leads to the generation of more small-molecule products. This finding is in line with the kinetic theory of pyrolysis, which states that the intensification of molecular thermal motion at high temperatures leads to an increased probability of chemical bond breakage.
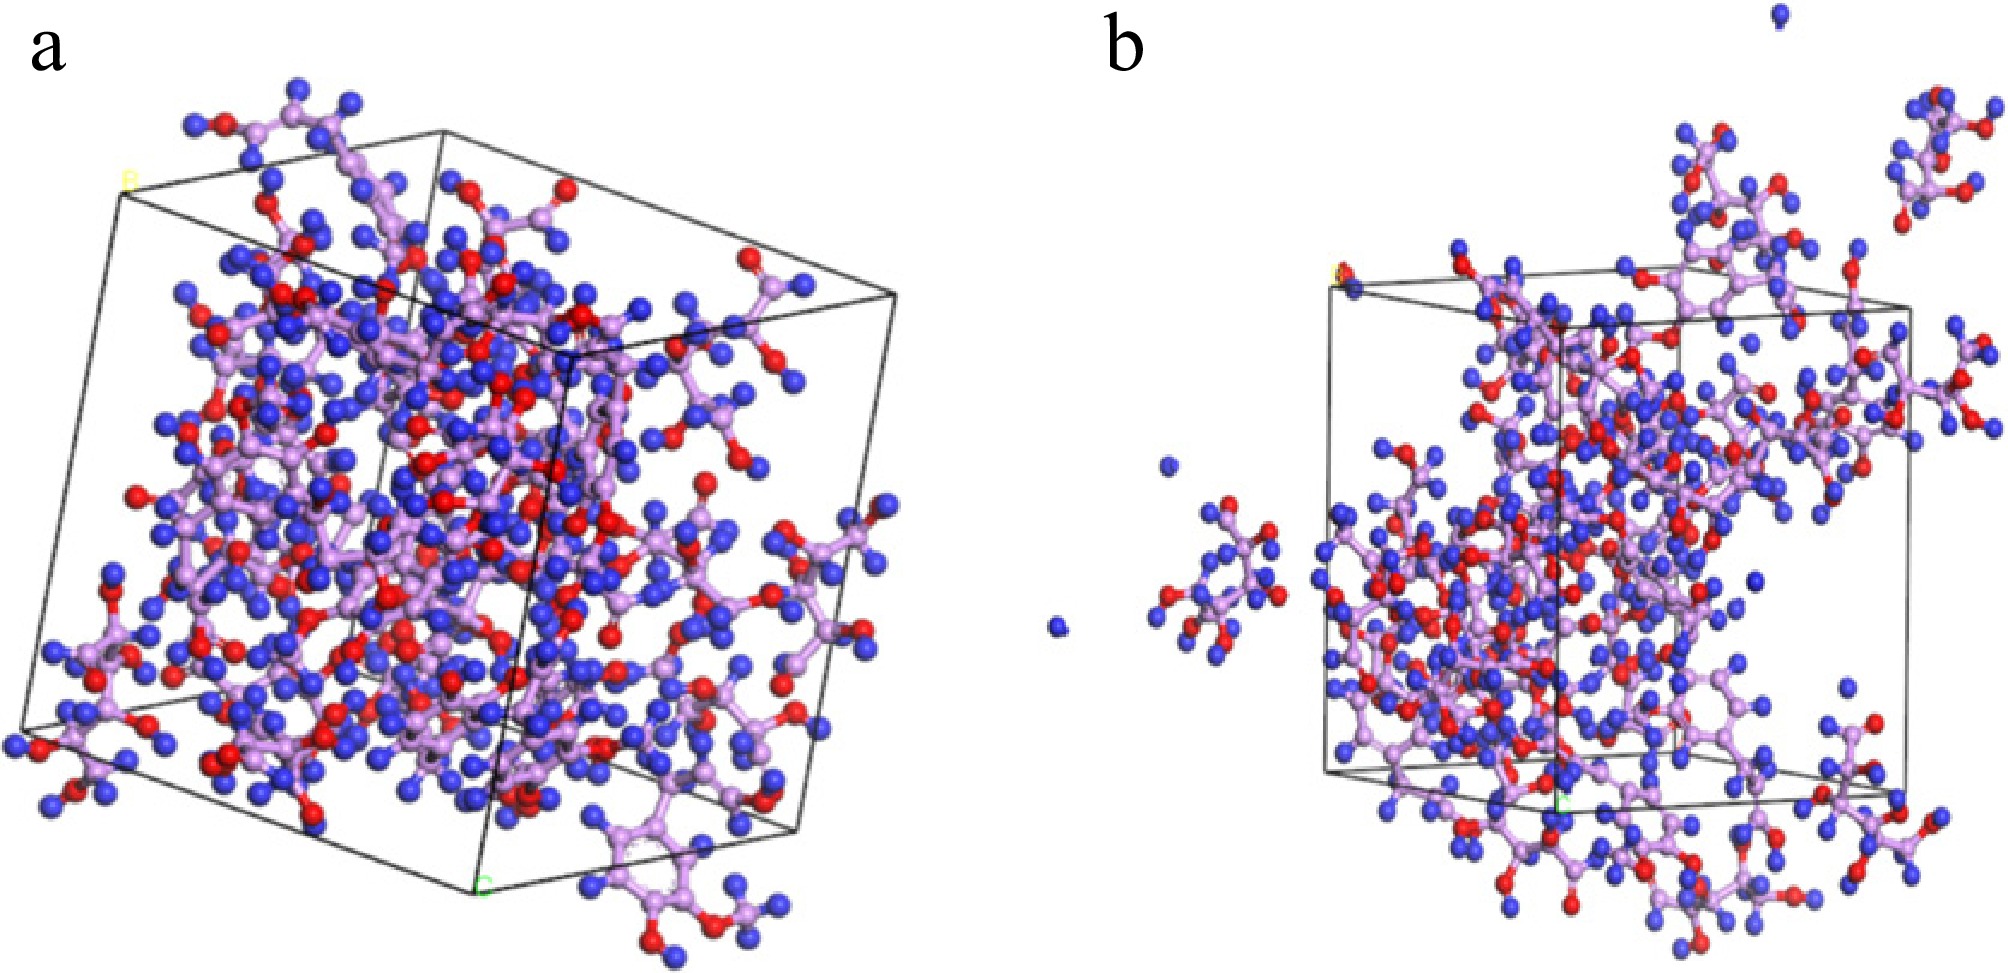
Figure 4.
Model A at (a) 1, 000 K, and (b)1,300 K.
Based on the results of previous experiments conducted at temperatures ranging from 1,000 to 1,300 K, only a limited number of molecular group-breakage phenomena were observed. The break rate is less than 5%, and the temperature must continue to increase. According to the transition state theory and Arrhenius equation, the reaction rate constant k is exponentially related to the temperature T. When the temperature interval is extremely small (for example, 100 K), the change in reaction rate may not be significant enough to accurately capture the transition characteristics of the key reaction stages. Therefore, a temperature interval of 500 K was chosen for subsequent experimental simulations. The starting pyrolysis simulation temperature was set to 1,000 K, with subsequent simulations continuing at 1,500, 2,000, and 2,500 K. The simulation results are shown in Fig. 5, and the simulation result statistics are shown in Table 2.

Figure 5.
Bagasse model at (a) 1,500 K, (b) 2,000 K, and (c) 2,500 K.
Table 2. Product statistics at four pyrolysis temperatures for model A.
Number of molecules H· O· OH· H2O CO2 C1 C2 C2 C4 C5 C6 C7 C8 C9 SRS 1,000 K 0 0 0 0 0 0 0 0 0 9 14 0 0 0 9 1,500 K 46 5 15 6 0 2 4 6 2 8 9 0 0 0 9 2,000 K 143 65 24 0 1 8 15 12 5 4 4 0 0 1 8 2,500 K 251 117 12 1 0 15 26 13 4 1 3 0 0 1 7 At the simulated temperature of 1,500 K, C6 was 9, with three D-glucose molecules; C5 was 8, with one D-xylose molecule; and the six-membered ring structure (SRS) was 9, without somberol alcohol. Simultaneously, 46 H radicals (H·), five O radicals (O·), 15 OH radicals (OH·), and six H2O molecules were generated. Simulated at 2,000 K, C6 was reduced to 4, and no longer contained D-glucose; C5 was also reduced to 4, and no longer contained D-xylulose; and SRS was reduced to 8, and no longer contained somberol alcohol. Conversely, when H· increased to 143, O· increased to 5, OH· increased to 24, and H2O decreased to 0. At a simulated temperature of 2,500 K, C6 decreased to 3, C5 decreased to 1, and the SRS decreased to 7. All these exhibit hydrogen and hydroxide bond breaks. Conversely, H· increases dramatically to 251, O· increases to 117, and OH· decreases to 12, with H2O being regenerated.
The first chemical process in biomass thermal utilization technology is primary devolatilization. The biomass decomposes spontaneously when heated at this stage, releasing a mixture of light non-condensable gases (CO, CO2, H2O, H2, and C1−C3 oxygenates (OXY)) and producing intermediate oils (benzene, toluene, xylene, phenol, dimethylphenol, etc.). As the temperature of the pyrolysis simulation increased, the results showed that both H· and O· are increased significantly, and H2O and CO2 were produced. OH· increased in the low-temperature section and decreased in the high-temperature section, indicating that O-H is easily broken down at high temperatures. C1, C2, and C3 increased continuously, while C4 increased in the low-temperature section and decreased in the high-temperature section. Finally, it was mostly a mixture of C1, C2, and C3. These are light non-condensable gases in the primary pyrolysis stage. As the pyrolysis simulation temperature increased, the benzene ring structure of somberol alcohol broke fewer bonds and more benzene derivatives were formed, which became intermediate oils.
From the results of the C5, C6, and SRS, the carbon chain of D-glucose breaks easily at 1,500 K, the carbon chain of D-xylose begins to break, and the SRS of somberol alcohol becomes difficult to break. At the high temperature of 2,000 K, the carbon chain of D-glucose breaks more easily and is mostly completely pyrolyzed. The carbon chain of D-xylose also breaks easily, and part of it is completely pyrolyzed. The structure of the benzene ring of somberol alcohol starts to break, but the bond breaking is less pronounced. As the temperature increased to 2,500 K, D-glucose and D-xylose were almost completely pyrolyzed, while somberol alcohol was partially pyrolyzed. From 1,000 to 2,000 K, the carbon-carbon bond breakage of D-glucose and D-xylose was the most obvious. From 2,000 to 2,500 K, the carbon-carbon bond breaking of D-glucose and D-xylose was weakened. At the same time, C5, C6, and SRS were not fully broken down. The results showed that as the temperature increased, the long carbon chains broke more easily than the benzene rings. This generates more H·, O·, and C1, C2, and C3 mixes, which suggests that temperature is very important in the pyrolysis process. However, a charring cascade reaction may occur when the temperature is too high, which in turn inhibits subsequent bond breaking. According to the statistical results, the proportion of simple carbon chains in C1 and C3 was approximately 1/3 at 2,500 K. The proportion of simple carbon chains in C2 was also approximately 1/3 at 2,500 K. As can be seen from the charring cascade reaction, the bound glucose monomer decomposes into a series of increasingly difficult-to-decompose structures and non-condensable gases, which inhibits subsequent bond cleavage[27].
As can be seen in Table 2, Model A has undergone more complete pyrolysis after being warmed from 1,000 to 2,000 K. H· and O· increase, while C5 and C6 decrease significantly. However, the SRS changed less. It was hypothesized that there may be some inhibition between the components of the bagasse model during co-pyrolysis. Three individually polymerized models of 14 glucose, nine xylose, and nine somberol alcohol (SA) were designed and simulated for pyrolysis experiments at 2,000 K–100 ps. The results of the individual pyrolysis of the three polymerized models were combined and can be viewed as the simulation results obtained from the multicomponent pyrolysis model. The multicomponent pyrolysis model is a kinetic model used to describe the pyrolysis process of complex materials[28]. It is assumed that the material consists of multiple independent reactions, each of which corresponds to a specific chemical composition or reaction path. Each reaction follows Arrhenius' law and has kinetic parameters, including a prefactor, the number of reaction stages, and activation energy. In the multicomponent cleavage model, it is assumed that each reaction proceeds independently without interfering with the others.
The pyrolysis results of the three polymerized models were compared with those obtained by pyrolyzing Model A under the same conditions. The simulation results are shown in Fig. 6 and the pyrolysis results are presented in Table 3. As shown in Table 3, the total amounts of H· and O· in the three polymerized models (glucose, xylose, and SA) were higher than the results of Model A pyrolysis. The total amount of SRS in SA when pyrolyzed alone was less than the results of Model A pyrolysis. This indicates the presence of inhibition between the components during the co-pyrolysis process. This may be due to the interactions occurring between different reactions during the multi-component pyrolysis process. Examples include competitive reactions, catalytic reactions, and side reactions.
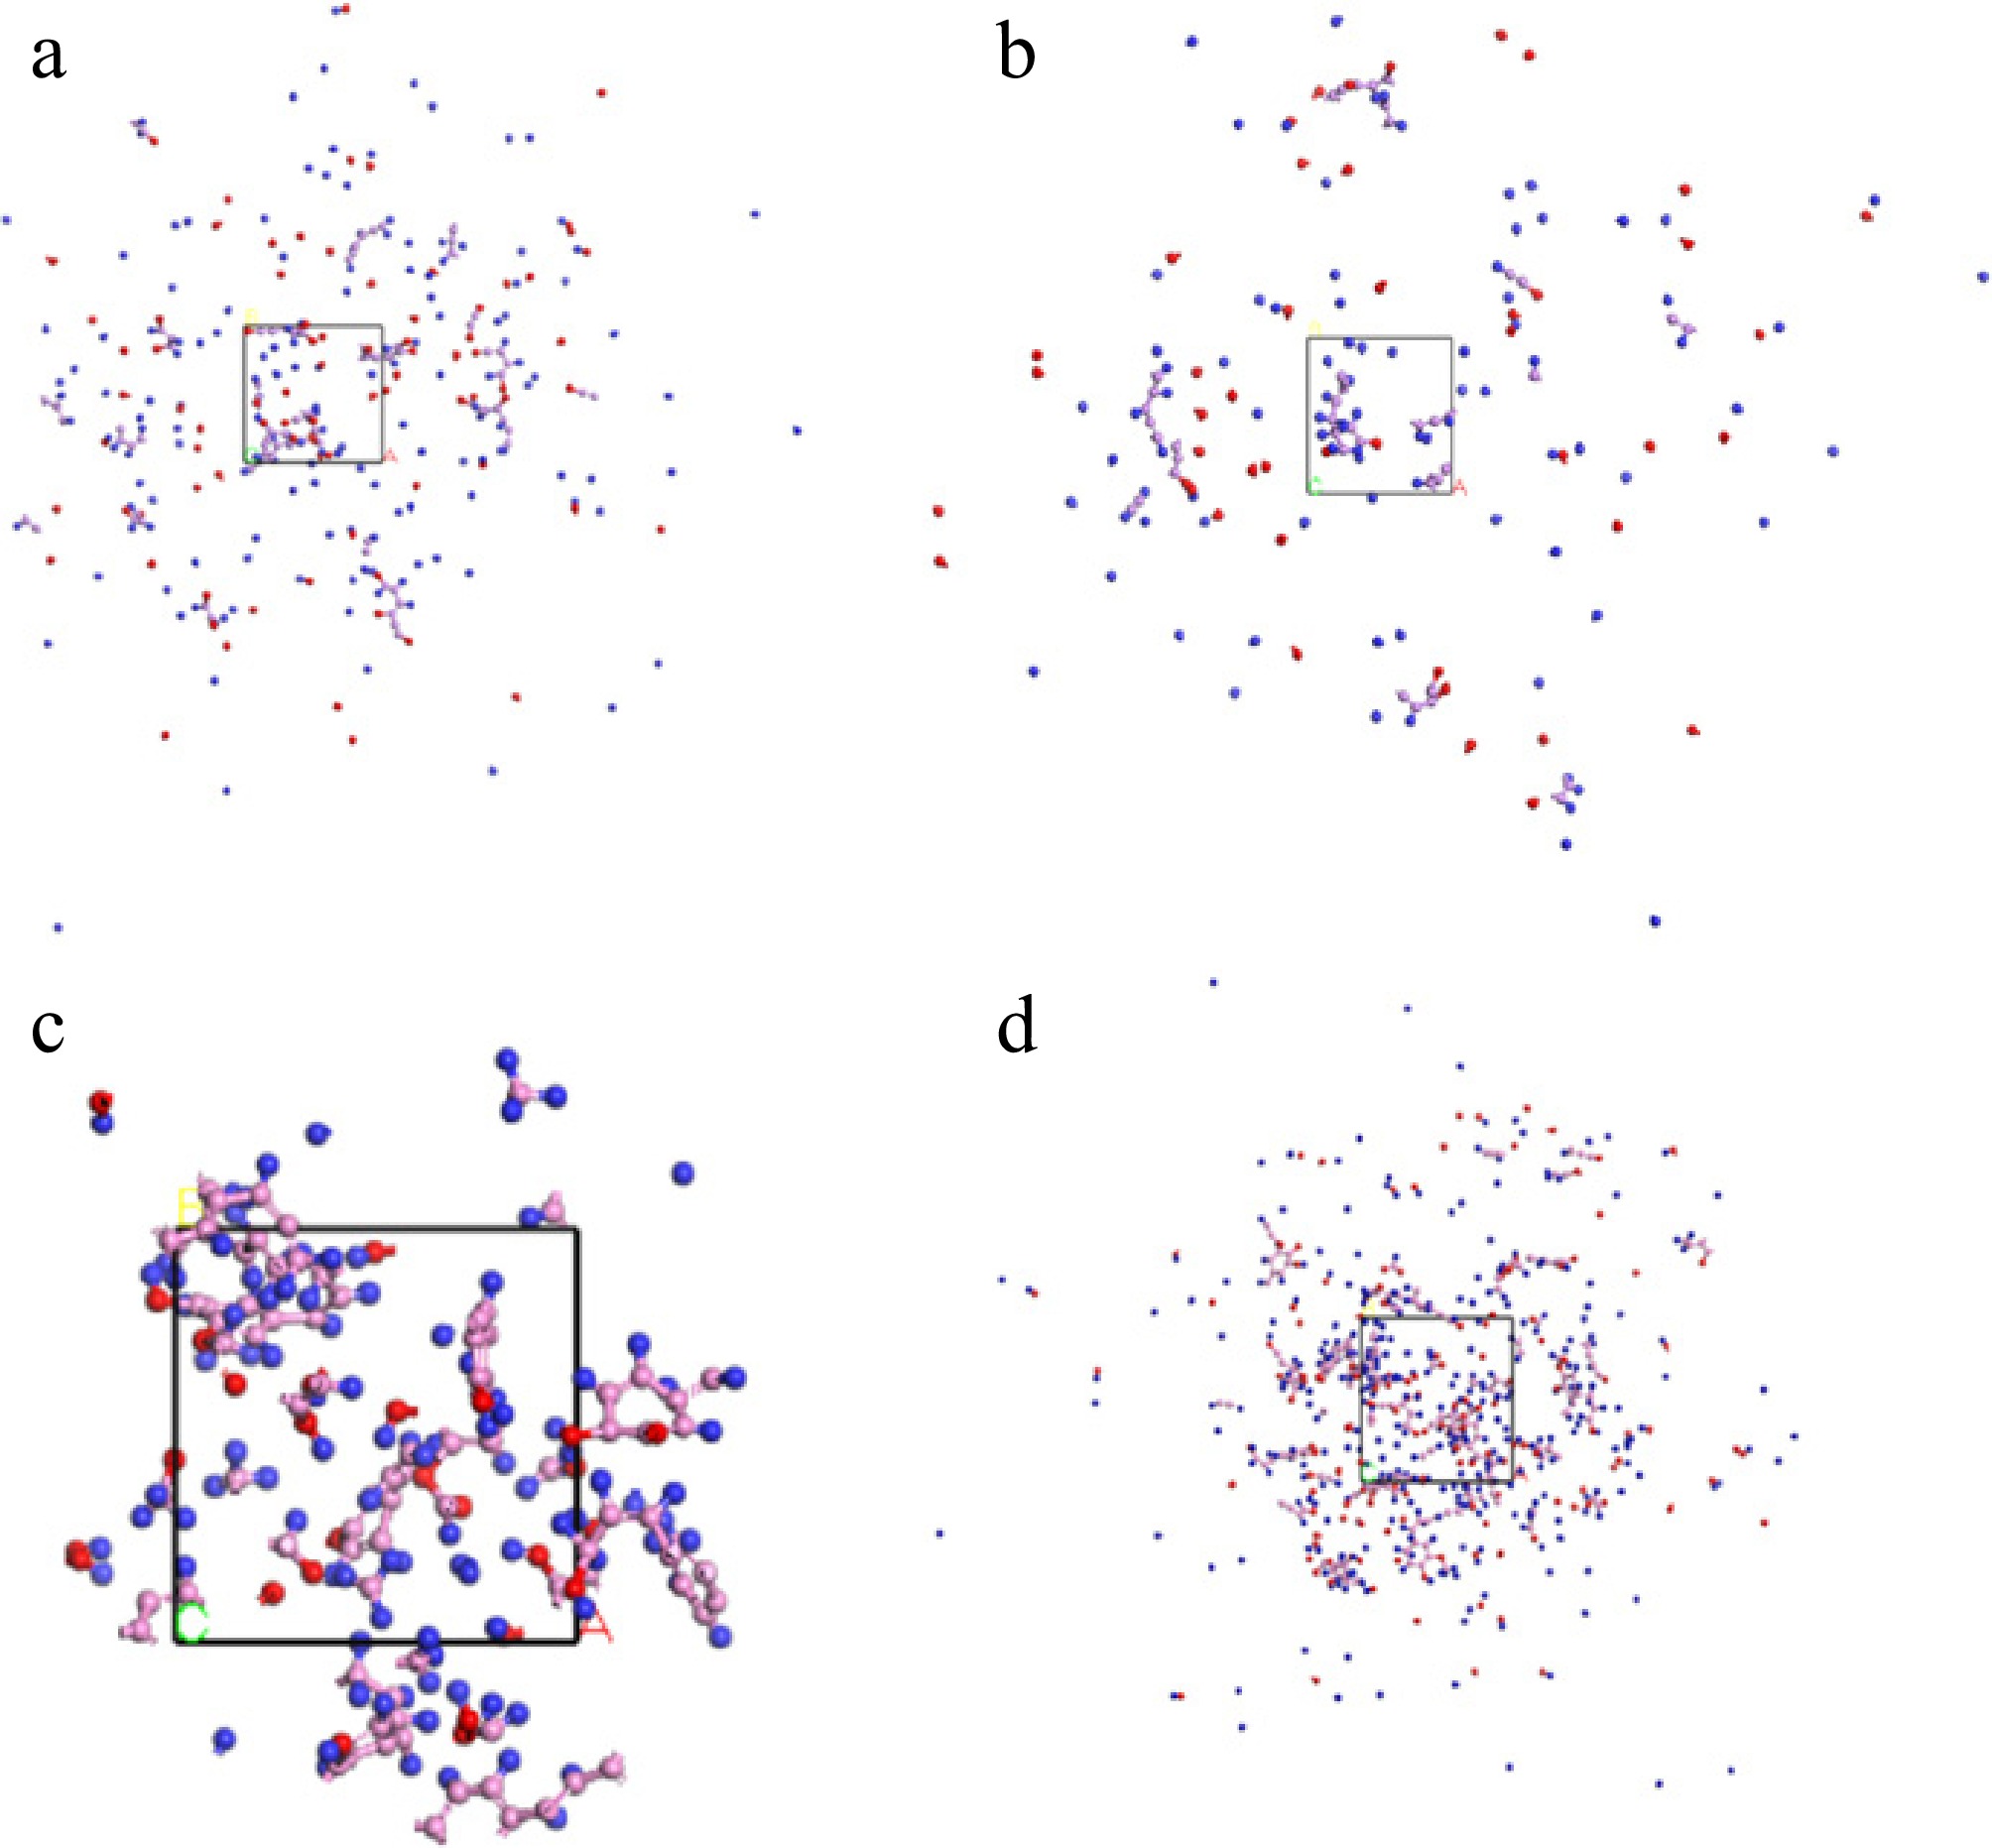
Figure 6.
(a) Glucose model; (b) Xylose model; (c) SA model; (d) Model A.
Table 3. Pyrolysis results of different models at 2,000 K.
Number of molecules H· O· OH· H2O CO CO2 C1 C2 C3 C4 C5 C6 C7 C8 C9 SRS Glucose 113 51 6 0 1 0 1 5 4 3 0 8 0 0 0 0 Xylose 62 36 2 0 0 0 1 2 4 0 4 0 0 0 0 0 SA 26 7 5 0 0 0 8 3 1 3 1 2 1 0 0 5 Total 201 94 13 0 1 0 10 10 9 6 5 10 1 0 0 5 Model A 143 65 24 0 0 1 8 15 12 5 4 4 0 0 1 8 The distribution of gaseous products from the pyrolysis of bagasse alone is presented in Table 4. CO accounted for 37.51% of these products, originating from the decarbonylation reaction of cellulose and hemicellulose (e.g., breaking glycosidic bonds to generate levoglucan, followed by decarbonylation). This reflects the high oxygen content of the bagasse. The H2 generation pathway primarily originates from the cleavage of C-H and O-H bonds within the cellulose and hemicellulose molecules[29,30]. The absence of catalysis results in low H2 selectivity (12.09% vs 15%+, after catalysis) and the presence of 25.35% light hydrocarbons, which indicates uninhibited side reactions. It is suggested that an increase in H2 yield can be achieved by the alkaline catalyst through directional modulation of the reaction pathway, compared to the low H2 selectivity of the uncatalyzed system. Additionally, the volatile fraction underwent secondary condensation within the biomass particles (as shown by the accumulation of debris in the molecular simulation in Fig. 4a), leading to an increase in condensable organic matter.
Table 4. Gas product of separate pyrolysis of bagasse.
Product H2 CO2 CO CmHn Content (%) 12.09 25.05 37.51 25.35 Analysis of catalytic pyrolysis gas phase products
-
The products obtained from bagasse via microwave-assisted catalytic pyrolysis include gas, liquid oil, and fixed carbon. The gas-phase products are the non-condensable portion of the vapor produced by bagasse through microwave-assisted catalytic pyrolysis. This section focuses on the gaseous products of microwave-assisted catalytic pyrolysis of bagasse using different catalysts (CaO and Na2CO3) at different ratios. The concentrations of the components H2, CO2, CO, and hydrocarbons (CmHn) were analyzed using a gas chromatography (GC), and the results are shown in Fig. 7. Figures 1−7 present referred concerning the data in Table 1. In the hydrogen-rich production process, the addition of catalysts can effectively control the pyrolysis process and improve the selectivity of the target products[31,32].

Figure 7.
Pyrolysis gas component concentration of bagasse under catalyst conditions (different ratios of CaO and Na2CO3).
As shown in Fig. 7a, the choice of catalyst has a significant impact on the H2 yield from the microwave-catalyzed pyrolysis of sugarcane bagasse. H2 is primarily produced through the cleavage of C=C and C-H bonds, as well as methoxy-O-CH3 bonds[33]. The yield of H2 when using CaO as the sole catalyst was 14.57%, which is notably higher than the 12.09% yield observed in the absence of a catalyst. Furthermore, the hydrogen evolution efficiency in this study exceeded that of slow pyrolysis of sugarcane bagasse. Al Arni[34] carried out slow pyrolysis of sugarcane bagasse by heating at a rate of 20 °C/min up to 480 °C, and their study reported a hydrogen yield of 9.6% in the pyrolysis products. CaO has been shown to significantly promote decarboxylation/deoxygenation reactions and enhance H2 generation[35]. Figure 7a shows that using Na2CO3 alone as a catalyst for pyrolysis significantly increased the H2 yield to 16.89%. Na2CO3 had an excellent deoxygenating effect on the reaction. Its smaller pore size facilitates deoxygenation reactions, such as the decarbonylation and decarboxylation of oxygen-containing precursors, which easily produce hydrocarbons. The C-H bonds of hydrocarbons break easily at high temperatures, resulting in the production of H2. The results of Zeng et al.[36] on the pyrolysis of bagasse is in line with this. Both catalysts were effective in promoting H2 generation as alkaline catalysts.
When a mixed catalyst (CaO : Na2CO3 = 1:3) was applied, the H2 yield reached 17.26%, which was significantly higher than the linear average of the individual catalysts ((14.57 + 16.89)/2 = 15.73%). This enhancement indicated a clear synergistic effect between the two components. The use of the mixed catalyst promoted the water-gas shift reaction, facilitating the conversion of CO to H2 while simultaneously suppressing the formation of by-products such as light hydrocarbons. Moreover, the CaO : Na2CO3 = 1:3 catalyst exhibited a distinct fibrous microporous network structure, characterized by an increased specific surface area, which enhanced the mass transfer efficiency and improved the catalytic activity. The synergistic effect of the CaO/Na2CO3 mixed catalyst was comprehensively confirmed through both experimental data (elevated H2 yield and reduced by-product formation) and structural characterization (emergence of new phases and structural optimization). Additionally, Fodah et al.[37] investigated the co-pyrolysis of sugarcane bagasse and microalgal poultry manure residue in a 1:1 ratio. The results indicate that the gas yield was 29.90% in the absence of a catalyst. When the Fe biochar was used, the gas yield decreased slightly to 27.89%. When HZSM-5 was used as the catalyst, the gas yield increased to 31.0%. However, when CaO was used, the gas yield significantly increased to 39.10%. Moreover, CaO was found to promote decarboxylation and deoxygenation reactions, leading to the formation of non-condensable gases. Waheed and Williams[38] found that when 10 wt.% Ni-dolomite was used as a catalyst for the catalytic pyrolysis of sugarcane bagasse, and the hydrogen content reached 24.7 vol.%. The hydrogen evolution efficiency is compared to previous reports, as shown in Table 5. However, the price of CaO is
${\$} $ ${\$} $ ${\$} $ ${\$} $ Table 5. The comparison of hydrogen evolution efficiency.
Raw material Catalysts H2 content Ref. Bagasse and microalgal poultry manure residue Fe biochar 27.89 vol.% [37] Bagasse and microalgal poultry manure residue HZSM-5 31.0 vol.% [37] Bagasse 10 wt.% Ni-dolomite 24.7 vol.% [38] Bagasse Ni/Al2O3 24.3 vol.% [42] Bagasse CaO 14.57 vol.% This work Bagasse Na2CO3 16.89 vol.% This work Bagasse CaO : Na2CO3 = 1:3 17.26 vol.% This work An analysis of the five cycles of the CaO and Na2CO3 catalyst systems are presented in Table 6. The experimental results revealed that the H2 content decreased slightly during the first three cycles, from 17.3% to 15.6%. After five cycles, the H2 content decreased further to 11.5%, indicating a slight reduction in the catalytic activity of the catalyst system. The primary cause of this decline is the accumulation of carbonaceous deposits or organic by-products on the catalyst surface during the reaction process, which leads to coverage of active sites and pore blockage. Although partial activity recovery can be achieved through carbon combustion during the regeneration process, repeated redox cycles can cause the catalyst to sinter and lower the overall catalytic activity. Nevertheless, despite multiple regenerations, the H2 content remained relatively high, suggesting that the CaO and Na2CO3 catalyst systems exhibited excellent cyclic performance. Therefore, CaO and Na2CO3 are significantly more cost-effective than Ni-based catalysts.
Table 6. Effect of cycle times on CaO and Na2CO3 catalyst systems.
Number of cycles 1 2 3 4 5 H2 content (%) 17.3 16.8 15.6 11.9 11.5 The variation in the CO2 concentration of the pyrolysis products is shown in Fig. 7b. CO2 is produced through the decomposition and recombination of carbonyl (-C=O-) and carboxyl (-COOH) groups[39]. As Fig. 7b illustrates, the CaO catalyst is highly effective in producing CO2 from biomass pyrolysis, which is advantageous for reducing the CO2 yield and enhancing the quality of the pyrolysis gas products. The lowest CO2 yield (30.25%) was achieved when CaO was subjected to pyrolysis alone. The addition of Na2CO3 increased the CO2 yield because Na2CO3 decomposes easily at high temperatures to produce CO2. Li et al.[39] investigated the effects of adding large amounts of CaO on the yield of corn stover pyrolysis products and the release of non-condensable gases at different temperatures. Their results showed that almost all the CO2 produced during pyrolysis could be absorbed by CaO (CaO/C = 1) within the temperature range of 550–650 °C. As the ratio of CaO to Na2CO3 increased from 1:0 to 1:2, the release of CO2 in Fig. 7b gradually increased from 30.25% to 33.88%. An increase in the sodium content promoted the water-gas shift reaction, converting the generated CO into H2 and CO2. It has been demonstrated that the catalytic effect of Na2CO3 inhibits the formation of carbon monoxide (CO), methane (CH4), and ethylene (C2H4)[36]. Additionally, when the CaO : Na2CO3 ratio was 1:3, CO2 release decreased to 32.23%. For CO2, the optimum reaction ratio may be exceeded when sodium carbonate is present in excess. This weakens the ability of the catalytic system to promote the decarboxylation and CO conversion, which leads to a decrease in CO2 release.
The distribution of CO content in the pyrolysis gas products is shown in Fig. 7c. When the catalytic pyrolysis of bagasse was carried out using CaO and Na2CO3 alone, the CO contents released were 26.47% and 26.31%, respectively. This indicated that both substances promoted CO generation. Figure 7c shows that the lowest CO release value of 19.94% was achieved at a CaO : Na2CO3 ratio of 1:2. These results suggest that the combined effect of CaO and Na2CO3 reduces the CO content. During biomass pyrolysis, CO generation mainly originates from the fracture of carbonyl and carboxyl groups in the biomass, as well as the reduction reaction of CO2. Na2CO3 inhibits ether bond fracture and methoxyl elimination, which reduces CO generation[40,41]. Furthermore, when the CaO : Na2CO3 ratio was 1:3, the CO release increased to 23.45%. This may be due to the excessive amount of Na2CO3, which decreased the inhibition of CO. However, this value (23.45%) is still lower than the value obtained by using CaO (26.47%), and Na2CO3 (26.31%) alone. This indicated that the hydrogen production yield from sugarcane bagasse pyrolysis was enhanced under this catalytic system, with more pronounced inhibitory effects on hydrocarbon and CO formation. Na2CO3 primarily facilitates deoxygenation at low temperatures, whereas CaO effectively adsorbs CO2 (as low as 30.25% in Fig. 7b), and the two catalysts work synergistically to promote the water-gas shift reaction (CO → H2). Moreover, the relatively lower costs of CaO and Na2CO3 compared to transition metal catalysts, such as Ni, Fe, and Cu, further highlight their economic advantages.
The distribution of hydrocarbons resulting from the pyrolysis of bagasse is illustrated in Fig. 7d. The main source of hydrocarbons in biomass pyrolysis products is alkanes, which are formed during the initial cleavage of biomass macromolecules via a free radical mechanism. Alkanes can be converted to aromatic compounds in several ways, including secondary cleavage, hydrogenation, and arylation. The addition of CaO and Na2CO3 inhibited the generation of alkanes, which is closely related to their basic catalytic properties. The inhibitory effect of Na2CO3 (24.33%) was more significant than that of CaO (28.71%). As the proportion of CaO increases, a gradual decrease in the proportion of alkanes is observed in Fig. 7. The lowest hydrocarbon content (23.45%) was achieved at a ratio of 2:1 for CaO and Na2CO3. This indicates that CaO played a dominant role in the inhibition of alkanes during biomass pyrolysis. In addition, when the ratio of CaO : Na2CO3 catalyst is 1:3, the combined action of CaO and Na2CO3 leads to a significant suppression of hydrocarbon generation below 25.00% (the value is 24.90%). Tiwari & Vinu[42] conducted in-situ catalytic pyrolysis of sugarcane bagasse using a Ni/Al2O3 catalyst, achieving a hydrogen yield of 24.3 vol.% and a methane yield of 17 vol.%. The H2 content in this study is similar, but the CmHn compound is much higher, which further illustrates the advantages of the CaO and Na2CO3 catalysts.
Results of catalyst characterization
XRD results
-
XRD was used to characterize all catalysts after pyrolysis, and the results are shown in Fig. 8. All the catalysts retained the typical crystal diffraction peaks of the carriers. The results show that the characteristic diffraction peaks of cubic CaO crystals appear at 2θ = 32.20, 37.36, and 53.86° (CaO: PDF#98-000-0284). The characteristic diffraction peaks of the monoclinic Na2CO3 crystal system appear at 2θ = 30.15, 34.44, 35.24, 38.00, 41.11, and 48.20° (Na2CO3: PDF#99-000-2592). When CaO and Na2CO3 were mixed in equal proportions for the pyrolysis experiments, a characteristic diffraction peak corresponding to CaCO3 was observed at 2θ = 17.72°. It indicated that CaO reacted with Na2CO3 during pyrolysis. The peaks gradually increased as the proportion of CaO increased, and the diffraction peaks shifted to the right. The diffraction peaks of CaO (32.2°) and Na2CO3 (30.1°) in the mixed catalysts were significantly weakened, and a new diffraction peak appeared near 35°. Ca-Na composite carbonated may form in the catalysts, and the generation of new substances could enhance microwave absorption. When CaO occupied a higher proportion in the mixed catalysts (3:1, 2:1), the characteristic diffraction peaks of CaCO3 appeared at 2θ = 29.4° and 2θ = 29.0°. When the proportion of Na2CO3 was high (1:3, 1:2), the characteristic diffraction peaks of CaCO3 appeared at 2θ = 30.4° and 2θ = 30.0°. The decomposition reaction of Na2CO3 at high temperature released CO2, and CaO combined with CO2 to form CaCO3, which led to the appearance of new diffraction peaks. So the diffraction peaks of CaO (32.2°) and Na2CO3 (30.1°) weakened.
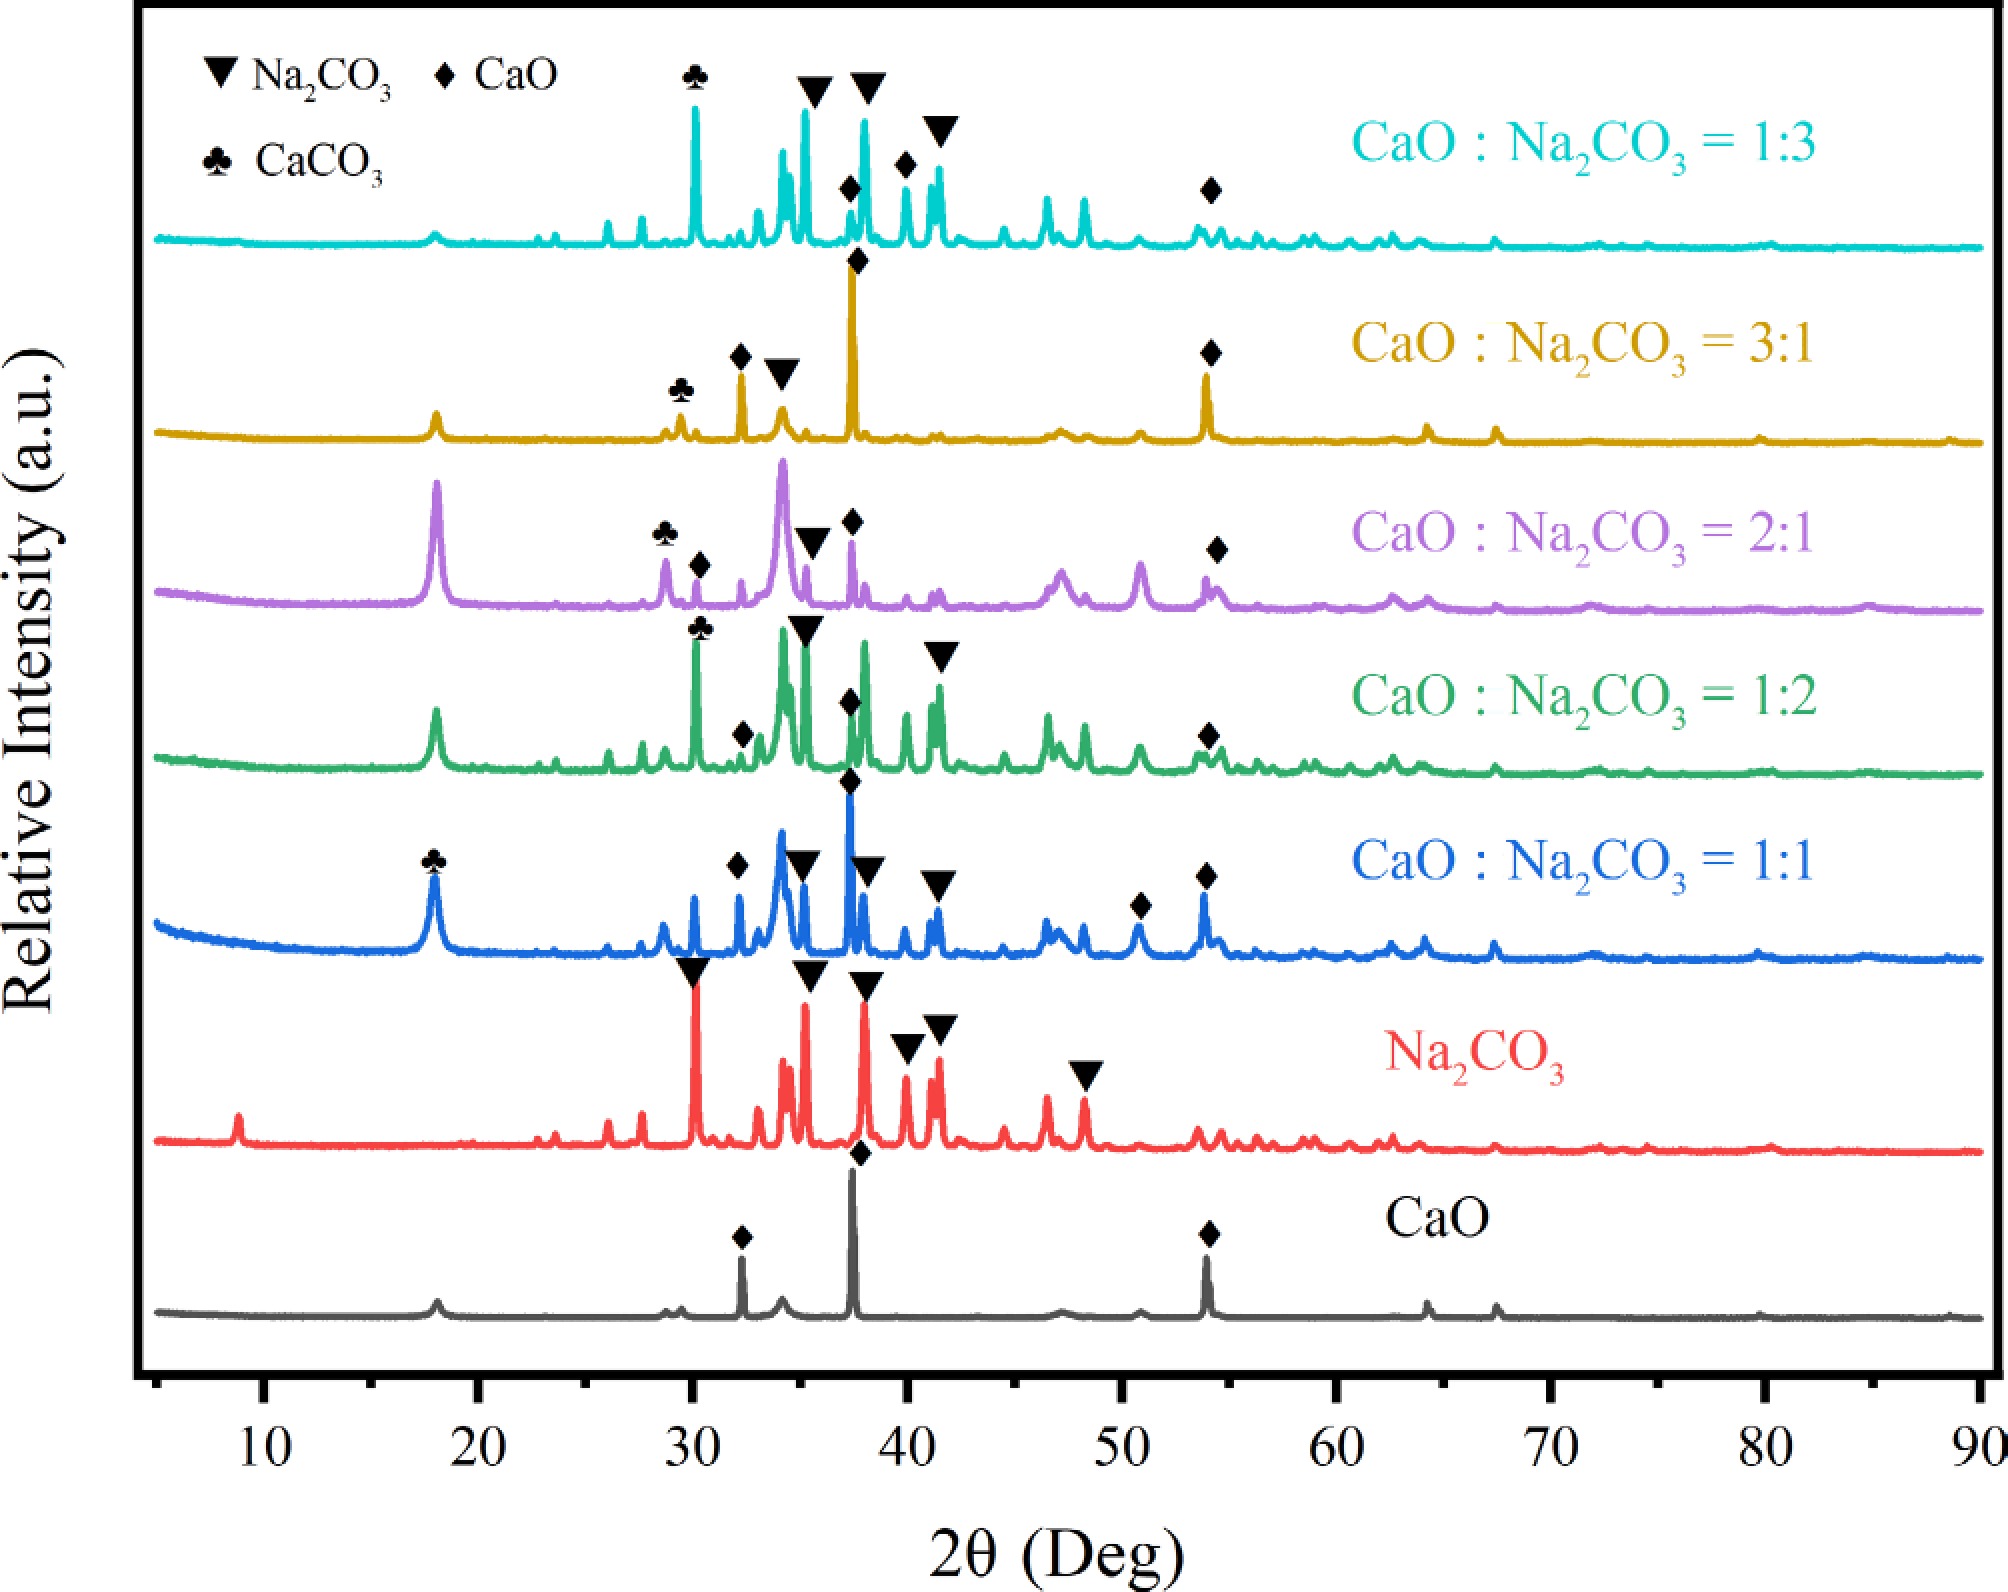
Figure 8.
XRD pattern of catalysts.
SEM results
-
The SEM characterization results of the Na2CO3 catalyst were shown in Fig. 9a−d. The Na2CO3 catalyst exhibited a typical loose porous structure, with some samples displaying melt recrystallization and obvious catalyst aggregation. During microwave pyrolysis, Na2CO3 formed a molten state and contained a high number of pores. It could promote the pyrolysis of biomass and the rapid release of volatile substances. The alkalinity of Na2CO3 could promote the depolymerization of lignin and the dehydration of cellulose. It inhibited the condensation reaction and reduced the densification of coke. Figure 9e−h showed the SEM characterization results for the CaO : Na2CO3 = 1:2 catalyst. Figure 9g showed a distinct fibrous-like structure with sharp edges and nanoparticles attached to the surface. It may be CaO or CaCO3, or granular aggregates of CaO or CaCO3. CaO catalyzes the lignin demethoxylation reaction by providing strongly basic sites to form linear molecules, which in turn self-assemble into a fibrous structure. In contrast, the CaO : Na2CO3 = 1:3 catalyst exhibited a cluster-like, interwoven network (j), (k), coexisting with elongated fibers (l), and had a rough surface with micrometer-sized pores (k). Combined with the previous analysis of the gas-phase products, the CaO : Na2CO3 = 1:3 catalyst exhibited the best catalytic effect, achieving the highest H2 yield (17.26%). Its unique structure demonstrated the excellent catalytic effect. Na2CO3 mainly promoted low-temperature decomposition and volatile release. CaO optimized the pore structure through CO2 adsorption and deoxidation reactions. These two synergistic effects effectively increased the H2 yield.
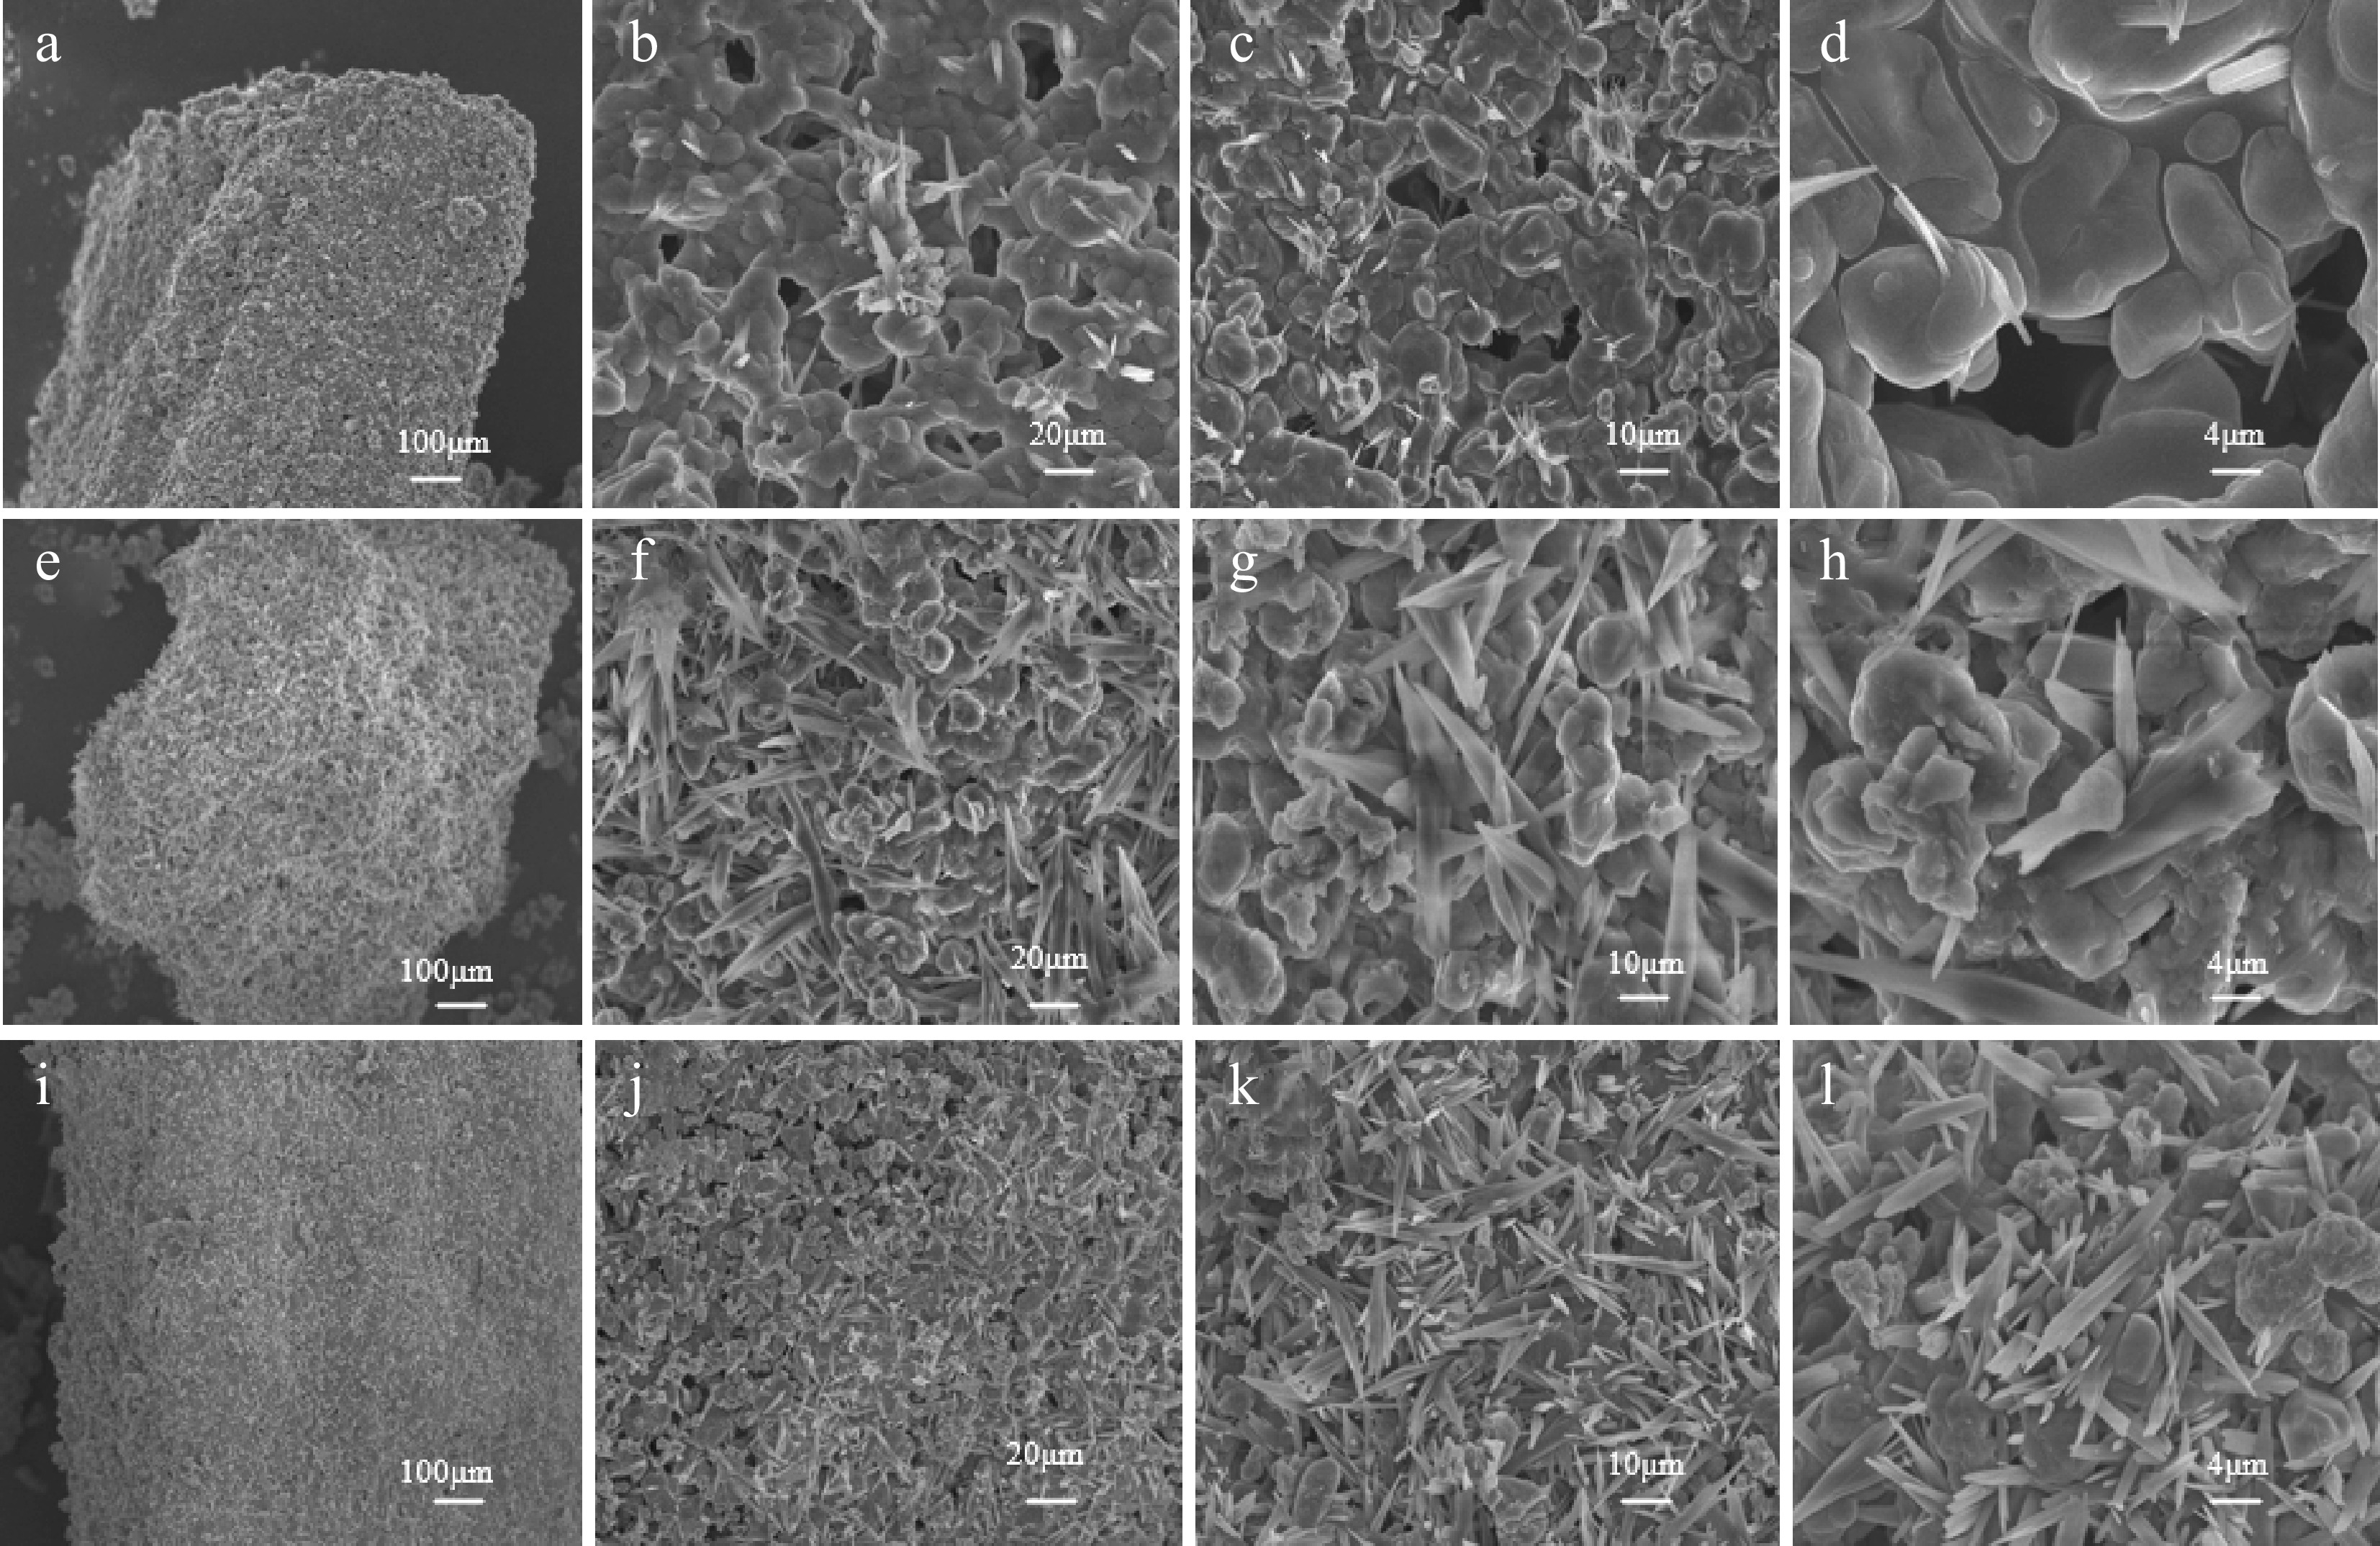
Figure 9.
SEM characterization of (a)–(d) Na2CO3 catalysts; (e)–(h) CaO : Na2CO3 = 1:2 catalysts; (i)–(l) CaO : Na2CO3 = 1:3 catalysts.
XPS results
-
The XPS spectra of the mixed catalysts (CaO : Na2CO3 = 1:3) are shown in Fig. 10. Analysis of Fig. 10a reveals that the C1s spectrum has peaks at binding energies of 284.8, 286.2, 287.8, and 289.2 eV, corresponding to C-C, C-O, C=O, and O=C-O, respectively[43]. Analysis of Fig. 10b reveals that the O1s spectrum exhibits peaks at binding energies of 531.2 and 532.2 eV, corresponding to C=O and C-O, respectively[44]. As shown in Fig. 10c, the characteristic peak of Na1s is observed at a binding energy of 1,071.4 eV, which is consistent with the Na+. Figure 10d shows the characteristic Ca2p3/2 peak at a binding energy of 346.8 eV, and the characteristic Ca2p1/2 peak at a binding energy of 350.3 eV, which corresponds to Ca2+. Combined with Fig. 10a and b, the binding energies of the C and O were analyzed. The bond connection corresponded to CO32− in Na2CO3. The characteristic peak corresponding to Ca-O does not appear in Fig. 10b, probably because of the low CaO content in the catalyst, resulting in a weak peak shape and insignificant detection. The presence of Na+ and Ca2+ in Fig. 10c and d indicates the presence of Na and Ca, which are consistent with the valence states of CaO and Na2CO3. The material primarily consists of C, O, Ca, Na, and N, with atomic percentages of 36.84%, 37.19%, 10.96%, 14.5%, and 0.51%, respectively.
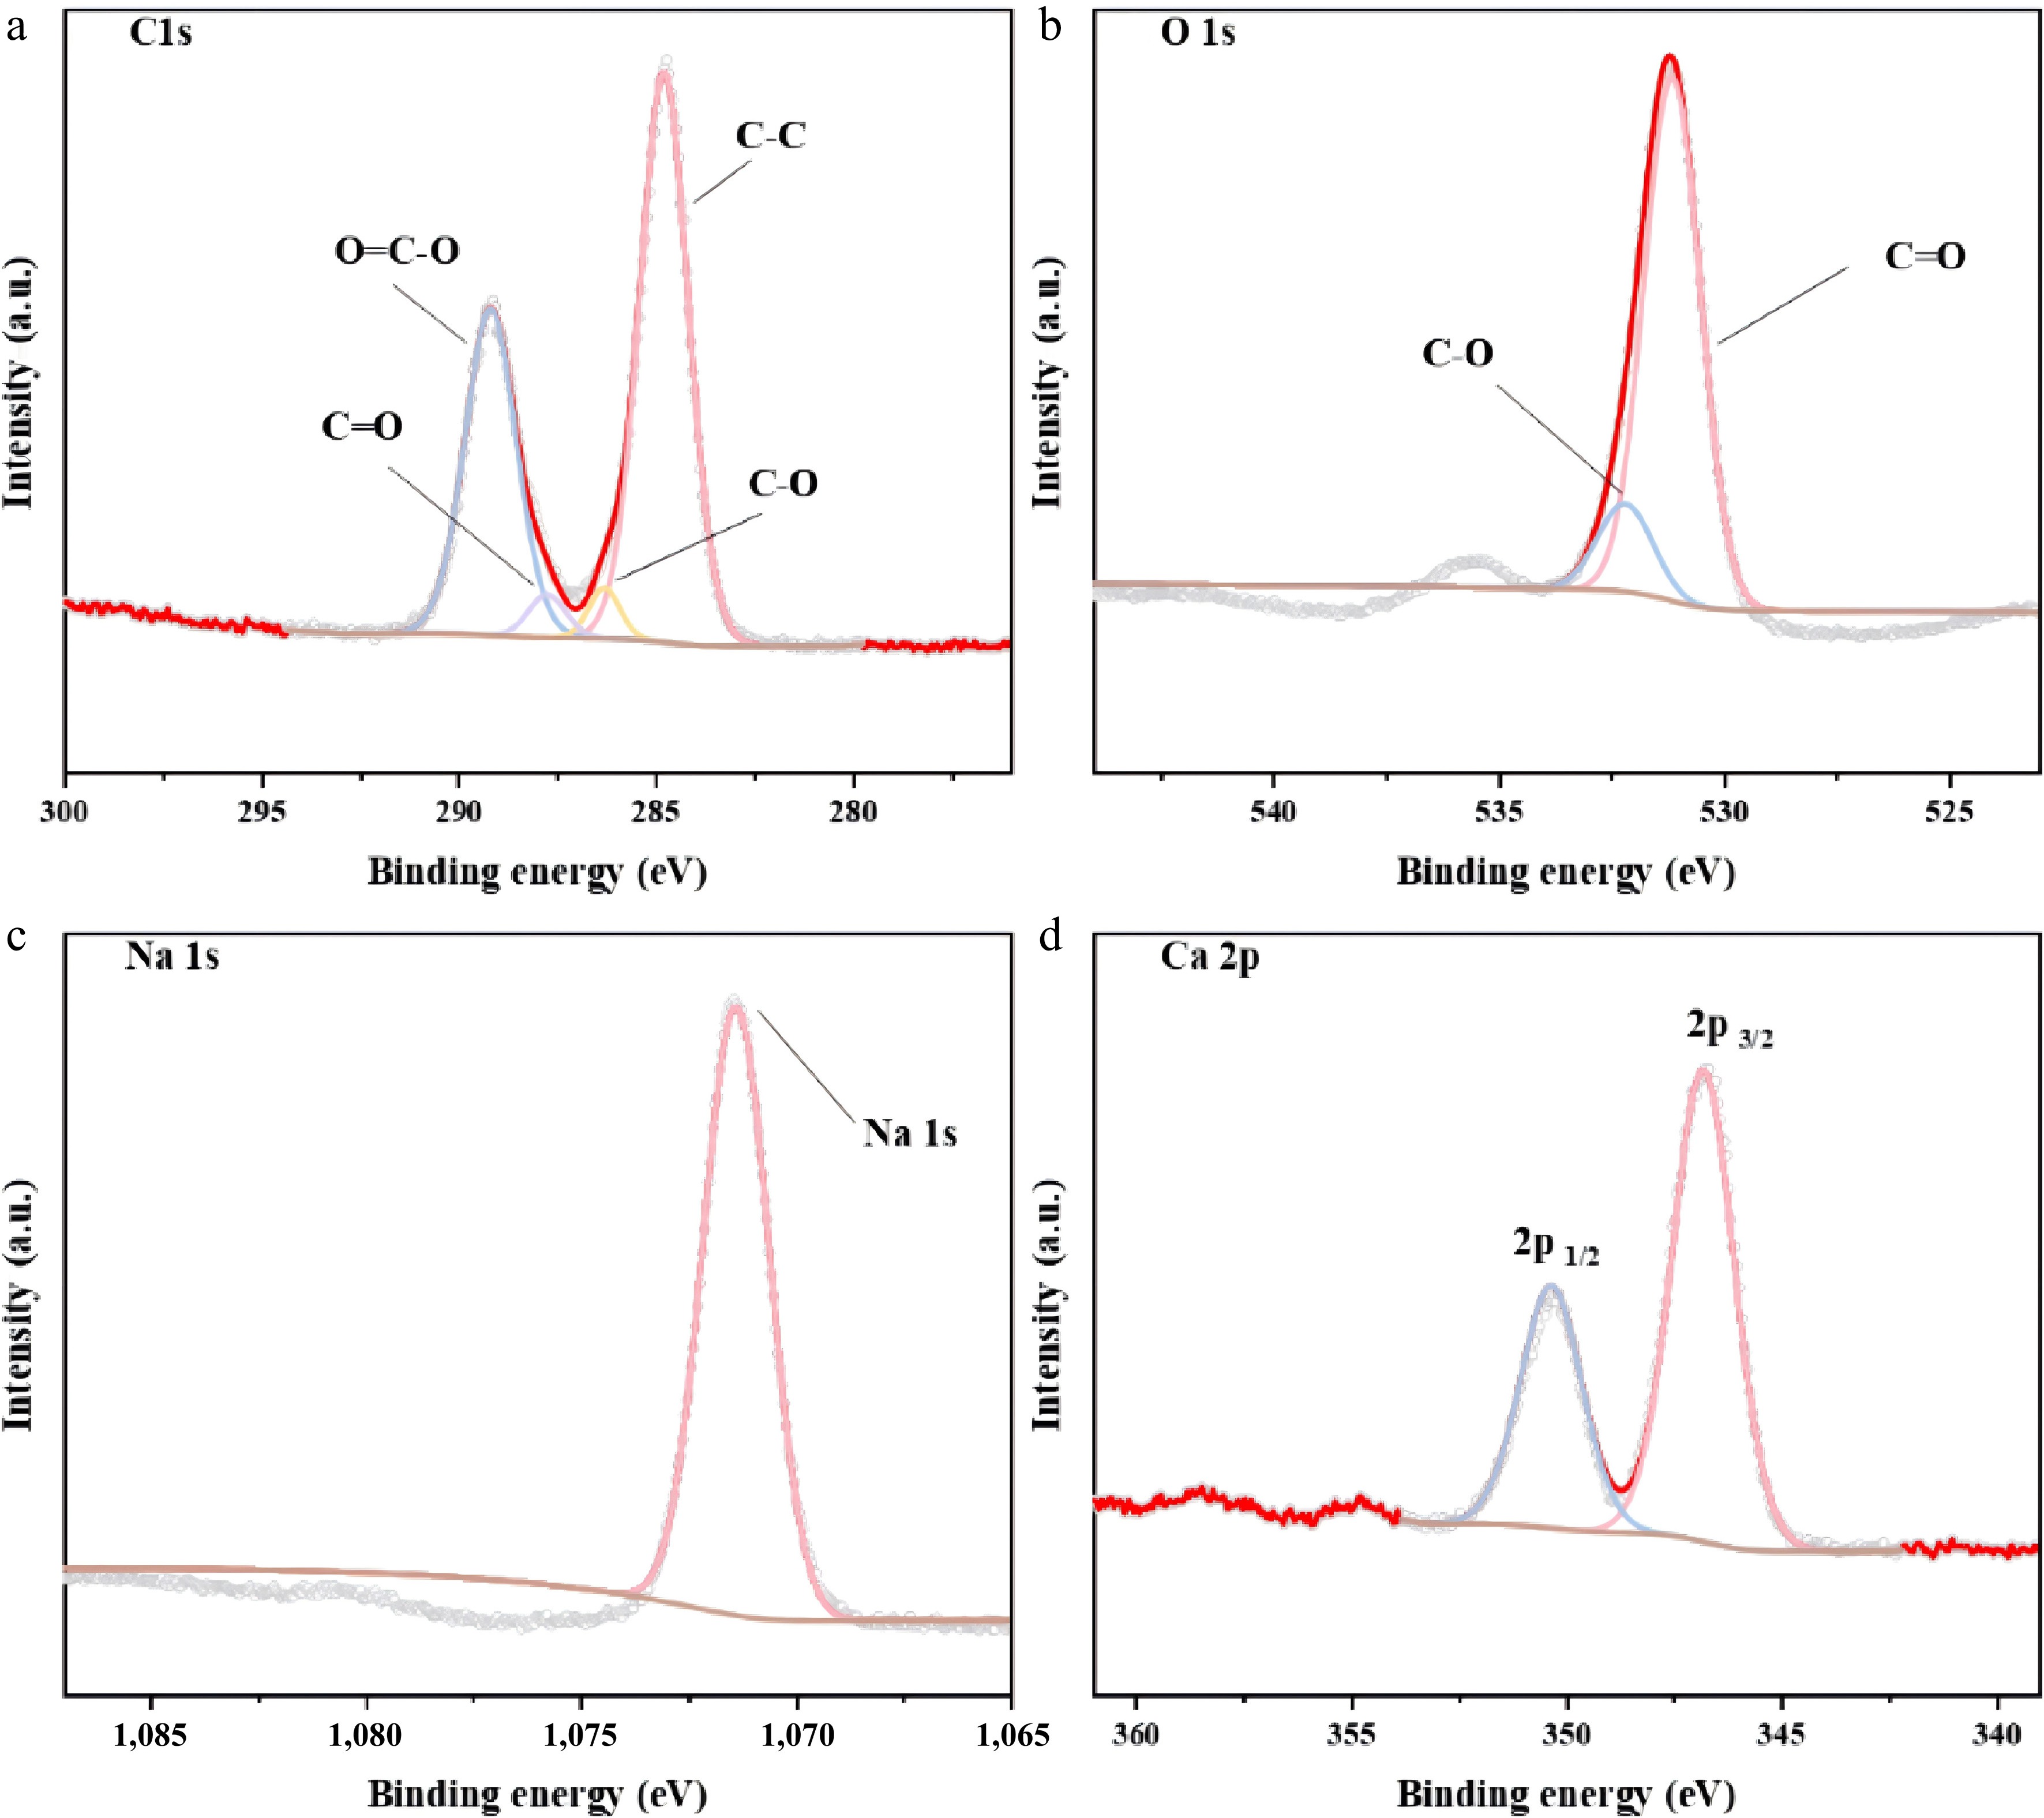
Figure 10.
XPS spectra of mixed catalysts (CaO : Na2CO3=1:3): (a) C1s; (b) O1s; (c) Na1s; (d) Ca2p.
TEM results
-
The TEM pattern of the Na2CO3 catalyst is shown in Fig. 11a, while the TEM patterns of the mixed catalyst (CaO : Na2CO3 = 1:3) are shown in Fig. 11b and c. These patterns were analyzed to determine the presence of substances. The lattice spacing of 0.3107 nm in Fig. 11a matches that of the (002) crystal plane of Na2CO3. The lattice spacing of 0.2397 nm shown in Fig. 11b corresponds to the (021) crystal plane of Na2CO3. The separation between the lattices of 0.3001 nm in Fig. 11c is consistent with that of CaO. These lattice spacings indicate the presence of corresponding substances. Meanwhile, the existence of anisotropy causes the substances to exhibit different properties in different directions. The different crystal planes of belonging to the same substance were measured.
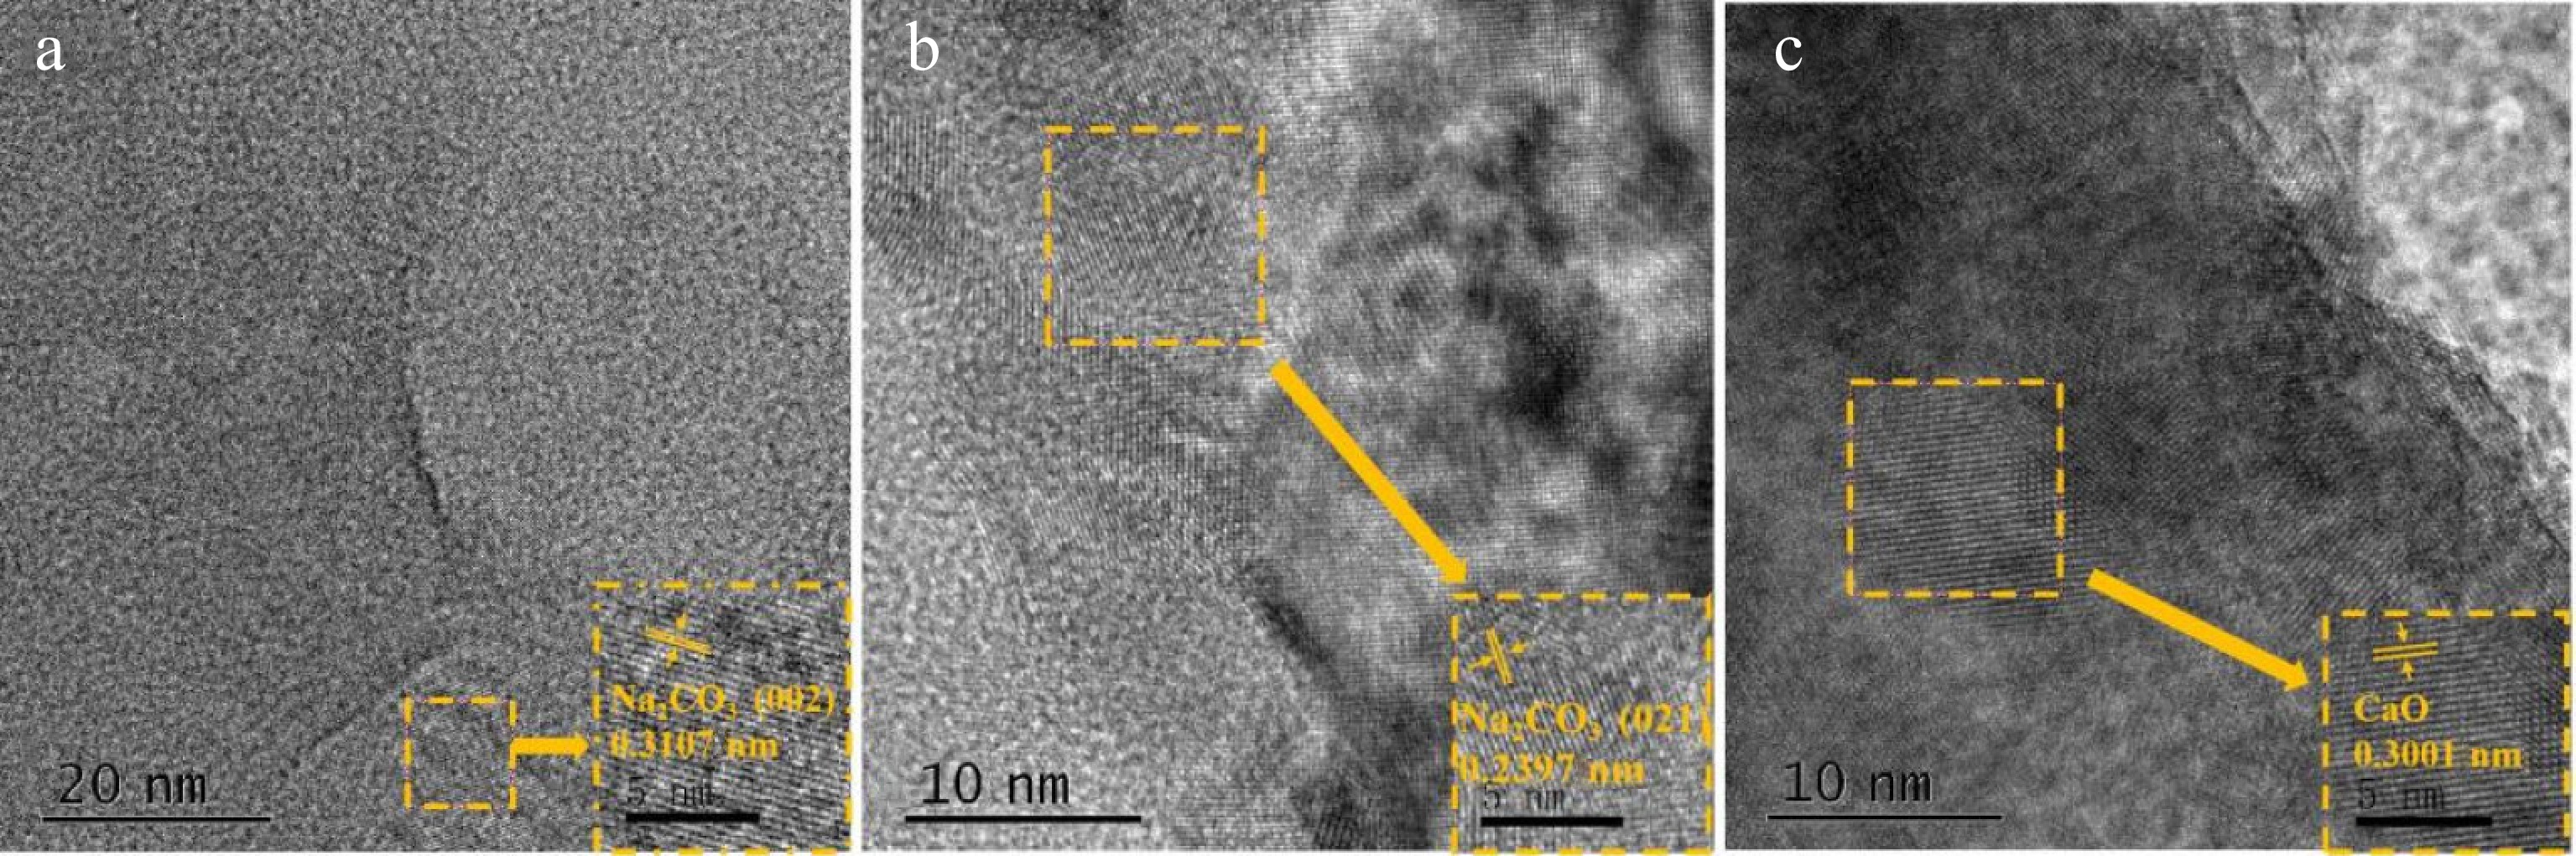
Figure 11.
TEM patterns of (a) Na2CO3 catalyst, and (b) and (c) mixed catalyst (CaO : Na2CO3=1:3).
Raman results
-
The Raman spectrum of Na2CO3 after catalyzed pyrolysis is shown in Fig. 12a. The main characteristic peaks were located at 1,161, 1,360, 1,581, and 1,842 cm−1. The 1,161 cm−1 peak is usually associated with C-O-C or C-C vibrational modes. This may originate from the residual structures of incompletely carbonized cellulose or hemicellulose. The 1,360 cm−1 peak is the typical D band, representing defects in the disordered carbon structures. The 1,581 cm−1 peak is the G band, indicating the presence of ordered graphite layers or aromatic carbon planes in the carbon material. The peak at 1,842 cm−1 could be related to oxygen-containing functional groups such as C=O, suggesting that more oxygen-containing structures were generated in the presence of Na2CO3. Overall, the Na2CO3-catalysed pyrolysis products have a high degree of defects and more surface functional groups, indicating that their carbon structures are disordered and rich in active sites.
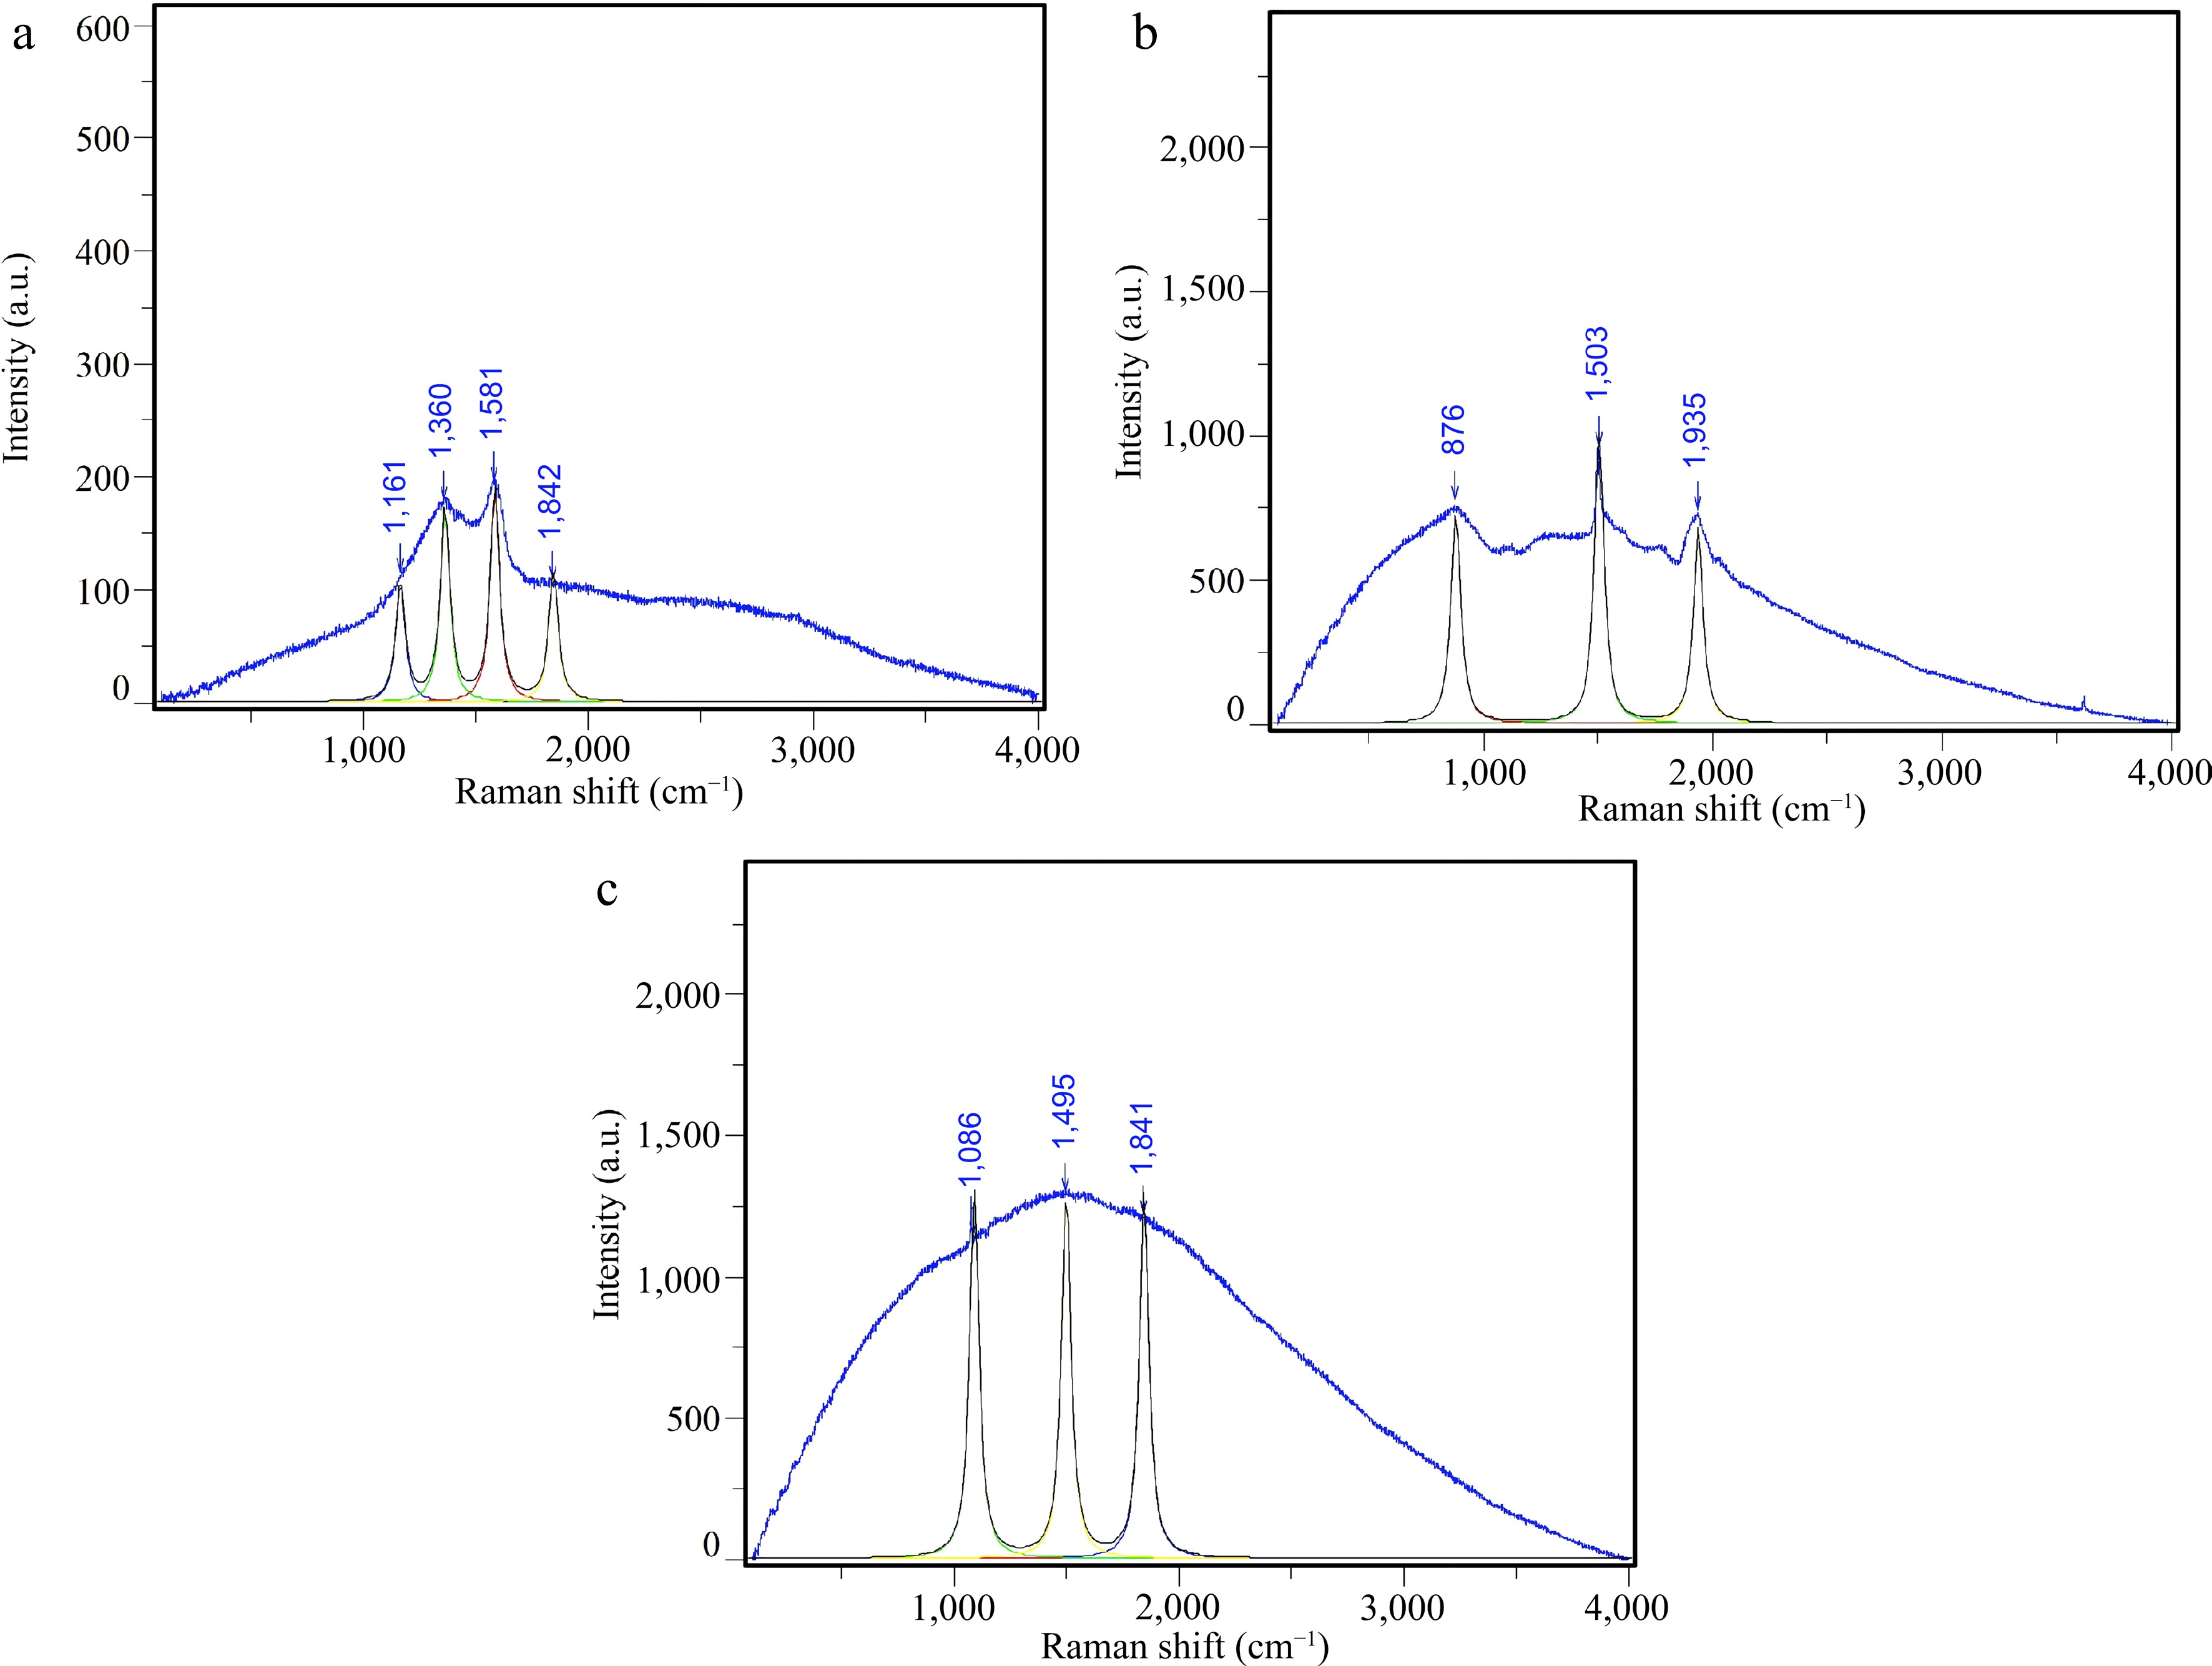
Figure 12.
Raman profiles of (a) Na2CO3 catalyst; (b) CaO : Na2CO3 = 1:2 catalyst; (c) CaO : Na2CO3 = 1:3 catalyst.
The Raman profile after synergistic catalytic pyrolysis of CaO : Na2CO3 = 1:2 is shown in Fig. 12b. The main characteristic peaks are located at 876, 1,503, and 1,935 cm−1. The peak at 876 cm−1 may be related to a Ca-O-C or CaCO3-related structure. The peak at 1,503 cm−1 is close to the G band but is redshifted, indicating an elevated ordering in the carbon material structure. The high-wavenumber peak at 1,935 cm−1 is special and may be related to edge-stress structures, or special C=O bond vibrations. This indicated the formation of more complex surface functional groups under CaO catalysis. Compared to Na2CO3 catalysis alone, co-catalysis with CaO, and Na2CO3 significantly increased the Raman signal intensity. This facilitates the ordering of carbon materials and enhances the diversity of functional groups.
The Raman spectrum of CaO : Na2CO3 = 1:3 after co-catalysis is shown in Fig. 12c. The major peaks appear at 1,086, 1,495, and 1,841 cm−1. The 1,086 cm−1 peak may be related to the C-O or CO32− structure. The 1,495 cm−1 peak is red-shifted in the G-band, suggesting increased ordering of the carbon structure; however, it is still influenced by the alkali metal. The 1,841 cm−1 peak may originate from oxygenated edge structures, such as C=O. Overall, a higher Na2CO3 ratio enriched the oxygen-containing functional groups. This shows that the products have a good carbon structure and surface activity under these conditions.
BET results
-
Na2CO3, CaO : Na2CO3 = 1:1, and CaO : Na2CO3 = 1:3 were tested, and the results are presented in Table 7. After using the Na2CO3 catalyst, the specific surface area reached 21.525 m2/g. Upon the addition of CaO, the specific surface area decreased to 16.616 and 17.228 m2/g, respectively. The incorporation of CaO improved the catalyst's stability. After five experimental cycles, the specific surface area of CaO : Na2CO3 = 1:3 decreased to 14.668 m2/g, which remains relatively high and provides sufficient active sites for the catalytic reaction. Additionally, the pore volume of Na2CO3 was measured at 0.155 cm3/g. With the addition of CaO, the pore volume decreased to 0.059 cm3/g, and further increases in CaO content had no significant effect on the pore volume. The pore size remained nearly constant at approximately 3.06 nm. These results indicate that the catalytic system maintains a stable structure throughout the reaction process.
Table 7. BET results of catalysts.
Catalysts Surface area
(m2/g) BETPore volume (cm3/g) Pore
diameter
(nm)Mesoporous Microporous Total Na2CO3 21.525 0.104 0.051 0.155 3.06 CaO : Na2CO3 = 1:1 16.616 0.033 0.026 0.059 3.063 CaO : Na2CO3 = 1:3 17.228 0.035 0.028 0.063 3.063 -
The catalytic pyrolysis mechanism was systematically revealed through a multi-dimensional study combining experimentation, simulation, and characterization, thereby providing an optimized strategy for producing hydrogen from biomass. The main conclusions of this study are as follows:
(1) Na2CO3 dominated low-temperature deoxygenation and inhibited alkane generation (minimum of 24.3%). CaO efficiently adsorbed CO2 (minimum 30.3%), and optimized the gas-phase products by forming CaCO3. The mixed catalyst significantly facilitated the water-gas shift reaction (CO → H2). The CaO/Na2CO3 (1:3) mixed catalyst exhibited optimal synergistic effects in the microwave-assisted catalytic pyrolysis, achieving an enhanced hydrogen yield of 17.26%.
(2) Carbon chain breakage and the generation of free radicals (H·/O·) are promoted by warming (1,000 K → 2,500 K), but bond breakage at > 2,000 K was inhibited by the carbonization reaction. Lignin's benzene ring structure is more thermally stable than cellulose/hemicellulose, requiring higher temperatures for decomposition.
(3) The XRD/SEM analysis revealed that the mixed catalysts formed CaCO3 and fibrous microporous structures, which enhanced both microwave absorption and mass transfer. XPS/TEM analysis confirmed the presence of surface C-O/C=O bonds and Na+/Ca2+ active sites, which work together to enhance catalytic activity.
This paper was sponsored by the Open Project Fund of Xinjiang Biomass Solid Waste Resources Technology and Engineering Center (KSUGCZX202301).
-
The authors confirm their contributions to the paper as follows: study conception and design: Zhang S, Li Z, Dong Y; data collection: Zhang S, Liang D, Li X, Fan Y, Huang H, He X; analysis and interpretation of results: Zhang S, Li X, Fan Y, Huang H, He X; draft manuscript preparation: Zhang S, Li X, Fan Y, Huang H, He X, Wang L, Li Z, Dong Y. All authors reviewed the results and approved the final version of the manuscript.
-
All data generated or analyzed during this study are included in this published article.
-
The authors declare that they have no conflict of interest.
- Copyright: © 2026 by the author(s). Published by Maximum Academic Press, Fayetteville, GA. This article is an open access article distributed under Creative Commons Attribution License (CC BY 4.0), visit https://creativecommons.org/licenses/by/4.0/.
-
About this article
Cite this article
Zhang S, Liang D, Li X, Fan Y, Huang H, et al. 2026. Study on the mechanism of hydrogen production by catalytic pyrolysis of bagasse over CaO/Na2CO3. Progress in Reaction Kinetics and Mechanism 51: e002 doi: 10.48130/prkm-0025-0026 

Study on the mechanism of hydrogen production by catalytic pyrolysis of bagasse over CaO/Na2CO3
- Received: 28 June 2025
- Revised: 20 September 2025
- Accepted: 29 October 2025
- Published online: 19 January 2026
Abstract: As a major type of agricultural waste, bagasse is rich in volatile matter and low in ash, making it an ideal raw material for thermochemical conversion to hydrogen-rich gas. In this study, an ex-situ microwave-assisted catalytic pyrolysis technique was used. CaO and Na2CO3 and their mixed catalysts in different ratios were selected for the experiments at 550 °C. The aim is to optimize both the hydrogen yield and concentration of the components to produce high-quality fuel. Thermogravimetric analysis (TG/DTG) revealed the influence of the catalysts: Na2CO3 significantly promotes low-temperature deoxygenation, and CaO can effectively adsorb CO2. Molecular dynamics simulations showed that elevated temperatures promote carbon chain breakage, but too high a temperature (2,500 K) may lead to a carbonization cascade reaction, which inhibits bond breakage. The gas-phase products indicate that the mixed catalyst is most effective at a ratio of CaO : Na2CO3 of 1:3, achieving the highest H2 yield (maximum 17.26%) along with significant hydrocarbon generation inhibition (24.90%), and CO content reduction (23.45%). Catalyst characterization confirmed the presence of CaCO3 in the mixed catalysts after pyrolysis. The CaO : Na2CO3 = 1:3 catalyst was found to have a unique fibrous structure and a microporous network. Raman spectroscopy reveals the ordering of the carbon structure and differences in functional groups under the action of different catalysts. This study provides a theoretical basis for further optimizing the pyrolysis process of bagasse, and helps improve the conversion efficiency of biomass energy.
-
Key words:
- Bagasse /
- Catalytic pyrolysis /
- Molecular dynamics simulation /
- CaO /
- Na2CO3