


-
Tropical forests are vital for sustaining both natural ecosystems and human societies. Though they cover less than one-fifth of Earth's terrestrial surface, they harbor more than half of the world's terrestrial species[1,2] and function as a critical carbon sink in climate change mitigation[3,4]. Furthermore, they provide essential ecosystem services, including food resources, medicinal plants, and livelihood support for local communities[5,6]. However, tropical forests face unprecedented threats, with over 90% of global deforestation occurring in these regions between 1990 and 2020, at an average rate of 9.28 Mha per year between 2015 and 2020[7]. Tropical forests play critical ecological and socioeconomic roles, making their protection and sustainable management a global priority. Quantitative and regular monitoring is urgently needed. Moreover, multiple drivers—such as timber extraction, agricultural expansion[8], and infrastructure development[9]—influence deforestation. Understanding their impacts can help policymakers identify actions to accelerate or slow forest loss.
Large-scale deforestation has led to severe fragmentation of the remaining forest habitats[10]. Forest fragmentation is the division of large, continuous forests into smaller, isolated patches. This process alters forest structure and composition and has profound ecological and environmental consequences[11]. One immediate effect of fragmentation is the increased exposure of forests to edge environments[12]. Forest edges are more susceptible to disturbances, with higher tree mortality rates[13], greater fire risks[14], and increased carbon emissions[15,16]. Simultaneously, fragmentation diminishes forest core areas, which are the interior regions of a forest that are relatively undisturbed by edge effects and are critical for maintaining high-quality habitats. This loss of core regions reduces habitat availability, biodiversity, and overall habitat quality, undermining the ability of these landscapes to support native species[17,18]. These cascading impacts weaken essential ecological functions, such as nutrient cycling, water regulation, and climate stabilization[19,20]. Therefore, monitoring the progress of fragmentation in deforestation hotspots in tropical regions is of great ecological significance.
Studies of forest fragmentation frequently employ landscape metrics to quantify changes in forest structure, composition, and spatial patterns[21,22]. These metrics provide critical insights into fragmentation extent, core forest loss, edge effects, and landscape connectivity[23]. The integration of remote sensing-based land cover or land use data with landscape metrics has become a widely adopted approach, offering high spatial and temporal resolution for monitoring landscape dynamics[24]. Advances in freely available satellite imagery and analytical tools have further enhanced the capacity for large-scale, consistent, and long-term assessments[25]. While numerous studies have leveraged this data to analyze forest dynamics, many focus on relatively short timeframes or localized scales, such as specific protected areas or watersheds[26,27]. Regional and global studies have mapped forest cover and fragmentation trends[28], but limited data for 1972–1998 restricts the ability to capture long-term patterns[29]. There remains a need for more national-scale analyses that systematically trace long-term fragmentation dynamics and explicitly link them to the timeline of specific policy interventions. Furthermore, analyses that compare only the initial and final years of a study period may not fully capture the temporal complexity of landscape change, thereby limiting the understanding of continuous and policy-driven fragmentation processes[30]. This lack of evidence limits our ability to assess the effectiveness of forest governance and to design adaptive, policy-relevant conservation strategies. To support effective forest conservation policymaking, it is essential to quantify the continuous process of forest fragmentation and to assess the impacts of policy interventions on its dynamics.
Cambodia is a country that holds abundant forest resources and biodiversity, which play a critical role in maintaining ecological balance, regulating climate, and supporting wildlife habitats. However, forest cover in Cambodia has declined over the past several decades, with an average annual net loss of 252,000 ha between 2010–2020, ranking eighth globally in forest loss[7]. Therefore, long-term, nationwide monitoring of forest landscapes in Cambodia is crucial for understanding and addressing the impacts of deforestation and land-use changes. Previous studies have indicated that deforestation in Cambodia has increased rapidly in the 2000s[31], and that one of the factors contributing to this increase is large-scale land acquisitions (LSLAs)[32,33]. Nevertheless, the long-term dynamics of forest fragmentation and the influence of policy interventions related to LSLAs remain insufficiently understood.
To address this knowledge gap, this study analyzes the spatiotemporal dynamics of forest cover from 1989 to 2019, aiming to provide a comprehensive understanding of the dynamics of Cambodia's forest landscapes, and assess their relationship to key policy interventions. The specific objectives were as follows: (1) to examine the dynamic changes and spatial distribution of core/edge forests; (2) to quantify and describe long-term trends in forest fragmentation at a national scale; and (3) to identify key years of significant forest landscape changes and investigate their potential policy drivers. These findings aim to inform targeted actions for mitigating forest fragmentation and promoting sustainable forest management in Cambodia.
-
The study area covers the whole of Cambodia, a Southeast Asian country located between 10° N and 15° N, and 102° E and 108° E, with a total land area of approximately 18.1 Mha. Cambodia experiences a tropical monsoon climate, with distinct wet and dry seasons (Fig. 1).
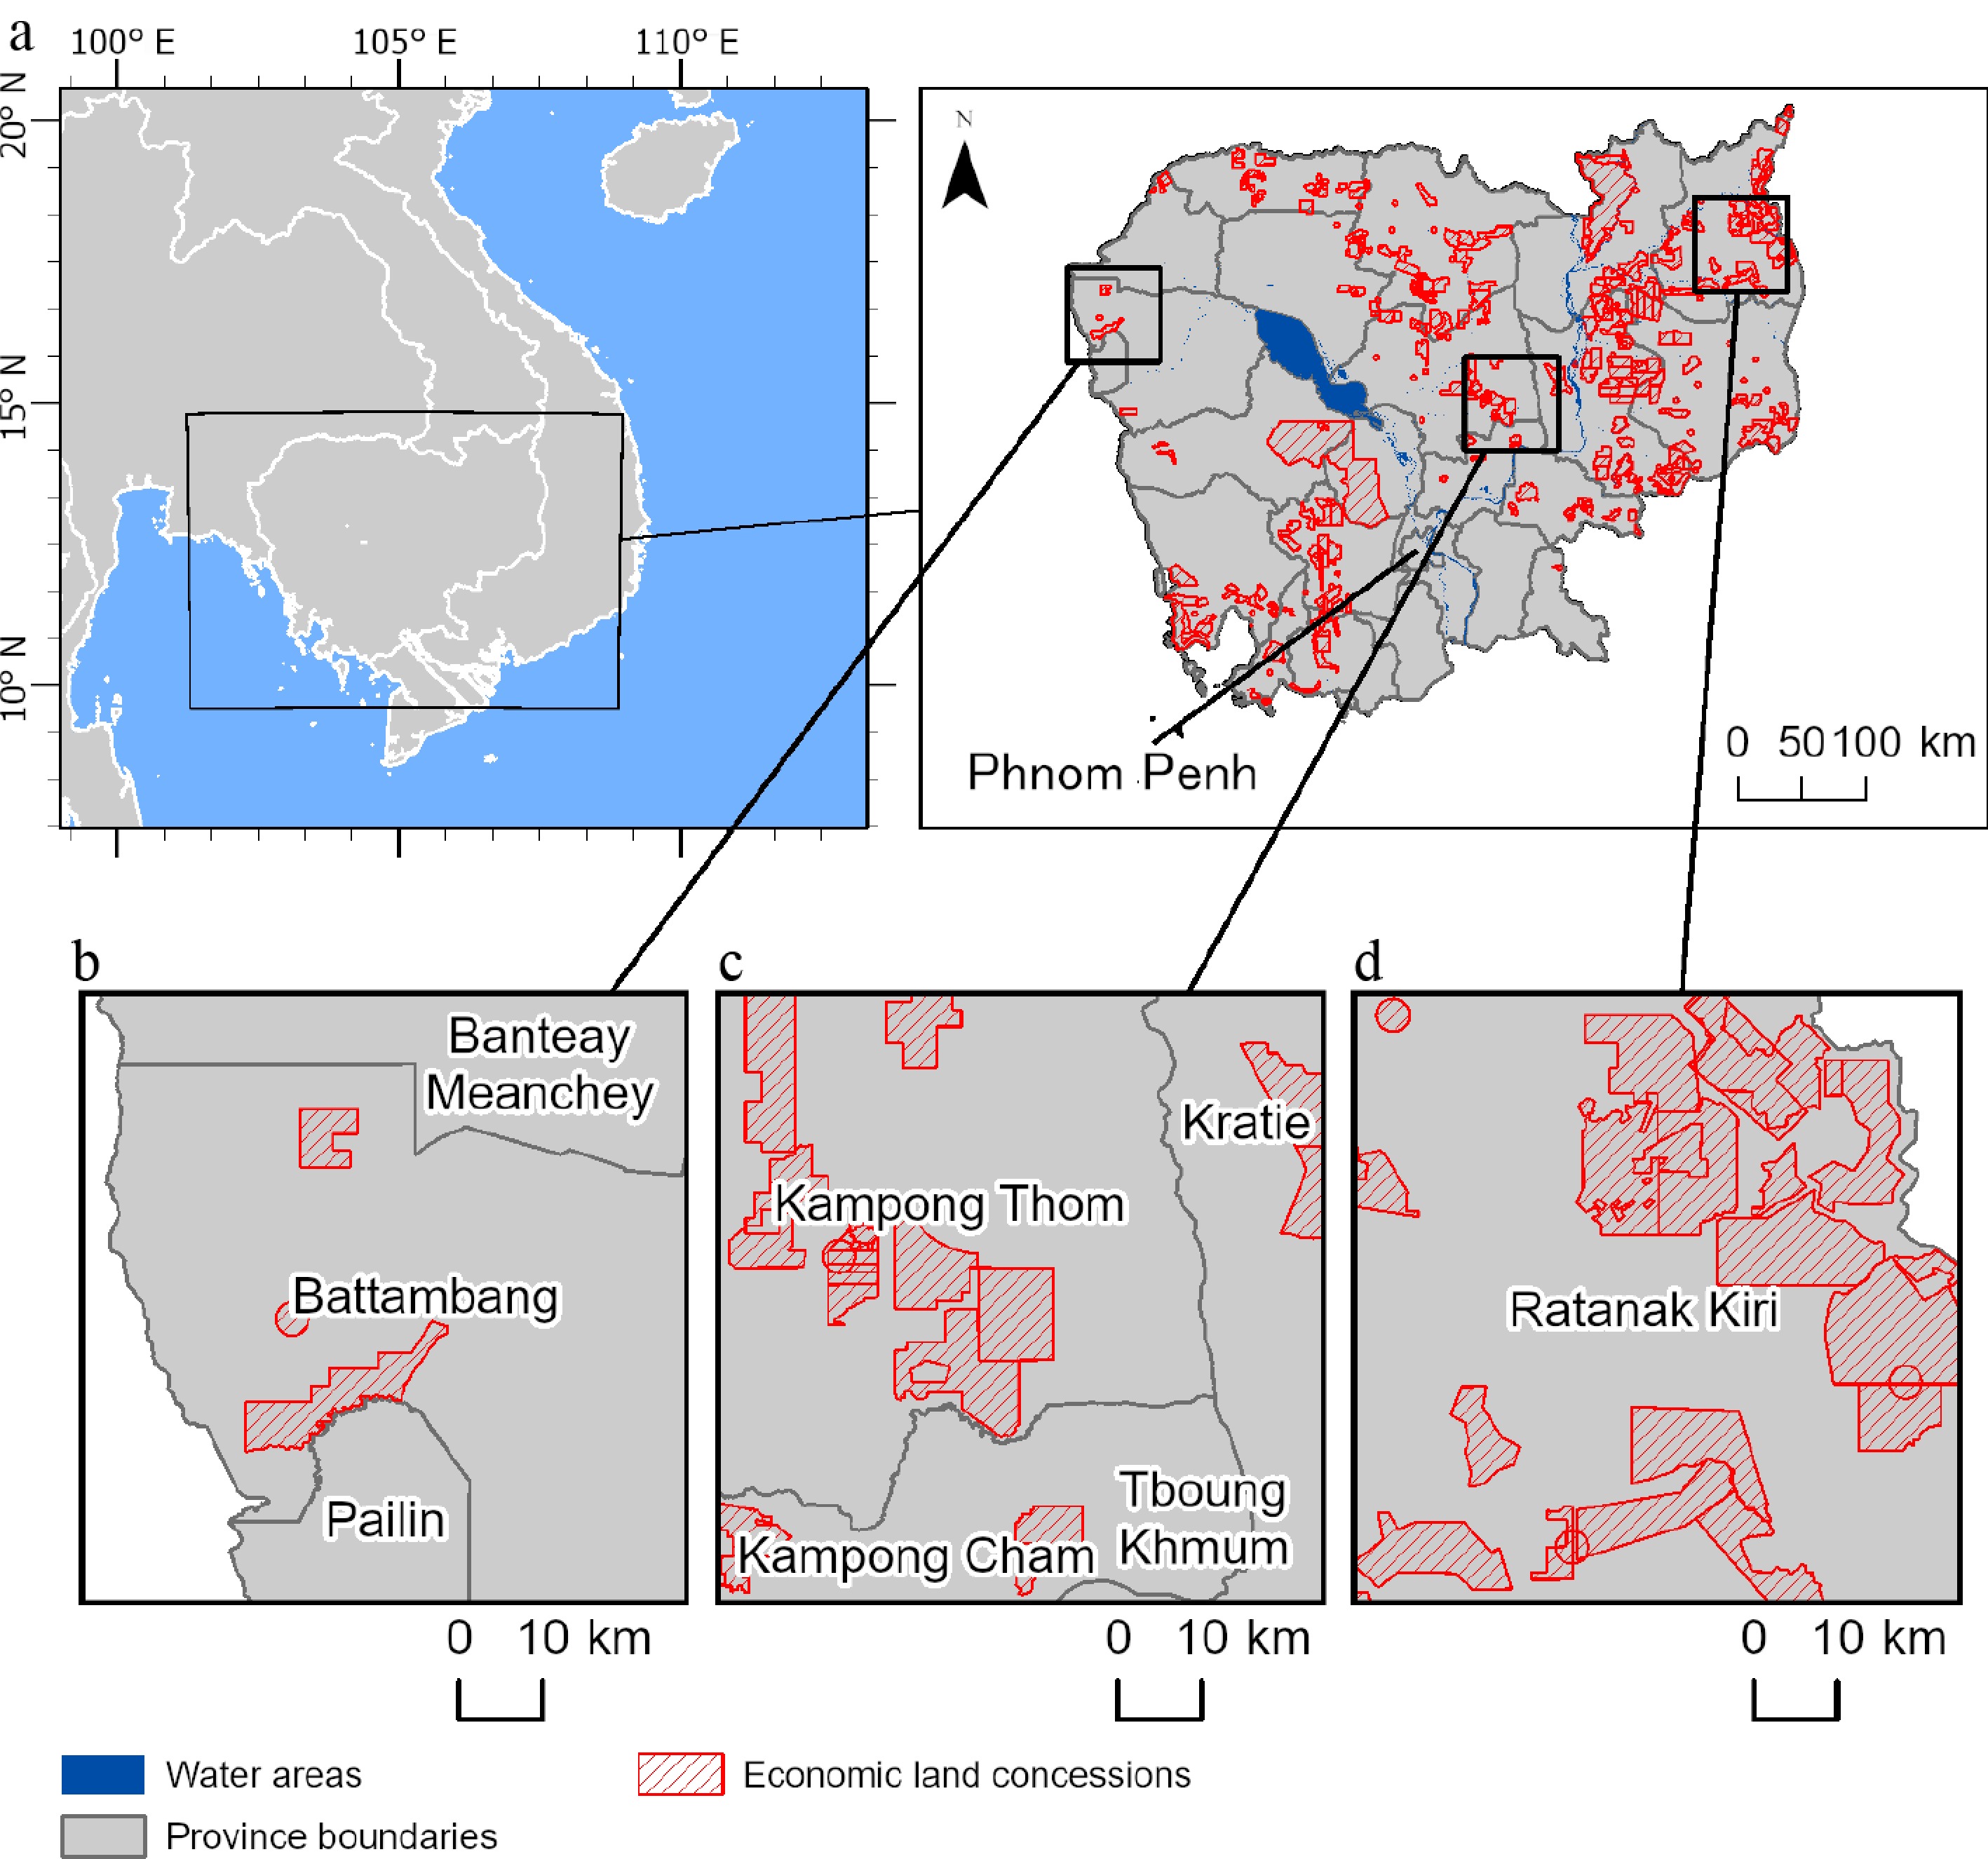
Figure 1.
Study area showing provincial boundaries, water areas, and distribution of Economic Land Concessions (ELCs).
According to the main report of the Global Forest Resource Assessment 2020[7], Cambodia's forested area in 2000 and 2020 was about 10.8 and 8.1 Mha, respectively. These figures indicate that deforestation has reduced forest cover from approximately 60% of the land area in 2000 to approximately 45% in 2020. Drivers of deforestation in Cambodia are often linked to economic development and the expansion of agricultural land. In particular, the implementation of LSLAs, known as Economic Land Concessions (ELCs), has caused significant deforestation[32−34]. The policy was formalized under the 2001 Land Law, which aimed to modernize Cambodia's agricultural sector, transform unused or degraded land into productive areas, and integrate the country further into the global economy[35].
The policy gained momentum in the early 2000s as Cambodia sought to rebuild its economy after decades of conflict. By 2012, over 2.1 Mha, representing approximately 11.6% of the country's total land area, had been allocated under ELCs, with a focus on crops such as rubber, sugarcane, and cassava, primarily for export[36]. The policy was supported by Sub-Decree No. 146 on Economic Land Concessions (2005), which outlined requirements such as environmental and social impact assessments, community consultations, and a maximum concession size of 10,000 ha[37]. However, these regulations were often poorly enforced, leading to significant governance challenges[38,39].
While ELCs have attracted foreign investment and positively contributed to economic growth and job creation, their significant role in driving deforestation and forest degradation cannot be ignored. Studies indicated that deforestation rates within ELCs are significantly higher than in surrounding areas, with a discernible pattern of deforestation leakage increasing deforestation rates in adjacent forests[40], contributing to the loss of forest core areas, increased fragmentation and reduced biodiversity. The Cambodian government responded to these concerns by imposing a moratorium on new ELCs in 2012 and initiating a review of existing concessions. By 2015, some ELCs were canceled or reduced in size, with portions of the land returned to state control or redistributed to smallholder farmers[41]. However, the enforcement of these reforms has been inconsistent, and illegal activities, such as unauthorized logging within ELC areas, persist. The Cambodian League for the Promotion and Defense of Human Rights (LICADHO) reports that since the announcement of the moratorium in 2012, at least 16 new concessions have been granted, covering a total area of over 80,000 ha[42].
Dataset
-
This study utilized the forest cover change dataset developed by Shimizu et al.[31], which integrates Landsat time series data to map deforestation, forest degradation, and recovery across Cambodia. The dataset provides annual 30-m resolution land cover classifications and disturbance types from 1989 to 2019, enabling detailed temporal analysis of forest dynamics. Forest disturbances include those involving land cover conversion of natural forest cover (forest to agriculture, forest to grass/shrub, forest to urban/water, and forest to plantation) as well as disturbance without any land cover conversion of natural forest. The dataset categorizes land cover into five classes: natural forest, plantation, agriculture, grass/shrub, and urban/water.
The dataset by Shimizu et al.[31] achieved an overall accuracy of 78.1% for the detailed disturbance and land cover classification, and 87.2% for the aggregated three-class classification. Producer's accuracy and User's accuracy varied among classes: natural forest showed the highest reliability (Producer's accuracy 97.4%, User's accuracy 77.1%), while disturbances leading to agriculture or plantations ranged between 58%–64% for Producer's accuracy and 76%–80% for User's accuracy. Disturbances without land cover conversion, such as selective logging, had Producer's accuracy of 83.6% and User's accuracy of 68.0%. The total disturbance area was approximately 3.45 million hectares, dominated by conversion to agriculture (about 1.52 million ha), whereas disturbances without land cover conversion accounted for only about 0.49 million ha.
In this study, the forest disturbance/land-use maps were reclassified into forest/non-forest maps for each year: natural forest and disturbance (to forest) were defined as 'forest', and the remaining classes were classified as 'non-forest'. This classification results in a definition of 'forest' that includes natural forest, and areas undergoing disturbance without land cover conversion (e.g., selective logging or degradation), while plantations are treated as 'non-forest' due to their distinct ecological characteristics and management regimes. This approach aligns with the goal of assessing natural forest fragmentation rather than total tree cover. While this classification emphasizes natural forest integrity, it may influence interpretation: treating disturbed-but-still-forested pixels as forest could slightly inflate edge exposure in degraded stands, and excluding plantations reduces core area relative to total canopy cover. These implications should be considered when interpreting core/edge trajectories and fragmentation metrics. Plantations were excluded because their ecological characteristics and management regimes differ substantially from natural forests, and including them would obscure our focus on natural forest fragmentation. While plantations may influence connectivity or mitigate edge effects, assessing their role was not part of this analysis.
The boundaries for ELCs were downloaded from Open Development Cambodia (
https://opendevelopmentcambodia.net ). The data represents the original contract size because publicly available information on land area reductions or revocations does not include spatial details. Consequently, excisions cannot be mapped, and the polygons used in this study reflect the initial concession boundaries. This may lead to overestimation of the actual area under concession, after size reductions or cancellations.Forest cover
-
In this study, forest cover refers to the proportion of reclassified forest pixels within the total landscape area of Cambodia. Forest class was further subdivided into forest core area, and forest edge area. Many studies define core areas as those located at least 100 m away from forest edges to avoid edge effects[12,43], while others assess core areas based on landscape patch size and shape[44]. In this study, we adopted a method similar to that of Fischer et al.[12] to classify forest pixels into these two categories. Following their approach, forest edge area was defined by marking all forest pixels with a distance to the forest edge of less than 100 m, while forest pixels located at a distance of 100 m or more were classified as forest core area. A forest edge pixel was identified as a forest pixel adjacent to at least two non-forest pixels along one side. While Fischer et al. used a four-neighbor configuration (considering only the cardinal directions) to detect such edge pixels, we applied an eight-neighbor configuration that includes both orthogonal and diagonal directions. The eight-neighbor configuration detects more edge adjacency than a four-neighbor rule, producing a conservative estimate of core area under complex patch geometries typical of Cambodia.
To assess forest dynamics in relation to LSLAs, we overlaid annual forest maps with ELC boundaries and calculated forest cover, and core forest area separately for pixels inside, and outside concessions for each year from 1989 to 2019. This comparison provides a long-term perspective on spatial contrasts between concession and non-concession areas.
Forest fragmentation
-
In this study, a landscape-scale assessment was conducted for the whole of Cambodia. By treating the entire country as a landscape, overall patterns and trends in forest fragmentation can be better identified. Landscape metrics provide valuable quantitative measures of the spatial configuration and composition of fragmented landscapes. We used three common landscape metrics: the number of patches (NP), mean patch size (MPS), and area-weighted mean shape index (AWMSI) to evaluate changes in forest structure, and to understand the extent and patterns of fragmentation at a national scale. The calculation formulas of each landscape metric used are shown in Table 1.
Table 1. The calculation formulas and descriptions of landscape metrics used.
Abbr. Landscape metric Units Formula Description NP Number of patches None NP = n n: number of forest patches MPS Mean patch size ha $ MPS=\dfrac{\sum {A}_{i}}{n}\left(\dfrac{1}{10,000}\right) $ Ai: area of patch i; MPS equals the mean area of each forest patch (m2), divided by 10,000 (to convert to ha) AWMSI Area-weighted mean shape index None $ AWMSI=\dfrac{\sum {{{A}_{i}}S}_{i}}{\sum {A}_{i}} $
$ {S}_{i}=\dfrac{{p}_{i}}{2\sqrt{\pi {A}_{i}}} $Ai: area of patch i; Si: shape index of patch i; p: perimeter of patch i; AWMSI is the area-weighted mean of shape indices, where each Si is calculated as the ratio of the patch perimeter to the circumference of a circle with the same area. Mean forest patch size reflects the average size, in ha, of forest patches within the landscape unit. Smaller mean patch sizes signify increased fragmentation[45]. The number of forest patches within a landscape unit quantifies the division of treed areas. A larger number of patches, given a constant landscape area, implies greater fragmentation[46]. Shape index evaluates the complexity of patch shapes, where simple, compact patches have lower values, and irregular, elongated patches have higher values. Increased shape complexity can lead to greater edge habitat, potentially making patches more vulnerable to external pressures[47]. In this study, we used AWMSI, which accounts for patch size by weighting shape index values by area. This approach provides a more representative measure of overall shape complexity at the landscape scale. To calculate these landscape metrics, we used the 'landscapemetrics' package (version 2.1.0)[48] in R statistical software (version 4.2.0)[49].
Detection of structural breaks in time series
-
To clarify the temporal trends in total forest area, forest core area, and forest edge area, we calculated the annual change in area (ha per year) for each category over the study period. We applied the statistical method of structural break detection to analyze temporal changes in each forest cover change metric, focusing on annual forest changes from 1989 to 2019. In the segmented regression analysis, these annual changes were used as the response variables. This method is used to identify points in a time series where significant shifts occur in the underlying data-generating process, known as structural breaks.
The analysis was performed using the breakpoint function in the R package 'strucchange' (version 1.5-3), which implements the Bai–Perron test for detecting multiple structural breaks[50]. It divides the time series into all possible segment combinations and iteratively optimizes the segmentation using a dynamic programming algorithm to minimize the residual sum of squares (RSS) across all segments. This study set a maximum of six potential breakpoints, selected the optimal number of breaks based on the Bayesian information criterion (BIC), and used a 5% significance level for breakpoint estimation. The identified breakpoints indicated significant shifts in forest landscape structure dynamics, which this study associated with key policy interventions and land-use changes during the study period. To quantify the trends within each segment, we fitted linear regression models using year as the explanatory variable, and the annual forest change metric as the response variable. The regression coefficients for each segment were calculated to identify specific trend changes that occurred before and after the breakpoints.
To assess the robustness of fragmentation metrics to definitional choices, we conducted a sensitivity analysis using alternative edge thresholds of 50, 100, 200, and 300 m. For each threshold, core and edge forest proportions were recalculated annually, and breakpoint analysis was performed. Segment-specific slopes, standard errors, and goodness-of-fit were summarized (Supplementary Table S1). Full time-series comparisons are shown in Supplementary Fig. S1, and breakpoint results in Supplementary Fig. S2. These tests indicate that while absolute proportions vary with threshold, the overall trends and identified breakpoints remain broadly consistent, confirming robustness of our main conclusions.
-
Figure 2a shows the annual changes in forest cover from 1989 to 2019, along with the proportion of forest core and edge areas within the total forested landscape. Single-year forest status maps for 1989, 1999, 2009, and 2019 are shown in Supplementary Fig. S3 to provide additional visual context on the spatial evolution of forest conditions over the study period. Over the 30-year period, forest cover decreased from 63.6% in 1989 to 51.8% in 2019, at a compound annual rate of reduction of 0.68%. During the same timeframe, the core forest rate (the ratio of forest core area to total land area) declined from 48.2% to 30.2%, at a compound annual rate of reduction of 1.55%, representing a greater reduction than the decrease in forest cover. Furthermore, the proportion of core forest relative to total forest area decreased from 75.8% in 1989, to 58.3% in 2019. This demonstrates that both the 'quality' and 'quantity' of forests were undergoing changes. A total of 3.25 Mha of core forest was lost, of which 1.56 Mha transitioned into edge forest, while 1.69 Mha directly converted into non-forest areas (Fig. 2d). This transition underscores the dual processes of deforestation and forest fragmentation.
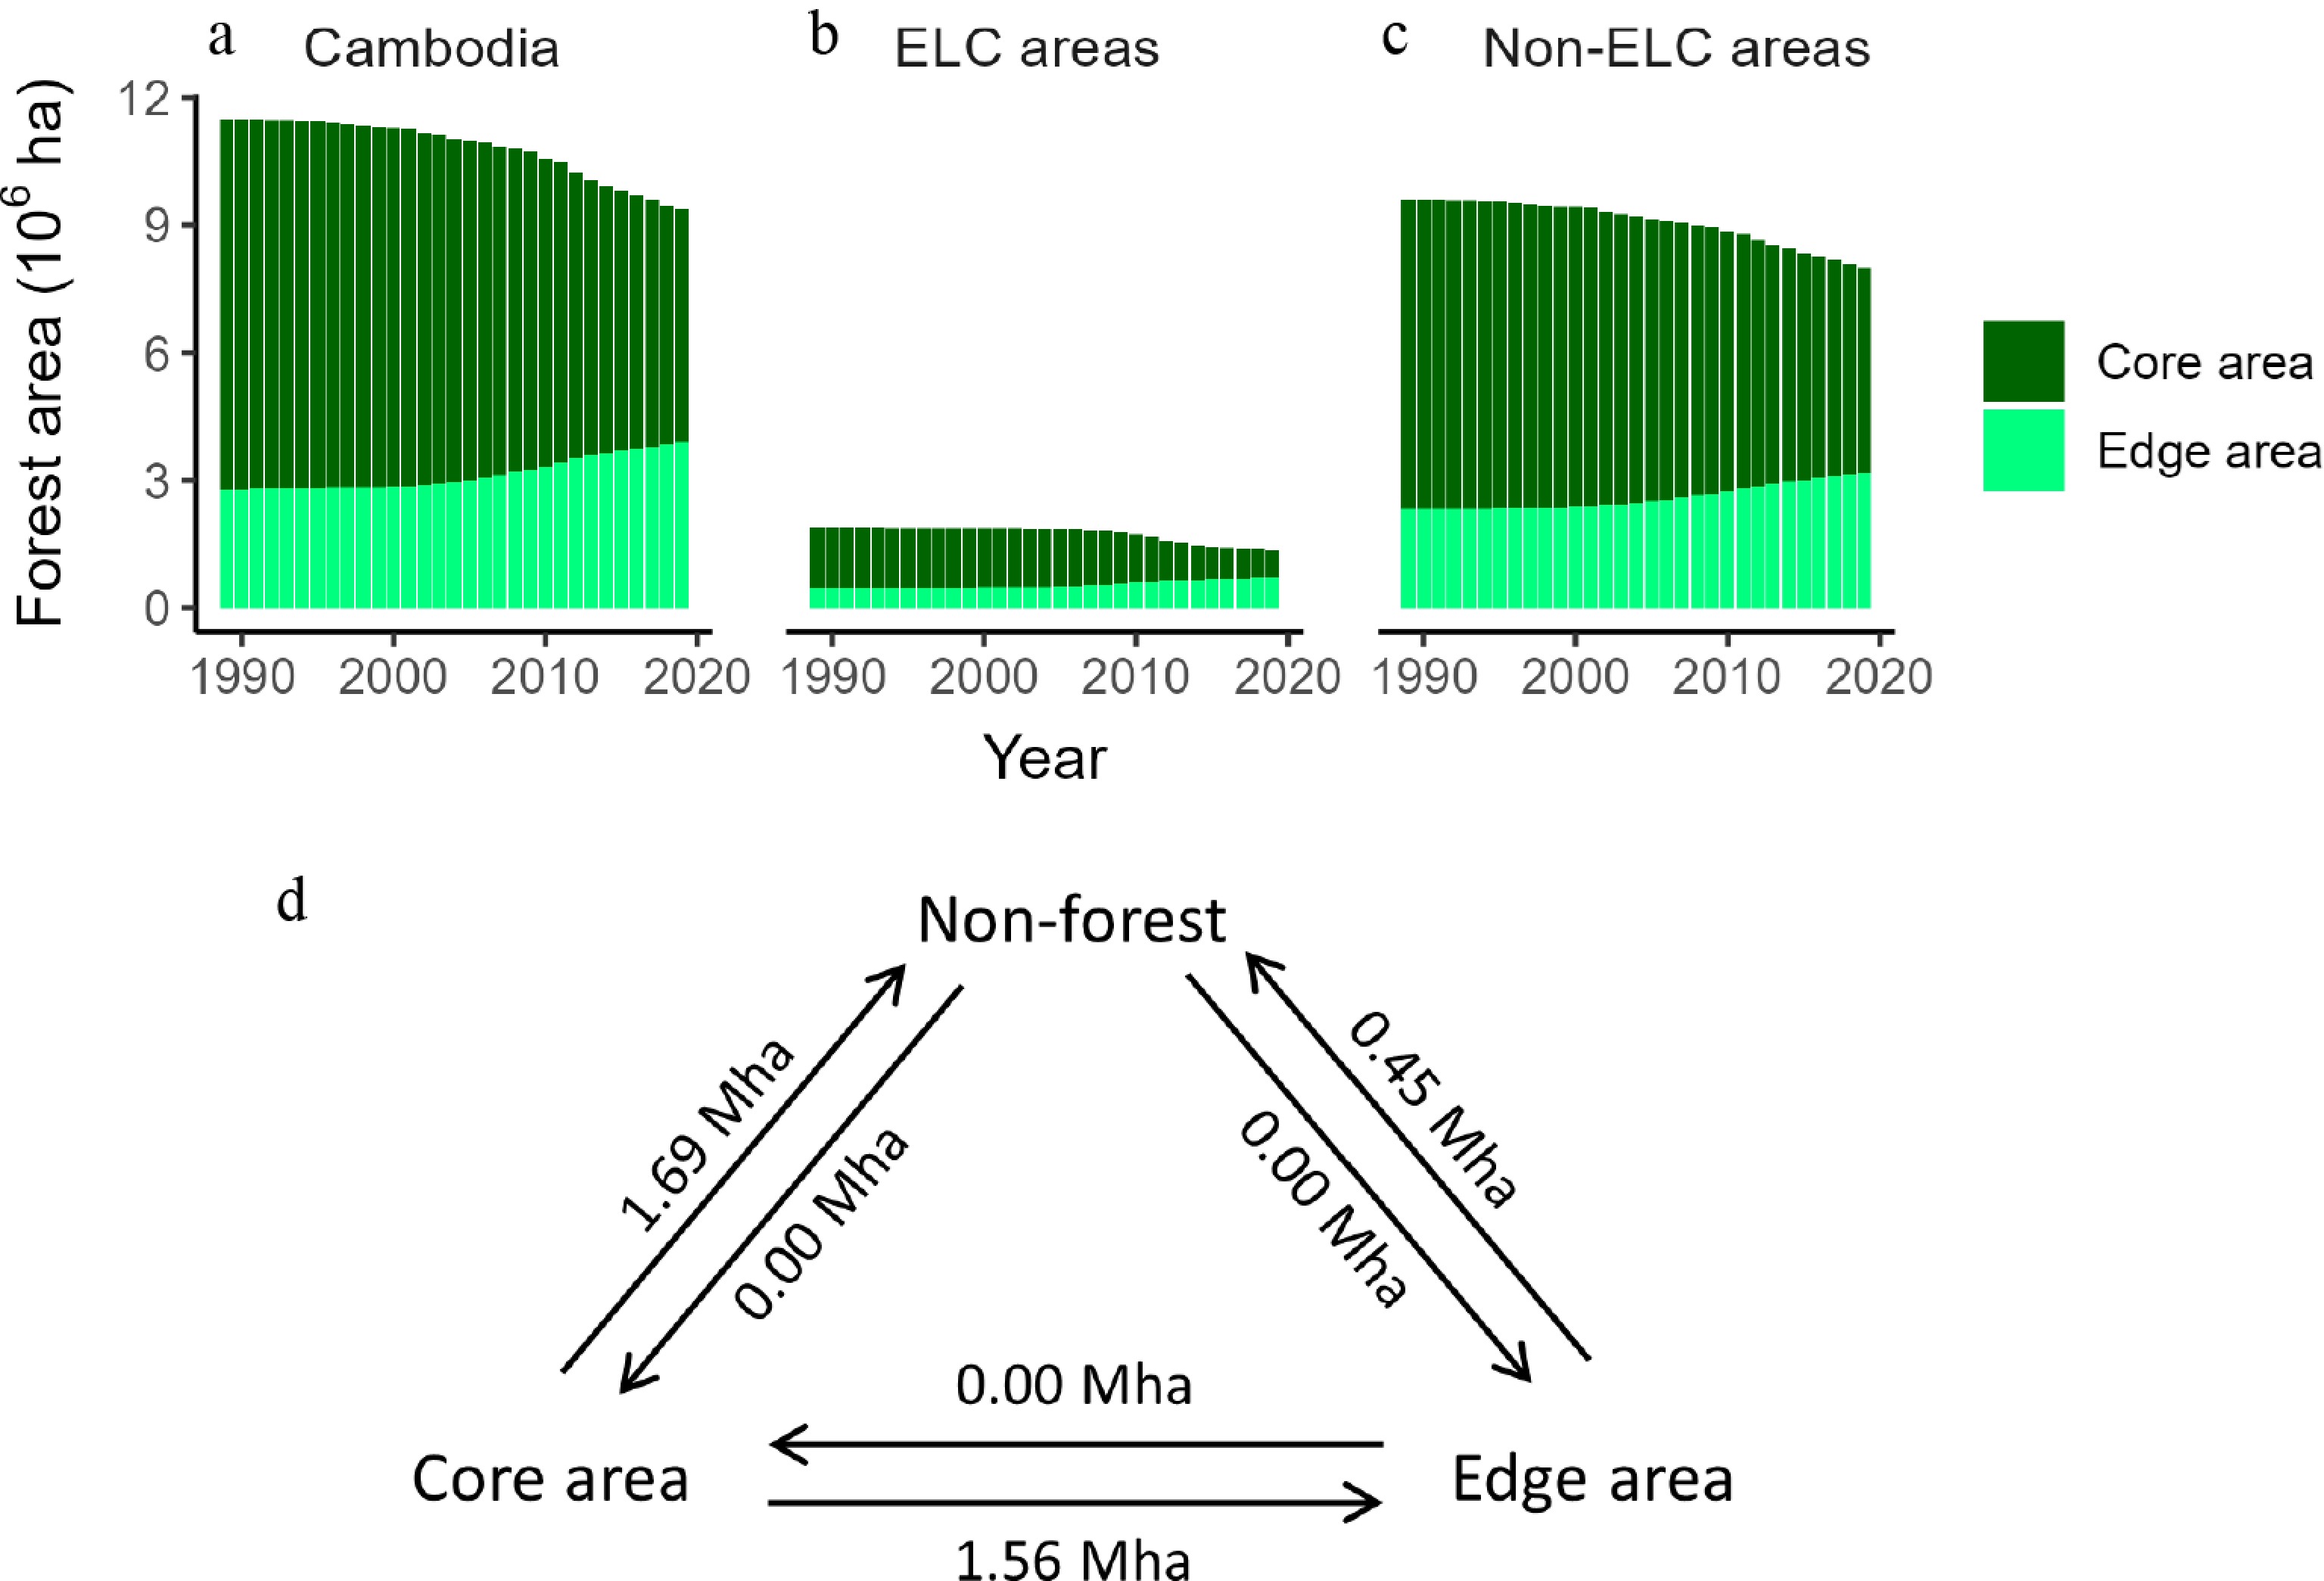
Figure 2.
Annual changes in forest cover and transitions from 1989 to 2019. (a) Forest cover trends for Cambodia; (b) forest cover trends inside ELC areas; (c) forest cover trends outside ELC areas; (d) area transitions among core forest, edge forest, and non-forest for Cambodia as a whole.
Overlay analysis revealed marked differences in forest dynamics between concession and non-concession areas (Fig. 2b, c). Inside ELCs, forest cover declined from 79.9% in 1989 to 59.2% in 2019, corresponding to a compound annual reduction rate of 1.12%. Core forest area decreased even more sharply, from 63.0% to 27.9%, at 2.68% per year. In contrast, outside ELCs, forest cover declined from 60.8% to 50.7% (−0.60% per year), while core forest area decreased from 46.0% to 30.5% (−1.36% per year). These results indicate that core forest loss inside ELCs was nearly twice as fast as in non-concession areas, underscoring the disproportionate impact of LSLAs on forest integrity.
The spatial changes in forest cover across Cambodia reveal regional differences in forest loss and fragmentation over the past three decades (Fig. 3a). The map highlights that Cambodia's northern, central, and northeastern regions had experienced significant deforestation and fragmentation. In the northwestern region, edge forests were prevalent in 1989, but have since been largely converted to non-forest areas (Fig. 3b). In central Cambodia, core forest areas have predominantly transitioned into non-forest landscapes (Fig. 3c). Similarly, in the northeastern region, core forests have been replaced either by non-forest land, or transformed into edge forests (Fig. 3d).
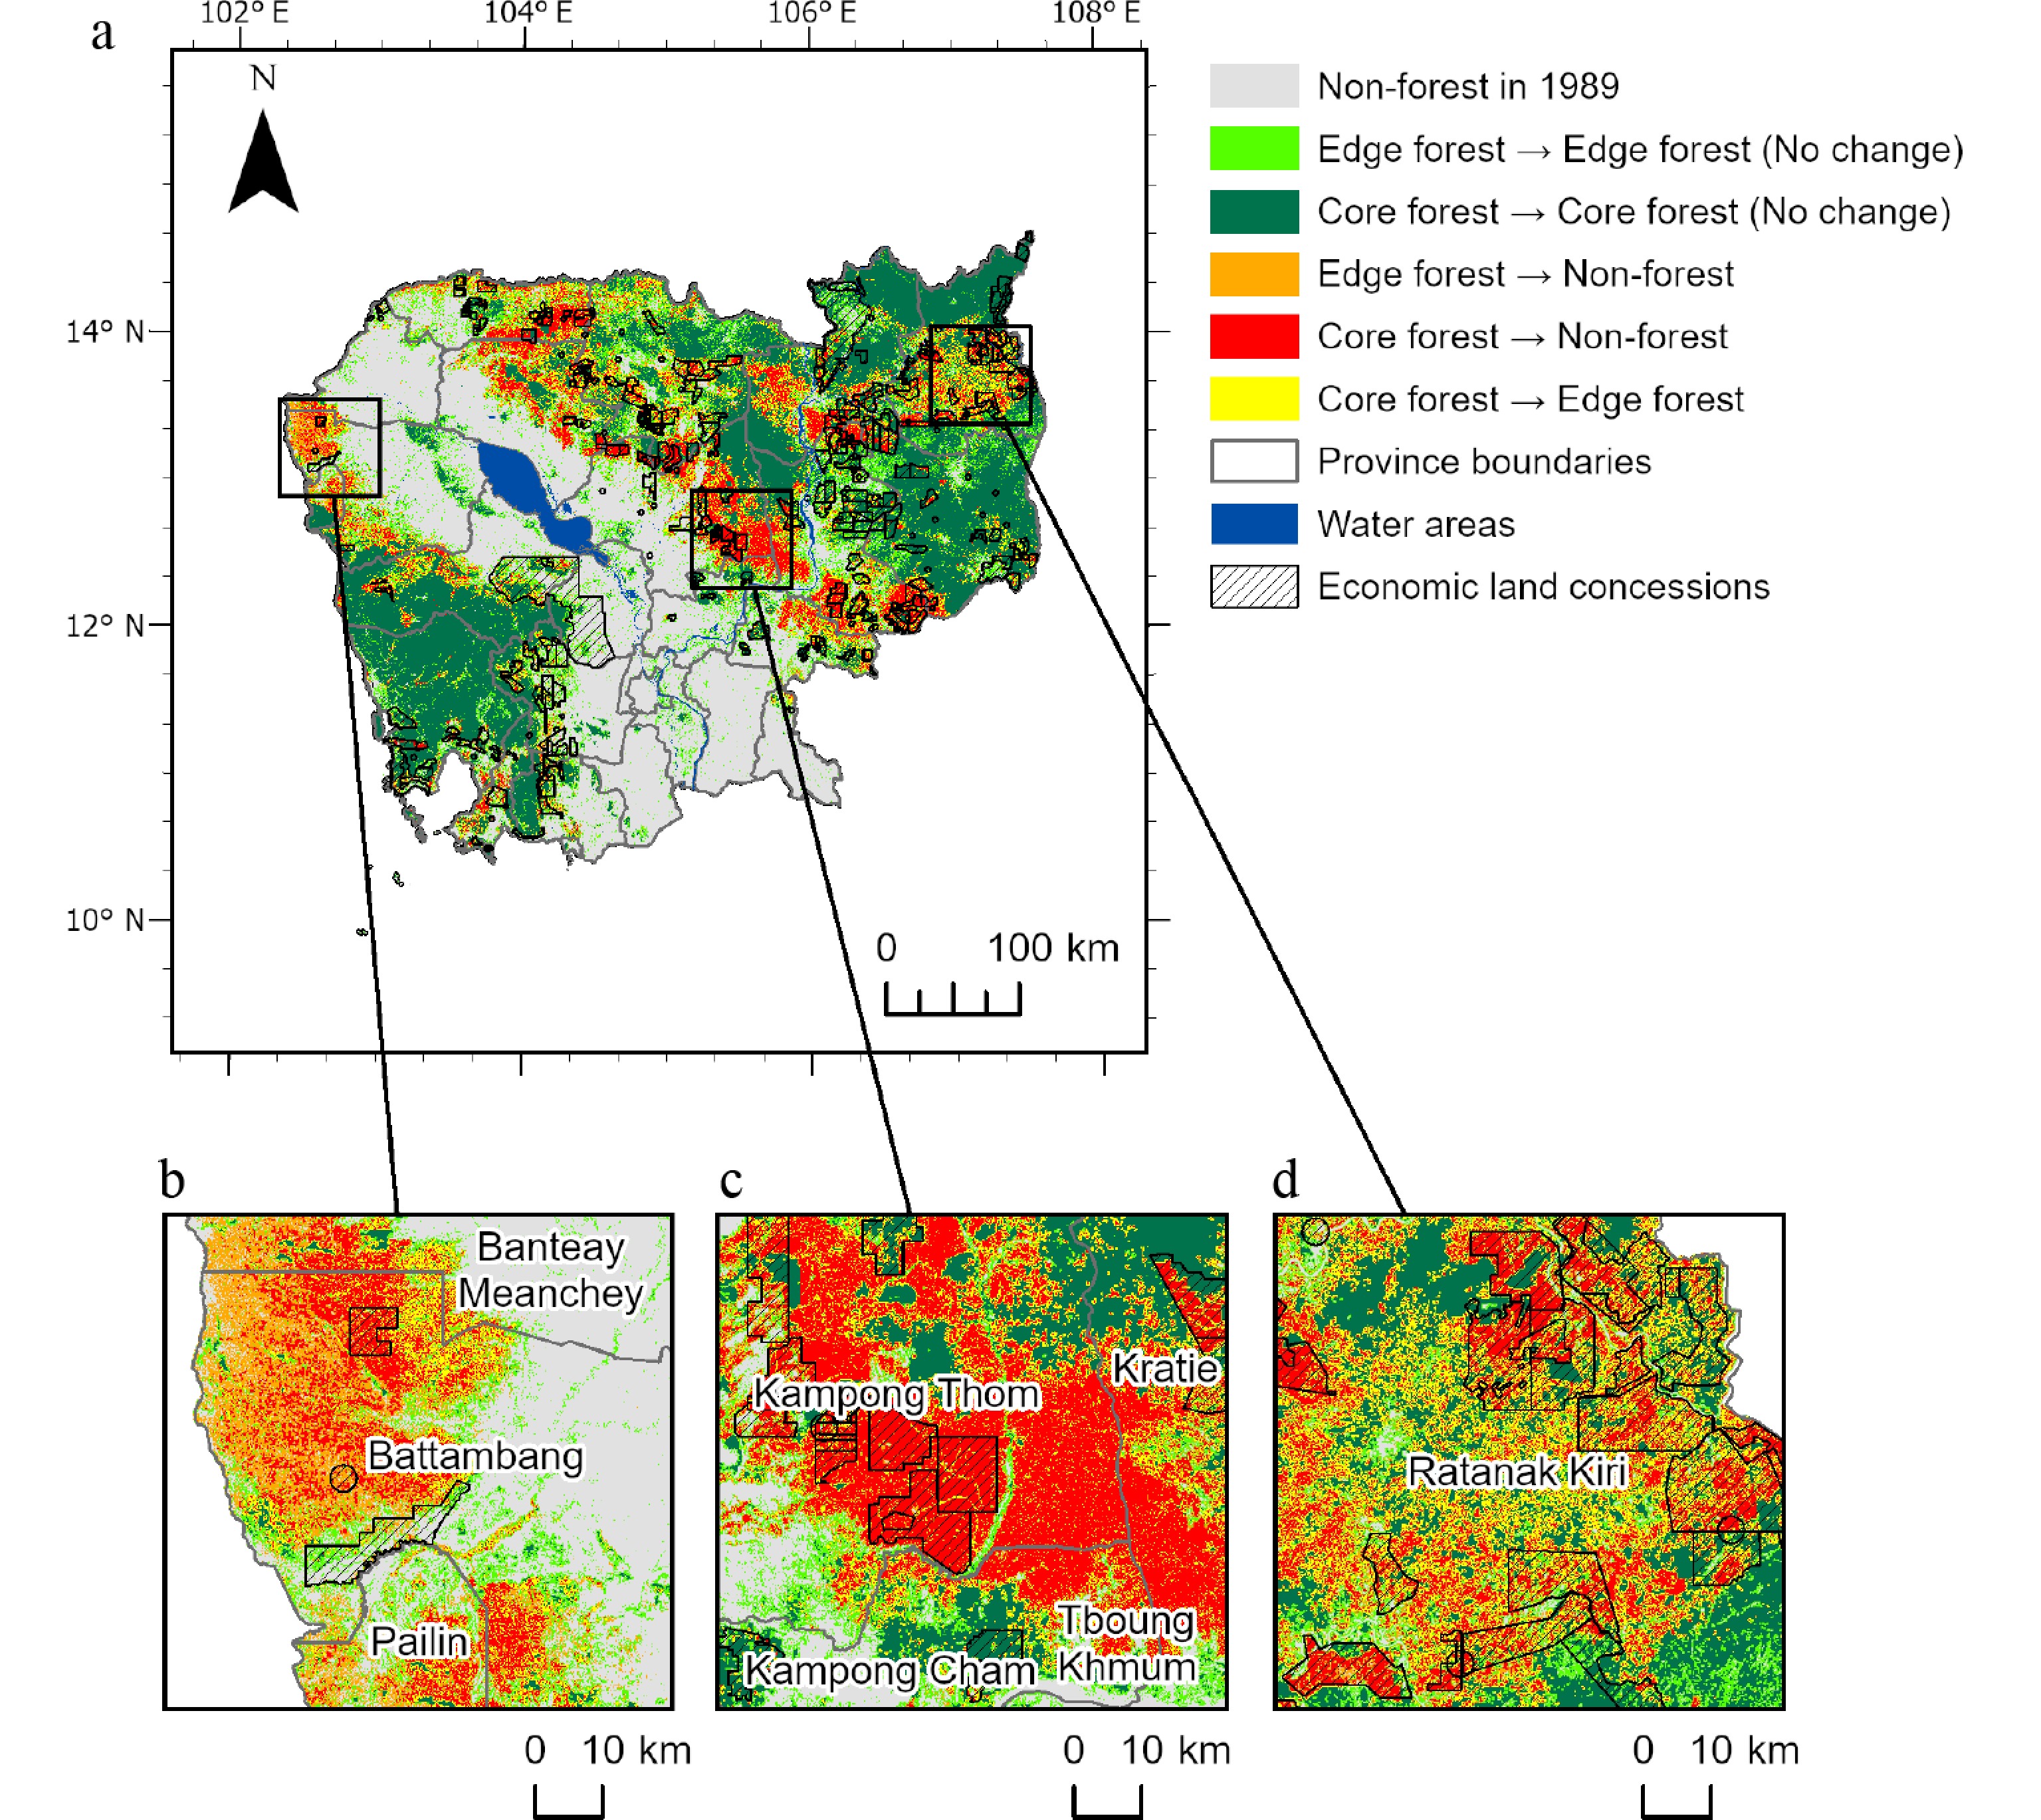
Figure 3.
Spatial patterns of forest status transitions (1989–2019) across Cambodia. (a) Forest cover changes across the entire country. (b) Changes in forest cover in the western region of Cambodia, near the Thai border in Battambang and Pailin Provinces. (c) Changes in forest cover in the central region of Cambodia, around Kampong Thom Province. (d) Changes in forest cover in the northeastern region of Cambodia, around Ratanakiri Province.
Forest fragmentation
-
The annual changes in each landscape metric highlight a clear trajectory of forest fragmentation in Cambodia (Fig. 4). NP of forest has steadily increased over the years. From 1989 to 2019, NP of forest grew from 237,921 to 602,529, representing a nearly 1.5 fold increase. By contrast, NP of non-forest areas initially decreased and then increased, but overall it remained relatively stable throughout the study period. At the same time, MPS of forest decreased consistently, dropping from 48.4 ha in 1989 to 15.6 ha in 2019. This trend underscores a progressive fragmentation of forest landscapes, with larger patches breaking into smaller ones over time. AWMSI of the forest also exhibited significant changes over the study period (Fig. 4c). Between 1989 and 2003, AWMSI remained relatively stable, fluctuating at around 90. However, after 2003, it began to rise, increasing from 87.8 in 2003 to 146.0 in 2019, suggesting that forest patches became increasingly irregular in shape over time. Fragmentation is evident from the increasing NP, decreasing MPS, and more irregular patch shapes.
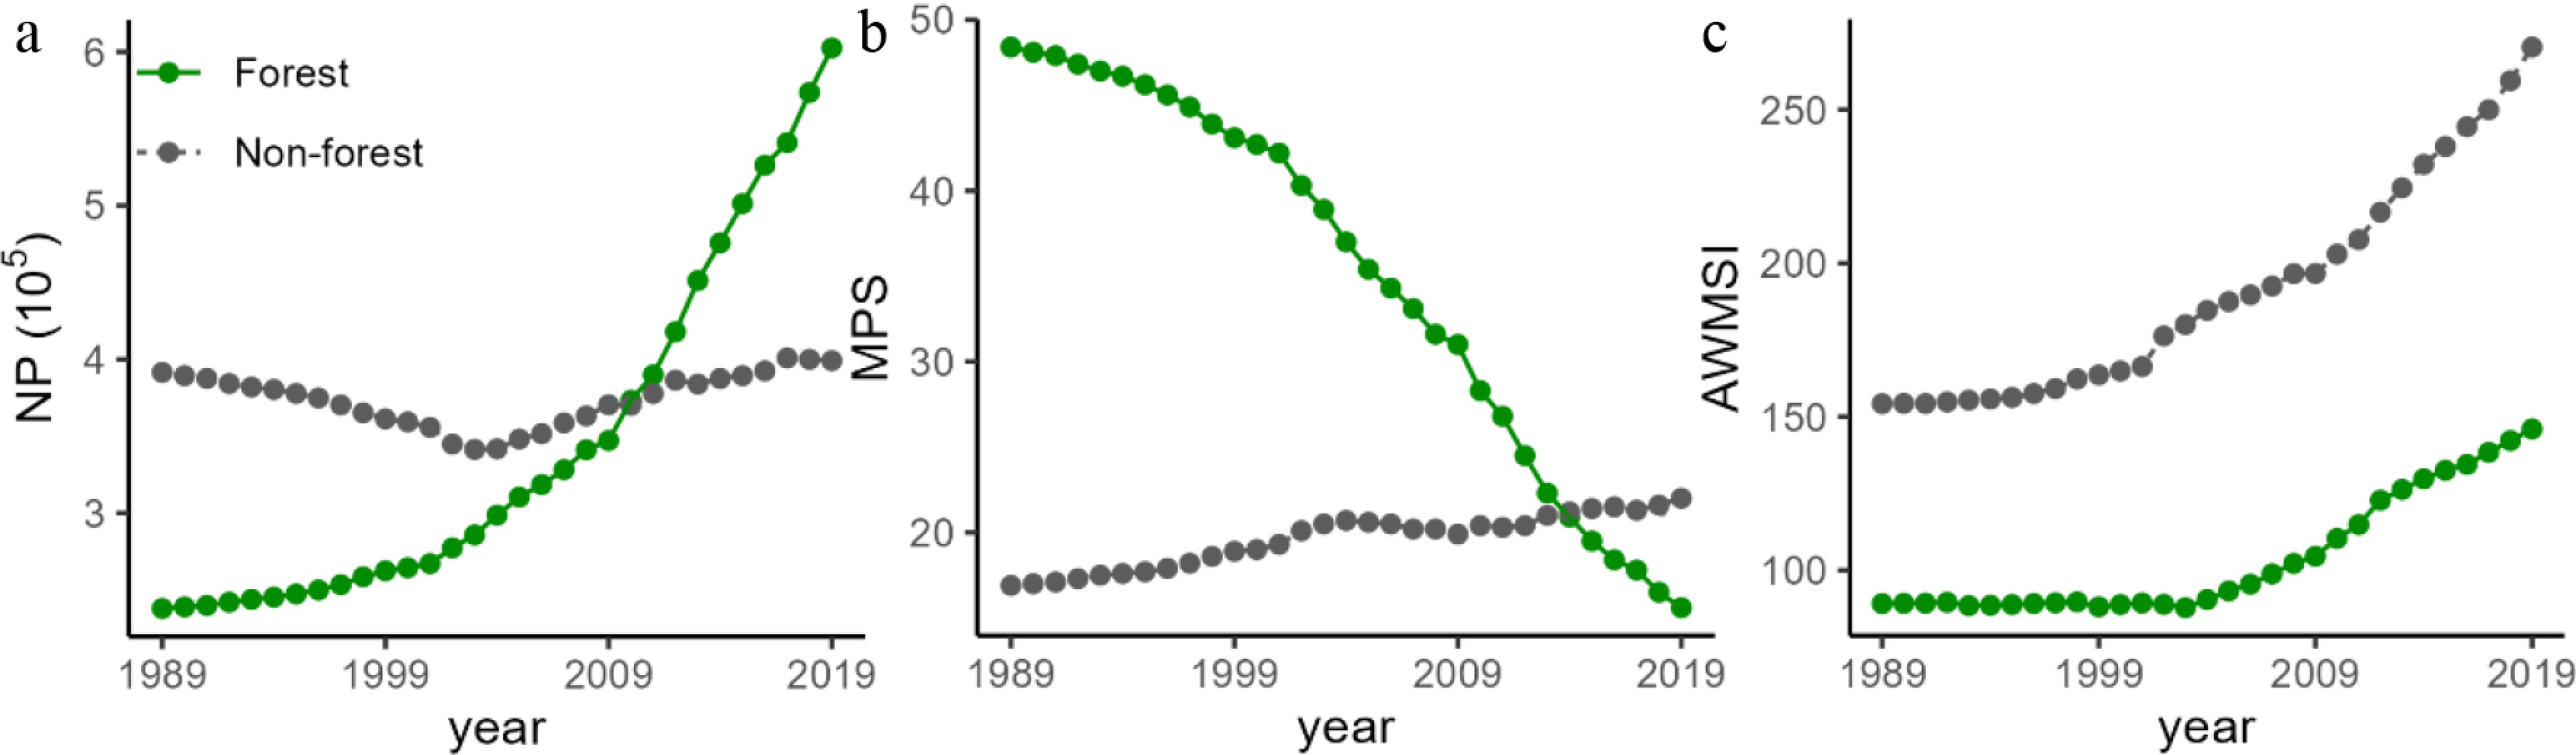
Figure 4.
Temporal trends in forest landscape metrics from 1989 to 2019. (a) Number of patches (NP), (b) mean patch size (MPS), (c) area-weighted mean shape index (AWMSI).
Figure 5 compares the distribution of patch numbers across different size intervals between 1989 and 2019, providing a more detailed perspective on the changes. Over the 30-year period, the total number of patches increased by 1.5 times, with increases in patch numbers at all size intervals, but the most pronounced growth occurred in the smallest forest units identifiable in this study. The number of these smallest patches grew by 2.4 times, highlighting their significant contribution to the overall increase. Despite this growth, both in 1989 and 2019, most patches were concentrated in smaller size intervals. In 1989, patches smaller than 10 ha accounted for 97.4% of the total number of patches, but contributed only 1.5% to the total forest area. By 2019, while the proportion of small patches increased to 98.2%, their contribution to total forest area rose only slightly, to 3.6%. These findings emphasize that while the number of small patches has grown significantly, their contribution to overall forest area remains minimal. This pattern reinforces the ongoing trend toward forest fragmentation, characterized by an increasing dominance of small, isolated patches.
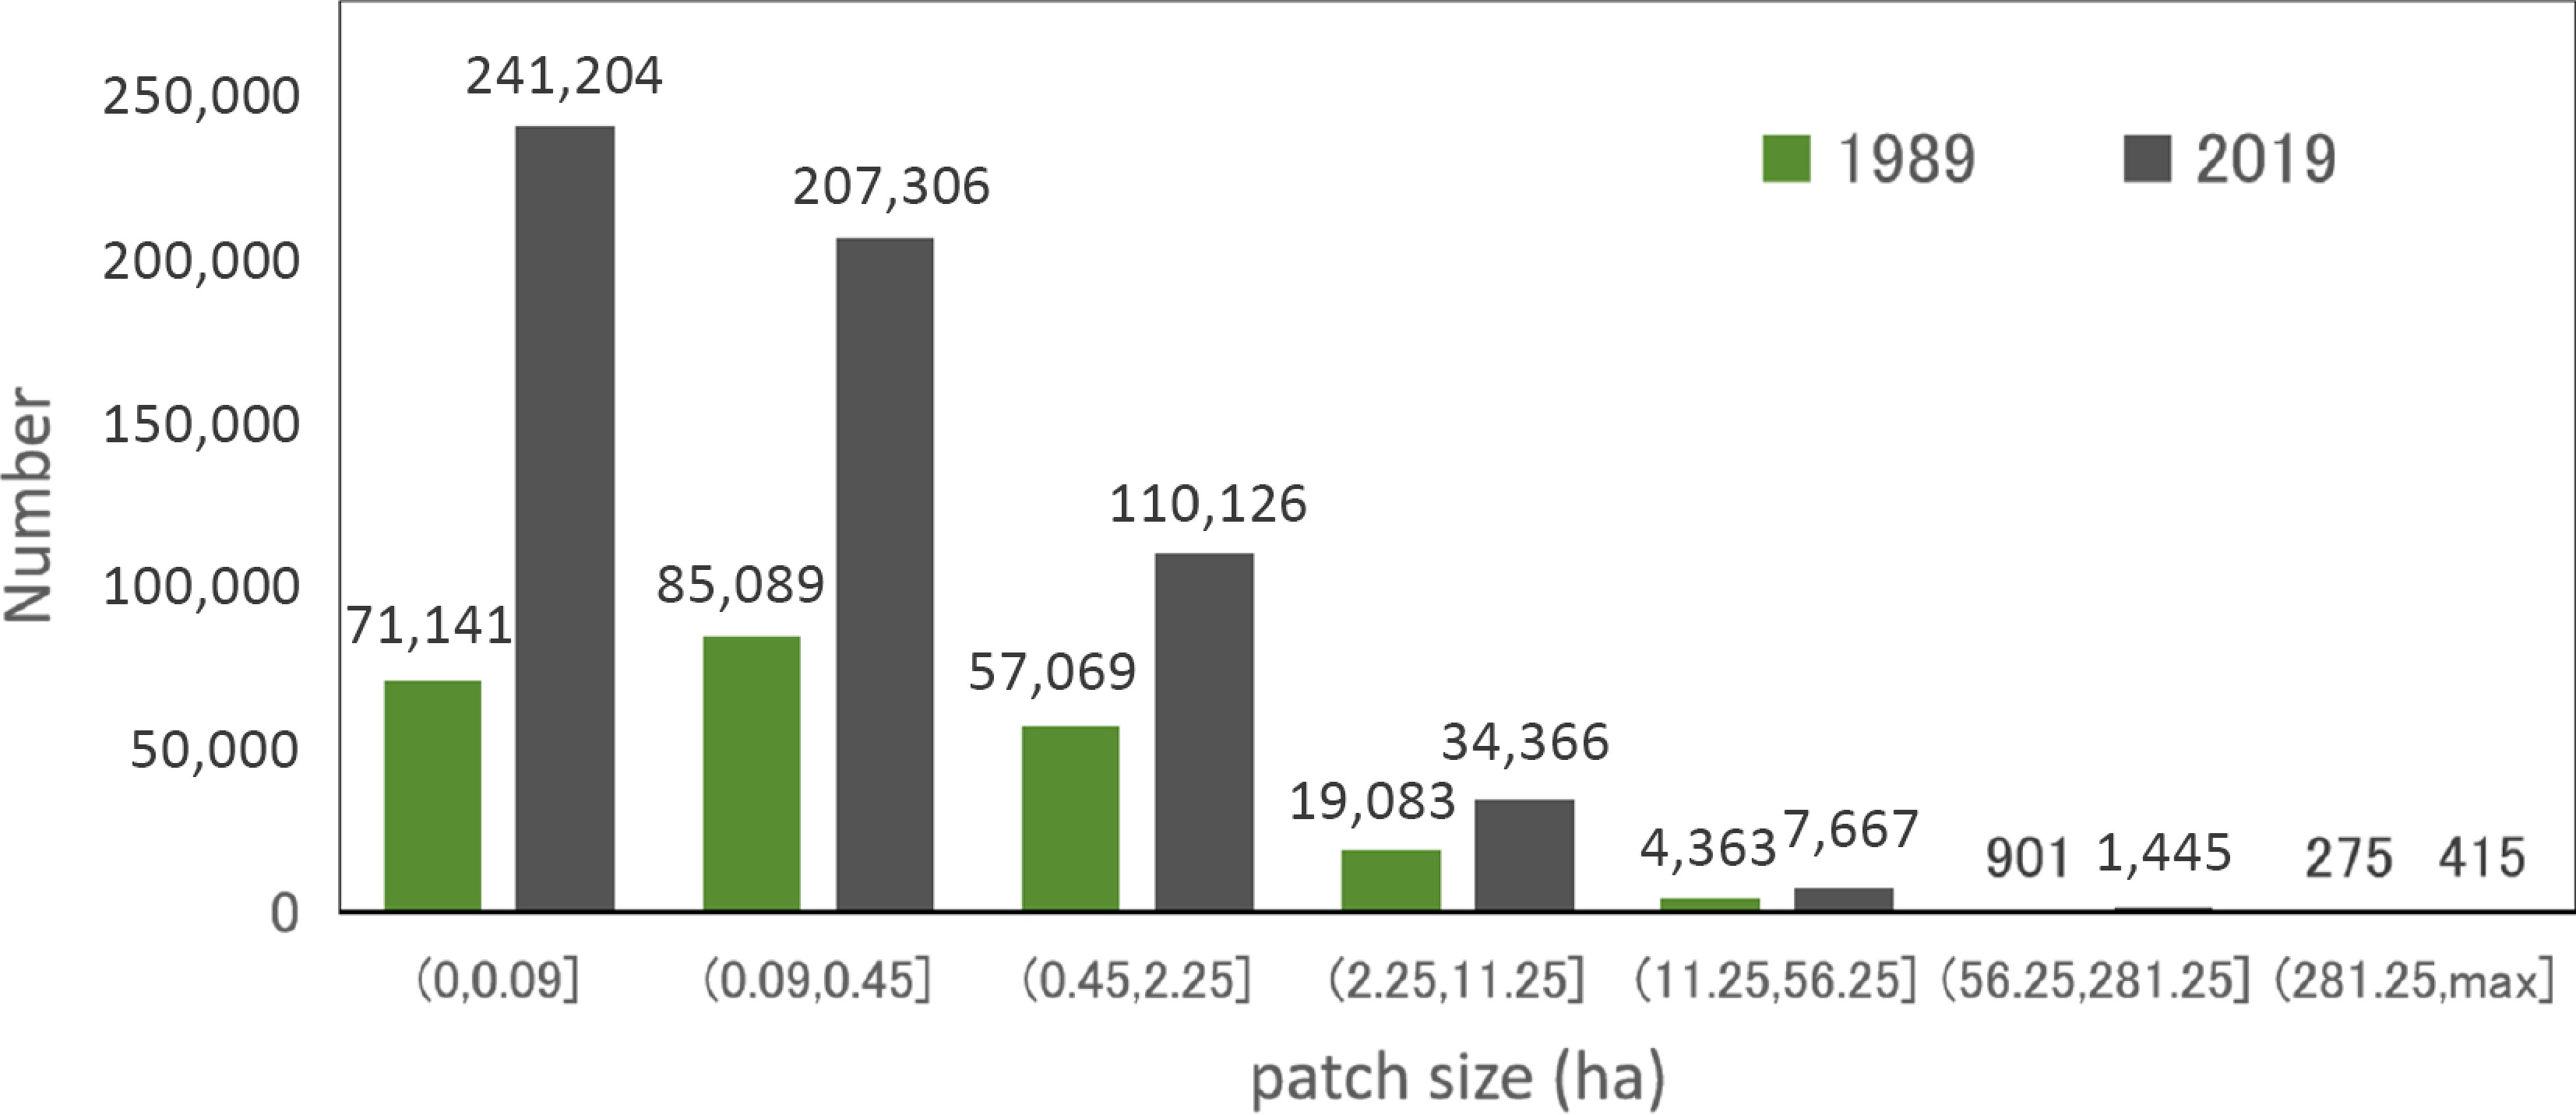
Figure 5.
Distribution of patch numbers across size intervals in 1989 and 2019.
Temporal shifts in landscape metrics
-
The application of structural break detection identified temporal shifts in forest cover changes over the study period (Fig. 6). Detailed regression results for each segment, including slopes, standard errors, and R2 are provided in Table 2. For forest area and forest core area, the optimal model fit was achieved with one breakpoint, both occurring around 2009. In each case, the trend shifted from a period of increasingly rapid forest loss to a period of slower decline, indicating a deceleration in the rate of forest reduction. In contrast, forest edge area exhibited a more complex pattern with three breakpoints identified in 2002, 2008, and 2012. Prior to 2002, the increase in edge area was relatively modest. From 2002 to 2008, the rate of increase accelerated, and after 2008, the trend steepened further, indicating a rapid expansion of forest edges. However, beginning in 2012, the rate of increase sharply declined, suggesting a slowdown in edge area expansion.
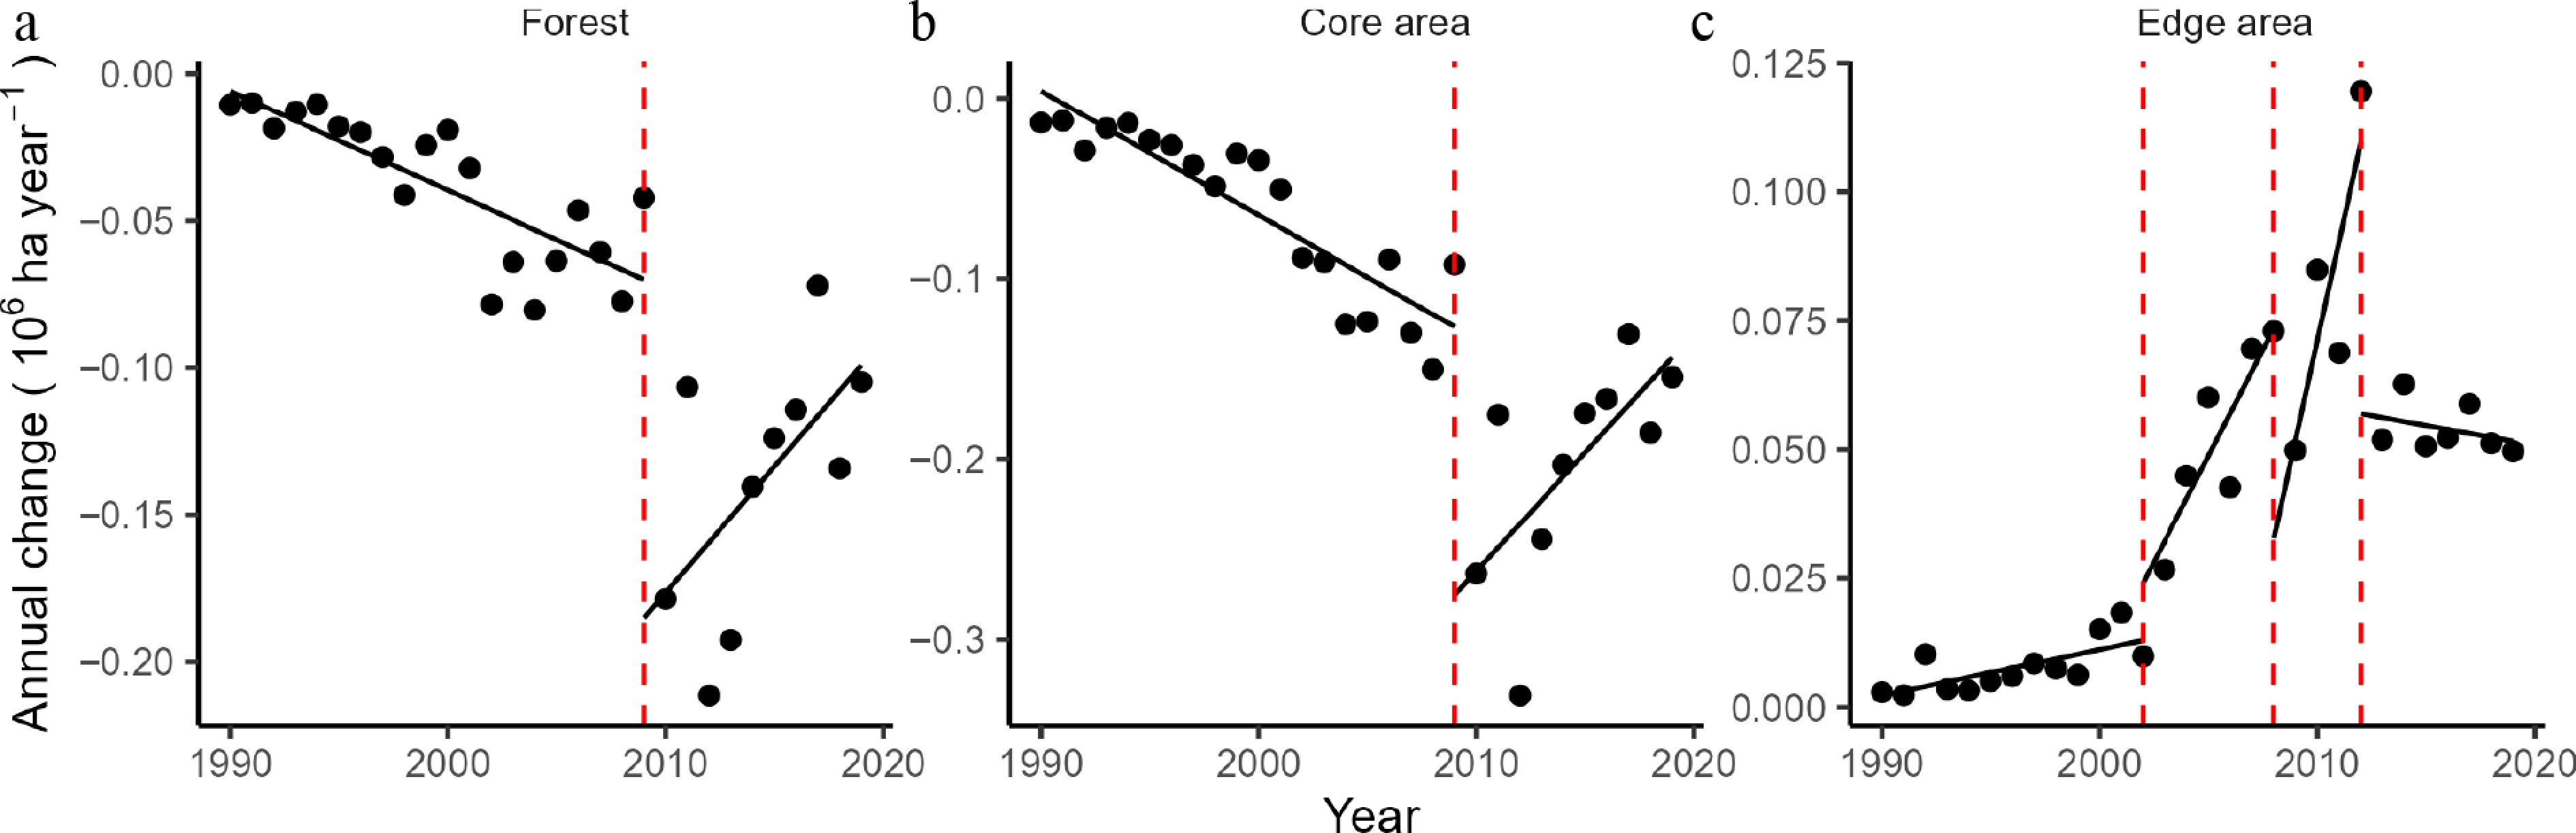
Figure 6.
Annual forest cover changes from 1989 to 2019. (a) Forest area, (b) forest core area, (c) forest edge area. Vertical dashed red lines indicate the detected break years: 2009 for forest area and core forest area, and 2002, 2008, and 2012 for edge forest area.
Table 2. Linear fitting functions for each segment of annual change in forest, core forest, and edge forest areas.
Index Segment Start year End year Parameter Estimates Standard error p value R2 Forest area 1 1989 2009 Intercept 6.70 × 100 1.16 × 100 1.83 × 10⁻⁵ 0.65 Slope −3.37 × 10⁻³ 5.82 × 10⁻⁴ 1.71 × 10⁻⁵ 2 2010 2019 Intercept −1.75 × 101 8.27 × 100 6.77 × 10⁻² 0.35 Slope 8.60 × 10⁻³ 4.11 × 10⁻³ 6.94 × 10⁻² Core area 1 1989 2009 Intercept 1.37 × 101 1.61 × 100 9.91 × 10⁻⁸ 0.80 Slope −6.88 × 10⁻³ 8.04 × 10⁻⁴ 9.28 × 10⁻⁸ 2 2010 2019 Intercept −2.67 × 101 1.06 × 101 3.54 × 10⁻² 0.44 Slope 1.32 × 10⁻² 5.25 × 10⁻³ 3.65 × 10⁻² Edge area 1 1989 2002 Intercept −1.76 × 100 5.22 × 10⁻¹ 6.24 × 10⁻³ 0.51 Slope 8.85 × 10⁻⁴ 2.61 × 10⁻⁴ 6.08 × 10⁻³ 2 2003 2008 Intercept −1.64 × 101 4.81 × 100 2.70 × 10⁻² 0.75 Slope 8.22 × 10⁻³ 2.40 × 10⁻³ 2.67 × 10⁻² 3 2008 2012 Intercept −3.87 × 101 1.75 × 101 1.58 × 10⁻¹ 0.71 Slope 1.93 × 10⁻² 8.72 × 10⁻³ 1.57 × 10⁻¹ 4 2013 2019 Intercept 1.59 × 100 1.92 × 100 4.45 × 10⁻¹ 0.11 Slope −7.64 × 10⁻⁴ 9.53 × 10⁻⁴ 4.59 × 10⁻¹ -
According to FAO statistics, the global forest cover experienced a net annual change rate of approximately −0.12% during the period 2010–2020[7]. By contrast, Cambodia's forest cover declined rapidly at an annual rate of 0.68%, underscoring severe deforestation. Core forest proportion fell from 75.8% in 1989 to 58.3% in 2019, reflecting continuous edge expansion. Notably, the loss of core forest has outpaced the overall decline in forest cover. This decline can be attributed to the formation of smaller forest patches and the amplification of edge effects. As observed in studies on forest cover in Colombia, Ecuador, and Peru, even relatively slow and stable rates of forest cover loss can result in a persistent reduction of core forest area[51]. Edge effects exacerbate environmental changes in areas near forest boundaries compared to core forest regions. These changes include alterations in microclimates, increased solar radiation, and higher wind exposure, which pose significant adaptation challenges for certain plant and animal species[18]. Studies have shown that the habitat of a large number of species has been severely damaged by the forest fragmentation in Cambodia, and concern has been expressed that populations of some species may decline or even vanish entirely[40,52].
A larger proportion of forest areas remains under pressure from edge effects, potentially compromising their ecological functions. Nonetheless, this approach allows for a more straightforward assessment of changes in core forest areas, and provides practical insights for regional conservation policies.
Forest landscape fragmentation trends in Cambodia
-
The increasing NP of forest, decreasing MPS, and growing AWMSI collectively indicate that the process of forest landscape fragmentation in Cambodia is ongoing. These metrics provide a straightforward description of the fragmentation process, highlighting the gradual degradation of forest integrity over time. The trends observed in these landscape metrics consistently align with one another, underscoring their reliability and robustness in revealing and characterizing fragmentation processes. However, variations in study scale and research methods may limit direct comparisons of Cambodia's forest landscape indices with other regions, but does not diminish the value of these metrics for site-specific analysis.
The spatial characteristics of forest fragmentation identified in this study reveal significant regional differences (Fig. 3). Results indicate that Cambodia's central and northeastern regions, once dominated by core forest areas, have experienced the most severe deforestation and fragmentation (Fig. 3b, c). These areas, where ELCs are widely distributed[53], have experienced significant fragmentation driven by the expansion of ELCs and increased agricultural activities[38]. Similarly, northwestern provinces have shown comparable trends (Fig. 3, site b), with agricultural expansion driven by market demand for crops such as cassava and maize, contributing significantly to forest fragmentation[54]. While agricultural expansion driven by market demand for crops such as cassava and maize has significantly contributed to forest fragmentation in recent decades[54], earlier forms of forest degradation were already underway during the late 1980s. Logging activities intensified as Thai companies entered into agreements with armed factions, including the Khmer Rouge, to extract timber from border forests, particularly after Thailand's domestic logging ban in 1989[55]. These operations not only financed ongoing conflict but also laid the groundwork for widespread forest degradation prior to the major agricultural expansion of the 2000s.
By contrast, the southwestern coastal regions exhibit comparatively lower levels of forest fragmentation. While limited agricultural expansion may have played a role in maintaining forest connectivity, this does not imply an absence of fragmentation, but rather indicates a slower rate of change compared to the highland regions. These distinctions highlight the importance of region-specific drivers and dynamics in shaping forest landscape changes. The relatively low fragmentation in the southwestern coastal region likely reflects a combination of factors, including topographic constraints, the presence of protected areas, and lower economic pressure compared to central and northeastern provinces.
In addition to these regional patterns, our overlay analysis provides quantitative evidence of LSLA influence on fragmentation. Forest cover declined from 79.9% to 59.2% inside ELCs (−1.12% per year), and from 60.8% to 50.7% outside ELCs (−0.60% per year) between 1989 and 2019. Core forest loss was even more pronounced inside ELCs (−2.68% per year) compared to outside (−1.36% per year). These results indicate that core forest loss inside concessions was nearly twice as fast as in non-concession areas, reinforcing the interpretation that LSLAs have disproportionately contributed to forest fragmentation.
However, because concession boundaries represent the original contract sizes, our conclusions should be understood as consistent with, rather than conclusive proof of, LSLA-driven fragmentation. Future research should integrate verified concession timelines and enforcement records to strengthen causal inference.
Policy context analysis of turning periods
-
Cambodia's forest landscape changes reflect the dynamic interplay between human activities and forest ecosystems, with notable shifts over the past three decades. These changes are marked by increasing fragmentation, core forest loss and edge expansion, highlighting the far-reaching impacts of anthropogenic pressures. Analyzing the policy context and its influence across different periods can provide critical insights into forest loss drivers, policy effectiveness, and pathways for forest landscape restoration.
Between 1989 and 2003, Cambodia's forest cover declined slowly, with landscape metrics indicating forest fragmentation, although the changes were not yet pronounced. The weakening of Khmer Rouge forces and the signing of the 1991 Paris Peace Accords marked the beginning of the peace process. However, parts of the border forests remained under Khmer Rouge control, becoming conflict zones that were largely inaccessible for large-scale commercial logging or economic activities[55]. War-induced economic stagnation and delayed infrastructure development such as roads, further restricted forest exploitation during this period. At the same time, Cambodia gradually reintegrated into the global economy, and timber emerged as a key export commodity[56]. Despite the pressures of logging, the balance between exploitation and conflict-driven protection helped slow the rate of forest decline. Additionally, early conservation efforts and international support, though limited in their implementation, contributed to a temporary stabilization of forest cover. Thus, the interplay between conflict dynamics and conservation initiatives shaped a period of relatively moderate forest loss and fragmentation.
The period around 2002 marked a critical turning point, as forest edge area began to increase substantially. ELCs were legalized in 2001, and the acceleration in fragmentation is primarily attributed to the increasing establishment of ELCs during this period[57]. This expansion notably increased forest edge areas, further accelerating fragmentation. However, the annual decrease of forest area and core forest area had already been on a consistent upward trend since 1989, and no significant change was observed around 2002. This suggests that forest clearing activities that divide core forest areas—such as road construction—may have intensified during this time. Moreover, in the later stages of this policy (2010–2012), deforestation within ELCs became particularly aggressive, with forest loss rates 29%–105% higher than those in non-ELCs[33]. In the present study, the annual decrease of forest area and core forest area, as well as the annual increase in forest edge area, were most severe during this period.
Subsequently, during the period surrounding the moratorium on new ELCs introduced in 2012, the annual changes in forest area, core forest area and forest edge area showed signs of mitigation. While previous studies have pointed out that weak enforcement and governance allowed illegal logging, land encroachment, and unsustainable practices to persist[58], resulting in continued forest cover loss and no notable mitigation in deforestation rates[59], the findings of this study show a contrasting trend to previous studies. Specifically, the annual changes in forest area, core forest area, and forest edge areas were suppressed after peaking around 2010–2012. Similar to Indonesia, where a moratorium on land concessions was associated with deforestation[34], Cambodia's suspension of new ELCs may have contributed to moderating to forest conservation. The observed moderation in forest loss and edge expansion after 2012 coincides with the moratorium on new ELCs, suggesting a potential policy influence. However, national-scale temporal correlation does not, by itself, demonstrate causality. Our interpretation should therefore be considered as consistent with a possible policy effect rather than conclusive evidence. Previous reports have indicated that, despite the moratorium, new concessions continued to be granted[42]. This suggests that enforcement was limited, and differences between our findings and those reports may reflect variations in data sources (annual Landsat-based time series vs. aggregated statistics), spatial coverage (national vs. concession-level), and fragmentation metrics, rather than forest cover alone. Future research combining concession-level data and enforcement records would be essential to clarify causal mechanisms. Sensitivity tests across 50–300 m thresholds confirm that the timing of major breakpoints—around 2009 for core forest and 2012 for edge forest—remains stable under alternative edge definitions. This robustness reinforces our interpretation that these turning points are consistent with policy interventions rather than methodological artifacts.
Addressing this ongoing fragmentation requires not only stronger governance but also targeted efforts to restore connectivity within forest landscapes. Restoring ecological corridors and reducing human pressures in highly fragmented regions are critical steps. Such measures can help rebuild habitat integrity, support biodiversity, and reduce the isolation of forest patches, which are all essential for maintaining ecosystem stability[52,60]. However, challenges remain, as competing demands for agricultural expansion and timber extraction continue to disrupt restoration efforts. For example, conflicts between conservation initiatives and land concessions frequently undermine forest connectivity, highlighting the need for more effective planning and enforcement[61].
Coordinated actions between policy makers, conservation organizations, and local communities are essential to counteract forest fragmentation[62]. By focusing on reducing fragmentation and reinforcing connectivity, Cambodia can take meaningful steps toward preserving its forest landscapes while addressing the underlying drivers of forest change. Such efforts will be crucial for ensuring long-term both ecological and socioeconomic resilience.
Limitations
-
Although plantations may provide some degree of connectivity or mitigate edge effects, treating them as equivalent to natural forests would be ecologically inappropriate. Therefore, they were excluded from our analysis. Future research could examine the role of plantations in landscape connectivity.
Although comparing fragmentation metrics inside and outside ELCs could provide additional insight into how concessions influence forest structure, this study was designed to evaluate fragmentation at the national landscape scale. Calculating patch-based metrics separately for ELC and non-ELC areas would require redefining the analytical landscape units, and therefore falls outside the scope of this nationwide assessment. We acknowledge this as a limitation, and recommend concession-level fragmentation analysis as an important direction for future research.
Our analysis assumes that ELC boundaries represent original contract sizes because spatial data on excisions or revocations are unavailable. This may lead to overestimation of concession footprints, and limit our ability to assess enforcement outcomes. The limitation prevents direct evaluation of the moratorium's effect. Nevertheless, the strong spatial contrast between concession and non-concession areas provide robust evidence consistent with LSLA-driven fragmentation.
-
Cambodia's forests face increasing pressures from economic development and land-use changes, resulting in intensified fragmentation and a significant reduction in core forest areas. This study identifies major fluctuations in forest cover patterns, with a key turning point around 2009 for forest and core forest area, and additional shifts in forest edge areas around 2002, 2008, and 2012. These temporal shifts coincide with major periods of policy change and economic activity, although this correspondence should not be interpreted as direct causality. Evidence of accelerated core forest loss and increasing fragmentation provides actionable insights for forest governance: these findings can inform the design and enforcement of moratoria on land concessions, guide stricter regulation of ELCs, and support the identification of priority areas for restoration and connectivity enhancement. Strengthening transparency and enforcement in concession management, for example, through clearer zoning and monitoring of concession boundaries, is essential, as uncontrolled expansion appeared to coincide with the peak of forest fragmentation. These directions represent feasible pathways for balancing economic development with forest conservation under Cambodia's current governance framework.
This work was supported by JSPS KAKENHI (Grant No. JP24KK0128, JP25H00453).
-
accompanies this paper online at: https://doi.org/10.48130/smartfor-0026-0003.
-
The authors confirm their contributions to the paper as follows: study conception and design: Zhao H, Ota T; analysis and interpretation of results: Zhao H; draft manuscript preparation: Zhao H, Ota T, Li Z, Mizoue N. All authors reviewed the results and approved the final version of the manuscript.
-
The data for forest fragmentation analyses were provided by Shimizu et al. (doi: 10.1080/17538947.2022.2061618).
-
The authors declare that they have no conflict of interest.
- Supplementary Table S1 Summary of breakpoint analysis for core and edge forest proportions under alternative edge thresholds (50, 100, 200, and 300 m).
- Supplementary Fig. S1 Sensitivity of core and edge forest proportions to alternative edge thresholds (50, 100, 200, and 300 m) from 1989 to 2019.
- Supplementary Fig. S2 Breakpoint analysis of core forest proportion under alternative edge thresholds (50, 100, 200, and 300 m). Vertical dashed red lines indicate break years.
- Supplementary Fig. S3 Single‑year forest status maps for 1989, 1999, 2009, and 2019.
- This article is an open access article distributed under Creative Commons Attribution License (CC BY 4.0), visit https://creativecommons.org/licenses/by/4.0/.
-
About this article
Cite this article
Zhao H, Li Z, Ota T, Mizoue N. 2026. Large-scale land acquisitions significantly affect the spatiotemporal dynamics of forest fragmentation in Cambodia. Smart Forestry 1: e006 doi: 10.48130/smartfor-0026-0003 

Large-scale land acquisitions significantly affect the spatiotemporal dynamics of forest fragmentation in Cambodia
- Received: 19 November 2025
- Revised: 06 February 2026
- Accepted: 11 February 2026
- Published online: 17 April 2026
Abstract: Policy drivers are potentially influencing large-scale deforestation in tropical regions. Deforestation has led to severe forest fragmentation, which threatens essential ecosystem services provided by remaining forests. Studies of forest fragmentation are limited by short time frames or local scales, such as protected areas or watersheds. Long-term trends and comprehensive national-level analyses, which could identify the impact of factors such as policy differences and forest management practices on forest fragmentation, remain underexplored. Here, we assessed spatiotemporal changes in core and edge forest cover from 1989 to 2019 using annual landscape metrics and identified potential policy drivers that have influenced significant forest landscape change. Results showed a 30-year decline in forest core area from 48.2% to 30.2%, accompanied by an increase in patch numbers and the area-weighted mean shape index, and a decrease in mean patch size, indicating intensified fragmentation. The most severe changes occurred between 2010 and 2012, coinciding with the rapid expansion of Economic Land Concessions (ELCs). In contrast to previous findings, our analysis indicates that forest loss and fragmentation began to moderate during the period surrounding the 2012 moratorium on new ELCs. These findings highlight the close link between policy-driven land-use changes and forest fragmentation, underscoring the urgent need for improved governance and inclusive policymaking to promote sustainable forest management.
-
Key words:
- Fragmentation /
- Landscape metrics /
- Large-scale land acquisitions (LSLAs) /
- Tropical forest /
- Cambodia