


-
Accurate measurement of DBH is fundamental to a wide range of forest science applications, including forest structure analysis, species competition assessment, ecological niche evaluation, and biomass estimation[1]. Against the backdrop of accelerating climate change and increasing anthropogenic disturbance, improving the efficiency and accuracy of DBH monitoring has become an urgent priority for both forest research and management practice. However, conventional DBH assessment relies on ground-based field measurements and plot inventories, which although accurate, are labor- and cost-intensive, limiting spatiotemporal scalability for forest monitoring[2]. Consequently, there is a growing need for cost-effective approaches that enable rapid and consistent DBH monitoring at landscape scales over extended periods.
Proximal remote sensing technologies, when integrated with artificial intelligence algorithms, offer a practical pathway for improving DBH estimation[3]. In recent years, unmanned aerial vehicles (UAVs) have been widely adopted in forest health monitoring, structural attribute assessment, tree height measurement, and biomass estimation, owing to their high efficiency, operational flexibility, and relatively low cost[4]. High-resolution RGB imagery, in particular, has emerged as a cost-effective data source due to its affordability, accessibility, broad spatial coverage, and potential for repeated measurements. These characteristics make UAV-RGB derived data a promising basis for supporting continuous updates and iterative refinement of forest digital twin workflows[5]. Recent studies have shown that texture and spectral features derived from RGB imagery can be strongly associated with DBH[6]. When coupled with machine learning techniques, these features enable high-accuracy DBH estimation, even when relying solely on two-dimensional visible-spectrum data.
In recent years, computer vision has advanced substantially in DBH estimation using high-resolution RGB imagery. With the development of image-segmentation techniques such as convolutional neural networks (CNNs) and YOLO architectures[7], deep learning has been widely adopted in forestry applications to extract individual-tree crown attributes and tree height across large forested areas[8]. However, DBH is not directly observable from RGB imagery; researchers typically estimate it indirectly using individual-tree features such as crown width and tree height, using regression-type prediction models[9]. Although strong correlations between DBH and these features have been well documented, ecosystem heterogeneity and nonlinear effects of environmental conditions and stand competition can complicate these relationships[10]. Traditional linear models often fail to capture these complex interactions effectively[11].
To address these limitations, machine learning (ML) techniques have been adopted to DBH prediction tasks[12]. Compared with traditional regression models, ML methods impose fewer parametric assumptions and can flexibly capture complex nonlinear relationships among multivariate features, thereby enhancing prediction accuracy and generalization ability[13]. Previous studies have demonstrated that Bayesian neural networks (BNNs) can accurately estimate DBH across different tree species[14], and that Support vector regression (SVR), Random forest (RF), and Artificial neural networks (ANNs) outperform traditional linear regression in modeling individual-tree DBH for larch[15]. Similarly, Iizuka[16] demonstrated that incorporating multiple variables could effectively improve the prediction accuracy of SVR for estimating the DBH of Japanese cypress (Chamaecyparis obtusa). In addition, deep learning approaches, such as Deep learning algorithms (DLAs), have also been applied to DBH estimation and have achieved notable improvements in modeling accuracy[17]. However, many existing studies emphasize maximizing accuracy with a limited set of structural predictors, whereas the integration of environmental drivers and systematic interpretability analyses of model predictions receive comparatively less attention.
Most previous studies have primarily emphasized improving predictive performance in ML-based DBH estimation, while giving comparatively less attention to model interpretability. Complex ML models are often regarded as 'black boxes', with opaque internal decision processes and unclear feature contributions, which limit their practical application in forest resource management. Shapley Additive Explanations (SHAP), a widely used post hoc interpretability framework[18], quantifies the contribution of each feature to an individual prediction and supports both global and local assessments of model behavior, thereby offering actionable insights for diagnosis and optimization of complex models[19]. As the dimensionality of input predictors increases, the focus in DBH modeling has gradually shifted from accuracy alone to joint consideration of predictive performance and interpretability[20]. Robust interpretability analysis can improve user confidence, support evidence-based model selection, and reveal key drivers and interaction patterns underlying DBH variation, thereby informing the development of regionally adaptive forest resource estimation models.
Chinese fir (Cunninghamia lanceolata (Lamb.) Hook.) is a major plantation timber species across subtropical regions and contributes substantially to regional carbon storage and timber supply. With the increasing demand for precision forest management, there is a clear need for an efficient, low-cost, and interpretable approach to individual-tree DBH estimation. Accordingly, this study investigates how stepwise multi-source feature fusion affects DBH prediction and leverages an interpretable modeling framework to better understand the determinants of DBH variation. Specifically, we aim to: (1) benchmark multiple ML models under progressively enriched feature sets; (2) quantify the marginal contributions of structural, spectral–texture, and climatic predictors to DBH estimation, and further validate the added value of climatic factors under both within-region evaluation and the stricter leave-one-site-out extrapolation setting using cross-region data; 3) employ SHAP to interpret model behavior at both global and local scales, thereby identifying key contributing factors and improving model transparency. Collectively, this work enhances UAV-RGB-based DBH estimation and provides an interpretable multi-source fusion framework that can support more intelligent forest inventory and resource monitoring.
-
The field experiment was conducted at the Huangfengqiao State-owned Forest Farm (HFQFF) in You County, Hunan Province, southern China (113°30′~113°54′ E; 27°03′~27°24′ N). The site has a humid subtropical monsoon climate, with hot, rainy summers and mild, moist winters. Mean annual temperature ranges from 18.7 to 19.1 °C, and annual precipitation ranges from 1312 to 1811 mm. The terrain is dominated by low mountains and hills, with elevations of 100~320 m and slopes of 5°~10°. The forest landscape is primarily composed of Chinese fir plantations that have experienced multiple harvests and thinning operations, resulting in substantial variation in stand density and age structure. UAV surveys and ground measurements of individual-tree attributes were conducted in August 2022. To balance survey cost while ensuring adequate plot heterogeneity, we established 20 pure Chinese fir plots (20 m × 20 m) spanning contrasting terrain conditions, stand densities, and stand ages. The spatial distribution of the plots is shown in Fig. 1.
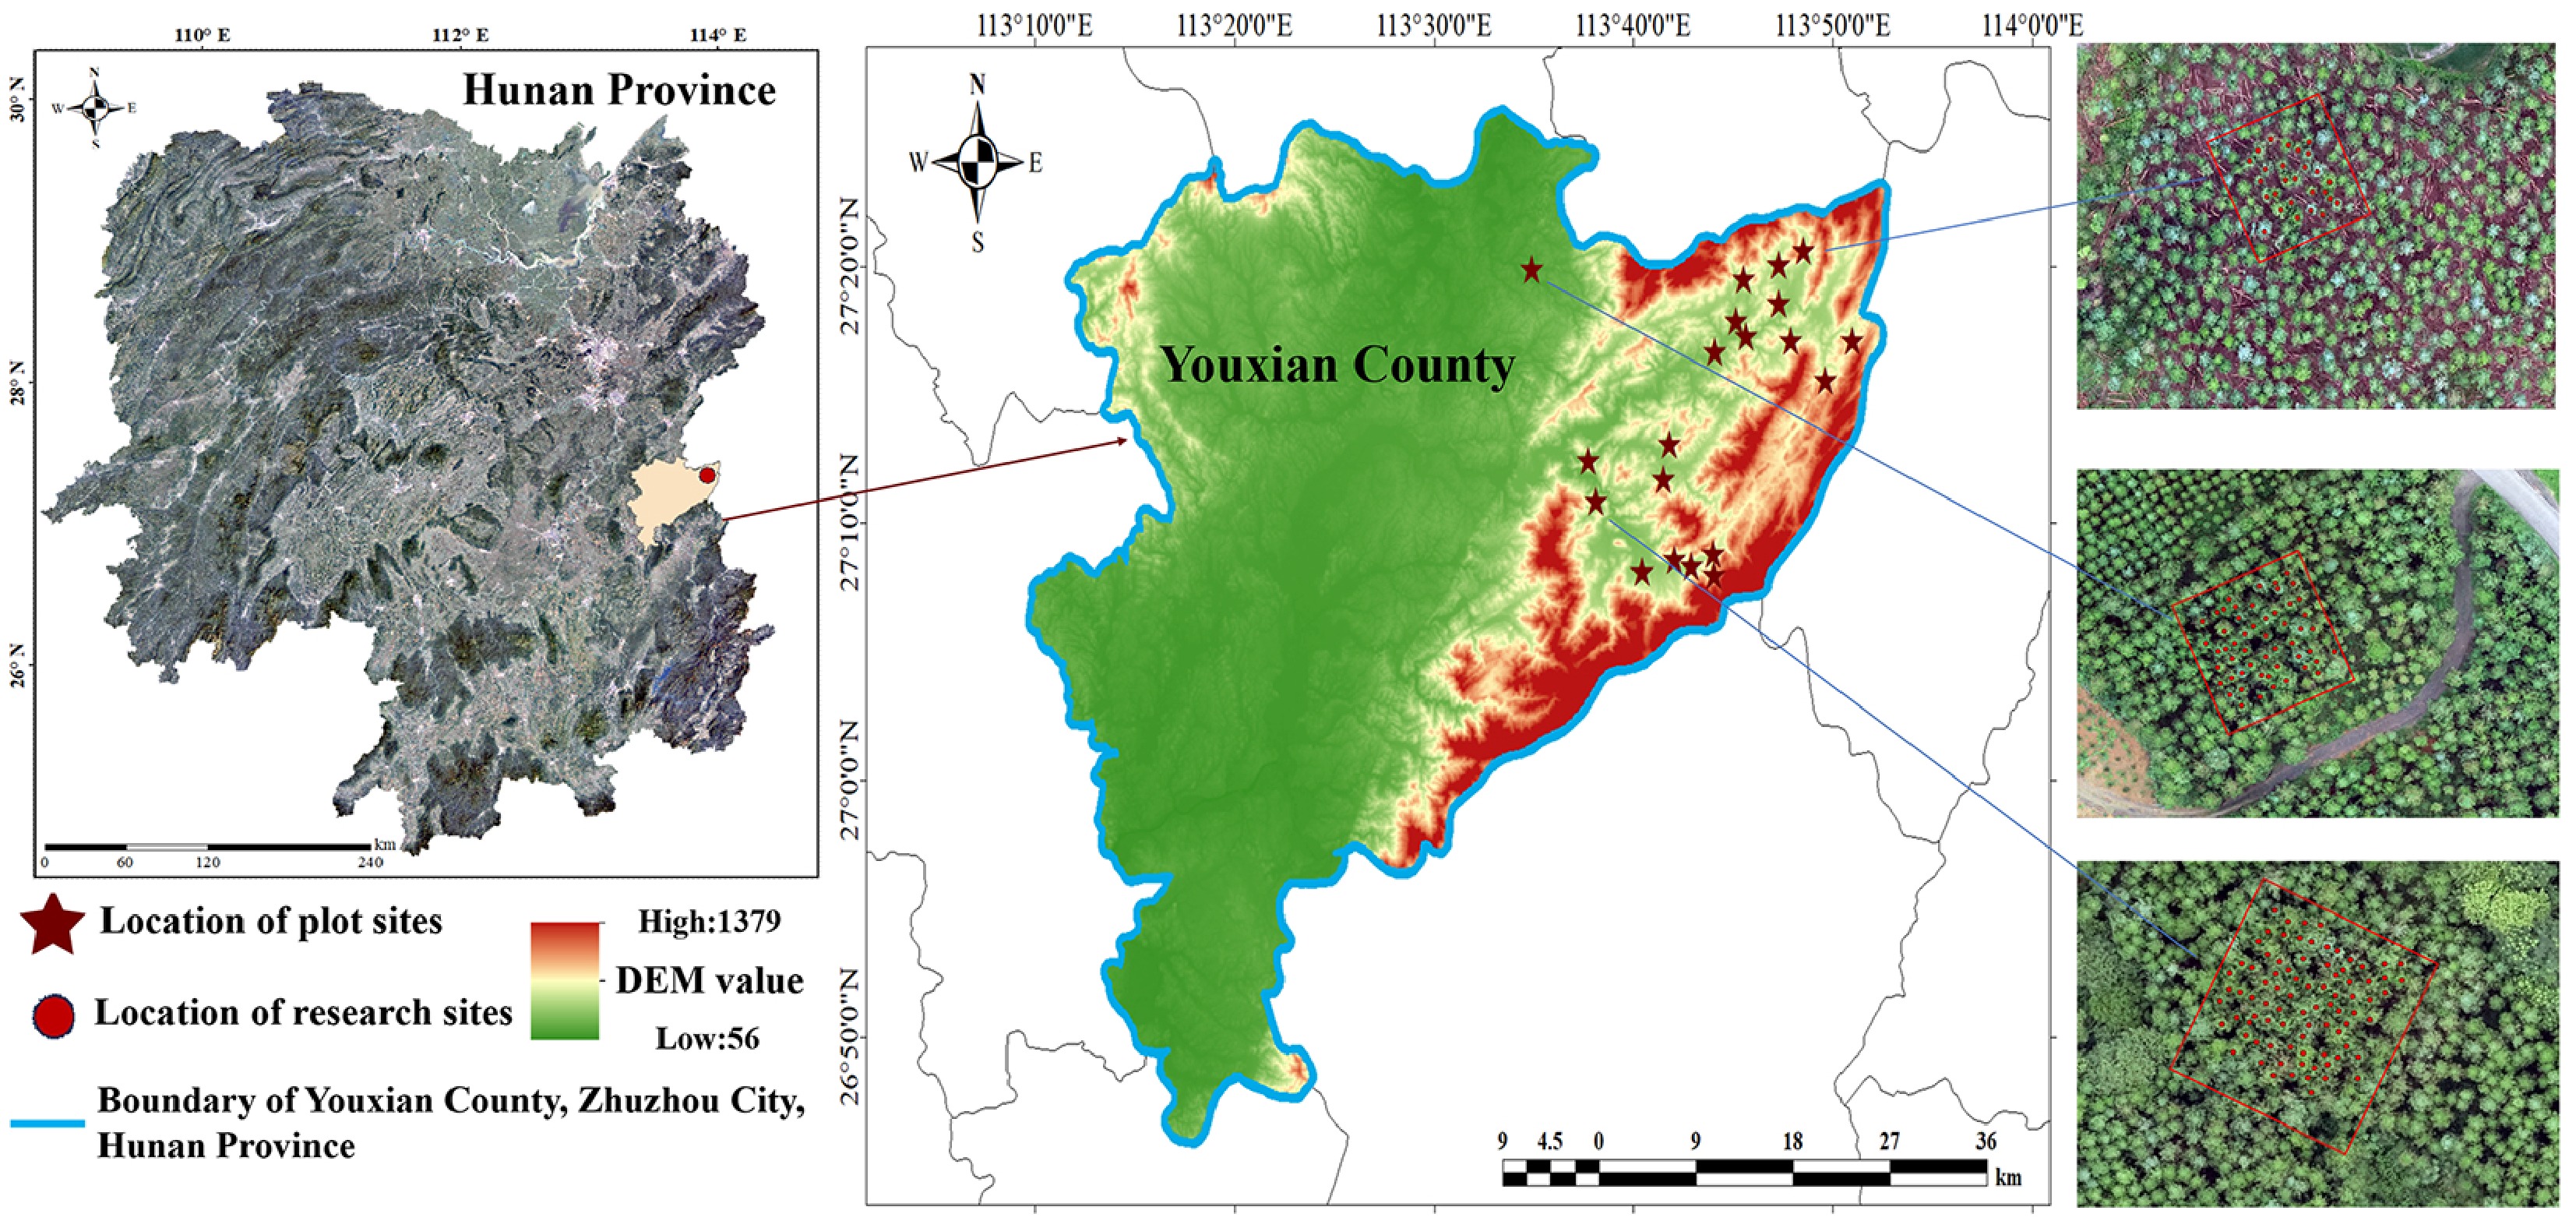
Figure 1.
Distribution of the study area and plot locations. Drawing Review Number: GS(2019)1822.
To assess the robustness of climatic predictors in terms of their contribution to DBH prediction, we further incorporated cross-region historical inventory data comprising nine independent Chinese fir plantation datasets from six regions: Zhuzhou (Hunan Province), Xinyu and Xinfeng (Jiangxi Province), Xinyang (Henan Province), Nanning (Guangxi, China), and Zunyi (Guizhou Province). The datasets were collected in different years, including Hunan (2017 and 2022) and Xinyu, Jiangxi (2019 and 2021), while the remaining regions were surveyed in 2025. All datasets contain complete field measurements of tree height, DBH, and crown width, and we additionally derived the height-to-crown-width ratio. In total, 12,059 individual-tree samples were compiled for analysis.
Data acquisition and processing
Acquisition and processing of UAV-RGB imagery
-
UAV-RGB imagery was acquired in June 2022 using a DJI Matrice 300 RTK quadcopter (DJI, Shenzhen, China) equipped with a consumer-grade Zenmuse X7 camera (DJI, Shenzhen, China). All flights were conducted around solar noon under clear-sky conditions. Flight missions were programmed in DJI Pilot to achieve 80% forward and side overlap at an altitude of 100 m above the take-off point. The images were processed in Agisoft Metashape to generate a digital orthophotography map (DOM), and a dense point cloud for the study area; the resulting DOM had a ground sampling distance of 0.10 m. A canopy height model (CHM) was then generated from the denoised and filtered dense point cloud, yielding a final spatial resolution of 0.5 m.
Sample plot data collection
-
Field-measured DBH values were obtained using a DBH ruler with 1 mm precision, and short or suppressed trees under dense canopy cover were excluded. Tree positions were recorded using an RTK-GNSS system, with a typical horizontal error of less than 0.1 m. These geolocations were used to match individual trees with UAV-derived features.
Calculation of predictive features
Individual-tree features extraction
-
Accurately delineating the canopy of individual trees from UAV-RGB imagery is a prerequisite for extracting individual tree features. This study employs the YOLOv11-Seg network for instance segmentation of Chinese fir canopies. Specifically, the model is trained on a dataset containing 580 UAV-RGB images of Chinese fir plantations, manually annotated using LabelImg. This dataset is then applied to the study plots to generate instance-level canopy masks for individual trees. All annotated images are divided into training, validation, and test sets in a 6:2:2 ratio, as shown in Table 1.
Table 1. Dataset split for crown instance segmentation.
Dataset Number of images Numbers of crowns Train 348 43,848 Validation 116 20,548 Test 116 19,738 The segmentation model and the segmentation results of some sample plots are shown in Fig. 2. To evaluate segmentation performance, we quantified detection and delineation accuracy using precision (P), recall (R), and mean average precision (mAP). On the test set, the model achieved P = 89.0%, R = 89.1%, and mAP = 93.1%. In plots with substantial crown overlap, the predictions occasionally exhibited mild over-segmentation. For such cases, we conducted manual separation and quality screening based on instance boundaries and crown-edge continuity. Ultimately, we obtained valid crown masks for 986 individual Chinese fir trees across 20 plots, which served as the individual-tree samples for subsequent DBH modeling. Finally, we overlaid the crown masks with the canopy height model (CHM) to extract four individual-tree structural features: tree height (H), crown area (CA), crown width (CW), and the height-to-crown-width ratio (H/CW).
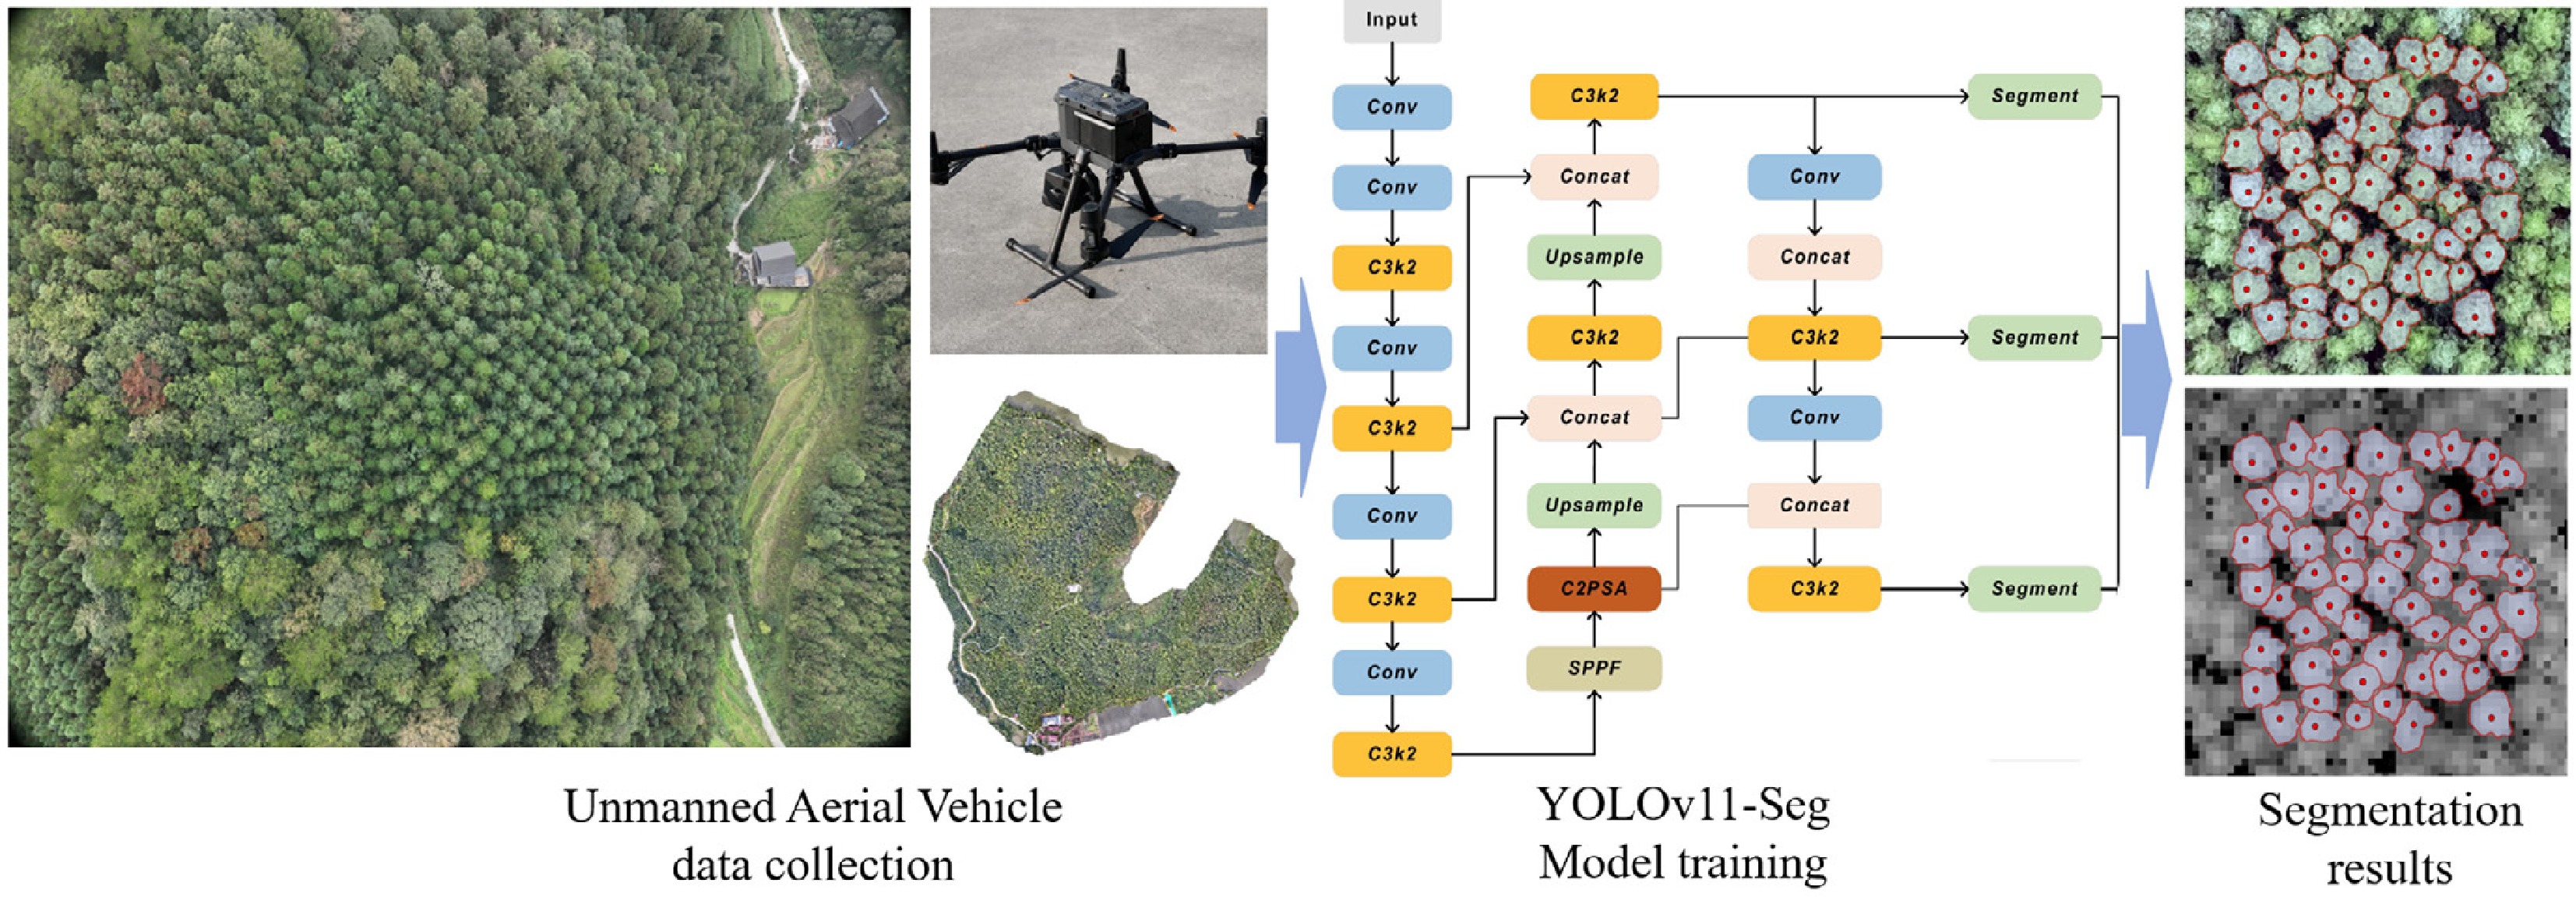
Figure 2.
Data collection and single tree crown segmentation.
Vegetation index calculation
-
Vegetation indices (VIs) were derived from the RGB channels of the UAV-RGB imagery. Compared with multispectral or hyperspectral sensors, this approach offers several advantages, including lower cost and greater computational efficiency. Previous studies have demonstrated that VIs is closely associated with key phenotypic traits such as biomass and tree height and can enhance prediction accuracy[21]. To mitigate the effects of illumination variability, the red (r), green (g), and blue (b) channels were normalized, as described in Eqs (1)–(3). Normalized digital number (DN) values were then extracted from the DOM to calculate the VIs. Ten VIs were selected and subsequently used in constructing the DBH estimation model (Table 2).
$ r=\dfrac{R}{R+G+B} $ (1) $ g=\dfrac{G}{R+G+B} $ (2) $ b=\dfrac{B}{R+G+B} $ (3) Here, R, G, and B represent the DN values of the red, green, and blue spectral bands, respectively, as extracted from UAV-RGB imagery.
Table 2. Summary of vegetation indices derived from orthorectified images of a drone used to estimate the DBH of Chinese fir.
VI Name Algorithm formula VARI Visible atmospherically resistant index $ (g-r)/(g+r-b) $ ExR Excess red vegetation index $ 1.4r-g $ ExB Excess blue vegetation index $ 1.4b-g $ ExG Excess Green Vegetation Index $ 2g-r-b $ GBRI Green–blue ratio index $ g/b $ RBRI Red–blue ratio index $ r/b $ WI Woebbecke index $ (g-b)/(r-g) $ GLI Green leaf index $ (2g-b-r)/(2g+b+r) $ NDI Normalized difference index $ (r-g)/(r+g+0.01) $ MGRVI Modified green red vegetation index $ ({g}^{2}-{r}^{2})/({g}^{2}+{r}^{2}) $ Texture index calculation
-
RGB-based texture features quantify canopy structural patterns, surface roughness, and spatial heterogeneity by characterizing the distribution of pixel intensities and the spatial dependence of gray levels across the red, green, and blue bands. In this study, we computed texture metrics using the gray-level co-occurrence matrix (GLCM), including mean (MEA), variance (VAR), homogeneity (HOM), contrast (CON), dissimilarity (DIS), entropy (ENT), angular second moment (ASM), and correlation (COR) (Table 3). These metrics describe canopy texture and were used as predictors in the DBH estimation models.
Table 3. Textural index used in this study.
TF Texture features Algorithm formula MEA Mean $ mea=\displaystyle\sum \limits_{i,j}^{N-1}{iP}_{i,j} $ VAR Variance $ var=\displaystyle\sum \limits_{i,j=0}^{N-1}{iP}_{i,j}{(i-mea)}^{2} $ HOM Homogeneity $ hom=\displaystyle\sum \limits_{i,j=0}^{N-1}i\dfrac{{P}_{i,j}}{1+{i-j}^{2}} $ CON Contrast $ con=\displaystyle\sum \limits_{i,j=0}^{N-1}i{P}_{i,j}{(i-j)}^{2} $ DIS Dissimilarity $ dis=\displaystyle\sum \limits_{i,j=0}^{N-1}i{P}_{i,j}\left| i-j\right| $ ENT Entropy $ ent=\displaystyle\sum \limits_{i,j=0}^{N-1}i{P}_{i,j}\left(-\ln {P}_{i,j}\right) $ ASM Angular second moment $ asm=\displaystyle\sum \limits_{i,j=0}^{N-1}i{{{P}^{2}}}_{i,j} $ COR Correlation $ cor=\displaystyle\sum \limits_{i,j=0}^{N-1}i{P}_{i,j}\left[\dfrac{(i-mea)(j-mea)}{\sqrt{{var}_{i}*{var}_{j}}}\right] $ Forest spatial structure calculation
-
Forest spatial structure is a key determinant of stand development and ecological processes, especially in structurally heterogeneous forests. By shaping resource acquisition, competitive interactions, and community dynamics, spatial structure can influence individual-tree growth[22], and has therefore been widely incorporated into tree growth models[23]. To quantify spatial structure and neighborhood competition at the individual-tree level, we adopted the spatial-structure framework proposed by Hui et al.[24], which is based on quantitative analysis of spatial relationships among nearest-neighbor trees. Specifically, this framework characterizes local spatial patterns using two indices, Wi and Ci, which describe the spatial arrangement and competitive relationships of neighboring trees, respectively.
Climate factor extraction
-
Climatic factors for both field plots and historical sites were obtained using ClimateAP[25]. This tool estimates these variables from latitude, longitude, and elevation using a spatial interpolation method. Tree growth is influenced by a combination of climatic factors, including temperature, precipitation, and moisture availability. Following previous studies on the relationships between climate and Chinese fir growth[26], we selected 11 climatic variables for model construction: mean annual temperature (MAT), mean temperature of the warmest month (MWMT), mean temperature of the coldest month (MCMT), number of days with temperatures below 0 °C during the year (DD0), degree days above 18 °C (DD18), number of frost-free days (NFFD), mean maximum summer temperature (TmaxSM), mean minimum winter temperature (TminWT), mean annual precipitation (MAP), the annual heat–moisture index (AHM), and the Hargreaves climatic moisture deficit (CMD). The AHM is derived by integrating MAT and MAP (see Eq. [4]), thereby capturing both thermal and moisture conditions within a given region. A higher AHM value indicates a drier environment, whereas a lower value indicates relatively humid conditions.
$ AHM=\dfrac{(MAT+10)}{(MAP+1000)} $ (4) -
In this study, we integrated multi-source predictors and evaluated six machine-learning models to estimate DBH for Chinese fir. To mitigate the influence of feature scale on model performance, all predictors were normalized using the MinMaxScaler in scikit-learn. The dataset was then randomly split into training and validation subsets at an 80:20 ratio, with stratification applied to maintain comparable distributions between the two subsets and reduce partition-induced bias. To improve model performance, we conducted a grid search with 10-fold cross-validation for hyperparameter tuning, thereby supporting robust model selection. An overview of the research workflow is presented in Fig. 3.
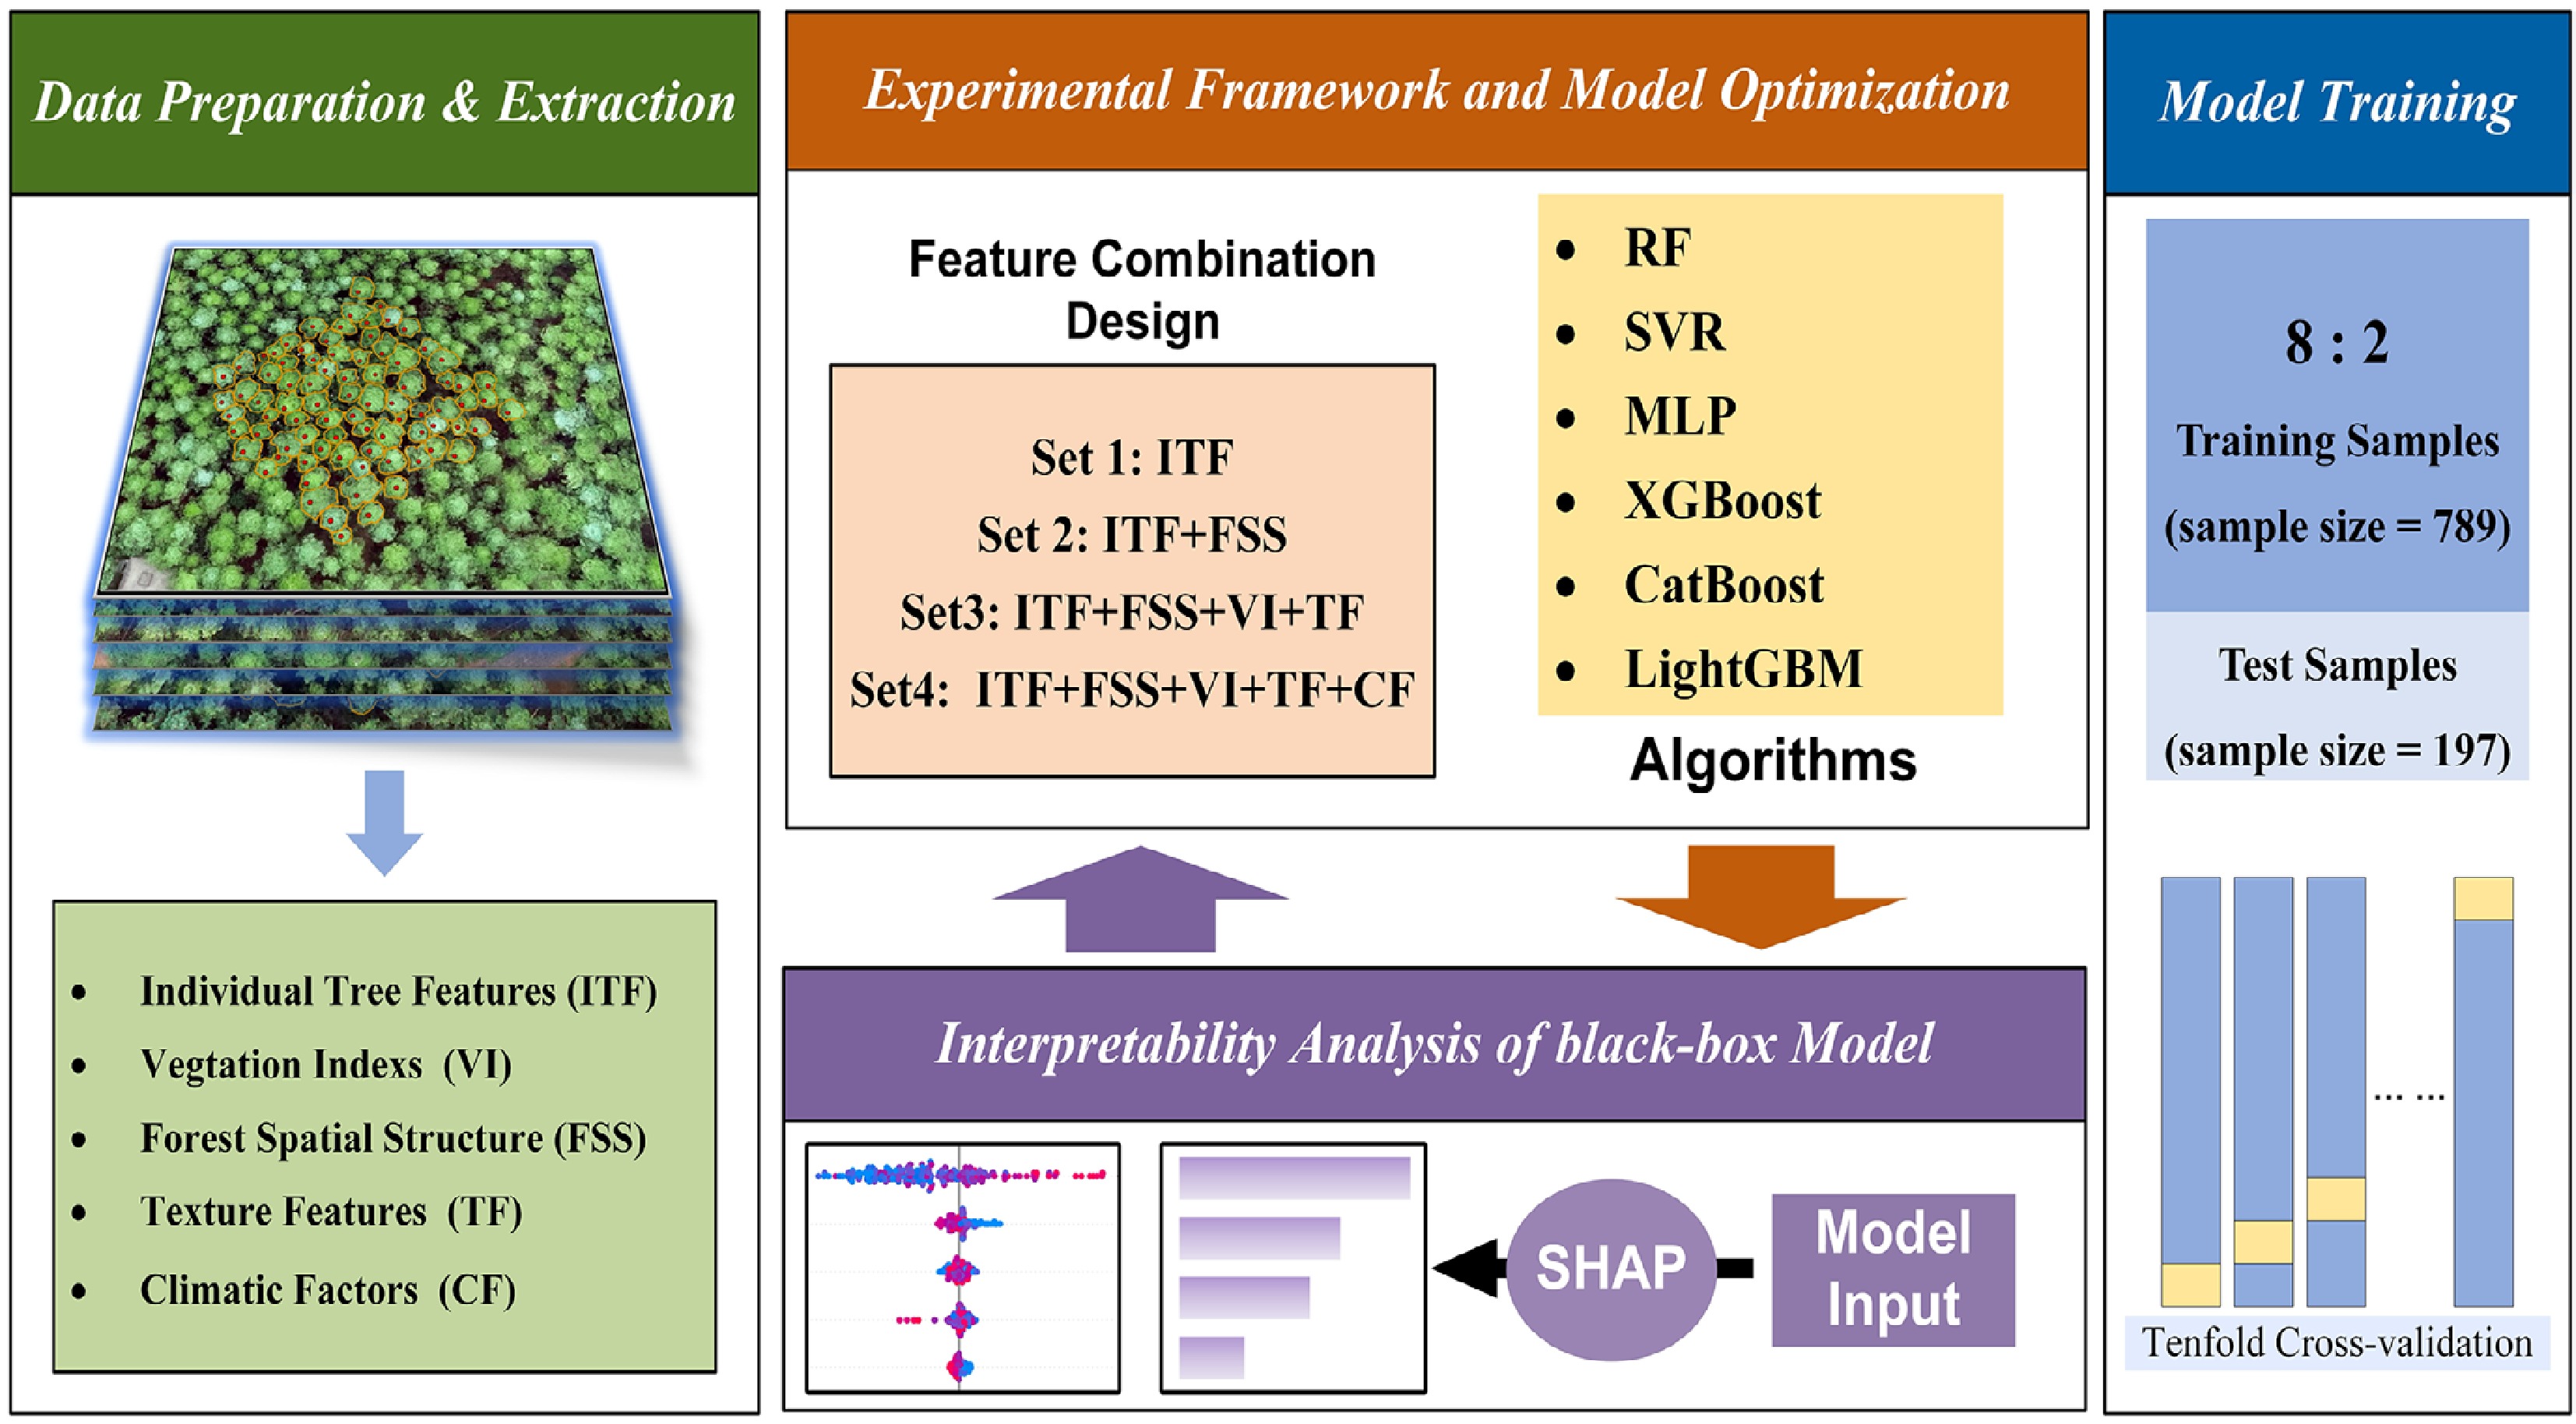
Figure 3.
Experimental framework and model optimization for DBH estimation.
To examine how different predictor groups affect DBH estimation, we defined four nested feature sets to quantify the marginal benefits of stepwise feature fusion. Specifically, Set 1 included only individual-tree features (ITF). Set 2 added forest spatial structure features (FSS) to ITF. Set 3 further incorporated vegetation indices and texture features (VI + TF), and Set 4 extended Set 3 by adding climatic factors (CF). During model development, we implemented a feature-selection and redundancy-control workflow. Candidate predictors were screened using recursive feature elimination with cross-validation (RFECV), and multicollinearity was further reduced using the variance inflation factor (VIF), yielding the final feature set for modeling. For model evaluation, we conducted within-distribution assessment by combining a random hold-out split with cross-validation, and further performed DBH class-based error analysis to examine error heterogeneity across diameter classes. To assess the robustness of climatic factors, we incorporated multi-site, multi-year historical individual-tree observations as an external validation dataset, and compared model performance under both random splitting and the stricter leave-one-site-out (LOSO) extrapolation setting. Finally, after identifying the overall best-performing model, we used Shapley Additive Explanations (SHAP) for interpretability analysis at both global and local scales, quantifying each feature's contribution to DBH predictions and elucidating the effects of key predictors. Methodological details and implementation are provided in the following subsections.
Feature engineering and redundancy control
-
Multicollinearity is a common issue in multi-source feature modeling. When predictors are strongly correlated, redundant information can reduce model stability and robustness, and can also confound feature-attribution-based interpretability analyses, thereby weakening the reliability of explanatory conclusions. To mitigate the influence of feature redundancy, we implemented a two-stage screening workflow that combines RFECV and VIF during feature selection. Specifically, we first applied RFECV using XGBoost as the base learner to conduct an initial screening of candidate predictors. RFECV was performed with 10-fold cross-validation and optimized for RMSE, removing features with low marginal utility. We then calculated VIF on the feature subset retained by RFECV and kept only predictors with VIF < 10 for the final modeling. Following this procedure, we selected 21 predictors for model development, spanning five feature groups: four individual-tree features (ITF; H, CW, CA, and H/CW), one forest spatial structure feature (FSS; Ci), eight vegetation indices (VIs; ExB, GBRI, GLI, MGRVI, RBRI, VARI, and WI), six texture features (TF; HOM, MEA, CON, COR, ENT, and ASM), and three climatic factors (CF; DD18, MAP, and MWMT). For the cross-region validation dataset, the final set comprised seven predictors: H, CW, CMD, MWMT, H/CW, MCMT, and AHM.
Modeling method
Model selection and environment configuration
-
All analyses were implemented in Python 3.9 using scikit-learn and compatible machine-learning libraries, and model training and evaluation were performed on a server equipped with an Intel(R) Xeon(R) W-2265 CPU @ 3.50 GHz. To examine the suitability of different algorithms for DBH estimation, we benchmarked six representative models spanning major methodological paradigms. Random forest (RF)[27] is an ensemble learning method based on decision trees. By constructing multiple decision trees and aggregating their outputs, RF improves regression accuracy while effectively mitigating overfitting. Support vector regression (SVR)[28] is an extension of Support vector machines (SVMs) optimized for regression tasks. It aims to minimize prediction errors while maximizing the margin within an allowed error tolerance, thereby enhancing generalization capability. EXtreme gradient boosting (XGBoost)[29] is an optimized gradient-boosting framework that enhances computational efficiency through parallelized tree modeling. It is particularly effective for capturing complex nonlinear relationships and demonstrates strong performance in regression tasks. CatBoost[30] employs an efficient gradient-boosting strategy with strong noise immunity and fast training, reducing data preprocessing requirements while improving prediction accuracy. Light gradient boosting machine (LightGBM)[31] is a decision tree-based, distributed gradient boosting framework designed for large-scale regression tasks. It has been shown to improve prediction accuracy and reduce memory consumption, making it suitable for large-scale applications.
A multilayer perceptron (MLP) is a feed-forward neural network[32] consisting of an input layer, one or more hidden layers, and an output layer. It relies on fully connected layers and nonlinear activation functions to capture complex patterns. The primary advantages of MLPs include a high degree of flexibility, scalability, and suitability for processing high-dimensional data. Through the adjustment of parameters such as the number of hidden layers and neurons, MLPs can be fine-tuned to enhance model performance across a wide range of applications, including regression and classification tasks. Overall, the selected models comprise tree-based ensembles (RF, XGBoost, CatBoost, LightGBM), a kernel-based method (SVR), and a neural network (MLP), enabling a comprehensive comparison of algorithmic families for DBH estimation.
Hyperparameter tuning
-
Hyperparameter tuning is essential for improving the predictive performance and generalization of machine-learning models because it directly governs model capacity and effective complexity. Appropriate hyperparameter choices can enhance accuracy while reducing the risk of both overfitting and underfitting. In this study, we performed hyperparameter tuning using grid search combined with 10-fold cross-validation to make more efficient use of the available data and to obtain more stable and reliable performance estimates. To prevent information leakage from preprocessing during cross-validation, Min-Max normalization was embedded in the cross-validation procedure via a scikit-learn Pipeline; that is, in each fold, the scaler parameters were fitted using only the training subset and then applied to the corresponding validation subset. The initial hyperparameter search space for each model is summarized in Table 4.
Table 4. The hyperparameters for each model have been predetermined through a grid search.
Model Hyper-parameter values RF max_samples: 0.2, 0.5, 0.8;
max_depth:1, 5, 10, 15;
min_samples_split: 2, 5, 7, 10XGBoost max_depth: 3, 5, 10, 15;
reg_lambda: 0.1, 0.5, 1, 2;
min_child_weight: 1, 5, 10, 15;
learning_rate: 0.001, 0.01, 0.1, 0.05CatBoost depth: 3, 5, 7, 10;
subsample: 0.2, 0.5, 0.8;
min_data_in_leaf: 1, 3, 5, 10;
learning_rate: 0.001, 0.01, 0.1, 0.5LightGBM subsample: 0.2, 0.5, 0.8;
max_depth: −1, 5, 10, 15;
num_leaves: 5, 10, 15, 20;
min_child_sample: 5, 10, 15, 20;
learning_rate: 0.001, 0.01, 0.1, 0.05SVR gamma: scale, auto;
kernel: rbf, sigmoid;
epsilon: 0.1, 0.3, 0.5, 0.7;
C: 0.1, 1, 10, 50, 90, 100, 110MLP solver: adam, sgd;
alpha: 0.01, 0.1, 1, 2, 5, 10;
learning_rate_init: 0.1, 0.01, 0.001, 0.05;
hidden_layer_sizes: (64, ), (64, 32), (128, ), (128,64), (128, 64, 32),
(128, 65, 32, 16)In-distribution evaluation and LOSO validation
-
To evaluate the effectiveness of multi-source feature fusion for improving DBH estimation accuracy under an in-distribution setting, we adopted an 80:20 random hold-out split to partition the data into training and test sets. Under this setting, trees from the same plot may appear in both subsets; therefore, the evaluation reflects predictive performance under in-distribution conditions. The training set was used for model fitting and hyperparameter tuning, whereas the test set was reserved exclusively for final independent assessment. To examine error heterogeneity across diameter classes, we further stratified the test set into three DBH classes (5–15, 15–20, and > 20 cm), and reported prediction errors for each class separately.
Because in-distribution evaluation can yield optimistic performance estimates due to spatial dependence, we further assessed model generalization across regions and years using nine mutually independent external validation datasets. On this external dataset collection, we conducted both within-region evaluation and leave-one-site-out (LOSO) extrapolation to quantify the incremental contribution of climatic factors under random splitting vs the stricter unseen site setting. LOSO is a spatially aware validation strategy that is substantially more stringent than within region random splitting; under this criterion, conventional modeling approaches often yield markedly more conservative metrics. Here, we applied this external evaluation to the neural-network model MLP. The within-region evaluation followed the same procedure as the in-distribution experiment above. For LOSO extrapolation, we conducted nine folds by holding out one site as the test set and combining the remaining sites for training. Given the unequal sample sizes across sites, overall performance was aggregated using sample-size weighted averaging over the hold-out test sets.
Performance evaluation
-
To quantify model predictive performance, we used mean absolute error (MAE), root mean square error (RMSE), and the coefficient of determination (R2). MAE represents the mean absolute deviation between predicted and observed values and provides an intuitive measure of average error magnitude. RMSE, defined as the square root of the mean squared error (MSE), penalizes larger errors more strongly and reflects the typical magnitude of prediction residuals. R2 measures the proportion of variance in the observed DBH explained by the model predictions, with values closer to 1 indicating better fit. The formulations of MAE, RMSE, and R2 are given in Eqs (5)–(7), respectively.
$ MAE=\dfrac{1}{N}\sum \limits_{i=1}^{N}\left| \left({y}_{i}-{\hat{y}}_{i}\right)\right| $ (5) $ RMSE=\sqrt{\dfrac{1}{N}\sum \limits_{i=1}^{N}{\left({{y}_{i}}-{{\hat{y}}_{i}}\right)}^{2}} $ (6) $ {R}^{2}=1-\dfrac{\displaystyle\sum \limits_{i=1}^{N}{\left({y}_{i}-{\hat{y}}_{{i}}\right)}^{2}}{\displaystyle\sum \limits_{i=1}^{N}{\left({{y}_{i}}-\overline{y}\right)}^{2}} $ (7) Interpretable analysis using the SHAP algorithm
-
SHAP is a model-agnostic interpretability approach grounded in cooperative game theory that attributes a model's prediction to its input features via Shapley values. A key strength of SHAP is that it estimates each feature's marginal contribution by considering all possible feature coalitions (Eq. [8]), providing a theoretically consistent basis for comparing feature effects within and, when appropriate, across models. SHAP supports both global and local interpretation: globally, it summarizes feature contributions across the dataset to identify the dominant drivers of model outputs; locally, it decomposes a single prediction into feature-level contributions, highlighting instance-specific effects that may be obscured by purely global analyses.
In this study, we used SHAP to interpret the selected DBH prediction model and employed complementary visualization tools. The SHAP summary plot summarizes global feature importance and indicates the directionality of feature effects. The SHAP waterfall plot decomposes an individual prediction into additive feature contributions, revealing the drivers of that specific estimate. Together, these visualizations facilitate a comprehensive understanding of how predictors influence DBH estimates and provide interpretable evidence to support data-driven forest parameter estimation.
$ {\phi }_{i}=\sum \limits_{S\subseteq N\backslash \left\{i\right\}}\frac{\left| S\right| !\left(\left| N\right| -\left| S\right| -1\right)!}{\left| N\right| !}\left[f(S\cup \left\{i\right\}-f(S)\right] $ (8) where,
$ {\phi }_{i} $ $ f\left(S\cup \left\{i\right\}\right) $ -
To evaluate the reliability and effectiveness of performance improvements achieved by multi-source feature fusion under an in-distribution setting, we assessed predictive performance on an independent test set that was not used for either model training or hyperparameter tuning. Model performance was quantified using MAE, RMSE, and R2, which respectively characterize the average error level, sensitivity to larger errors, and goodness of fit. Table 5 summarizes the detailed quantitative results of six machine-learning models across four feature sets (Sets 1–4), while Fig. 4 reports the relative performance gains for each model when moving from Set 1 to Set 4, thereby enabling a direct comparison of the accuracy benefits associated with higher-dimensional feature inputs. Overall, as feature dimensionality increased, MLP and SVR exhibited larger gains in predictive accuracy; in contrast, tree-based models remained more robust under lower-dimensional feature inputs.
Table 5. Evaluation metrics results for each model for four feature combination sets.
Model Set 1 Set 2 Set 3 Set 4 R2 RMSE (cm) MAE (cm) R2 RMSE (cm) MAE (cm) R2 RMSE (cm) MAE (cm) R2 RMSE (cm) MAE (cm) RF 0.78 2.15 1.63 0.78 2.16 1.63 0.79 2.11 1.58 0.81 2.06 1.54 XGBoost 0.79 2.11 1.59 0.80 2.10 1.59 0.82 1.99 1.52 0.83 1.91 1.49 CatBoost 0.79 2.15 1.61 0.79 2.13 1.60 0.81 2.05 1.54 0.82 1.95 1.51 LightGBM 0.78 2.16 1.61 0.78 2.11 1.60 0.80 2.10 1.59 0.82 1.98 1.52 SVR 0.78 2.15 1.63 0.79 2.11 1.59 0.81 2.0 1.54 0.83 1.89 1.48 MLP 0.79 2.13 1.60 0.80 2.08 1.59 0.82 1.98 1.51 0.84 1.84 1.44 Ave 0.79 2.14 1.61 0.79 2.13 1.60 0.81 2.04 1.55 0.82 1.94 1.50 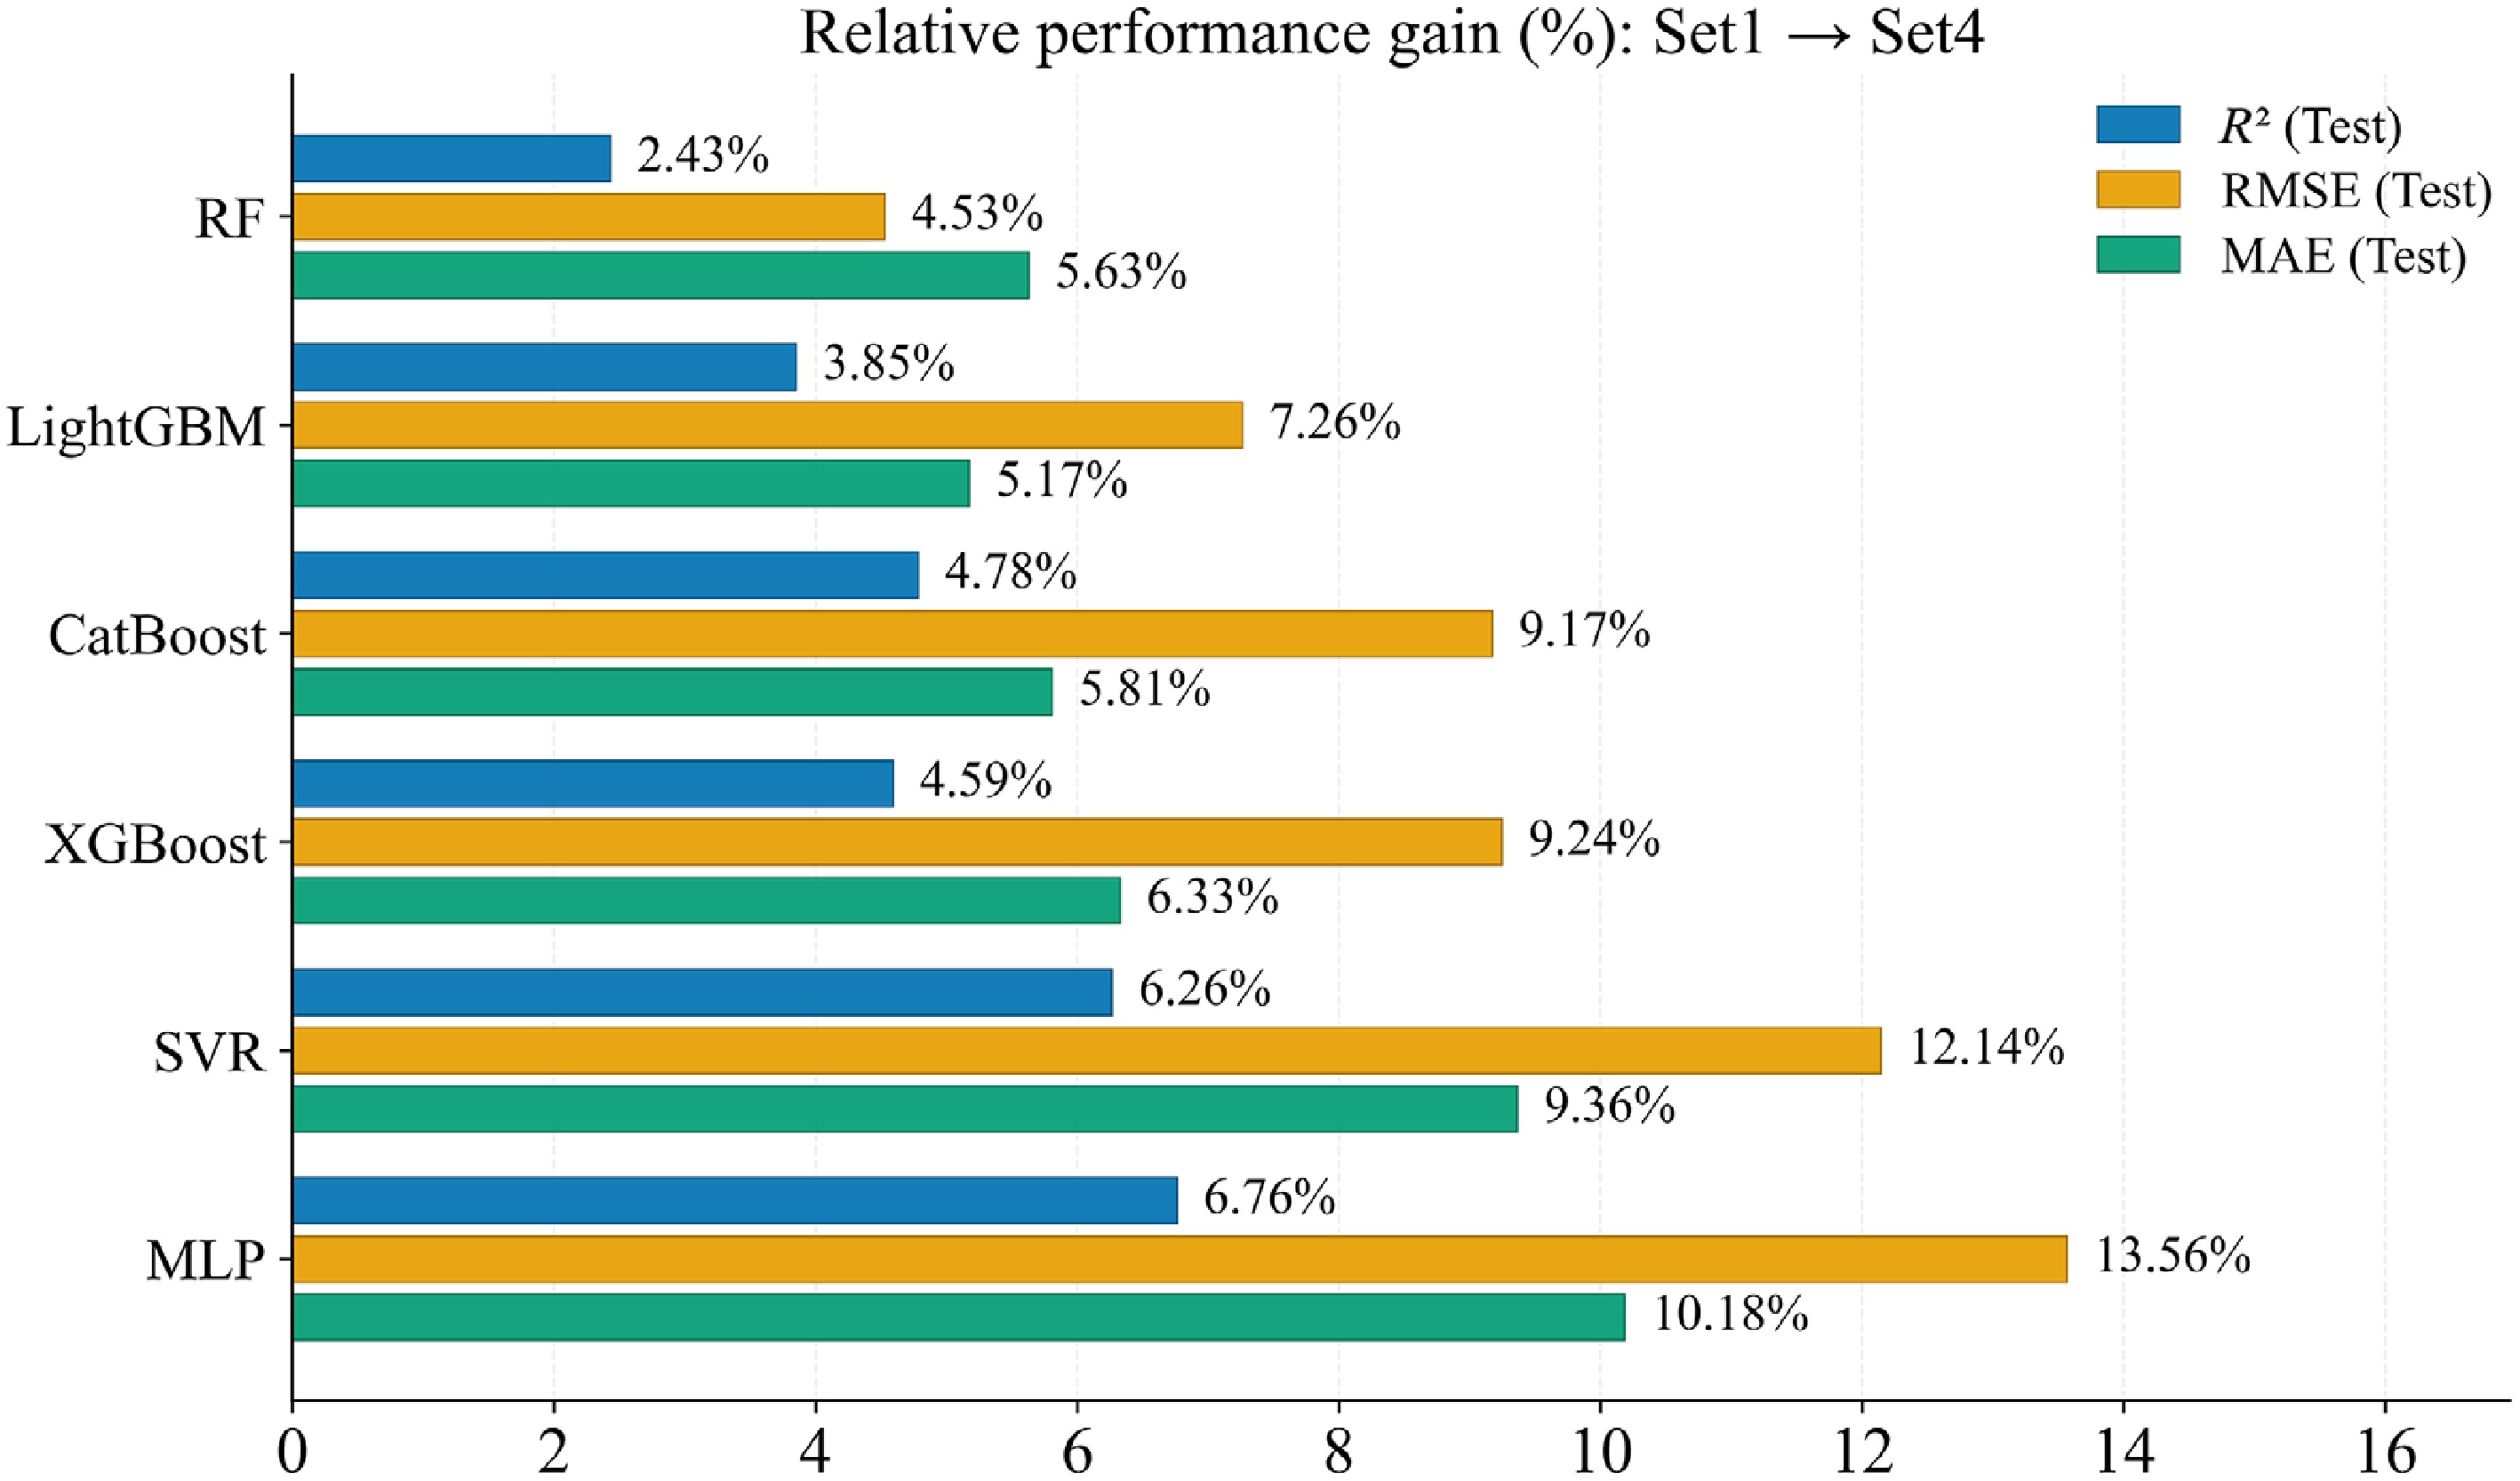
Figure 4.
Comparison of performance gains from feature fusion across models.
Across all models, the stepwise incorporation of multi-source predictors consistently improved the accuracy of DBH estimation. As spatial-structure features (FSS), vegetation indices and texture features (VI + TF), and environmental climatic factors (CF) were progressively introduced, performance peaked under Set 4, with mean MAE, RMSE, and R2 (averaged across the six models) of 1.50, 1.94, and 0.82 cm, respectively. Set 3 ranked second (MAE = 1.55 cm, RMSE = 2.04 cm, R2 = 0.81), followed by Set 2 (MAE = 1.60 cm, RMSE = 2.13 cm, R2 = 0.79), whereas Set 1 yielded the lowest accuracy (MAE = 1.61 cm, RMSE = 2.14 cm, R2 = 0.79). Relative to Set 1, incorporating FSS, VI+TF, and CF reduced MAE by 0.62%, 3.70%, and 6.80%, respectively, indicating that multi-source feature fusion leads to measurable accuracy gains.
Among all models, MLP achieved the highest predictive accuracy and attained its best performance under Set 4 (MAE = 1.44 cm, RMSE = 1.84 cm, R2 = 0.84). SVR ranked second (MAE = 1.48 cm, RMSE = 1.89 cm, R2 = 0.83). Among the tree-based models, XGBoost performed comparatively better overall, with MAE, RMSE, and R2 of 1.49, 1.91, and 0.83 cm under Set 4. Consistent with the relative performance gains shown in Fig. 3, the largest improvement under the feature-rich Set 4 was observed for MLP, followed by SVR and XGBoost; the relative MAE gains reached 10.18%, 9.36%, and 6.33%, respectively. These results further suggest that multi-source feature fusion strengthens DBH estimation performance, while models differ in their responsiveness to enriched feature inputs.
Figure 5 shows the observed-predicted regression scatter distributions of the MLP model under two feature set conditions (Set 1 and Set 4). As additional predictors were progressively incorporated, model fit improved: R2 increased from 0.79 to 0.84, MAE decreased from 1.60 to 1.44 cm, and RMSE decreased from 2.13 to 1.84 cm. In terms of the scatter patterns, test samples under Set 1 exhibit greater dispersion in the higher-DBH range. Under Set 4, the training and test point clouds become more concentrated, the fitted line shows a smaller offset, and both overall bias and dispersion are reduced; meanwhile, the contraction of the 95% confidence band around the fitted line indicates increased certainty in the estimated relationship.
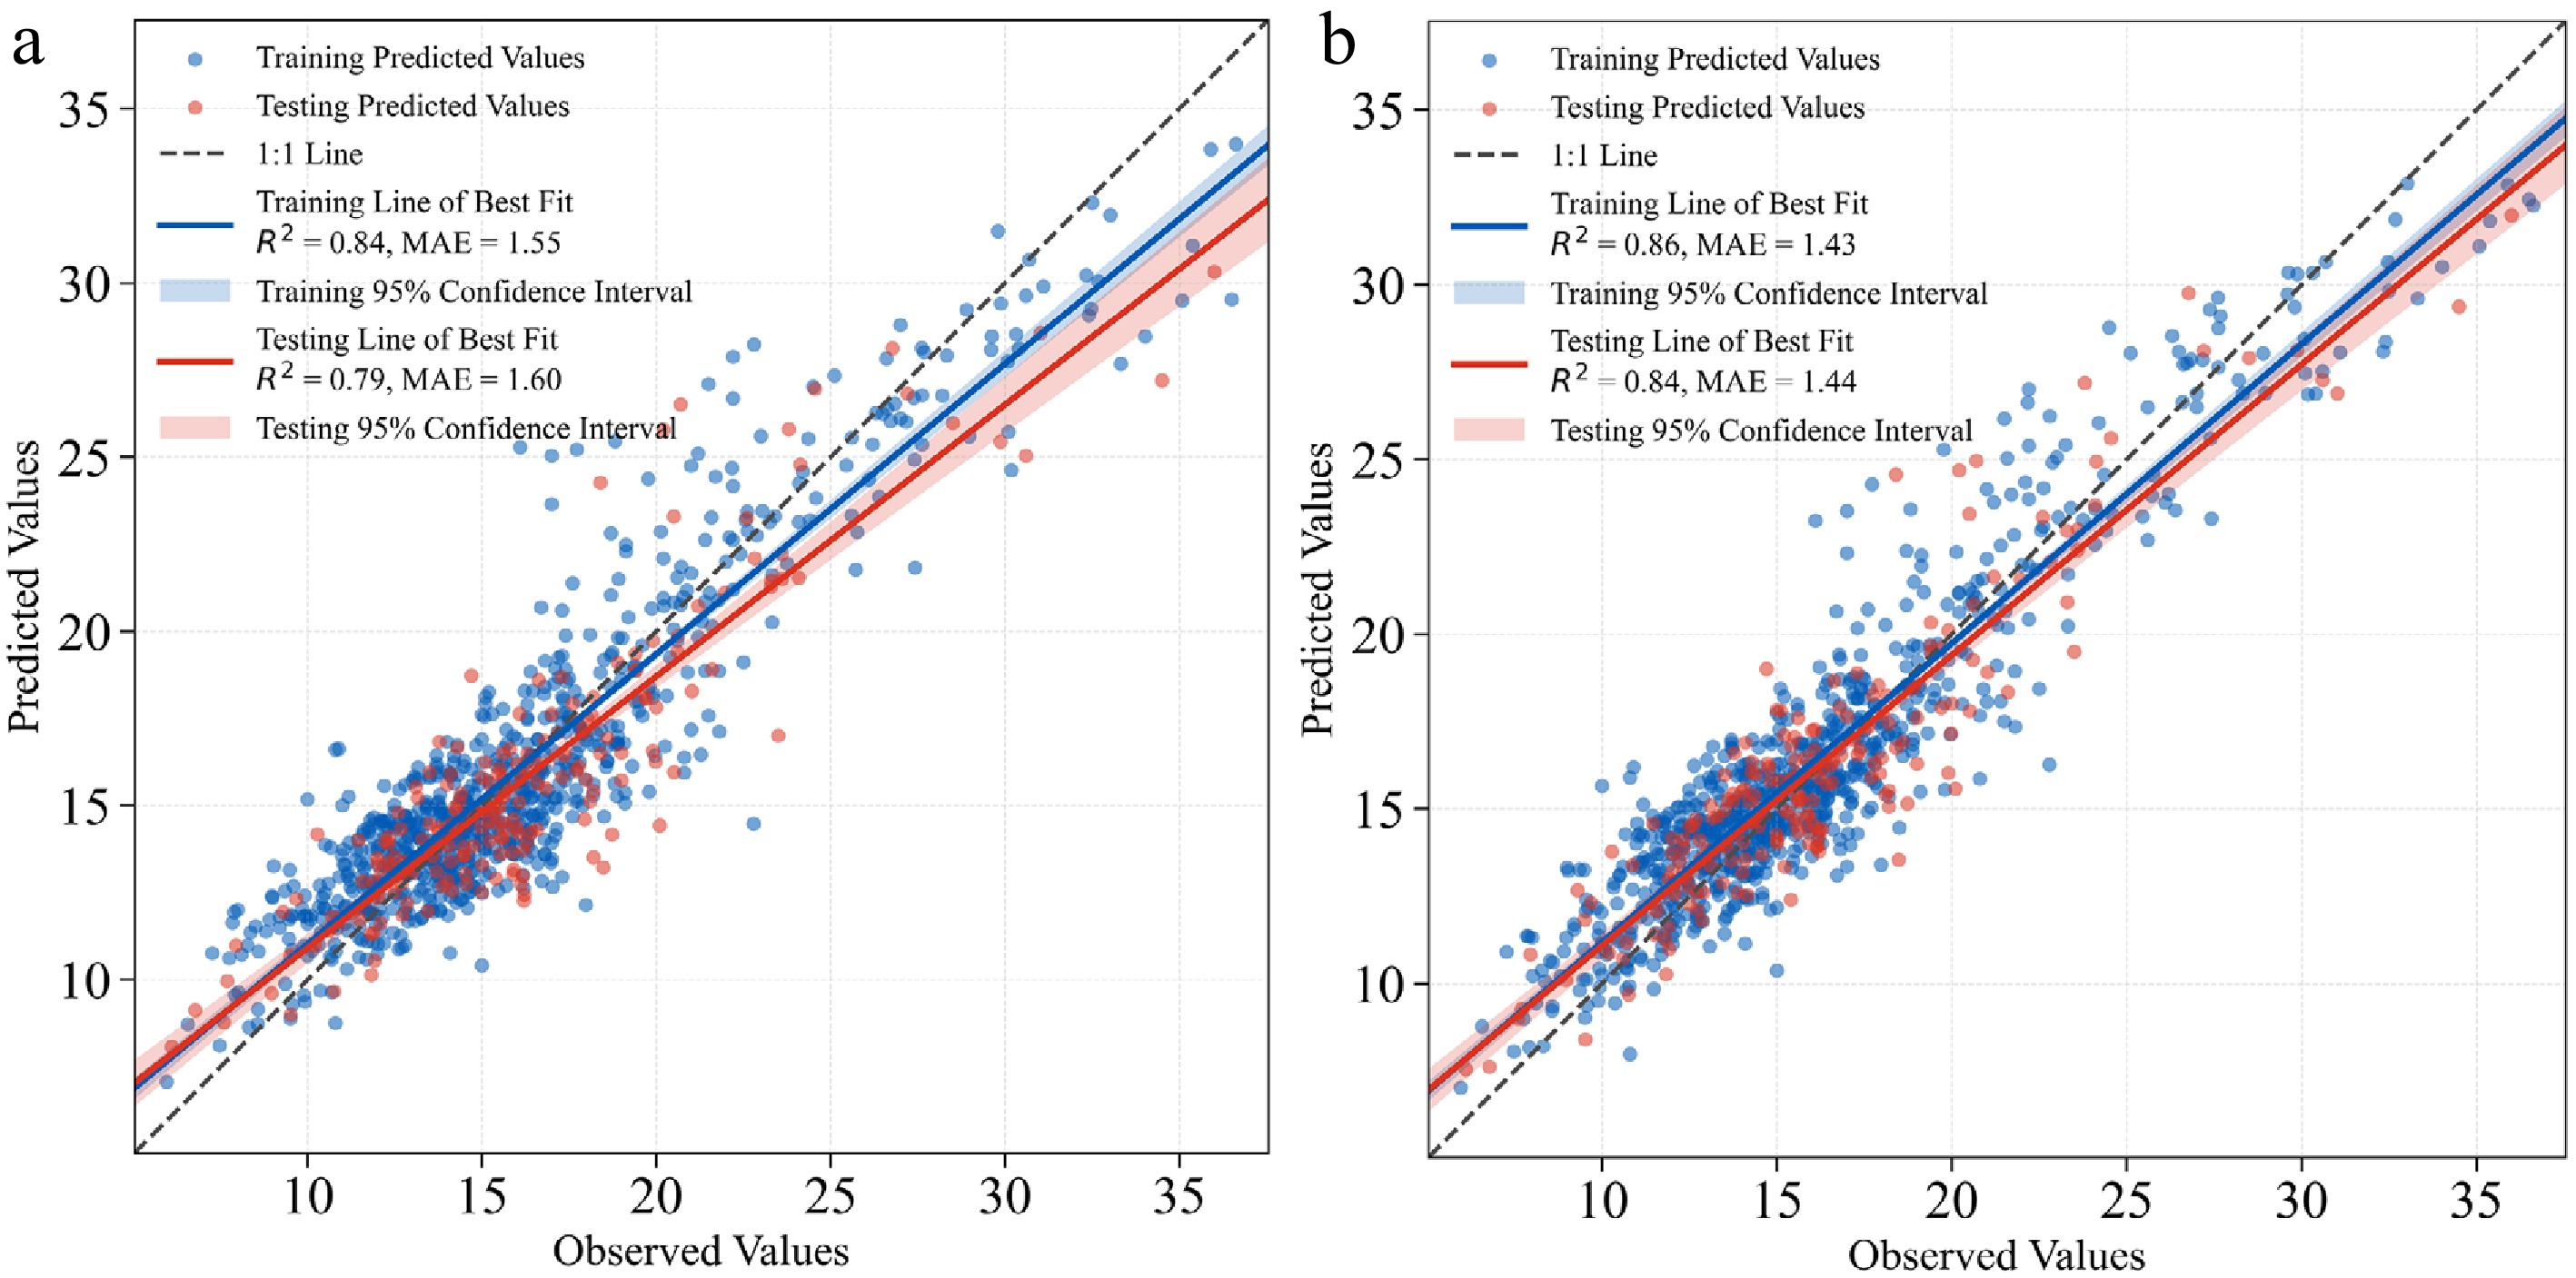
Figure 5.
Observed vs predicted DBH scatter plots for the MLP model under Set 1 and Set 4.
We further decomposed and compared the MLP model errors across DBH diameter classes on an independent test set to examine the improvement brought by multi-source feature fusion for trees of different sizes (Fig. 6). Overall, MAE increased with increasing DBH class, and the variability was more pronounced in the large-diameter class. For the 5–15 cm class, the difference was small, with MAE values of 1.17 and 1.19 cm for Set 1 and Set 4, respectively. In the 15–20 cm class, Set 4 reduced MAE from 1.57 to 1.44 cm. The largest improvement was observed for the > 20 cm class, where multi-source feature fusion reduced MAE from 2.83 to 2.28 cm. Overall, large-diameter trees remain the primary source of prediction error, whereas multi-source feature fusion yields more evident error reductions for the medium- and large-diameter classes, accompanied by a contraction of the error-bar range.
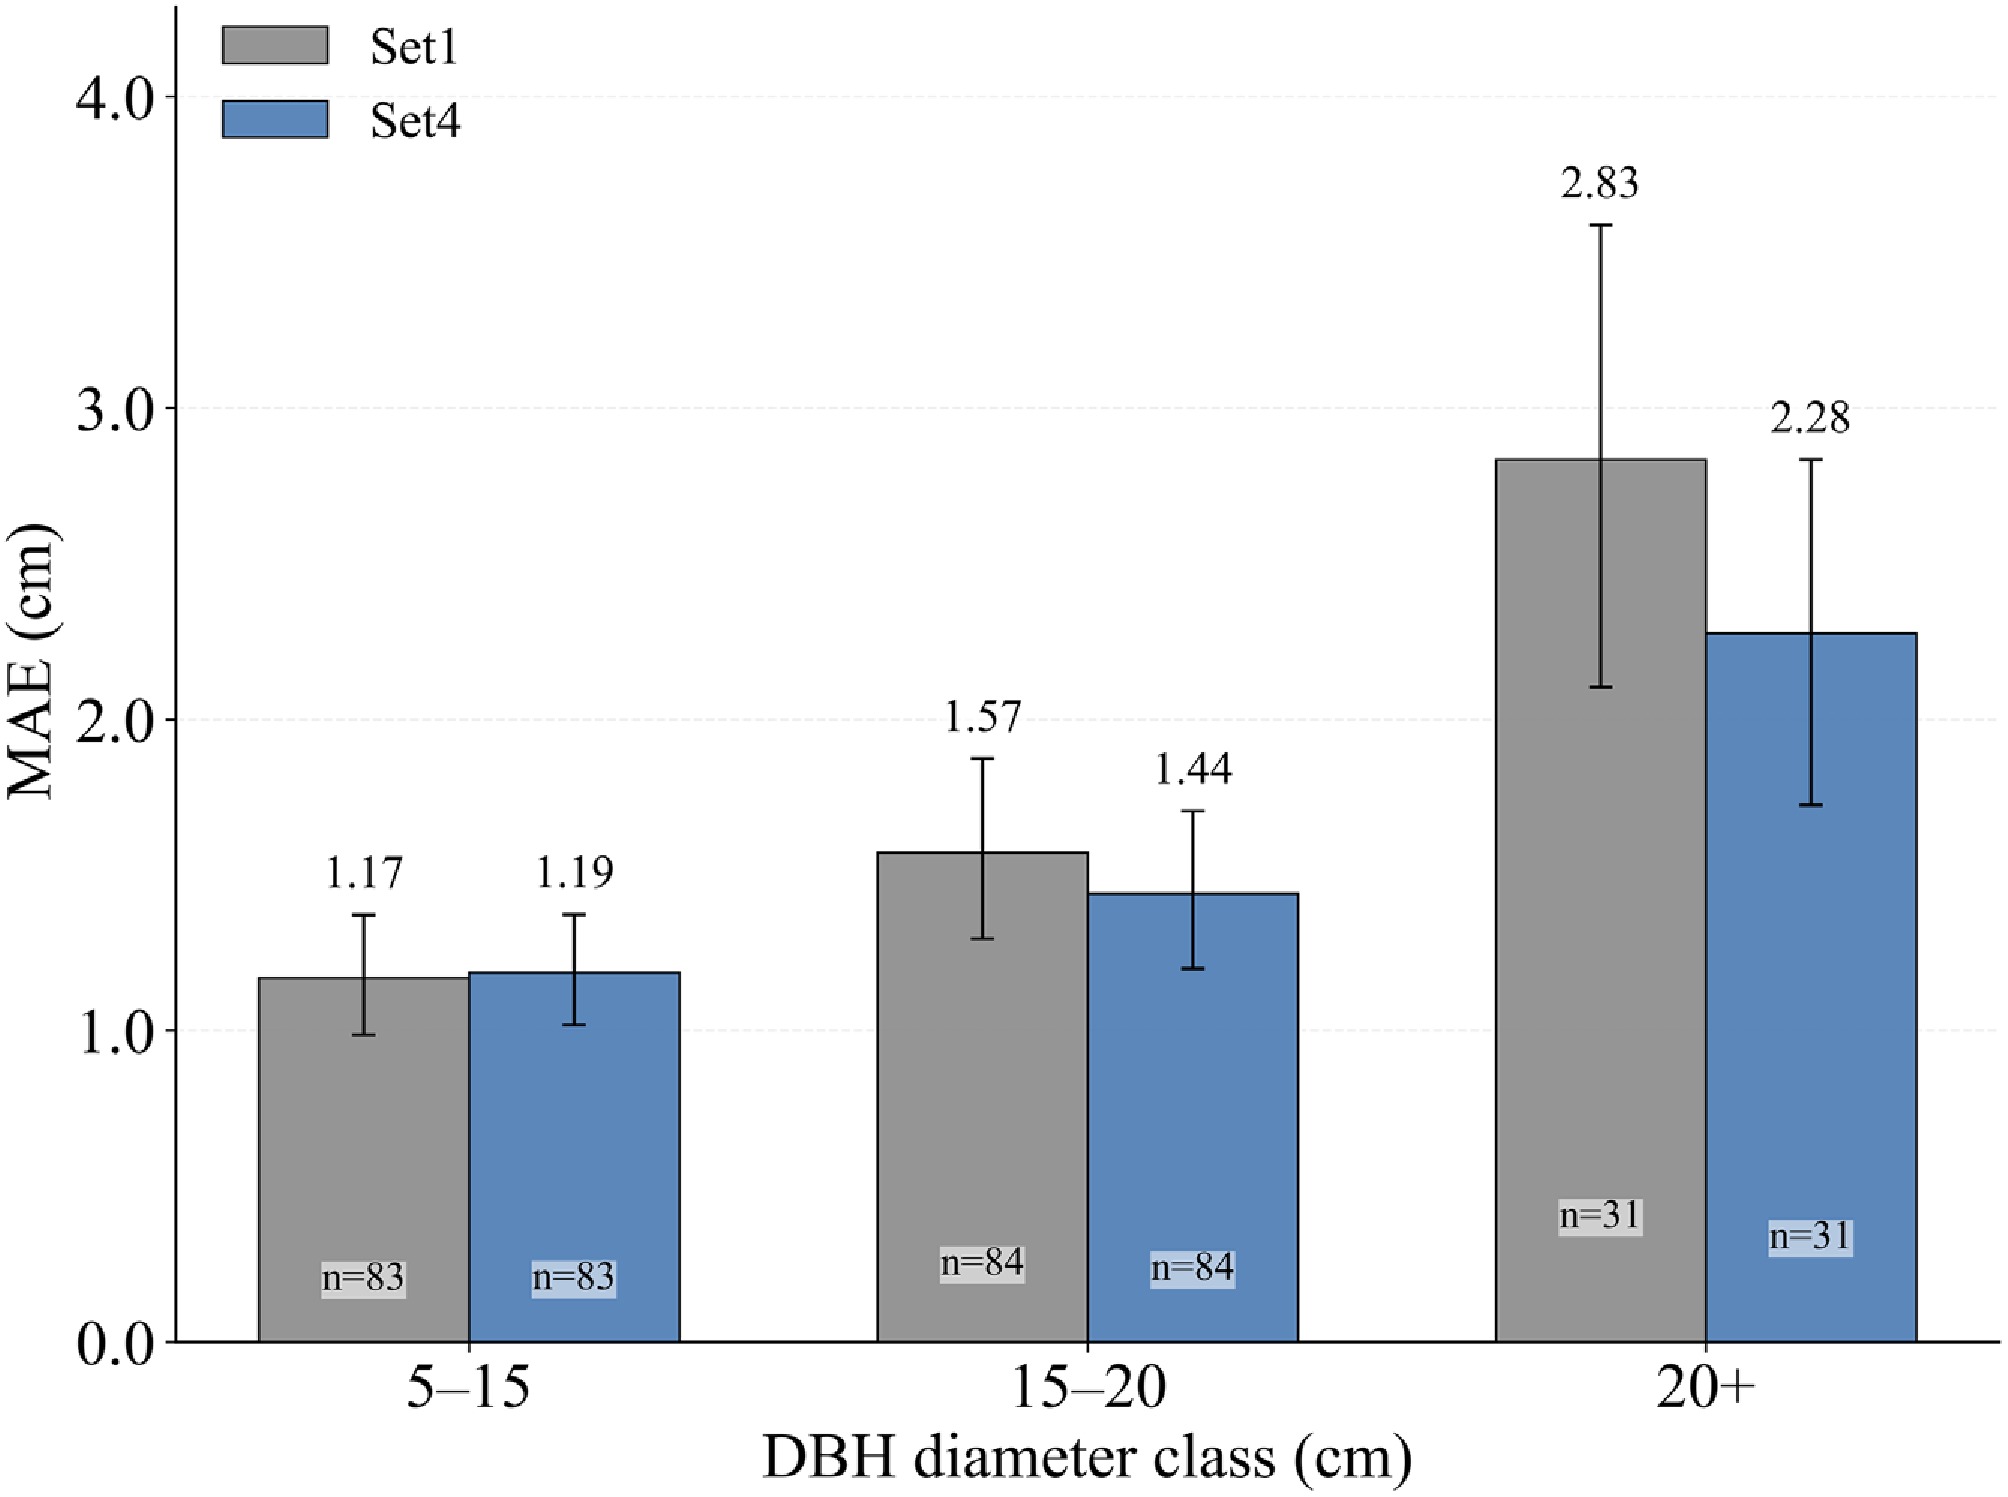
Figure 6.
MAE of the MLP model across DBH diameter classes for Set 1 and Set 4; n denotes sample size, and error bars represent 95% bootstrap confidence intervals.
Global model analysis
-
We used SHAP analysis to interpret the six machine-learning models under Set 4, which achieved the best overall performance, by quantifying the contribution of each predictor to DBH estimation and characterizing the direction and magnitude of contributions associated with changes in feature values. As shown in Fig. 7, the feature-importance results report the top ten predictors for each model, ranked in descending order by mean absolute SHAP value, and the SHAP summary plot further illustrates the contribution direction and the dispersion of SHAP values across samples. The results indicate that the ranking of feature importance differs among models. For tree-based models, contributions are primarily concentrated on tree height (H) and crown width (CW), whereas the importance distribution is relatively more dispersed for SVR and MLP. Overall, H and CW consistently rank as the top two predictors across all six models. Beyond structural variables, several vegetation indices and texture metrics, including ASM, WI, and GBRI, also remain highly ranked across multiple models. Climatic predictors, particularly DD18 and MAP, likewise appear among the top ten and exhibit more prominent relative importance in SVR and MLP.
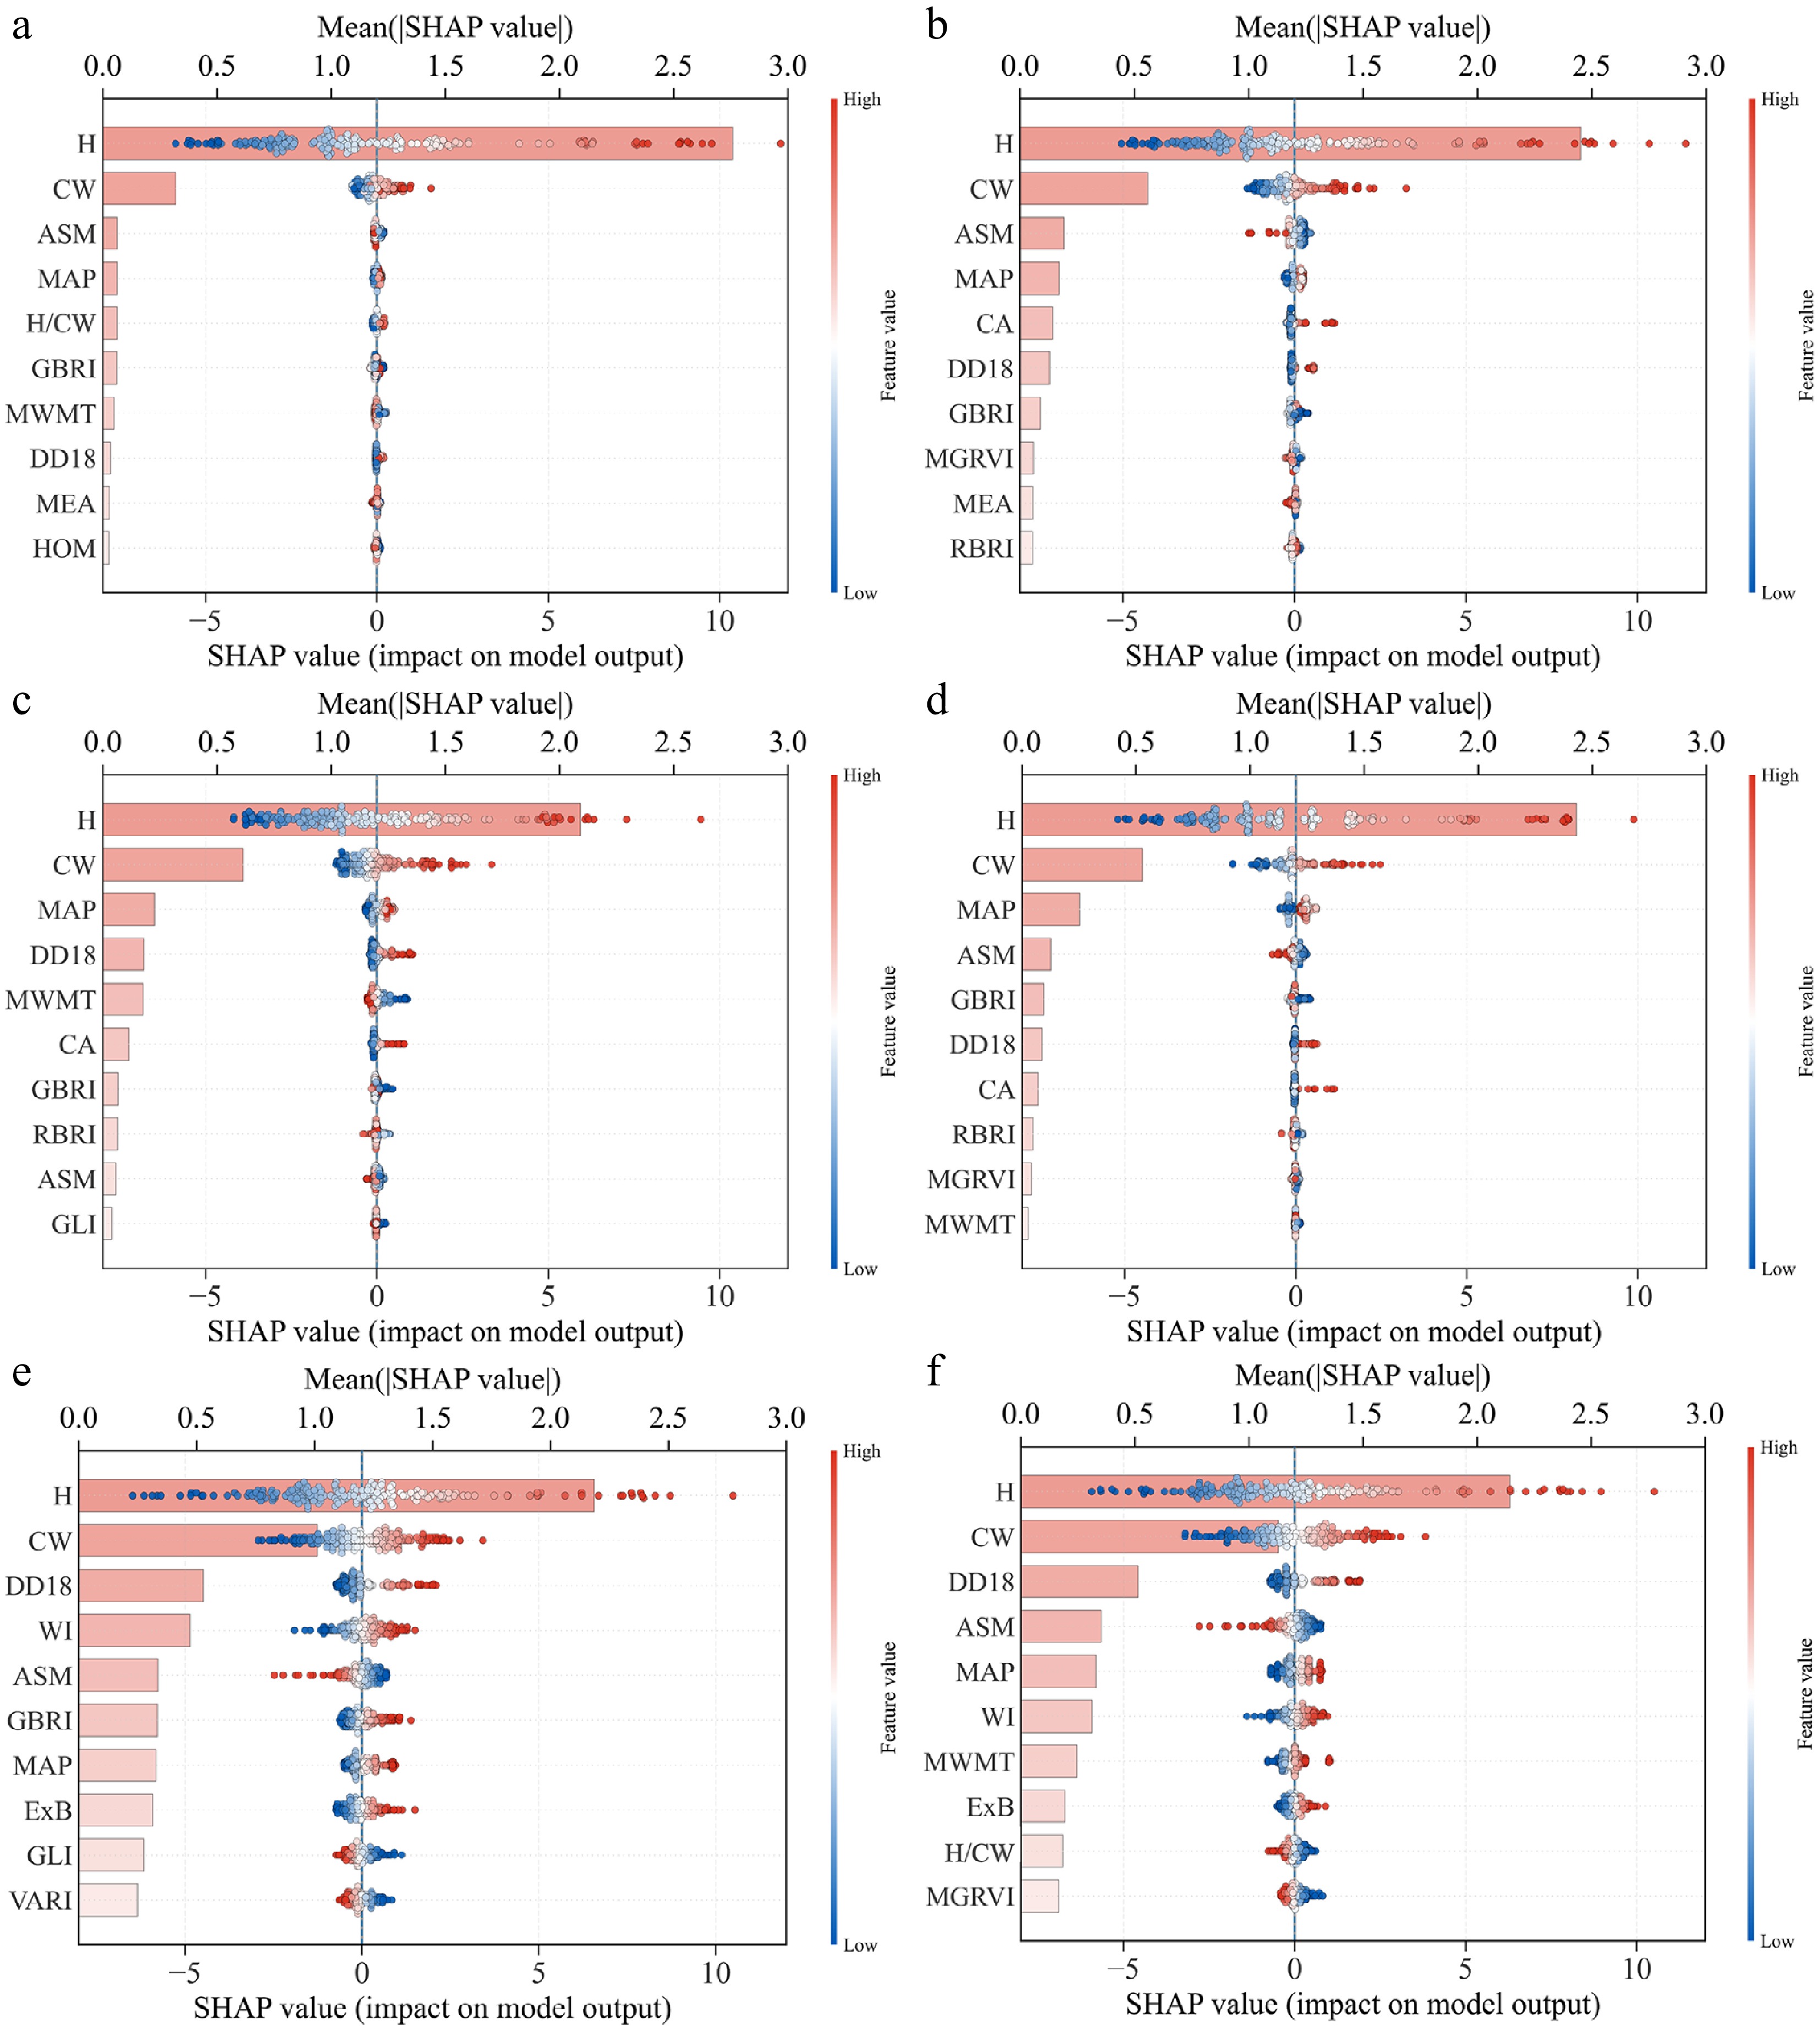
Figure 7.
SHAP summary plots for six machine-learning models under Set 4, showing the top 10 predictors ranked by mean |SHAP| (color indicates feature value from low to high).
From the correspondence between SHAP values and feature values, larger values of H and CW are generally associated with higher (more positive) SHAP values, consistent with larger predicted DBH. Among the vegetation-index and texture predictors, ASM is predominantly associated with negative SHAP values, whereas ExB shows mostly positive contributions. For the climatic predictors, SHAP values for MAP and DD18 display an overall positive trend with increasing feature values, and their distributions span a wider range in SVR and MLP. Taken together, the importance rankings and the SHAP summary distributions in Fig. 6 indicate that, under Set 4, models primarily rely on core structural information from H and CW; meanwhile, after incorporating spectral, texture, and climatic predictors, some models, especially SVR and MLP, assign greater weight to climatic information.
As shown in Fig. 8, we further aggregated SHAP contributions for the MLP model under Set 4 by feature group to compare the relative roles of different feature categories in DBH estimation. Figure 8a reports the mean absolute SHAP value for each group, which reflects the average contribution magnitude of that feature group to individual predictions; Fig. 8b reports the relative share after summing SHAP values, which represents the group's overall contribution to the model output. The results show that individual-tree features (ITF) contribute the most, accounting for 53.14% of the total contribution. Vegetation indices (VI) and climatic factors (CF) rank next, with contribution shares of 18.88% and 16.22%, respectively. Texture features (TF) have a lower contribution share (9.45%), while forest spatial structure features (FSS) contribute the least (2.30%). The rankings are consistent across the two metrics, indicating that the model relies primarily on ITF, with VI and CF providing important complementary information.
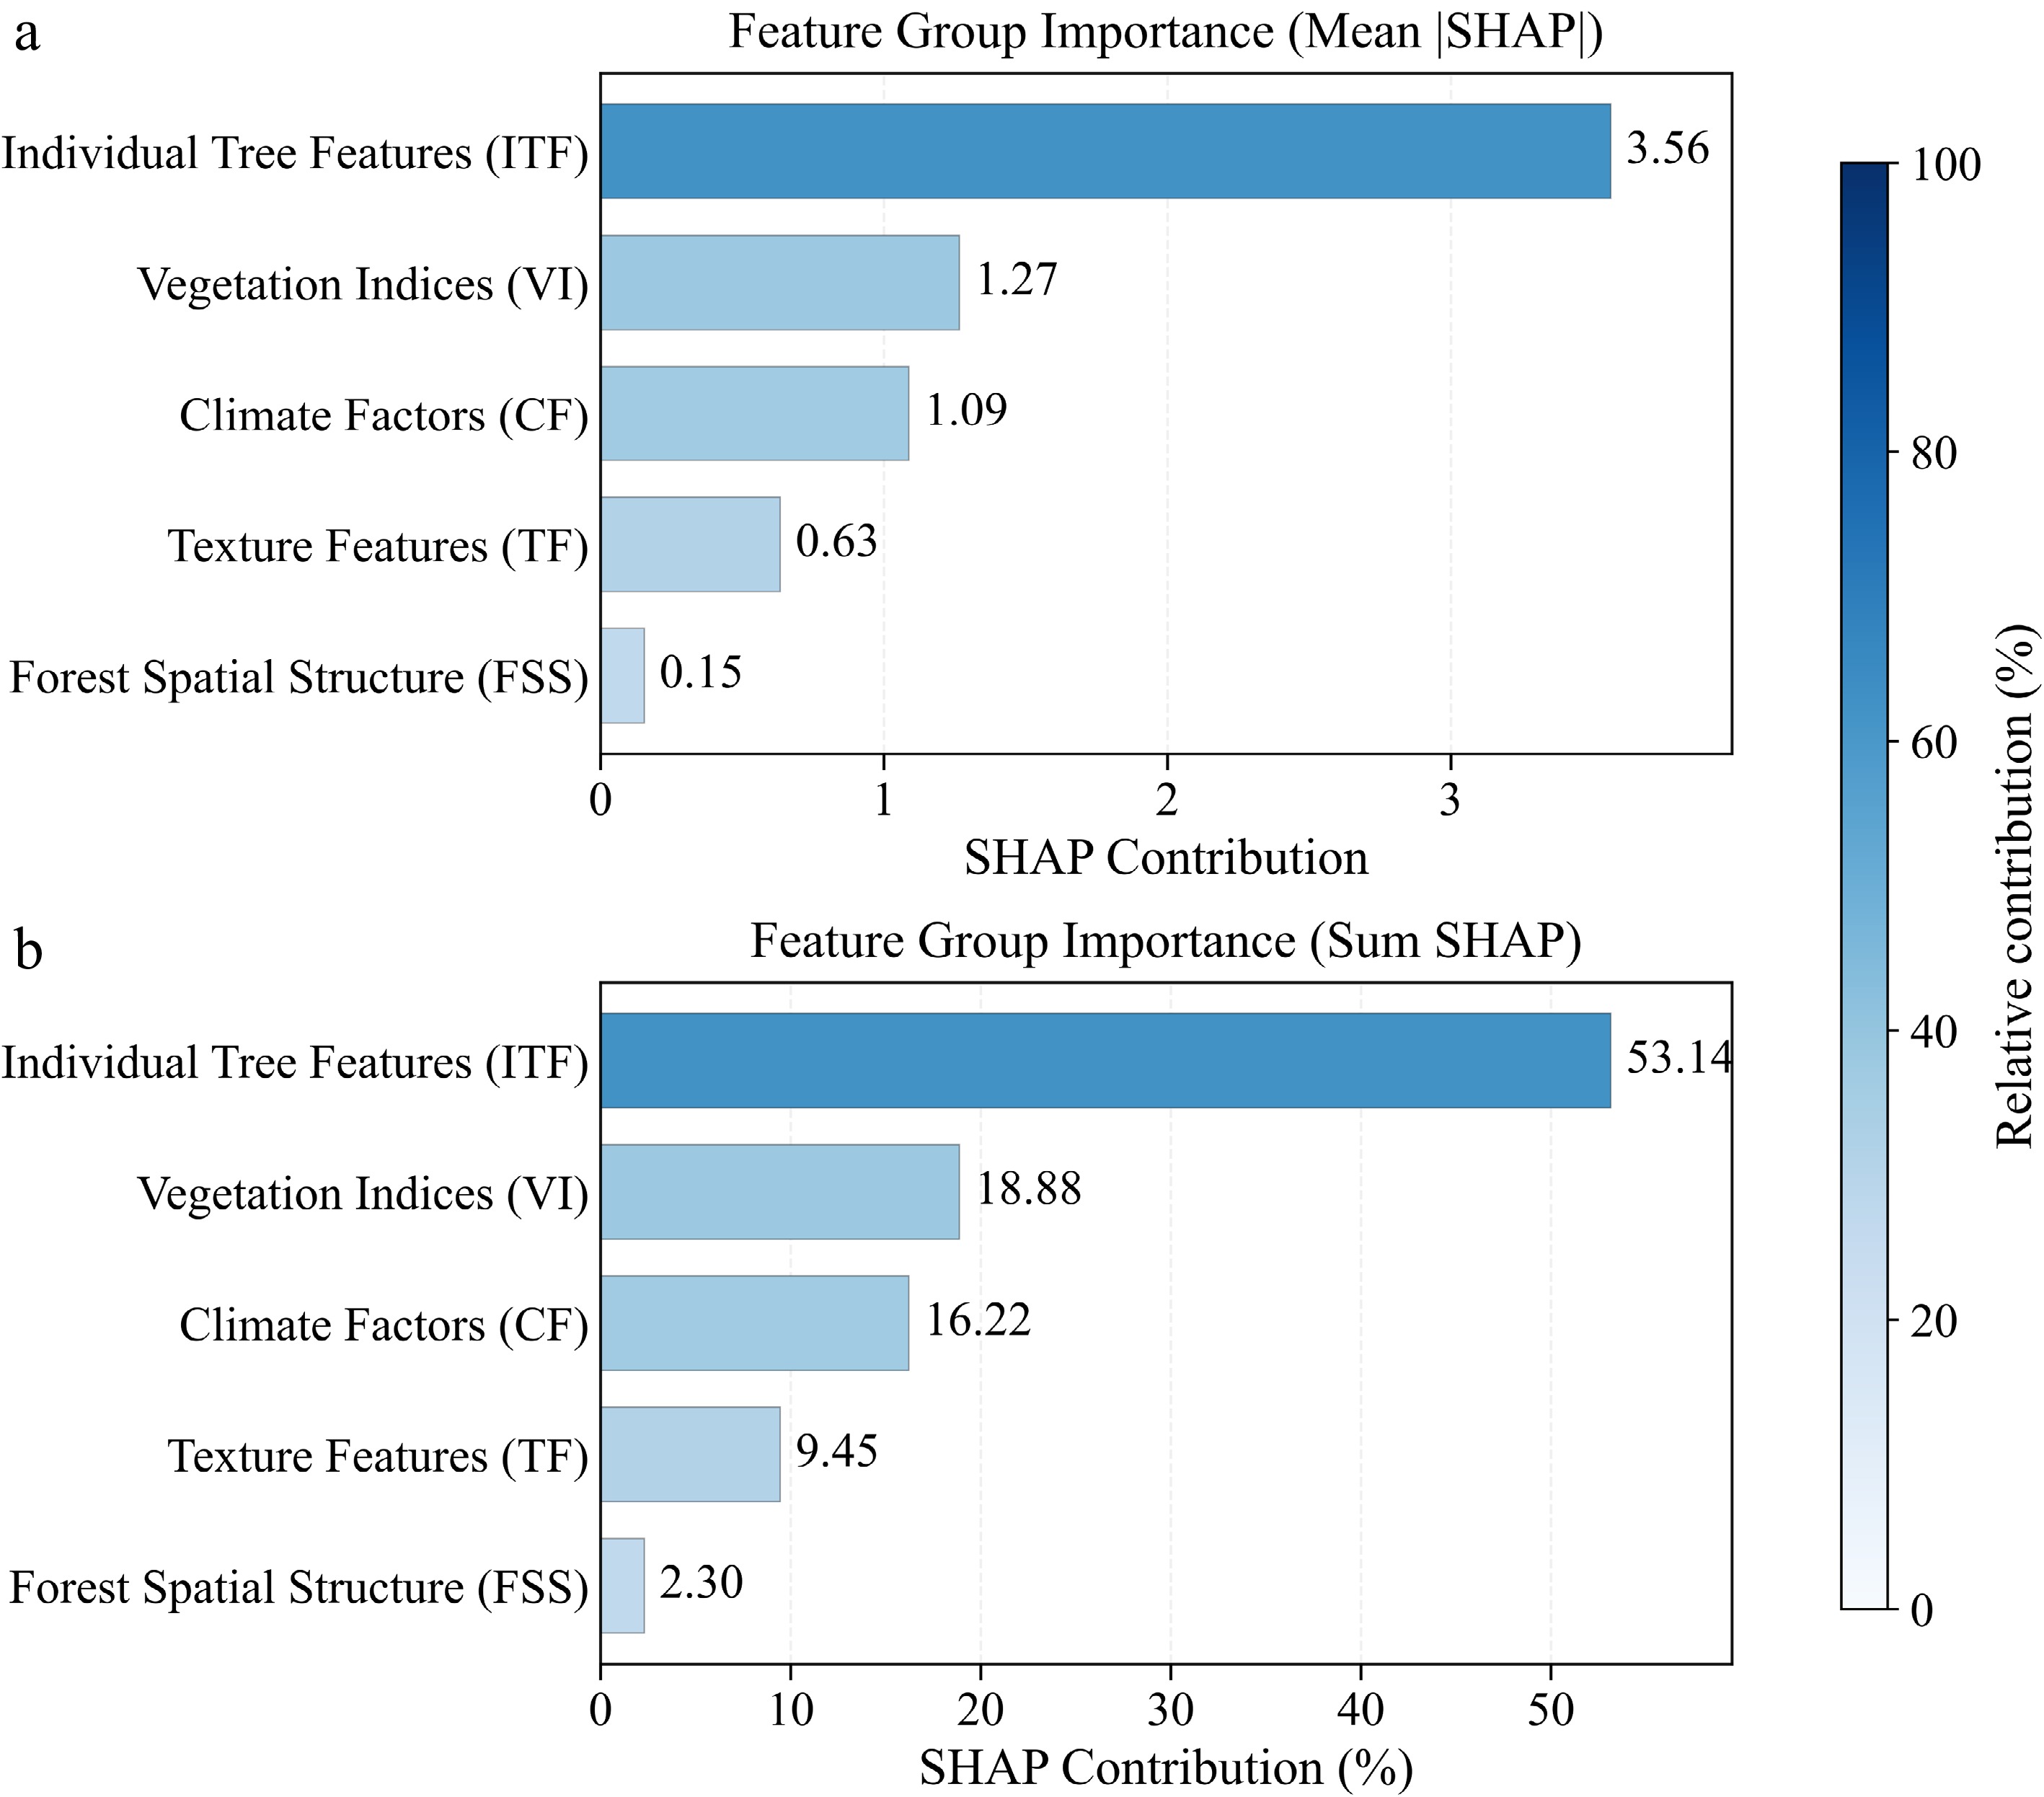
Figure 8.
Feature-group SHAP contributions for the MLP model under Set 4: (a) mean |SHAP|, and (b) summed SHAP contribution (%).
Local interpretation of the model
-
Figure 9 shows SHAP waterfall plots for two representative samples: a small-DBH tree (Fig. 9a), and a large-DBH tree (Fig. 9b). The plots decompose each prediction into additive feature contributions, illustrating how these contributions shift the estimate from the baseline expectation E[f(x)] to the final predicted value f(x). For the small sample, the predicted value f(x) = 13.36 is lower than the baseline E[f(x)] = 16.19. Tree height (H, −1.51), and crown width (CW, −0.87) provide the strongest negative contributions, and are the primary drivers of the lower predicted DBH. Other features, including DD18 (−0.65) and ExB (−0.50), also show notable negative contributions. In contrast, WI (+0.74), ASM (+0.65), and RBRI (+0.49) contribute positively to the prediction. Overall, the lower predicted value for this sample is mainly attributable to smaller H and CW and the negative effects of DD18 and ExB, which are partly offset by positive contributions from WI and ASM.
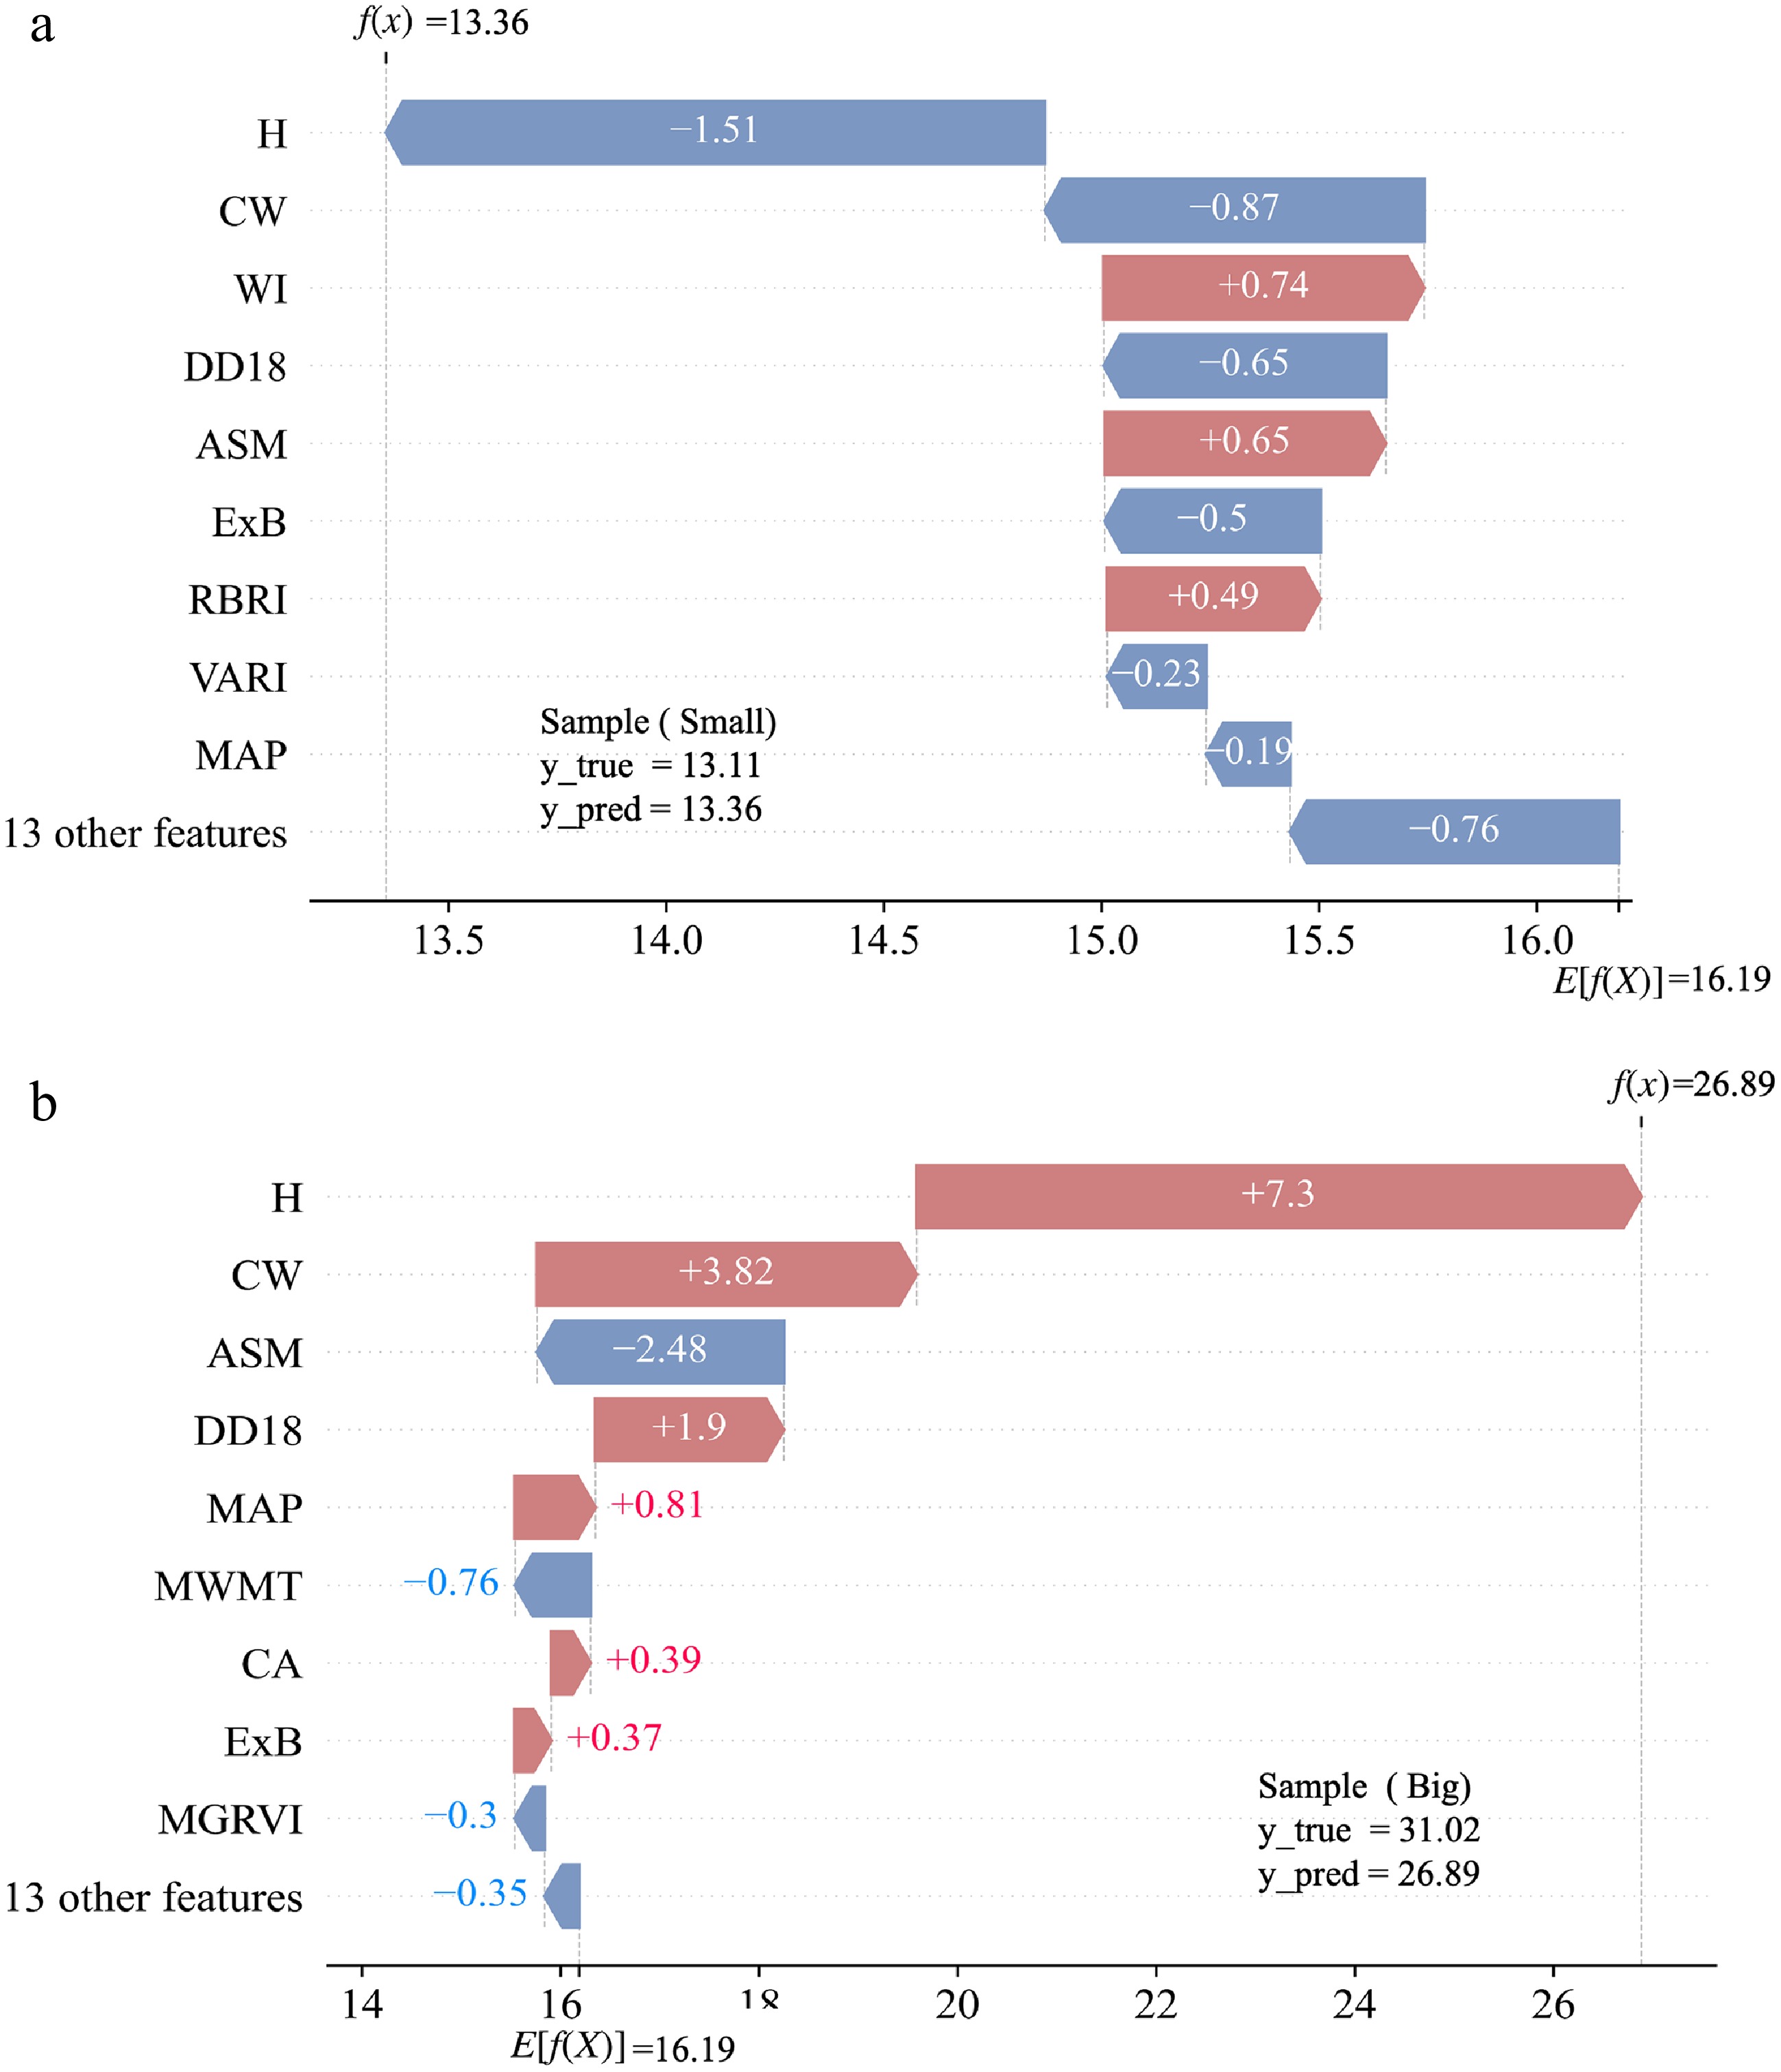
Figure 9.
SHAP waterfall plots for two representative samples: (a) small-DBH case, and (b) large-DBH case.
For the large sample, the predicted value f(x) = 26.89 exceeds the same baseline E[f(x)] = 16.19. Here, H (+7.30) and CW (+3.82) again provide the largest positive contributions. In addition, climatic predictors such as DD18 (+1.90) and MAP (+0.81) further push the prediction upward. Conversely, ASM (−2.48) and MWMT (−0.76) contribute negatively and partially offset the increase. Taken together, these two cases suggest that prediction deviations differ by DBH level: for the small DBH sample, the model tends to overestimate relative to the observed value, whereas for the large-DBH sample, the prediction is shifted downward relative to the observed value.
Cross-region evaluation and LOSO validation
-
To broaden the spatial and environmental–climatic coverage and to further examine the role of climatic factors in DBH estimation, we introduced a cross-regional individual-tree inventory dataset as a proxy for UAV-derived individual-tree features. Using this dataset, model performance was evaluated under two data-splitting strategies: in-distribution validation (training and validation sets drawn from the same region) and cross-region extrapolation validation using leave-one-region-out (LOSO; training and validation sets drawn from different regions).
Figure 10 summarizes the MLP results under two feature configurations. Set 1 uses only individual-tree features (ITF) for DBH estimation, whereas Set 2 augments ITF with climatic factors (ITF+CF). Figure 10b–d report the quantitative performance metrics (MAE, R2, and RMSE) for the two configurations. The results show that incorporating climatic factors improved predictive performance: MAE decreased from 2.59 to 2.20 cm, R2 increased from 0.74 to 0.80, and RMSE decreased from 3.43 to 3.02 cm. Relative to ITF alone, ITF + CF reduced MAE and RMSE by approximately 15.1% and 12.0%, respectively, and increased R2 by about 8.1%. In addition, Fig. 10a presents the SHAP-based feature-importance ranking for this dataset, indicating that H and CW remain the most influential predictors, while climatic variables such as CMD and MWMT also contribute substantially, suggesting that climatic background information provides complementary explanatory power for DBH estimation.
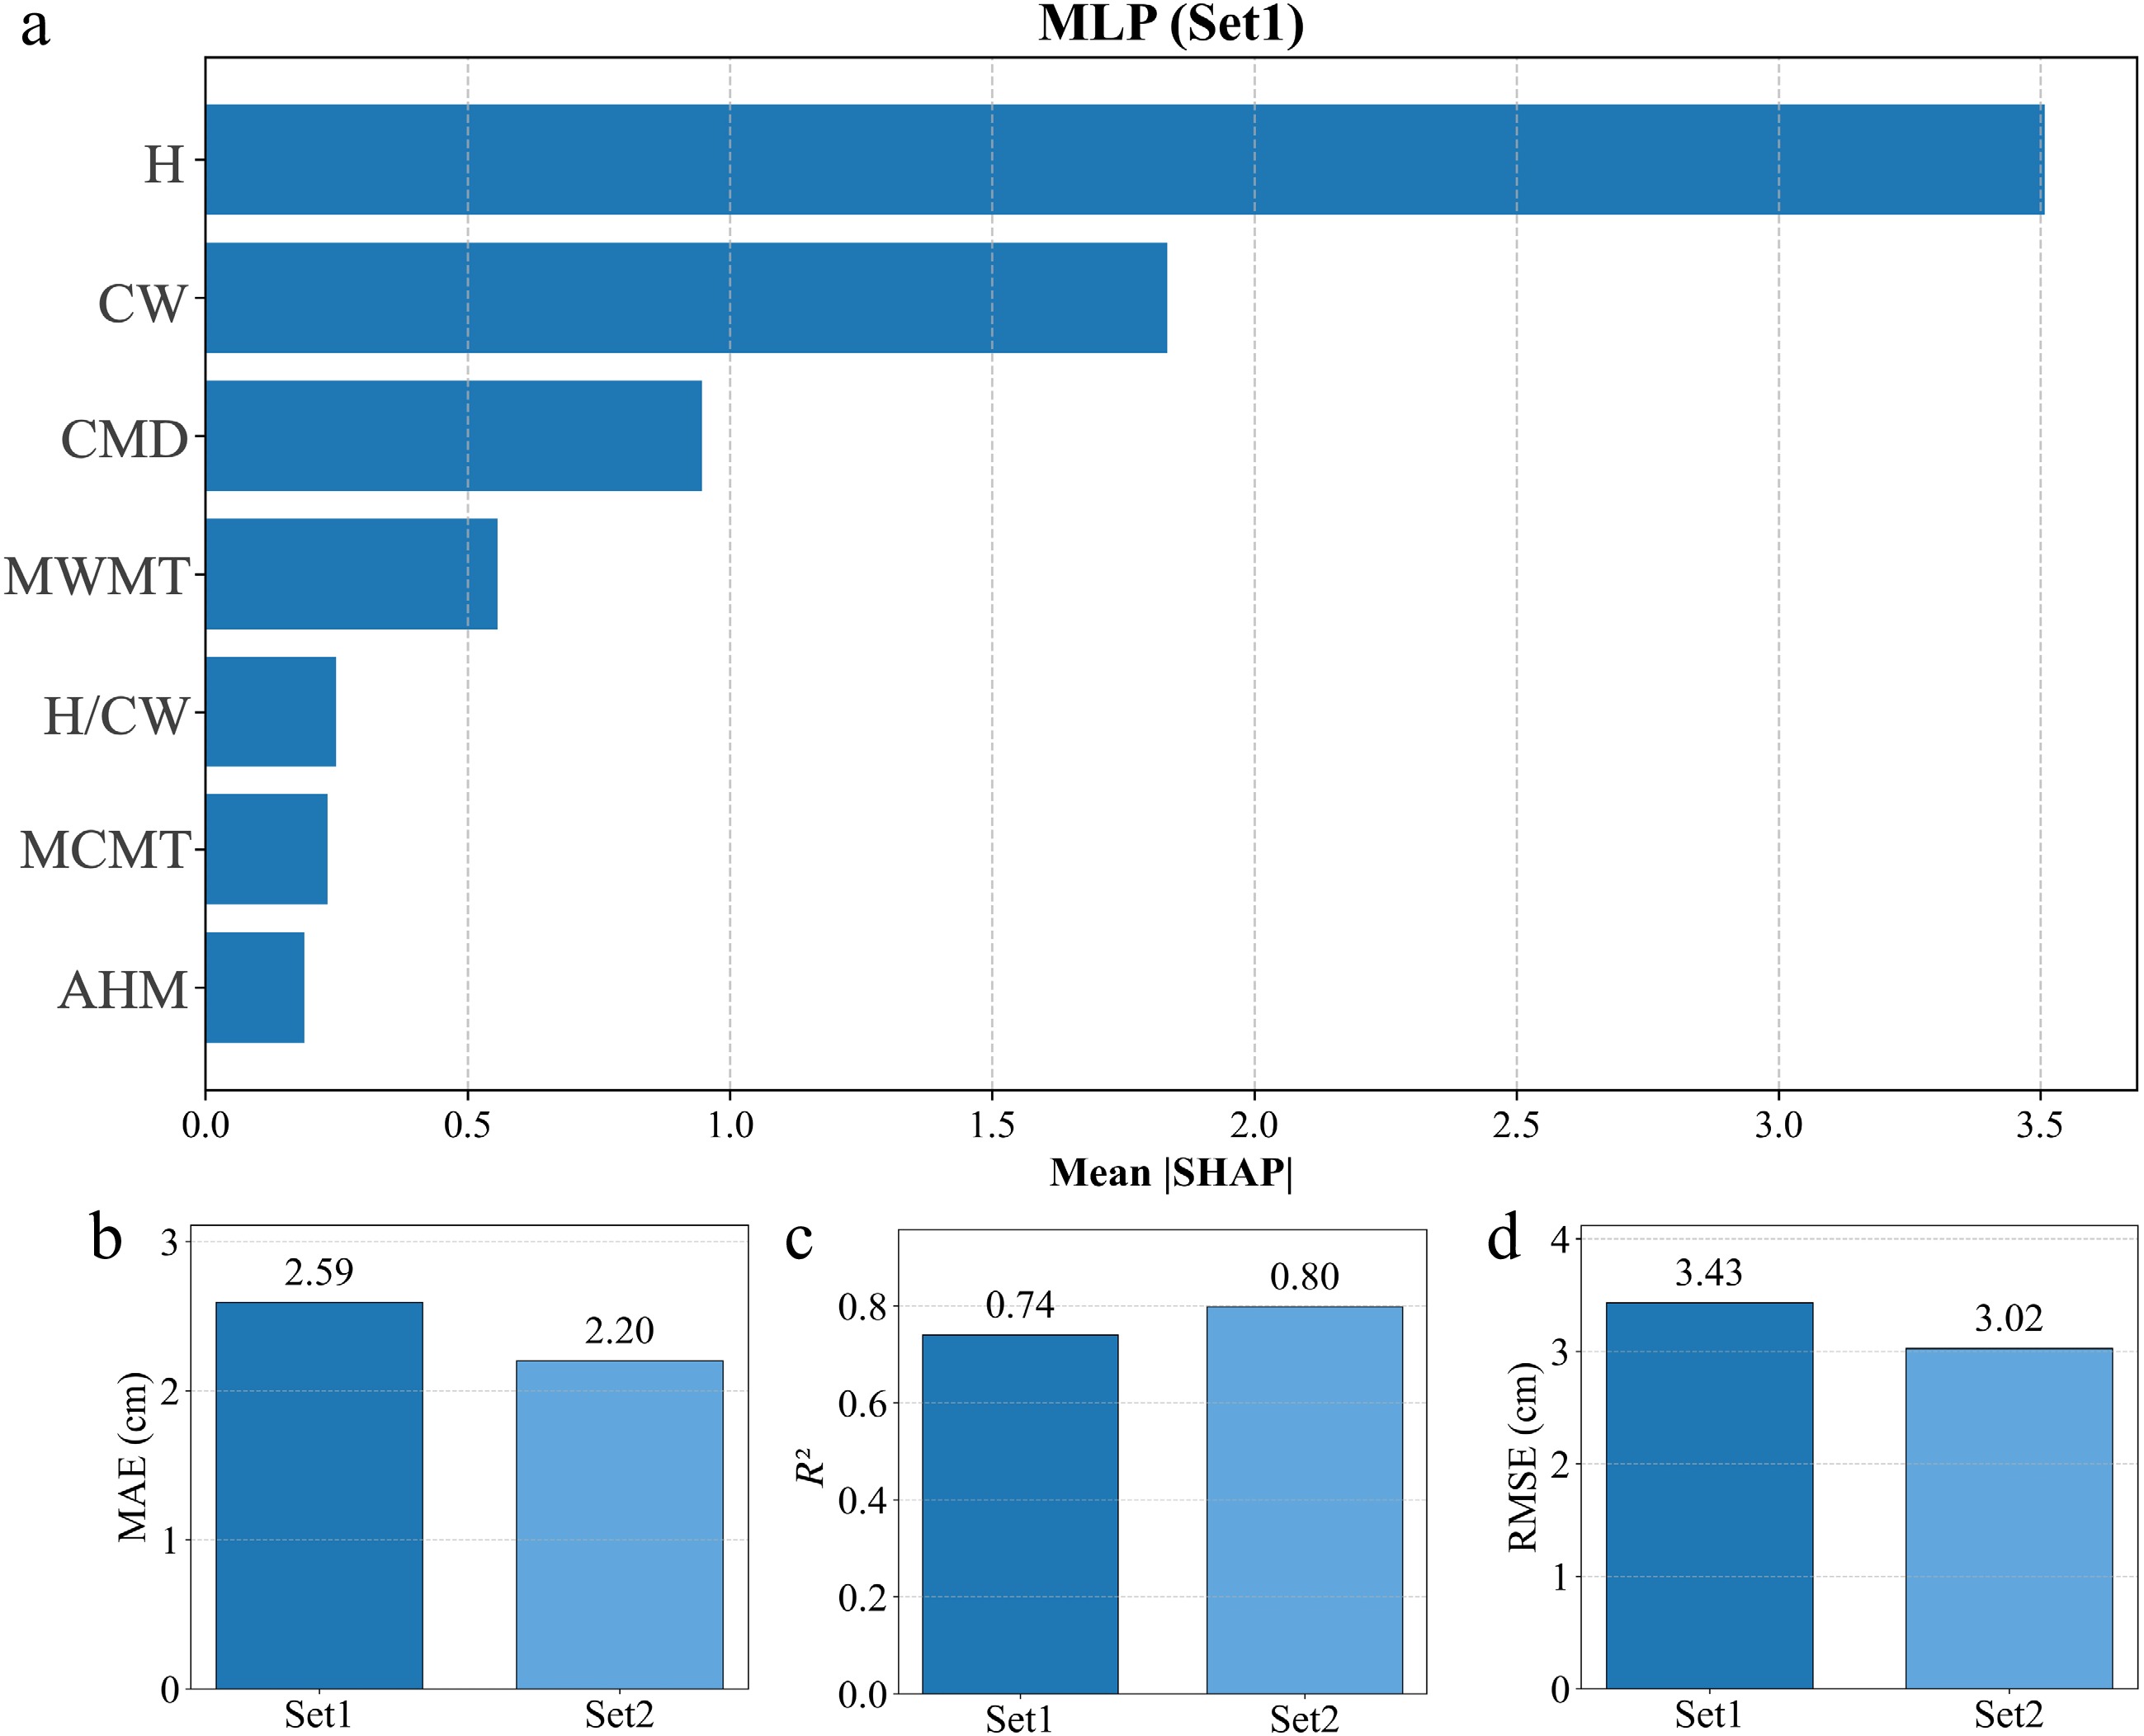
Figure 10.
Within-distribution performance comparison with climatic factors and feature-importance rankings.
Figure 11 shows the feature-increment experiment for the MLP model under the LOSO extrapolation evaluation framework. Specifically, we sequentially held out each regional site as the test set, trained the model on samples from the remaining regions, and computed the overall LOSO performance of the MLP as the test-sample-size weighted average across folds. Given the inherent stringency of this evaluation design, the model exhibited a marked performance decline under the strict cross-region extrapolation setting relative to the in-distribution validation. Meanwhile, as the top seven predictors ranked by SHAP importance were progressively introduced, model performance did not change monotonically. Performance improved as the feature set expanded from one to three predictors, with the best results obtained using the top three features (H, CW, and CMD) (RMSE = 3.30 cm, MAE = 2.59 cm, R2 = 0.66). However, after adding the fourth feature, errors increased substantially (RMSE = 3.83 cm, MAE = 3.13 cm), and goodness of fit decreased (R2 = 0.53); when all top seven features were included, performance deteriorated again (RMSE = 4.02 cm, MAE = 3.31 cm, R2 = 0.50). Overall, under the LOSO setting in this study, the MLP achieved better performance when only a small number of key predictors were included; climatic factors also contributed to improving estimation accuracy, whereas adding more features did not necessarily lead to further performance gains.
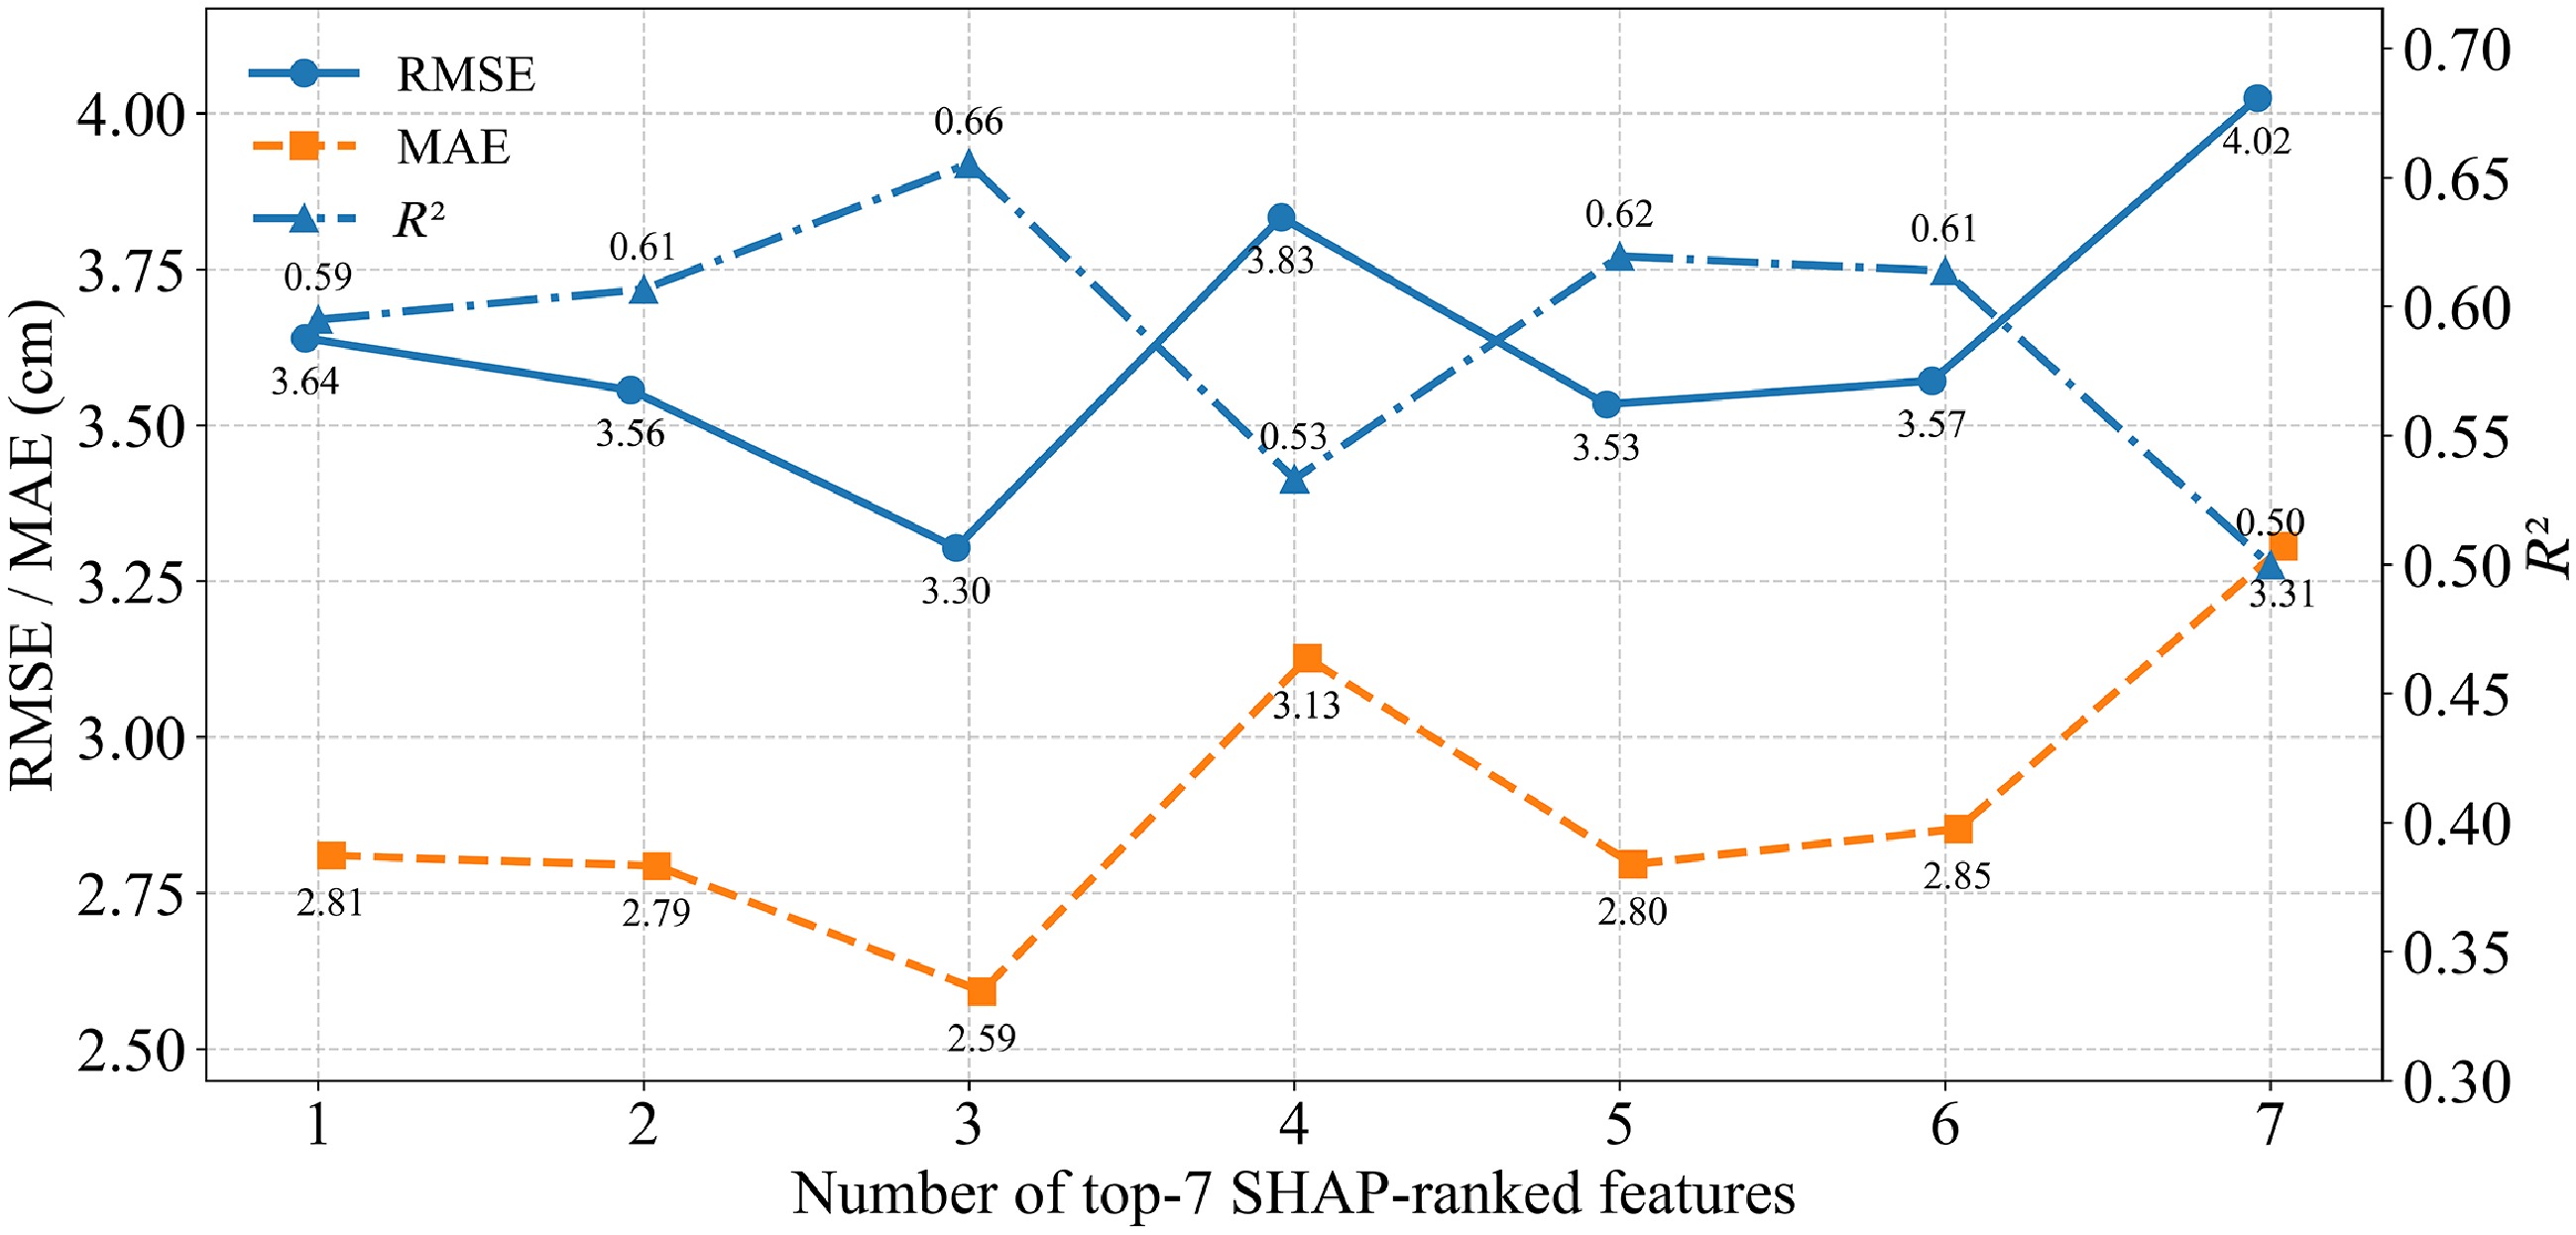
Figure 11.
Under LOSO extrapolation, MLP performance as top-ranked features are progressively incorporated.
-
This study proposes a UAV-RGB based framework for estimating individual-tree DBH in Chinese fir. By combining stepwise multi-source feature fusion with SHAP-based interpretation, the framework improves predictive accuracy while enhancing model interpretability. Under within-distribution evaluation, expanding predictors from individual-tree features (ITF) to forest spatial structure (FSS), vegetation indices plus texture features (VI + TF), and climatic factors (CF) improved performance for all six models, with the best results achieved under the full feature set (Set 4). Model responses to feature enrichment differed across algorithms: MLP and SVR showed larger relative gains under higher-dimensional inputs, indicating that complementary information sources provide additional constraints that improve model fit and reduce prediction error. Moreover, cross-region validation further demonstrated that incorporating climatic factors increases accuracy under within-region evaluation; however, under the stricter leave-one-site-out (LOSO) extrapolation setting, overall performance declined noticeably relative to within-distribution evaluation.
Contributions of multi-source feature fusion and model architecture to DBH estimation Accuracy
-
A broadly consistent conclusion in prior data-fusion studies is that integrating multi-source predictors can improve the accuracy of estimating ecological and forestry target variables. Different information sources are complementary in spatial scale, sensitivity, and error structure, and joint modeling can enhance the identifiability of the target variable while reducing systematic bias associated with relying on a single source[33,34]. This is consistent with the gains observed in our within-distribution evaluation. When DBH is estimated using only a limited set of tree attributes, the available information is often insufficient to represent the underlying variability. In the context of UAV-RGB based modeling, no single predictor source can fully characterize DBH, whereas structural attributes, spectral-textural proxies, and climatic background information provide complementary constraints. Integrating these multi-source predictors allows the model to represent tree structure, canopy spectral-textural patterns, and external site conditions within a richer feature space, thereby yielding more stable reductions in error and improved fit under within-distribution conditions.
From a modeling perspective, the observed differences in how algorithms benefit from increasing feature dimensionality are expected. The larger relative gains of MLP and SVR under Set 4 suggest that, when sample size is adequate, and predictors are more diverse, nonlinear relationships and potential interactions between DBH and multiple predictor groups become more influential for performance. These models are often better suited to learning complex nonlinear mappings in high-dimensional regression settings, and therefore can more readily translate additional information into error reduction[35]. In contrast, the comparatively strong stability of tree-based models under lower-dimensional inputs is often related to their splitting rules, ensemble averaging, and relative insensitivity to certain noisy predictors. When information is limited, they can achieve a robust baseline without requiring complex function approximation. As the feature space expands and correlations and redundancy increase, differences among models in their ability to represent and exploit informative signals become more pronounced[36]. Accordingly, understanding model mechanisms is important for selecting algorithms and designing predictor sets that match the requirements of a given estimation task.
The DBH class-based analysis further highlights heterogeneity in the error structure. For MLP, MAE increased with DBH class, and uncertainty was most pronounced for large trees (> 20 cm); the benefits of multi-source feature fusion were also concentrated in the medium and large DBH classes. Consistent with the regression scatter patterns, predictions in the high-DBH range tended to be more dispersed and showed indications of systematic bias, with larger trees more likely to be underestimated. This pattern may be attributable to the relatively small and imbalanced sample size of large trees, as well as greater crown-shape complexity that can amplify feature-extraction uncertainty. Similar findings have been reported in UAV-based estimation studies, where errors and bias become larger when analyses are stratified by diameter class[37,38]. Future work could address this issue by increasing the representation of large trees and by adopting DBH class-stratified sampling or weighted training, enabling a more rigorous examination of error propagation and uncertainty across diameter classes.
SHAP-based interpretability and feature contribution mechanisms
-
SHAP provides a powerful quantitative tool for understanding model behavior. Under Set 4, we performed both global and local interpretation for the six models. Tree height (H) and crown width (CW) consistently ranked as the top two predictors across all models, which accords with biological intuition regarding the structural basis of DBH and is also consistent with findings from prior studies that rely primarily on individual-tree structural predictors[15]. SHAP analysis further indicated that several vegetation indices and texture features (e.g., ASM, WI, and GBRI), as well as climatic factors (e.g., DD18 and MAP), contributed substantially in some models. Their SHAP summary and waterfall patterns exhibited clear contribution directions and sample-level dispersion, which helps differentiate model-specific reliance patterns and provides practical evidence for feature selection and iterative model refinement.
Importantly, SHAP describes predictive contributions rather than ecological causality[39]. A high SHAP value indicates that, given the observed data distribution and modeling assumptions, the model relies more heavily on a variable to form predictions; it does not imply that the variable causally drives DBH growth in a physiological or ecological sense. Although the contribution directions of some predictors broadly align with ecological expectations, higher DD18 and greater precipitation are generally associated with larger predicted DBH; however, a more appropriate reading is that these variables provide predictive information that co-varies with growth differences in the observed data. Their ecological influence is more likely expressed through indirect pathways, such as modifying growing-season length and regulating hydrothermal stress and carbon assimilation and allocation, rather than through a direct effect on DBH. To more clearly distinguish predictive contribution from ecological mechanism, future work could integrate structural equation modeling, multi-scale attribution, or causal-inference frameworks to test plausible pathways for key climatic variables, thereby improving the verifiability of mechanism-oriented interpretation while maintaining predictive performance.
Regional extension and climatic-factor validation
-
In the cross-region validation experiments, we found that incorporating climatic factors (CF) improved overall DBH estimation accuracy under both the relatively lenient within-region evaluation and the stricter leave-one-site-out (LOSO) extrapolation setting. However, the two validation settings correspond to different application scenarios. Under within-region evaluation, training and test samples come from the same region and therefore share similar site conditions, stand structure, and environmental gradients. As a result, spatial dependence can lead to more optimistic performance estimates, which are more representative of estimation tasks in known areas[40]. In contrast, LOSO holds out an entire region, making the test data more likely to deviate from the training data in covariate distributions and their joint structure. This setting is closer to practical requirements for cross-region transfer and prediction at unseen sites, and therefore typically yields more stringent and conservative estimates[41]. For spatial extrapolation tasks, grouped or block-based validation is widely considered more appropriate for assessing true transferability to unknown regions and for reducing performance inflation caused by spatial autocorrelation.
From a machine-learning perspective, LOSO represents a stronger form of distribution shift. This implies that feature combinations and model configurations that perform well under within-region evaluation do not necessarily retain their advantage under extrapolation. This pattern is clearly reflected in our feature-increment experiment. For the MLP model used in this analysis, performance was optimal when only the top three key features were included, whereas adding further features led to pronounced fluctuations and degradation. This indicates that, for MLP, a larger feature set does not necessarily translate into stronger generalization, and the model can be more sensitive to regional differences and covariate shift.
The non-monotonic performance and instability of MLP at certain feature-set sizes may be explained by its learning mechanism. Owing to its strong nonlinear fitting capacity, MLP can more readily absorb weakly relevant signals or region-specific patterns as input dimensionality increases, which can reduce transferability under distribution shift[42]. When the feature distributions or feature-response relationships shift in the held-out region, these patterns may not transfer, leading to higher extrapolation error and greater fold-to-fold variability[43]. Such behavior is more likely when inputs are high-dimensional, predictors are strongly correlated, or marginal distributions differ substantially across regions. These considerations also have direct implications for hyperparameter tuning. Under within-region evaluation, hyperparameter search often favors weaker regularization and higher capacity to minimize validation error; under a strong extrapolation setting, such as LOSO, carrying over those configurations can lead to overfitting to the statistical structure of the training regions and reduce cross-region stability. Therefore, for LOSO extrapolation, we recommend tuning toward stronger regularization and more conservative capacity control, trading some in-region fit for improved robustness under extrapolation.
Limitations and prospects
-
UAV-RGB imagery is cost-efficient and enables rapid coverage, making the proposed framework a practical pathway for low-cost, intelligent forest-resource monitoring. However, under real-world deployment, DBH estimation errors arise not only from the regression model itself but also from upstream processing steps, including the quality of image preprocessing, single-tree segmentation errors, edge-tree identification bias, and the resulting propagation of feature-extraction errors. Therefore, a key application-oriented priority is to quantify uncertainty sources and their propagation pathways. Future work can conduct end-to-end uncertainty assessment and use perturbation experiments or related sensitivity analyses to quantify how uncertainties propagate to the final DBH predictions, thereby providing more reliable error bounds and a clearer scope of applicability for operational deployment.
In addition, while the current framework performs well in our experiments, its evaluation has so far been limited to the data conditions considered in this study. Its broader applicability should be further validated in more heterogeneous settings, such as mixed-species stands, structurally more complex forests, and regions spanning stronger climatic gradients. Under these conditions, domain shift is likely to be more pronounced, and the feature set and validation strategy may require corresponding adjustments, for example, adopting stricter spatial blocking or grouped validation, and further examining feature selection and regularization strategies targeted at cross-domain robustness. Moreover, the extrapolation results in this study highlight the inherent limitations of conventional supervised learning models in cross-region generalization. Looking forward, a promising direction is to adopt a pretraining–fine-tuning paradigm: leveraging large-scale, multi-source long-term inventory datasets for offline pretraining to enhance feature representation, followed by fine tuning on target-region data to improve robustness to distribution shift and deployment performance. This direction falls within the broader framework of transfer learning and domain adaptation and should be systematically evaluated under cross-region and multi-temporal data settings.
-
This study developed a UAV-RGB anchored framework for estimating individual-tree DBH in Chinese fir. By combining stepwise multi-source feature fusion with SHAP-based interpretation, the framework improves predictive accuracy while enhancing interpretability. In the within-distribution evaluation using 986 trees, progressively expanding predictors from individual-tree structural information to forest spatial structure, spectral–textural features, and climatic background information yielded consistent gains for most models, with the best performance achieved under the full feature set. MLP showed a clearer advantage under higher-dimensional inputs. Both global and local SHAP results consistently indicated that tree height and crown width are the primary information sources, while several vegetation indices, texture metrics, and climatic variables provide complementary contributions. This suggests that, beyond structural predictors, the models can leverage canopy spectral-textural proxies and environmental context to improve DBH estimation. The DBH class-based analysis further showed that errors are more pronounced for larger trees, and that the benefits of multi-source fusion are stronger for the medium and large DBH classes, sample composition and diameter-class imbalance are plausible contributors to this error heterogeneity.
In the external validation using cross-region historical data, adding climatic factors improved performance under both within-region evaluation and the stricter LOSO extrapolation setting. LOSO is inherently more stringent than within-region evaluation, accordingly, performance metrics under LOSO were markedly lower than those obtained under within-distribution evaluation. Overall, the findings support the feasibility of low-cost UAV-RGB based DBH estimation for Chinese fir under the data conditions examined or similar settings, and indicate that combining multi-source feature fusion with model interpretability can inform feature design, model refinement, and cross-region application. Future work should also incorporate explicit uncertainty quantification and error-propagation analysis to improve reliability for operational deployment.
This work was funded by National Natural Science Foundation of China (32271877), Fundamental Research Funds of Chinese Academy of Forestry (CAFYBB2023PA003) and Science and Technology Innovation 2030-Major Projects (2023ZD0406103).
-
The authors confirm their contributions to the paper as follows: writing – original draft: Fu R; writing – review & editing: Zhang H, Zhu X, Wang G, Sun H, Wang L, Cui Z; software, Formal analysis: Fu R, Zhu X; data curation: Fu R, Wang L, Zhang J, Yu L; methodology: Fu R, Wang G, Sun H; visualization: Fu R, Zhu X, Cui Z, Zhang J; investigation: Zhu X, Wang L, Yu L; conceptualization: Fu R, Wang G, Zhang H; validation: Zhang H, Zhu X; resources: Sun H; funding acquisition, supervision, project administration: Zhang H. All authors reviewed the results and approved the final version of the manuscript.
-
The datasets generated during and/or analyzed in the current study are available from the corresponding author upon reasonable request.
-
The authors declare that they have no known competing financial interests or personal relationships that could have appeared to influence the work reported in this paper.
- This article is an open access article distributed under Creative Commons Attribution License (CC BY 4.0), visit https://creativecommons.org/licenses/by/4.0/.
-
About this article
Cite this article
Fu R, Zhang H, Wang G, Zhu X, Sun H, et al. 2026. Improving the accuracy of DBH estimation in Chinese fir using multi-source data fusion and interpretable machine learning algorithms. Smart Forestry 1: e007 doi: 10.48130/smartfor-0026-0004 

Improving the accuracy of DBH estimation in Chinese fir using multi-source data fusion and interpretable machine learning algorithms
- Received: 05 January 2026
- Revised: 07 February 2026
- Accepted: 09 March 2026
- Published online: 29 April 2026
Abstract: Reliable, non-destructive estimation of individual-tree diameter at breast height (DBH) is essential for assessing forest biomass and growth. This study proposes an interpretable DBH estimation framework grounded in UAV-RGB imagery, which quantifies the incremental gains from stepwise multi-source feature fusion, and utilizes SHAP to characterize model reliance on different information sources. Using 986 Chinese fir trees from 20 plots in the Huangfengqiao State-owned Forest Farm (Hunan, China), we constructed four feature sets by progressively adding forest spatial structure (FSS), vegetation indices plus texture features (VI + TF), and climatic factors (CF) to a baseline set of individual-tree features (ITF), and benchmarked six machine-learning models. Under within-distribution evaluation, multi-source fusion consistently improved performance: the full feature set (Set 4) reduced mean MAE (averaged over the six models) from 1.61 to 1.50 cm, and increased mean R2 from 0.79 to 0.82, with the multilayer perceptron (MLP) achieving the best accuracy (MAE = 1.44 cm, RMSE = 1.84 cm, R2 = 0.84). SHAP analysis revealed that tree height and crown width are the primary information sources, while VI and texture features, as well as climatic variables, provide complementary predictive contributions. We conducted cross-region validation using a larger historical inventory dataset and found that incorporating CF improved accuracy under both within-region evaluation and the stricter leave-one-site-out (LOSO) extrapolation setting: MAE decreased by 15.1% under within-region evaluation, and by 7.17% under LOSO, while overall performance was more conservative under LOSO, reflecting distribution shift. Collectively, the proposed framework provides a low-cost, interpretable, and transferable strategy for UAV-RGB based DBH estimation.