


-
Bladder cancer, the most common urinary tract malignancy, is commonly classified into non-muscle invasive bladder cancer (NMIBC) and muscle-invasive bladder cancer (MIBC) categories based on tumor infiltration depth relative to the detrusor muscle[1]. Compared to NMIBC, MIBC exhibits greater aggressiveness and metastatic potential, resulting in more difficult therapeutic challenges[2]. In clinical practice, MIBC is defined by invasion into the detrusor muscle and exhibits a higher propensity for lymph node and distant organ metastasis[3−5]. Over 50% of MIBC patients develop metastatic disease within 2 years after radical cystectomy (RC)[3−5], and the median survival for patients with metastatic disease is less than 13−16 months[6]. While cisplatin-based chemotherapy remains the first-line treatment standard for unresectable/metastatic MIBC, it provides an inadequate survival advantage[7]. Thus, elucidating the mechanisms linking intramuscular invasion and distant metastasis may therefore advance therapeutic strategies to improve metastatic MIBC survival outcomes.
Current mechanistic understanding of MIBC progression primarily centers on tumor cell-intrinsic genetic/epigenetic alterations, including TP53/PTEN deletion/mutation and E2F3/HER2 amplification[8−10]. Additionally, key signaling pathways, such as PI3K/Akt/mTOR and RTK-RAS-ERK cascades, have been functionally validated to activate invasive programs in bladder cancer cells[11,12]. Aside from tumor cell-autonomous mechanisms, the surrounding microenvironment is also critical in promoting MIBC invasiveness. For instance, it has been reported that bladder cancer cells penetrate and move across the smooth muscle barrier via the interaction of the mechanosensing cell adhesion receptor α6β1 with extracellular matrix (ECM)[13,14]. Stromal components, particularly tumor-associated fibroblasts, enhance the invasive capability of bladder cancer by secretion of chemoattractants, growth factors and ECM-degrading proteases[15]. Nevertheless, the observed clinical correlation between detrusor muscle invasion and high metastatic propensity suggests potential involvement of muscular niche-specific regulatory mechanisms, which remain mechanistically unclear.
The detrusor muscle in the bladder is predominantly composed of smooth muscle cells (SMCs)[16], which exhibit divergent phenotypic plasticity in response to pathological stimuli[17,18]. For instance, vascular SMCs could transdifferentiate to macrophage-like cells during atherosclerotic lesion development[19], or acquire endothelial lineage characteristics via mesenchymal-to-epithelial transition[20]. These findings suggest that SMCs might serve as a novel cellular reservoir for functional endothelial cells. Furthermore, Murgai et al.[21] demonstrated that tumor-derived factors redirect perivascular SMCs toward an ECM-synthesis phenotype, facilitating metastatic dissemination via microenvironment remodeling[21]. Collectively, SMCs' plasticity within the tumor environment may provide insights into the mechanisms underlying MIBC infiltration into the muscles and progression to distant metastasis.
Here it is reported that TGFβ3-triggered SMAD2/ETV4/CARM1 complex reprogrammed succinate metabolism, driving SMCs to endothelial-like cells (ELCs) transdifferentiation, and enhancing intramuscular vascularization, which ultimately promoted MIBC distant metastasis through vascular mimicry mechanisms. Through structural screening, targeting the SMAD2-ETV4-CARM1 trimer interface, L-chicoric acid was identified as a potent inhibitor disrupting trimer assembly, consequently suppressing MIBC lung metastasis. These findings represent a druggable target to block SMCs-to-ELCs-mediated vascular remodeling in MIBC metastasis.
-
All clinical malignant urothelial bladder cancer specimens were collected from 160 patients who underwent surgical resection from December 2010 to November 2022, including 127 patients diagnosed with primary NMIBC, and 178 patients with MIBC; diagnosed histopathologically and independently by pathologists in clinical settings. The clinicopathological characteristics of the 305 patients are summarized in Supplementary Tables S1−S4. This study was approved by the Institutional Medical Research Ethics Committee of the Sun Yat-sen Memorial Hospital, and Sun Yat-sen University Cancer Center of Sun Yat-sen University complied with all relevant ethical regulations involving human participants (Approval number: SYSKY-2023-034-01). The informed consent and approval were acquired from patients for providing tissues for research.
The IHC images were captured by Axio Imager.Z2 system (Carl Zeiss Co. Ltd., Jena, Germany). Immunostaining intensity was assessed and scored independently by two pathologists blinded to the clinical information of the bladder cancer specimens. The IHC scores were determined based on the proportion of positively stained tumor cells and the staining intensity, following a previously described method[22]. Tumor cell proportion was graded as follows: 0 (no positive cells), 1 (< 10% positive cells), 2 (10%−35% positive cells), 3 (35%−75% positive cells), 4 (> 75% positive cells). Staining intensity was scored as: 1 (no staining), 2 (weak staining, light yellow), 3 (moderate staining, yellow-brown), 4 (strong staining, brown). The staining index (SI) was calculated as the product of staining intensity and proportion of positive tumor cells, resulting in possible scores of 0, 2, 3, 4, 6, 8, 9, 12, and 16. Cutoff values for high- and low-expression of proteins of interest were chosen based on a measurement of heterogeneity using the log-rank test with respect to overall survival and distant-metastasis-free survival.
Cells
-
Bladder cancer cell lines RT4, HT-1376, 5637, J82, SW780, T24, TCCSUP, UMUC3, and human embryonic kidney cells (HEK) 293T were obtained from the American Type Culture Collection (ATCC, Manassas, VA, USA). All the cell lines were grown in Dulbecco's modified Eagle's medium (DMEM) (Gibco, Grand Island, NY, USA) supplemented with 10% fetal bovine serum (Gibco, Grand Island, NY, USA). Primary human normal bladder smooth muscle cells (PBSMCs) were purchased from Procell Life Science & Technology Co., Ltd (CP-H069; Wuhan, China), and cultured in the indicated medium according to the manufacturer's instructions. The patient-derived bladder cancer cells (PDBCs), including 7 muscle-invasive PDBCs (MI-PDBCs), and 8 non-muscle invasive PDBCs (NMI-PDBCs) were isolated from malignant urothelial bladder cancer patients who were clinically diagnosed with MIBC and NMIBC according to previous reports[23]. Briefly, bladder tumor tissue was collected from patients who underwent surgical resection or cystoscopy examination, and was transferred to a 15 mL tube containing sterile PBS. All samples are placed on ice, and the subsequent steps were completed under sterile conditions within 6 h. The tumor tissue is dissected into small pieces with a scalpel, and digested with a digestion buffer containing dispase (Gibco, Grand Island, NY, USA), collagenase (Sigma-Aldrich, St. Louis, MO, USA) and hyaluronidase (Sigma-Aldrich, St. Louis, MO, USA). After sufficient lysis, cells are centrifuged at 1,000 rpm for 5 min, and the supernatant is discarded. The cell pellet is resuspended in medium and transferred to a culture dish for cultivation. All the cells were tested for mycoplasma contamination and were authenticated by short tandem repeat (STR) fingerprinting at the Medicine Lab of Forensic Medicine Department of Sun Yat-sen University (China).
Virtual screening of inhibitor targeting SMAD2-ETV4 interaction
-
The inhibitors targeting SMAD2-ETV4 interaction were identified through a comprehensive virtual screening process using the Schrödinger software package (2023-3). Briefly, the structures of SMAD2-ETV4 protein complex and SMAD2 were separated from the tetramer predicted by AlphaFold 3. Next, the SMAD2 protein structure was prepared in the Protein Preparation module, including adding hydrogens, refining the loop regions, and minimization. Agrid box was generated by the Receptor Generation Grid module, the center residue (Lys 420) of the binding surface of the proteincomplex was identified as grid box centroid. For the ligand preparation, a bioactive compound library (L4200, Targetmol) containing 25,682 compounds was processed using the Ligand Preparation module. Subsequently, molecular docking was performed at three levels, (HTVS, XP, and SP) using the Glide module. Next, the drugs were ranked based on docking scores, and 167 drugs with a ΔG <−2kcal/mol were selected (Supplementary Tables S5). These selected drugs were further analyzed for properties, including interactions involving more than four hydrogen bonds with the amino acid side chain or main chain, using the MOE two-dimensional ligand interaction module. Finally, five compounds were identified for further in vitro experimental validation. Additionally, protein-ligand interactions were illustrated by using the Ligand Interaction Diagram module and Pymol software.
Plasmids, retroviral infection, and transfection
-
The human ETV4, sulfide quinone oxidoreductase (SQOR), and TGFβ3 were cloned into pLVX-IRES-vector. The human CARM1 was cloned into pCDH-CMV-puro-vector. The human SMAD2 and truncated-SMAD2 fragments were cloned into pCDEF-vector. The constitutively active form of SMAD2 (SMAD2 S2D-S465D/S467D) was generated using a QuikChange Site-Directed Mutagenesis Kit (Agilent Technologies, China), and dominant negative SMAD2 mutant plasmid (SMAD2 S3A-S464A/S465A/S467A, Addgene#101763) was purchased from Addgene (Cambridge, MA). Short hairpin RNAs (shRNAs) targeting TGFβ3 and SQOR were cloned into the pSuper-retro viral vector. Short interfering RNAs (siRNAs) targeting specific sequences were synthesized by RiboBio Co., Ltd (China). All primers and oligonucleotides used in plasmid construction are listed in Supplementary Tables S6−S8. Transfection of siRNAs or plasmids was performed using Lipofectamine 3000 reagent (Thermo Fisher Scientific, Waltham, MA, USA) according to the manufacturer's instructions. Stable cell lines expressing TGFβ3, SQOR, TGFβ3 shRNA(s), and SQOR shRNA(s) were generated via retroviral infection, and selected with 0.5 µg/mL puromycin for 10 d, 48 h after infection, and the efficiency was confirmed by qRT-PCR and western blotting.
RNA extraction, reverse transcription, and real-time PCR
-
Total RNA was extracted from the indicated tissues and cells using the Trizol reagent (Life Technologies, Carlsbad, CA, USA) according to the manufacturer's instructions. The extracted RNA was immediately reverse transcribed into cDNA using the GoScriptTM Reverse Transcription Mix Random Primers kit (Promega Biotech Co., Ltd, China). Real-time reverse transcription-polymerase chain reaction (RT-PCR) primers were designed with the assistance of the Primer Express v 2.0 software (Applied BioSystems, Foster City, CA, USA). Quantitative real-time PCR (qRT-PCR) was then performed using the SYBR® Green Real-time PCR Master Mix assay kit (Toyobo, Osaka, Japan). Expression data were normalized to the geometric mean of housekeeping gene GAPDH to control the variability in expression levels and calculated as 2−[(Ct of gene) – (Ct of GAPDH)], where Ct represents the cycle threshold for each transcript. All primers are listed in Supplementary Table S7.
Chemical reagents
-
Succinic acid (Cat#S9512), dimethyl malonate (Cat#136441), 13C4 sodium succinate (Cat#491985) were purchased from Sigma-Aldrich (St. Louis, MO, USA). Anti-Conjugated Succinate (Cat#Y052722) was purchased from Applied Biological Materials (Vancouver, Canada). Cis-Epoxysuccinic acid (CES; Cat# HY-125791) and hGPR91 Antagonist-Compound 4C (Cat#HY-126217) were purchased from MedChemExpress (NJ, USA). Recombinant Human TGFβ3 protein was purchased from R&D Systems (Minneapolis, MN). Recombinant Human ETV4 protein (ABIN2712284) was purchased from Antibodies-online (Limerick PA, USA). Recombinant Human CARM1 protein (ab196401) and recombinant Human SMAD2 protein (ab238234) was purchased from Abcam (Minneapolis, MN, USA). MCT1 inhibitor AZD-3965 (Cat# S7339), and iNOS inhibitor SMT (Cat#S3631) were purchased from Selleck Chemicals (Houston, TX, USA). Five bioactive compounds, including Parishin B (Cat#T3S1816), ADP ribose sodium (Cat#T10247), Rebaudioside A (Cat#T3235), Tubuloside A (Cat#T5S0281), and L-Chicoric acid (Cat#T6S2391) were purchased from TargetMol Chemicals Inc. (Boston, MA, USA).
Animal and orthotopic bladder cancer xenografts
-
BALB/c nude mice and NOD-SCID IL-2rγ−/− (NSG) mice, aged six to eight weeks and weighing 15−20 g, were purchased from Vitalriver (Beijing, China) and housed under pathogen-free conditions. The temperature was maintained at 20 ± 2 °C, and the relative humidity was 50% ± 10%; the animals were housed on a 12 h day–night cycle and given free access to food and water. The mice were randomly divided into groups (n = 6/group) and underwent intravesical instillation with bladder cancer cells as described previously[24−26]. Briefly, the mouse was anesthetized with 50 mg/kg of pentobarbital, and a sterile 24-gauge plastic venous catheter was inserted into the bladder via the urethra under sterile conditions. After the catheter was inserted, the needle was removed. The bladder was washed three times with 100 µL phosphate-buffered saline (PBS; Thermo Fisher Scientific, Waltham, MA, USA). To facilitate tumor inoculation onto the bladder mucosa, 0.1 mL of 0.1 mg/mL poly-L-lysine (PLL) was injected into the catheter and left for 30 min, and then the unbound PLL solution was removed. While under anesthesia, 150 μL of sterile PBS cell suspension containing 1.5 × 10⁶ bladder cancer cells was instilled into the bladder, and the catheter was immediately clamped with a 20-gauge forcep at the urethral orifice to prevent leakage and left indwelling for at least 1 h. The mice were turned 90 degrees every 15 min to expose the entire bladder to the tumor cell suspension. After 1 h, the catheter was removed, and the mice were allowed to void the suspension spontaneously.
For educating PBSMCs with different treatments, direct intramural injection of the indicated PBSMCs was performed as described previously[27,28]. Briefly, after disinfecting the abdominal wall with chlorhexidine, a low transverse laparotomy was performed to exteriorize the urinary bladder. Using a 30-gauge needle, 50 μL of the indicated solutions was directly inoculated into the bladder wall. The bladder was then repositioned into the abdominal cavity and the incision was closed with absorbable sutures. All experimental procedures were approved by the Institutional Animal Care and Use Committee of Sun Yat-sen University, and the approval number was SYSU-IACUC-2023-001713.
CAPTURE System
-
CAPTURE system was carried out according to a previous report[29]. Briefly, the three components in the CAPTURE system, including a FB-dCas9 (Addgene#100547, Watertown, MA, USA), a biotin ligase BirA (Addgene#100548, Watertown, MA, USA), and target-specific sgRNAs (targeting the promoter of SQOR) were transfected into bladder cancer cells, and the genomic locus-associated proteins were isolated using streptavidin purification, followed by further analysis using mass spectrometry.
Chromatin immunoprecipitation (ChIP) assay
-
The entire procedure was performed with the chromatin immunoprecipitation (ChIP) assay kit (Cell Signaling Technology, Danvers, MA, USA) according to the manufacturer's instructions. Briefly, the indicated cells were grown in a 100-mm culture dish to 70%~80% confluency and fixed with 1% formaldehyde to cross-link proteins to DNA. The cell lysates were sonicated to shear DNA into small, uniform fragments. Equal aliquots of chromatin supernatant were then immunoprecipitated overnight at 4 °C using anti-SMAD2 (#5339, Cell Signaling Technology), anti-ETV4 (ab189826, Abcam), anti-CARM1 (#3379, Cell Signaling Technology), anti-H3R17me2a (49-1021, Thermo Fisher Scientific), anti-H3R26me2a (A51513, Antibodies), anti-H3R2me2a (PA5-96233, Thermo Fisher Scientific), anti-H4R3me2a (PA5-102612, Thermo Fisher Scientific), anti-PAF1 (A300-173A, Thermo Fisher Scientific), anti-POLR2A (MA1-26249, Thermo Fisher Scientific), anti-KLF4 (NBP1-83940, Novus Biologicals), anti-Elk1 (27420-1-AP, Proteintech), anti-SRF (#5147, Cell Signaling Technology), anti-SMAD3 (#9523, Cell Signaling Technology), anti-SMAD4 (#46535, Cell Signaling Technology), anti-H2BK120ub (#5546, Cell Signaling Technology), anti-H3K4me3 (#9751, Cell Signaling Technology), anti-GATA-2 (ab109241, Abcam), anti-ER71 (ab1818478, Abcam), anti-CTD S2P (ab193468, Abcam), and anti-IgG antibodies (P0028, Beyotime) with protein G magnetic beads. The cross-linked protein/DNA complexes were collected by magnetic pull-down, and then were eluted from the beads by elution buffer. After reverse cross-linking of protein/DNA complexes to free DNA, PCR was performed using specific primers.
Metabolomic analysis
-
The metabolite analysis was performed using an LC-ESI-MS/MS system (UPLC, ExionLC AD,
https://sciex.com.cn ; MS, quadrupole-linear ion trap mass spectrometer (QTRAP)® System,https://sciex.com ) by Metware Biotechnology Inc (Metware). Briefly, cell supernatant samples were collected and pre-treated for on-board analysis. For ultraperformance liquid chromatography (UPLC), the analytical conditions were as follows: UPLC: column, Waters ACQUITY UPLC HSS T3 C18 (1.8 µm, 2.1 mm × 100 mm); column temperature, 40 °C; flow rate, 0.4 mL/min; injection volume, 2 μL; solvent system, water (0.1% formic acid) : acetonitrile (0.1% formic acid); gradient program, 95:5 V/V at 0 min, 10:90 V/V at 10.0 min, 10:90 V/V at 11.0 min, 95:5 V/V at 11.1 min, 95:5 V/V at 14.0 min. For ESI-QTRAP-MS/MS, LIT, and triple quadrupole (QQQ) scans were acquired on a triple QTRAP, QTRAP® LC-MS/MS System, equipped with an ESI Turbo Ion-Spray interface, operating in positive and negative ion mode and controlled by Analyst 1.6.3 software (Sciex). The ESI source operation parameters were as follows: source temperature 500 °C; ion spray voltage (IS) 5,500 V (positive), −4,500 V (negative); ion source gas I (GSI), gas II (GSII), and curtain gas (CUR) were set at 55, 60, and 25.0 psi, respectively; the collision gas (CAD) was high. Instrument tuning and mass calibration were performed with 10 and 100 μmol/L polypropylene glycol solutions in QQQ and LIT modes, respectively. A specific set of MRM transitions were monitored for each period according to the metabolites eluted within this period.Unsupervised PCA (principal component analysis) was performed by the statistics function prcomp within R (
www.r-project.org ). The data was unit variance scaled before unsupervised PCA. The significantly regulated metabolites between groups were determined by VIP ≥ 1 and absolute Log2FC (fold change) ≥ 1. VIP values were extracted from OPLS-DA results, which also contains score plots and permutation plots, and was generated using R package MetaboAnalystR. The data was log transform (log2) and mean centering before OPLS-DA. In order to avoid overfitting, a permutation test (200 permutations) was performed.Multiple immunofluorescence analysis
-
The PANO 4-plex IHC kit (Panovue, China) was employed for multiple-color staining, following the provided manual. Paraffin-embedded samples were sequentially stained with primary antibodies and horseradish peroxidase (HRP)-conjugated secondary antibodies. One of the three PPD reagents was used for staining, followed by microwave treatment and another round of staining. Anti-CD31 rabbit antibody (#77699, Cell Signaling Technology), anti-CD31 mouse antibody (#3528, Cell Signaling Technology), anti-PCNA rabbit antibody (#13110, Cell Signaling Technology), and anti-αSMA rabbit antibody (#19245, Cell Signaling Technology) were used as primary antibodies. The dyes PPD520, PPD 570, PPD650 and 4',6-diamidino-2-phenylindole (DAPI) were used for staining. Samples were visualized using the Vectra Polaris Automated Quantitative Pathology Imaging System (Perkin-Elmer, Waltham, MA, USA).
All slides were scanned at an absolute magnification of × 40. Digital image analysis (DIA) of the whole slide images was performed using HALO version 3.2.1851. Cancer-specific artificial intelligence tissue classifiers were trained using the HALO AI module to segment the tumor center, invasion margin, stroma, and background (consisting of necrosis, artifacts, and glass). Subsequently, the HighPlex FL Algorithm v4.0.4 in HALO was used to detect CD31+ and CD31+αSMA+ cells based on cytonuclear features. The density (number of positive cells per mm2) of CD31+ and CD31+αSMA+ cells on the slides was calculated.
In vivo Matrigel plug assay
-
Six- to eight-week-old female BALB/c nude mice were anaesthetized with sodium pentobarbital (50 mg/kg body weight). 5 × 10⁵ PBSMCs that were pre-treated with the indicated treatment were mixed well with 50 μL EGM-2 medium (CC-3162, Lonza, Basel, Switzerland) containing 25 ng/mL VEGF and 250 μL Matrigel. Mice were grouped according to experimental requirements, with six mice in each group. The cell mixture was subcutaneously injected into the mice, and the mice were sacrificed at the site of cervical dislocation to collect plugs 14 d later. Samples were fixed with 4% paraformaldehyde, paraffin sections were prepared, and immunofluorescence staining for anti-CD31 antibody was then performed. Cell nuclei were counterstained and mounted with antifade mountant with DAPI (Thermo Fisher Scientific, Waltham, MA, USA).
In vitro Matrigel tube formation assay
-
150 μL Matrigel (356234, Corning, NY, USA) was added to each chamber of the 24-well plate and allowed to solidify at 37 °C for 1 h. 2 × 10⁴ cells suspended evenly in 500 μL culture media were then added into each Matrigel-coated chamber. Chamber slide was maintained in a 37 °C incubator. Tube formations were observed at 6 h under a light microscope, and images were taken. Total tube length was measured the ImageJ image processing program, and immunofluorescent staining was performed using the anti-CD31 antibody. Cell nuclei were counterstained and mounted with antifade mountant with DAPI (Thermo Fisher Scientific, Waltham, MA, USA).
Measurement of succinate concentration
-
The indicated bladder cancer cells were seeded at a density of 3 × 10⁶ per 10-cm culture dish in 10 mL culture medium and cultured for 24 h. Culture medium was collected, and the succinate content was determined by a Succinate (Succinic Acid) Colorimetric Assay Kit (MAK335; Sigma-Aldrich, St. Louis, MO, USA) according to the manufacturer's instructions. Serum succinate concentration was measured with the same assay kit.
Measurement of extracellular pH
-
Extracellular pH was determined by measuring the pH of culture media using the Mettler Toledo pH meter equipped with the micro probe with automatic temperature compensation. The pH meter was also used to adjust the pH of media and other reagents as needed. The pH meter was recalibrated with three standards (51302080, Mettler Toledo) at the start of every experiment.
Uptake experiments with [13C4] - labeled succinate
-
The indicated cells were counted after dissociation and re-plated at high cell-density (2.4 × 10⁵ cells/cm2) the day before the experiment. The following day, cells were collected and centrifuged at 300 g for 8 min. Pellet was re-suspended in DMEM (previously adjusted at pH 6.8) and cells were seeded in a 6-well plate at a final concentration of 5 × 10⁵ cells/mL/well. Each well was respectively stimulated with [13C4] -labeled succinate (Cat#491985; Sigma-Aldrich, St. Louis, MO, USA) at final concentration 500 μM (80 nCi [13C4]-succinate/mL) in PBS. PBS alone was used as controls. At the corresponding time points, culture media and cells were collected and centrifuged at 400 g for 5 min. To isolate the extracellular fraction, 500 μL of supernatant from each sample was added to tubes containing 3 mL of Ultima Gold liquid scintillation cocktail (PerkinElmer). To isolate the cellular fraction, the remaining volume in the tube was removed first after a 1,000 g for 5 min spin. Another 1,000 g for 1 min spin was then performed to better separate the pellet from the residual supernatant. Finally, each pellet was dried with blotting paper (to further avoid any extracellular fraction's contamination) and 40 μL of Triton X-100 was added. Cellular fraction was then added to tubes containing 3 mL Ultima Gold liquid scintillation cocktail (PerkinElmer). Total radioactivity was then measured using a TriCarb LSC Counter (PerkinElmer). Radioactive counts were converted into decays per min and subsequently converted into amounts of succinate using a final specific activity of 0.15 mCi/mmol. Data were normalized on total protein content evaluated by the BCA Protein assay kit (Thermo Scientific).
13C-labelling of metabolites in vivo
-
The metabolic flux experiments were performed based on previous reports[30]. In brief, tumor-bearing mice were fasted overnight prior to tail vein infusion and injected with indicated 13C-labelling of metabolites dissolved in saline at a dose of 1 g/kg via the tail vein. After 1.5 h, the animals were euthanized, the tumor tissue was immediately removed and placed in liquid nitrogen. Tissue samples (40 mg) were ground in liquid nitrogen and resuspended in 0.6 mL cold (−40 °C) 50% aqueous methanol solution. The samples were placed in dry ice for 30 min, and then thawed on ice. Then, 0.4 mL of chloroform was added to the samples and vortexed for 30 s before centrifugation for 15 min at 14,000 rpm and 4 °C. After centrifugation, the supernatants were transferred to new 1.5 mL tubes, evaporated and stored at −80 °C until analysis. Metabolites were derivatized for GC/MS analysis as described previously[30].
Immunohistochemistry (IHC)
-
The tissue sections (4 µm in thickness) were prepared from FFPE blocks, de-paraffinized, and rehydrated by standard protocols. Depending on the antibodies used, antigen retrieval was performed either at pH 6 or at pH 9 antigen unmasking solution in a pressure cooker. Sections were incubated in blocking buffer (1% BSA in PBS-T) for 1 h, followed by incubation with primary antibodies in blocking buffer for 2 h, all at room temperature. Sections were then incubated with biotin-conjugated anti-rabbit/mouse IgG (Zhong-shan Golden-bridge Biotechnology, Beijing, China) for 20−30 min at room temperature. DAB was used as a detection system (Zhong-shan Goldenbridge Biotechnology), according to the manufacturer's instructions.
Primary antibodies used for microvessel density (MVD) analyses were: anti-CD31 rabbit (#77699, Cell Signaling Technology, Danvers, MA) antibody, anti-CD31 mouse antibody (#3528, Cell Signaling Technology, Danvers, MA). Antibody validation is provided on the manufacturers' websites. IHC staining of CD31 in bladder cancer samples was quantified by the AxioVision 4.6 computerized image analysis system, assisted with an automatic measurement program (Carl Zeiss). The CD31 staining indicates the endothelial cells of blood vessels, and microvessel counting was performed in areas with maximal neovascularization within the tissues at ×200 magnification. Counts were made of all distinct brown staining endothelial cells over three fields in each slide, and the MVD was defined as the average value of the three readings based on Weidner's method[31]. Each positive endothelial cell cluster of immunoreactivity in contact with the selected field was counted as an individual vessel in addition to the morphologically identifiable vessels with a lumen.
Immunofluorescence (IF) staining
-
The indicated cells were plated on chamber slide cultures (Thermo Fisher Scientific, CA, USA) and after incubation with primary antibodies at 4 °C overnight. The following primary antibodies were used: anti-αSMA (#19245; Cell Signaling Technology, Danvers, MA), anti-CD31 antibody (#3528; Cell Signaling Technology, Danvers, MA) and anti-SUCNR1 (NBP1-00861; Novus Biologicals, CO, USA). The following day, the cells were incubated with fluorescence-labeled secondary antibodies, including goat anti-rabbit IgG (H + L) conjugated with Alexa Fluor 488 (A-11008, Thermo Fisher Scientific, Waltham, MA, USA) or Alexa Fluor 594 (A-11012, Thermo Fisher Scientific, Waltham, MA, USA) in 1% BSA at room temperature for 20−90 min. Cell nuclei were counterstained and mounted with antifade mountant with 4',6-diamidino-2-phenylindole (DAPI) (Thermo Fisher Scientific, Waltham, MA, USA). The images were captured using the AxioVision Rel.4.6 computerized image analysis system (Carl Zeiss, Jena, Germany).
Immunoblotting (IB) analysis
-
IB analysis was performed according to a standard protocol with the following antibodies: anti-CD31 (#3528), anti-CD144 (#2500), anti-pElk1(#9181), anti-SMAD2 (#5339), anti-pSMAD2 (#18338) and anti-SMAD3 (#9523) antibodies (Cell Signaling Technology, Danvers, MA, USA); anti-SQOR (ab272574), anti-CD34 (ab81289), anti-SMAD4 (ab3219), anti-vWF(ab181871), anti-iNOS (ab178945) anti-GATA-2 (ab109241), anti-ER71 (ab1818478) (Abcam, Cambridge, MA, USA); anti-ETV4 (PA5-76825), anti-CARM1 (MA5-15796), anti-PAF1 (A300-173A), anti-JAG1 (PA5-46970) antibodies (Thermo Fisher Scientific, Waltham, MA, USA); anti-SUCNR1 antibodies (NBP1-00861; Novus Biologicals, CO, USA); anti-Succinylation-lysine antibodies (PTM-401; PTM BioLab,CN); anti-pERK1/2 (28733-1-AP), anti-ERK1/2 (51068-1-AP), anti-Elk1 (27420-1-AP), anti-DHODH (14877-1-AP), anti-PRODH (22980-1-AP), anti-ETFDH (11109-1-AP), anti-SLC13A3 (26184-1-AP), anti-SLC13A2 (21722-1-AP), anti-SLC13A5 antibody (23883-1-AP), anti-SLC25A10 (12086-1-AP), anti-MCT1 (20139-1-AP), anti-MCT2 (20355-1-AP), anti-MCT4 antibody (22787-1-AP), anti-PTPMT1 (11493-1-AP), anti-FGR (83352-1-RR), anti-CTR9 (21264-1-AP), anti-LEO1 (12281-1-AP), anti-CDC73 (66490-1-Ig), anti-SKI8 (22536-1-AP), anti-HES5 (22666-1-AP), anti-CTCF (61312-1-AP), anti-BCLAF1 (67860-1-Ig), anti-flag (20543-1-AP), and anti-β-actin (60008-1-Ig) anti-GAPDH (60004-1-Ig) antibodies (Proteintech, Rosemont, IL, USA).
Co-immunoprecipitation (Co-IP) assay
-
The indicated cells grown in 100-mm culture dishes (with an average cell count of 106~107) were lysed using 500 μL of lysis buffer [25 mmol/L HEPES (pH 7.4), 150 mmol/L NaCl, 1% NP-40, 1 mmol/L EDTA, 2% glycerol, and 1 mmol/L phenylmethylsulfonyl fluoride]. After reacting on ice for 30 min, the lysate was subjected to a microcentrifugation at 12,000 rpm for 10 min, and the supernatant was immediately transferred to a new centrifuge tube. The lysate was incubated with 20 μL of agarose beads (Calbiochem, San Diego, CA, USA) at 4 °C with slow rotation for 1 h to remove nonspecific proteins and reduce background. After centrifugation at 2,000 rpm for 1 min, the supernatant was incubated with 20 μL of pre-treated antibody-cross-linked protein G-agarose beads at 4 °C overnight. The agarose beads were then washed six times with washing buffer (25 mmol/L HEPES [pH 7.4], 150 mmol/L NaCl, 0.5% NP-40, 1 mmol/L EDTA, 2% glycerol, 1 mmol/L phenylmethylsulfonyl fluoride). After removing all the liquid, the precipitated beads were resuspended in 30 μL of 1 M glycine (pH 3), and 10 μL of 4× sample buffer was added to denature the protein. Protein samples obtained were then separated using sodium dodecyl sulfate polyacrylamide gel electrophoresis for immunoblotting analysis.
Far-Western analysis
-
Far-Western analysis was performed on proteins co-immunoprecipitated with anti-Flag antibody (F3165; Sigma-Aldrich, St. Louis, MO, USA) and recombinant Human ETV4 Protein (ABIN2712284; Antibodies-online, Limerick PA, USA) and recombinant Human CARM1 Protein (ab196401; Abcam, Cambridge, MA, USA). Briefly, the proteins were separated by SDS-PAGE, and then transferred onto a PVDF membrane (Millipore, Bedford, MA, USA). Membranes were then pre-incubated in 10% skimmed milk at 4 °C for 1 h. As indicated, recombinant protein was added at 5 μg/mL, and incubated at 4 °C for 18 h. After extensive washing six times with TBST, the membrane was subjected to immunoblotting analysis using indicated antibodies.
Enzyme-linked immunosorbent assay (ELISA)
-
The serum samples were kept at room temperature for about 1.0 h to defrost completely before assays. The TGFβ3 level in the culture medium from PDBCs cells was measured using a human TGFβ3 ELISA kits (ab272203) (Abcam, Cambridge, MA, USA) and analyzed according to the manufacturer's instructions. Data were read with the SpectraMax i3x Multi-Mode Microplate Reader (Molecular Devices) at 450 nm, the concentrations of TGFβ3 in the samples were determined by extrapolating from the standard curve created by plotting the absorbance of the standards versus corresponding concentrations.
Protein-protein docking
-
The structure tetramer formed by p-SMAD2-ETV4-CARM1-SQOR Promoter was performed using AlphaFold3 Server (
https://golgi.sandbox.google.com ). To identify the interaction of the tetramer predicted by AlphaFold3, we performed the protein-protein docking analysis with PDBePISA (www.ebi.ac.uk ), and used PyMOL Version v2.5.2 to visualize the interface and the key interaction residues between p-SMAD2 and ETV4. The interface analysis results were selected for further experimental validation.Surface plasmon resonance (SPR)
-
The binding kinetics between SMAD2 and L-chicoric acid were analyzed by a surface plasmon resonance assay using a Cytiva Biacore 1 K instrument (GE Healthcare, Pittsburgh, PA, USA). Binding reactions were performed in HBS-EP buffer (GE Healthcare) at pH 7.4. SMAD2 protein was coated on the flow cell of a CM7 sensor chip by direct immobilization. L-chicoric acid was used to evaluate non-specific binding. The binding analyses were performed at a flow rate of 25 μL/min at 25 °C. A total of 0−25 μM L-chicoric acid was passed over the surface of the sensor chip. The association rate constant (Ka) and the dissociation rate constant (Kd) were calculated according to BIA evaluation software. The dissociation constant (Kd) was determined by Kd/Ka.
CCK8 assay
-
Cells are seeded into 96-well plates at a predetermined density, ensuring representation of each treatment group and control in triplicate. Following this, the cells were treated with conditioned media. After treatment, the cells were incubated at 37 °C with 5% CO2 for 48 h. Subsequently, the CCK-8 assay solution was prepared by diluting the CCK-8 reagent in growth medium at a ratio of 1:10, and 10 μL of this solution was added to each well containing the cells after incubation. After an additional incubation period of 1−4 h, the absorbance of each well was measured at a wavelength of 450 nm using the SpectraMax i3x Multi-Mode Microplate Reader (Molecular Devices). Data analysis involves calculating the relative cell viability or proliferation by normalizing absorbance readings of treated wells to those of untreated control wells, followed by statistical analysis as appropriate.
Statistical analysis
-
Statistical tests for data analysis included the log-rank test, Chi-square test, one or two-way analysis of variance (ANOVA) and Student's two-tailed t test. Survival curves were plotted by the Kaplan–Meier method and compared by the log-rank test. The significance of various variables for survival was analyzed by univariate and multivariate Cox regression analyses. Statistical analyses were performed using the SPSS 18.0 statistical software package (SPSSInc., Chicago, IL, USA) and GraphPad Prism 8 (GraphPad Inc., La Jolla, CA, USA). Data represent mean ± SD. p-values of 0.05 or less were considered statistically significant.
-
While tumor cell invasion into the muscularis may constitute a critical prerequisite for MIBC distant metastasis[32], the mechanistic link between intramuscular infiltration and distant metastasis remain largely unknown. To address this, we evaluated histopathological features of 305 archived paraffin-embedded NMIBC (n = 127) and MIBC (n = 178) tissues. IHC statistical analysis revealed significantly higher MVD in the muscularis of MIBC tissues versus NMIBC tissues, with elevated MVD significantly correlating with shorter distant-metastasis free survival (DMFS) and overall survival (OS) in MIBC cohorts (Fig. 1a, b; Supplementary Fig. S1a). Intriguingly, the CD31+ microvessels within the muscularis of MIBC tissues displayed co-expression of the SMCs marker α-SMA, a phenomenon rarely observed in NMIBC tissues (Fig. 1c). These findings suggested that the increased microvessels might be derived from SMCs during MIBC intramural invasion.
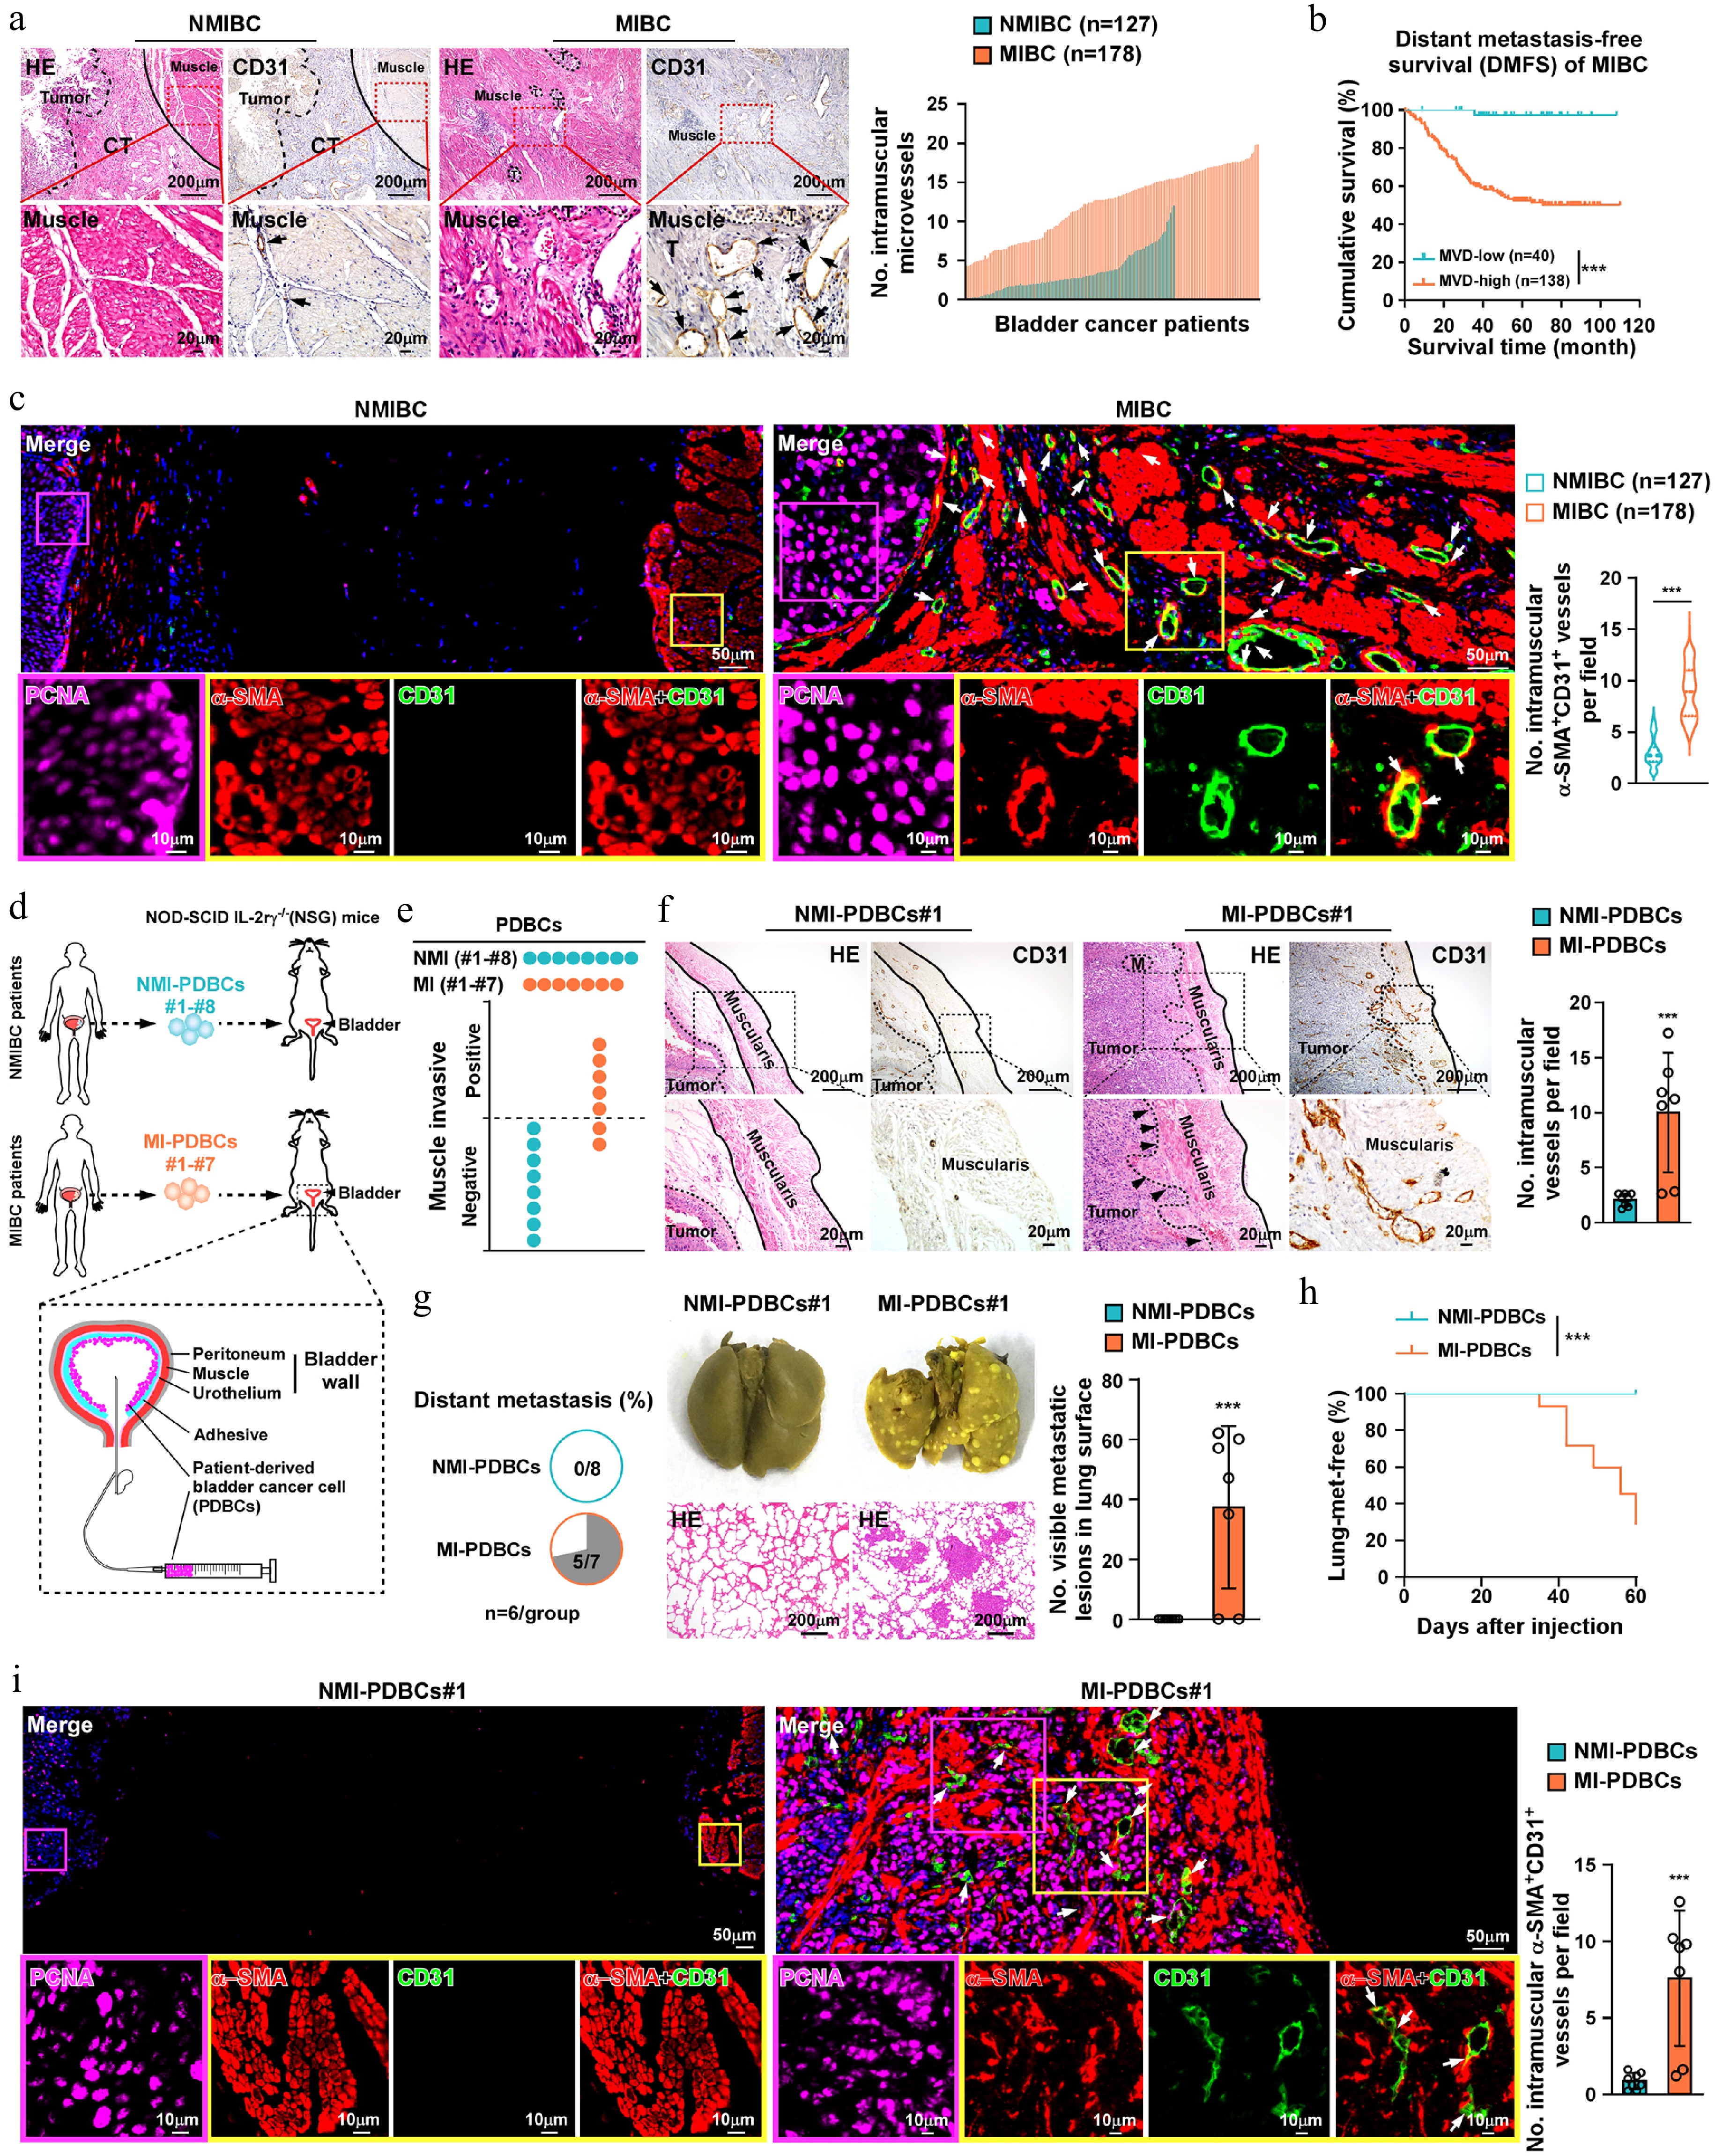
Figure 1.
Increased vessel density within muscularis correlates with distant metastasis in MIBC. (a) The representative histological images (H&E and IHC staining of CD31; left) and the quantification of CD31+ vessels in muscularis (right) among NMIBC (n = 127) and MIBC (n = 178) specimens. Muscle, muscularis layer; Tumor, tumor; CT, connective tissues; and black arrows indicate CD31+ vessels. Scale bars, 200 µm. Scale bars insets, 20 μm. (b) Kaplan-Meier analysis of distant metastasis-free survival in MIBC patients (n = 178) with high or low microvessel density (MVD). (c) Representative images of PCNA, CD31 and α-SMA immunostaining in NMIBC (n = 127) or MIBC samples (n = 178). Arrows indicate α-SMA+/CD31+ vessel in muscularis. Scale bars: 50 µm. Scale bars insets, 10 μm. (d) Schematic of establishing bladder orthotopic xenograft model with primary bladder cancer cells derived from MIBC or NMIBC patients (MI-PDBC or NMI-PDBCs). (e) Quantification of muscularis invasion and (f) representative images of CD31 and H&E in the indicated mice (No.#1–No.#8 for NMI-PDBCs and No.#1–No.#7 for MI-PDBCs). Scale bars, 200 µm. Scale bars insets, 20 μm. n = 6 mice/group. (g) Representative images and pie charts showing the lung metastatic nodules in indicated mice (NMI-PDBCs#1–#8; MI-PDBCs#1–#7). Scale bars, 200 µm. n = 6 mice/group. (h) Kaplan–Meier metastasis-free survival curve of mice from the indicated experimental group. n = 6 mice/group. (i) Representative images of anti-PCNA, anti-CD31, and anti-α-SMA in bladder tumor xenografts from indicated group. White arrows indicate the intramuscular α-SMA+/CD31+ vessel. Scale bars, 50 µm. Scale bars insets, 10 μm. Data are presented as the mean ± SD. Statistical analysis was performed using unpaired two-tailed t tests for (c), (f), (g) and (i), and Kaplan-Meier analysis method for (b) and (h). ** p < 0.01; *** p < 0.001; ns, not significant.
To investigate whether the increased intramuscular vessels contributed to promoting MIBC distant metastasis, an in vivo orthotopic xenograft mouse model was established using 15 PDBCs, including seven muscle-invasive PDBCs (MI-PDBCs) and eight non-muscle invasive PDBCs (NMI-PDBCs) (Fig. 1d). As shown in Fig. 1e, tumors formed by MI-PDBCs infiltrated into the muscularis with concomitant elevation of intramuscular CD31+ vessels, while NMI-PDBCs-derived tumors were restricted to the urothelium with sparse CD31+vessels. No lung metastases occurred in NMI-PDBC-bearing mice (0/8), whereas 71.4% (5/7) of MI-PDBCs developed pulmonary metastases, correlating with significantly reduced metastasis-free survival in mice (Fig. 1f−h; Supplementary Fig. S1b). Consistent with the histological analyses of clinical MIBC tissues, multiplex immunohistochemistry (mIHC) showed that MI-PDBCs-formed tumors infiltrated the muscularis and exhibited an increased intramural CD31+/α-SMA+ vessels (Fig. 1i). Taken together, these results mechanistically link intramuscular neovascularization to metastatic progression in bladder cancer.
MIBC induces transdifferentiation of SMCs into ELCs
-
To further determine MIBC cell-mediated SMCs-to-ELCs conversion, a co-culture system containing human PBSMCs was established (Fig. 2a). As shown in Fig. 2b, c, compared to PBSMCs cultured alone (Control), co-culturing PBSMCs with MI-PDBCs significantly upregulated endothelial markers (CD31, CD144, and vWF) while reducing the expression of the SMC marker α-SMA under both contact and non-contact conditions. This inductive effect was recapitulated by treatment with conditioned medium (CM) derived from MI-PDBCs, but not by NMI-PDBCs or NMI-PDBCs/CM or standard control medium (Fig. 2b, c; Supplementary Fig. S2a−S2c). Consistent with these phenotypic changes, PBSMCs exposed to MI-PDBCs-CM exhibited markedly enhanced tube-forming capacity in vitro, and increased vascularization in vivo compared to the control-CM treated group (Fig. 2d). These results directly visualize the potent inductive effect of unknown MI-PDBCs-secreted factor (s) in driving SMC transdifferentiation into pro-angiogenic ELCs.
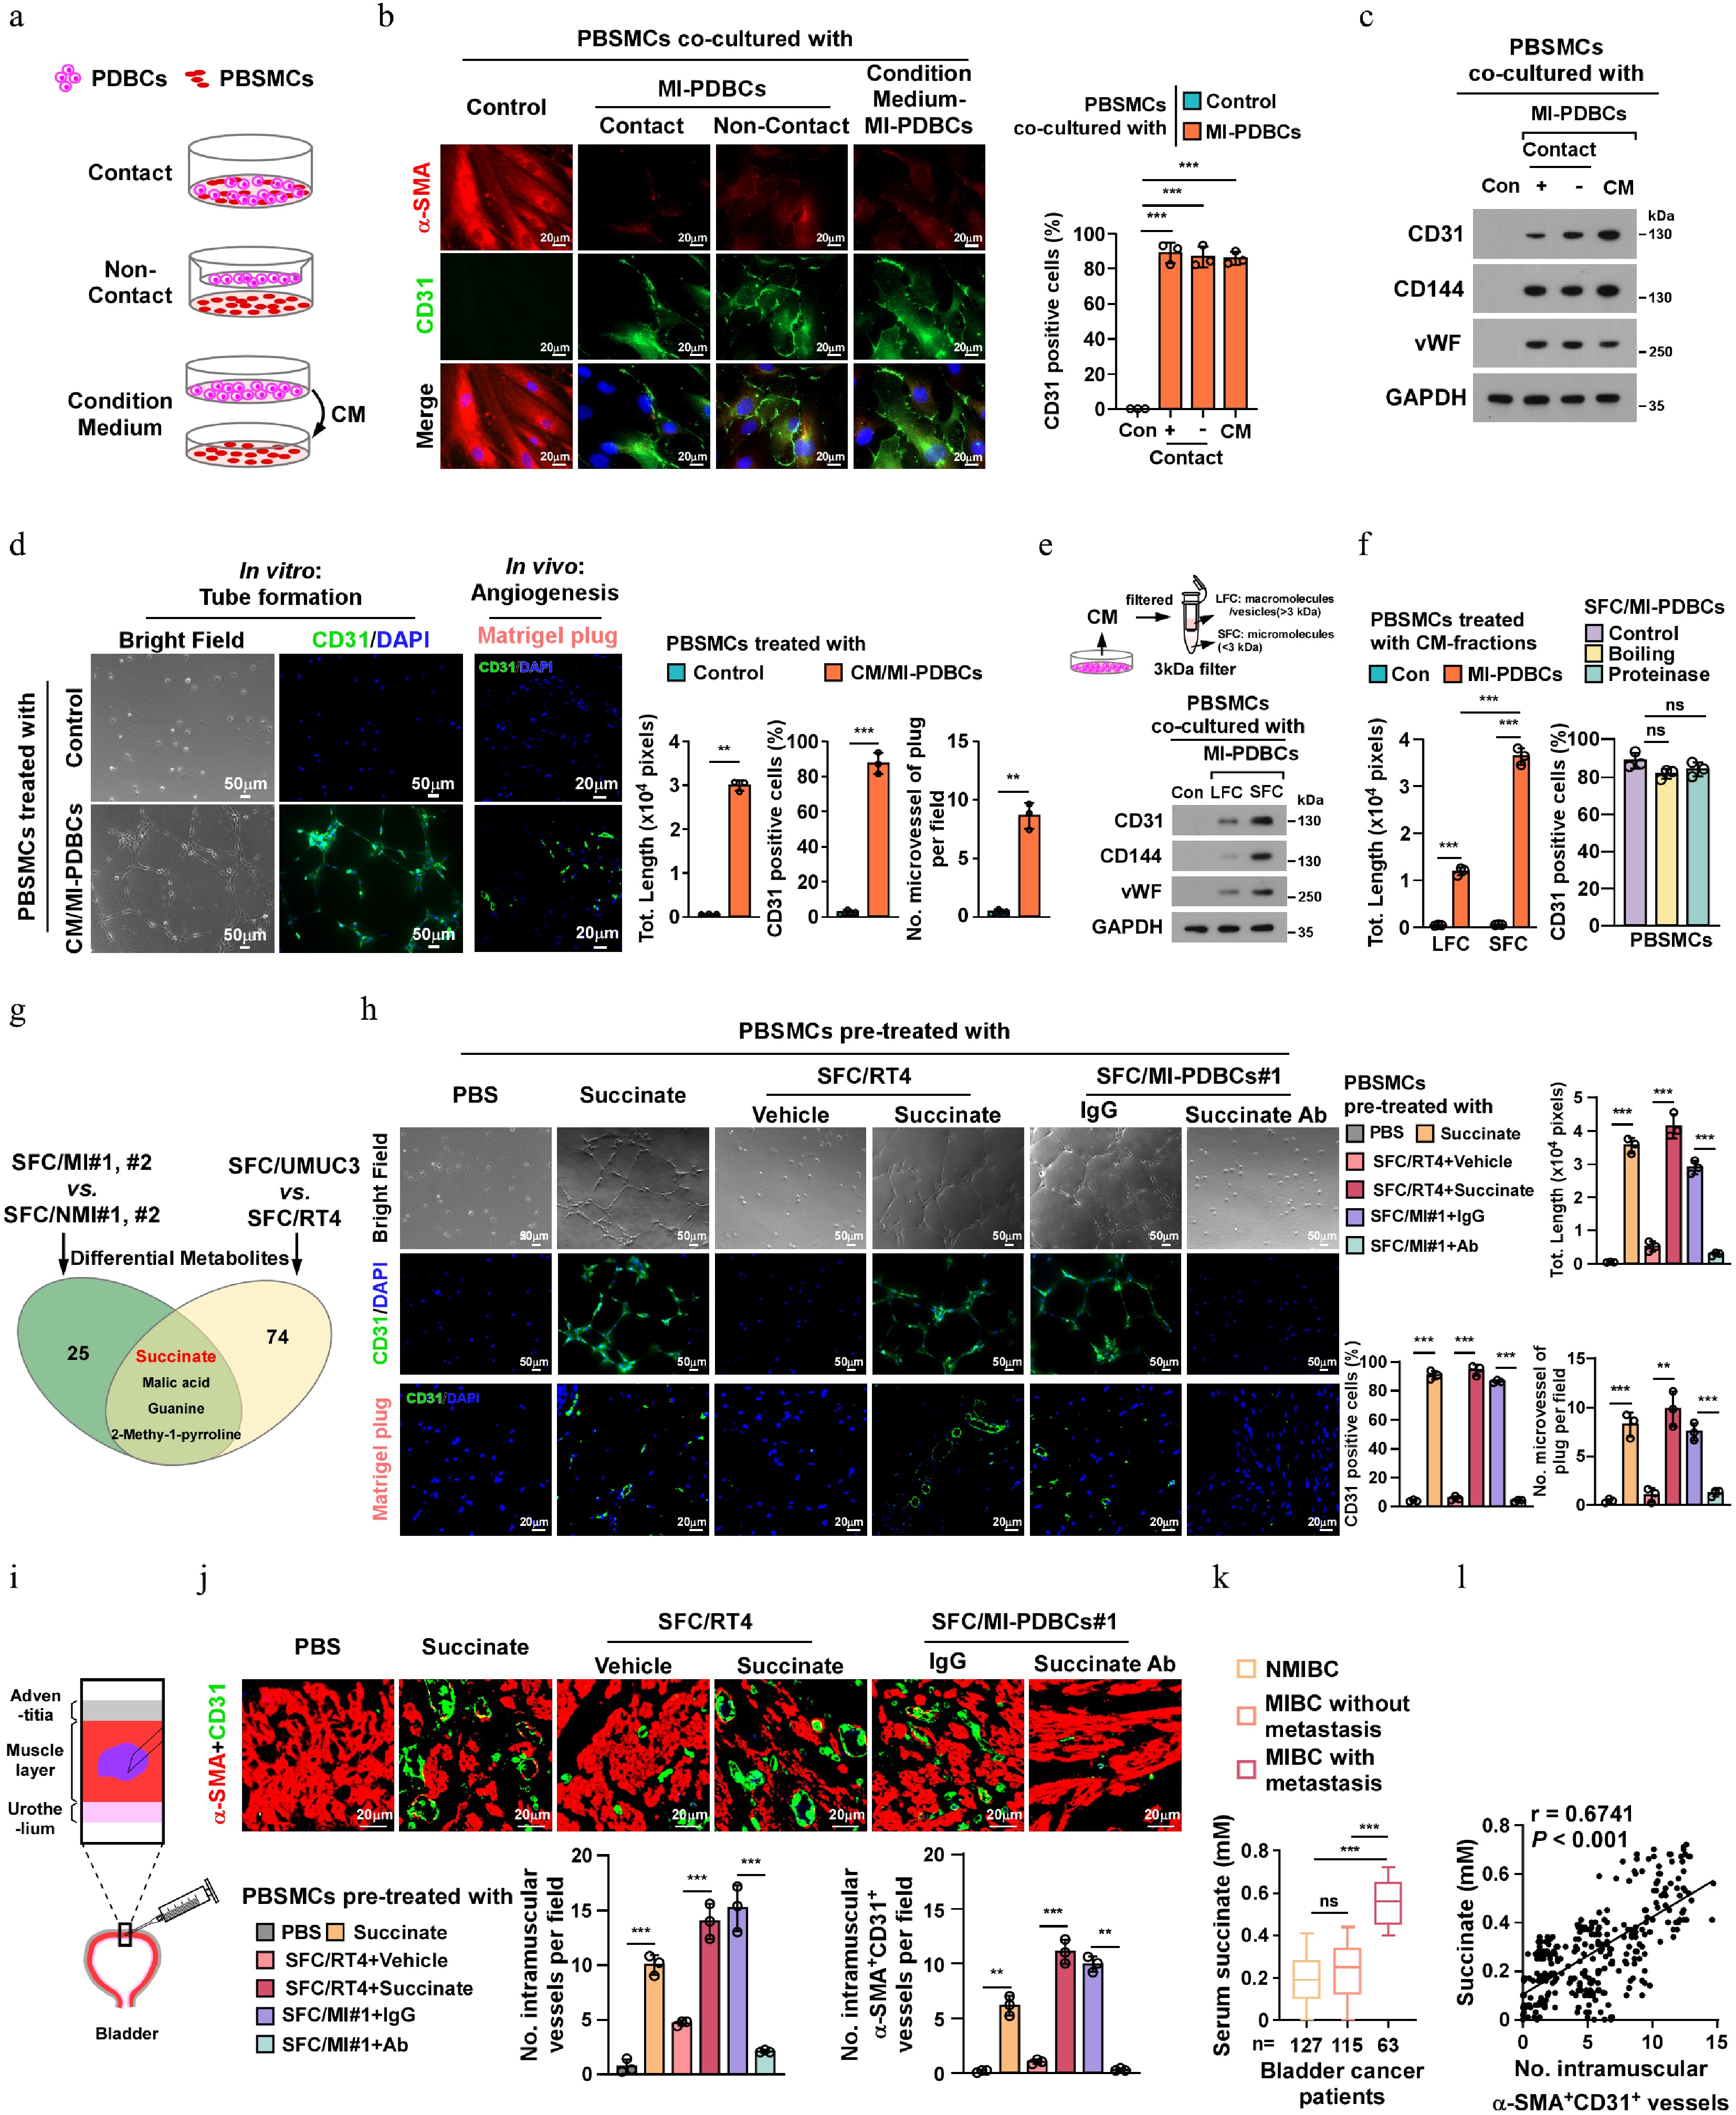
Figure 2.
MIBC-derived succinate induces SMCs transdifferentiation into ELCs. (a) Schematic diagram for contact and non-contact co-cultured model of primary human bladder smooth muscle cells (PBSMCs) with PDBCs, or treatment with conditioned medium (CM) derived from PDBCs in PBSMCs. (b) Representative immunofluorescence (IF) staining images, and (c) protein expression of endothelial signature in PBSMCs co-cultured with the indicated MI/PDBCs or CM-MI/PDBCs. Scale bars, 20 µm. GAPDH served as a loading control. (d) In vitro tube formation assay was performed with PBSMCs pre-educated with CM from control or MI/PDBCs, followed by CD31-staining in the tube forming cells (Scale bars, 50 µm); and the angiogenesis capability of PBSMCs were quantified by in vivo Matrigel plug assay (Scale bars, 20 µm). (e) MI/PDBCs-CM were fractionated into SFC with micromolecular (< 3 kDa) and LFC with macromolecules (> 3 kDa). IB analysis of expression of endothelial specific marker in PBSMCs co-cultured with control or MIBC-derived SFC or LFC. GAPDH served as a loading control. (f) Left: in vitro tube formation capability of PBSMCs co-cultured with NMI-PDBCs- or MI-PDBCs-derived SFC or LFC. Right: quantification of CD31+ cells of PBSMCs co-cultured with protease- or boiling-pretreated MI/PDBCs-SFC. (g) The Venn diagram illustrates the overlap and distinct sets of differentially abundant metabolites in MI-PDBCs#1,#2-SFC vs NMI-PDBCs#1,#2-SFC or UMUC3-SFC vs RT4-SFC. (h) In vitro tube formation assay and further IF staining (the top two panels; Scale bars, 50 µm), and in vivo Matrigel plug assays (the bottom panel; Scale bars, 20 µm) were performed in PBSMCs with the indicated treatments. (i) Schematic of intramuscular injection in mouse bladder detrusor muscle. (j) Representative IF images (upper; Scale bars, 20 µm), and quantification of intramuscular CD31+ or α-SMA+/CD31+ vessels (bottom) in mice following intramuscular injections of PBSMCs pre-educated with succinate, SFC/RT4, SFC/MI-PDBCs#1 accompanied with anti-succinate antibody or control IgG treatment, respectively. (k) Serum succinate level in NMIBC patients (n = 127), and MIBC patients with (n = 115) or without (n = 63) metastasis. (l) The serum succinate level was linearly correlated with intramuscular α-SMA+/CD31+ vessels in bladder cancer patients. Each error bar in (b), (d), (f), (h), and (j) represent the mean ± SD of three independent experiments. Statistical analysis was performed using two-way ANOVA with Šídák's multiple comparisons test for (b), (f), (h), and (j), unpaired two-tailed t tests for (d), one-way ANOVA with Dunnett's multiple comparison tests for (f) and (k), and Spearman's correlation for (l). ** p < 0.01; *** p < 0.001; ns, not significant.
MIBC-derived succinate induces SMCs transdifferentiation into ELCs
-
To identify critical factor(s) mediating SMCs-to-ELCs transdifferentiation, we subjected CM from MI-PDBCs to size-exclusion fractionation and examined their effects on PBSMCs transdifferentiation. As shown in Fig. 2e, f; Supplementary Fig. S2d, treatment with the small fraction component (SFC: micromolecules fraction, < 3 kDa) obviously upregulated endothelial markers and enhanced tube formation in PBSMCs, whereas the large fraction component (LFC: protein-peptide fraction, > 3 kDa) showed minimal effects. Boiling or proteinase treatment of SFC did not abolish its inductive activity (Fig. 2f), suggesting non-proteinaceous components mediate this process. To this end, we employed a liquid chromatograph/mass spectrometer (LC/MS) and detected four dysregulated metabolites: succinate, malic acid, guanine, and 2-Methyl-1-pyrroline. Strikingly, only succinate level exhibited a pronounced accumulation in both SFC/MI-PDBCs and the MIBC cell line UMUC3 cells relative to their respective controls (SFC/NMI-PDBCs and the NMIBC cell line RT4 cells) (Fig. 2g). Consistently, the production of succinate in CM from MIBC cell lines and MI-PDBCs was significantly higher than that in the NMIBC cell line RT4 and NMI-PDBCs (Supplementary Fig. S2b, S2c).
To ascertain whether succinate was responsible for SMCs-to-ELCs transdifferentiation, the effect of exogenous succinate on the phenotypic and functional reprogramming in PBSMCs was evaluated. We found that treatment with either exogenous succinate or SFC/MI-PDBCs#1 drastically induced morphological alterations, upregulated endothelial markers (CD31, CD144, vWF), and enhanced the tube-forming and angiogenic capability of PBSMCs (Fig. 2h; Supplementary Fig. S2d, S2e). Importantly, using an in vivo intramuscular injection model showed that pre-treatment with either exogenous succinate or SFC/MI-PDBCs#1 resulted in a drastic increase in intramural vessel density in the bladder muscularis of mice (Fig. 2i, j) Crucially, the succinate-neutralizing antibody abolished these pro-angiogenic effects (Fig. 2h−j; Supplementary Fig. S2e). These results confirm that MIBC-secreted succinate is necessary and sufficient for SMCs endothelial reprogramming.
Moreover, we found that the serum succinate levels were markedly elevated in metastatic MIBC patients (n = 63) compared to NMIBC patients (n = 127) and non-metastatic MIBC patients (n = 115). Notably, the serum succinate levels were positively associated with high MVD in MIBC specimens (Fig. 2k; Supplementary Fig. S2f). These results establish clinical-pathological relevance between succinate elevation and SMCs-to-ELCs transdifferentiation in bladder cancer progression.
Succinate induces the dedifferentiation of SMCs via SUCNR1 signaling
-
To elucidate the mechanism underlying succinate-induced SMCs-to-ELCs transdifferentiation, we systematically evaluated the temporal changes in SMCs- and endothelial-specific gene expression during the transdifferentiation process (Fig. 3a). Treatment with SFC/MI-PDBCs#1 or succinate induced a progressive reduction of SMCs-specific markers (α-SMA, SM22α, and calponin), with expression levels halved by day 8 and continuing to decline thereafter (Fig. 3b; Supplementary Fig. S3a). Notably, endothelial genes (CD31, CD144, vWF, and eNOS) exhibited delayed upregulation, becoming markedly elevated on day 12 and further increasing with prolonged treatment (Fig. 3b; Supplementary Fig. S3a). Given that SMCs differentiation is maintained by serum response factor (SRF)-dependent transcriptional activation of SM genes[33], while SMCs dedifferentiation is epigenetically regulated by transcriptional factor KLF4 and p-Elk1 via suppression of SMCs marker genes[34], we analyzed transcription factor dynamics. Chromatin immunoprecipitation (ChIP) assays revealed that succinate or SFC/MI-PDBCs treatment from day 4 onward significantly enhanced KLF4 and p-Elk1 enrichment but drastically reduced SRF occupancy at the promoters of α-SMA and SM22α (Fig. 3c). These results demonstrate that succinate initiates SMCs dedifferentiation during early reprogramming stages.
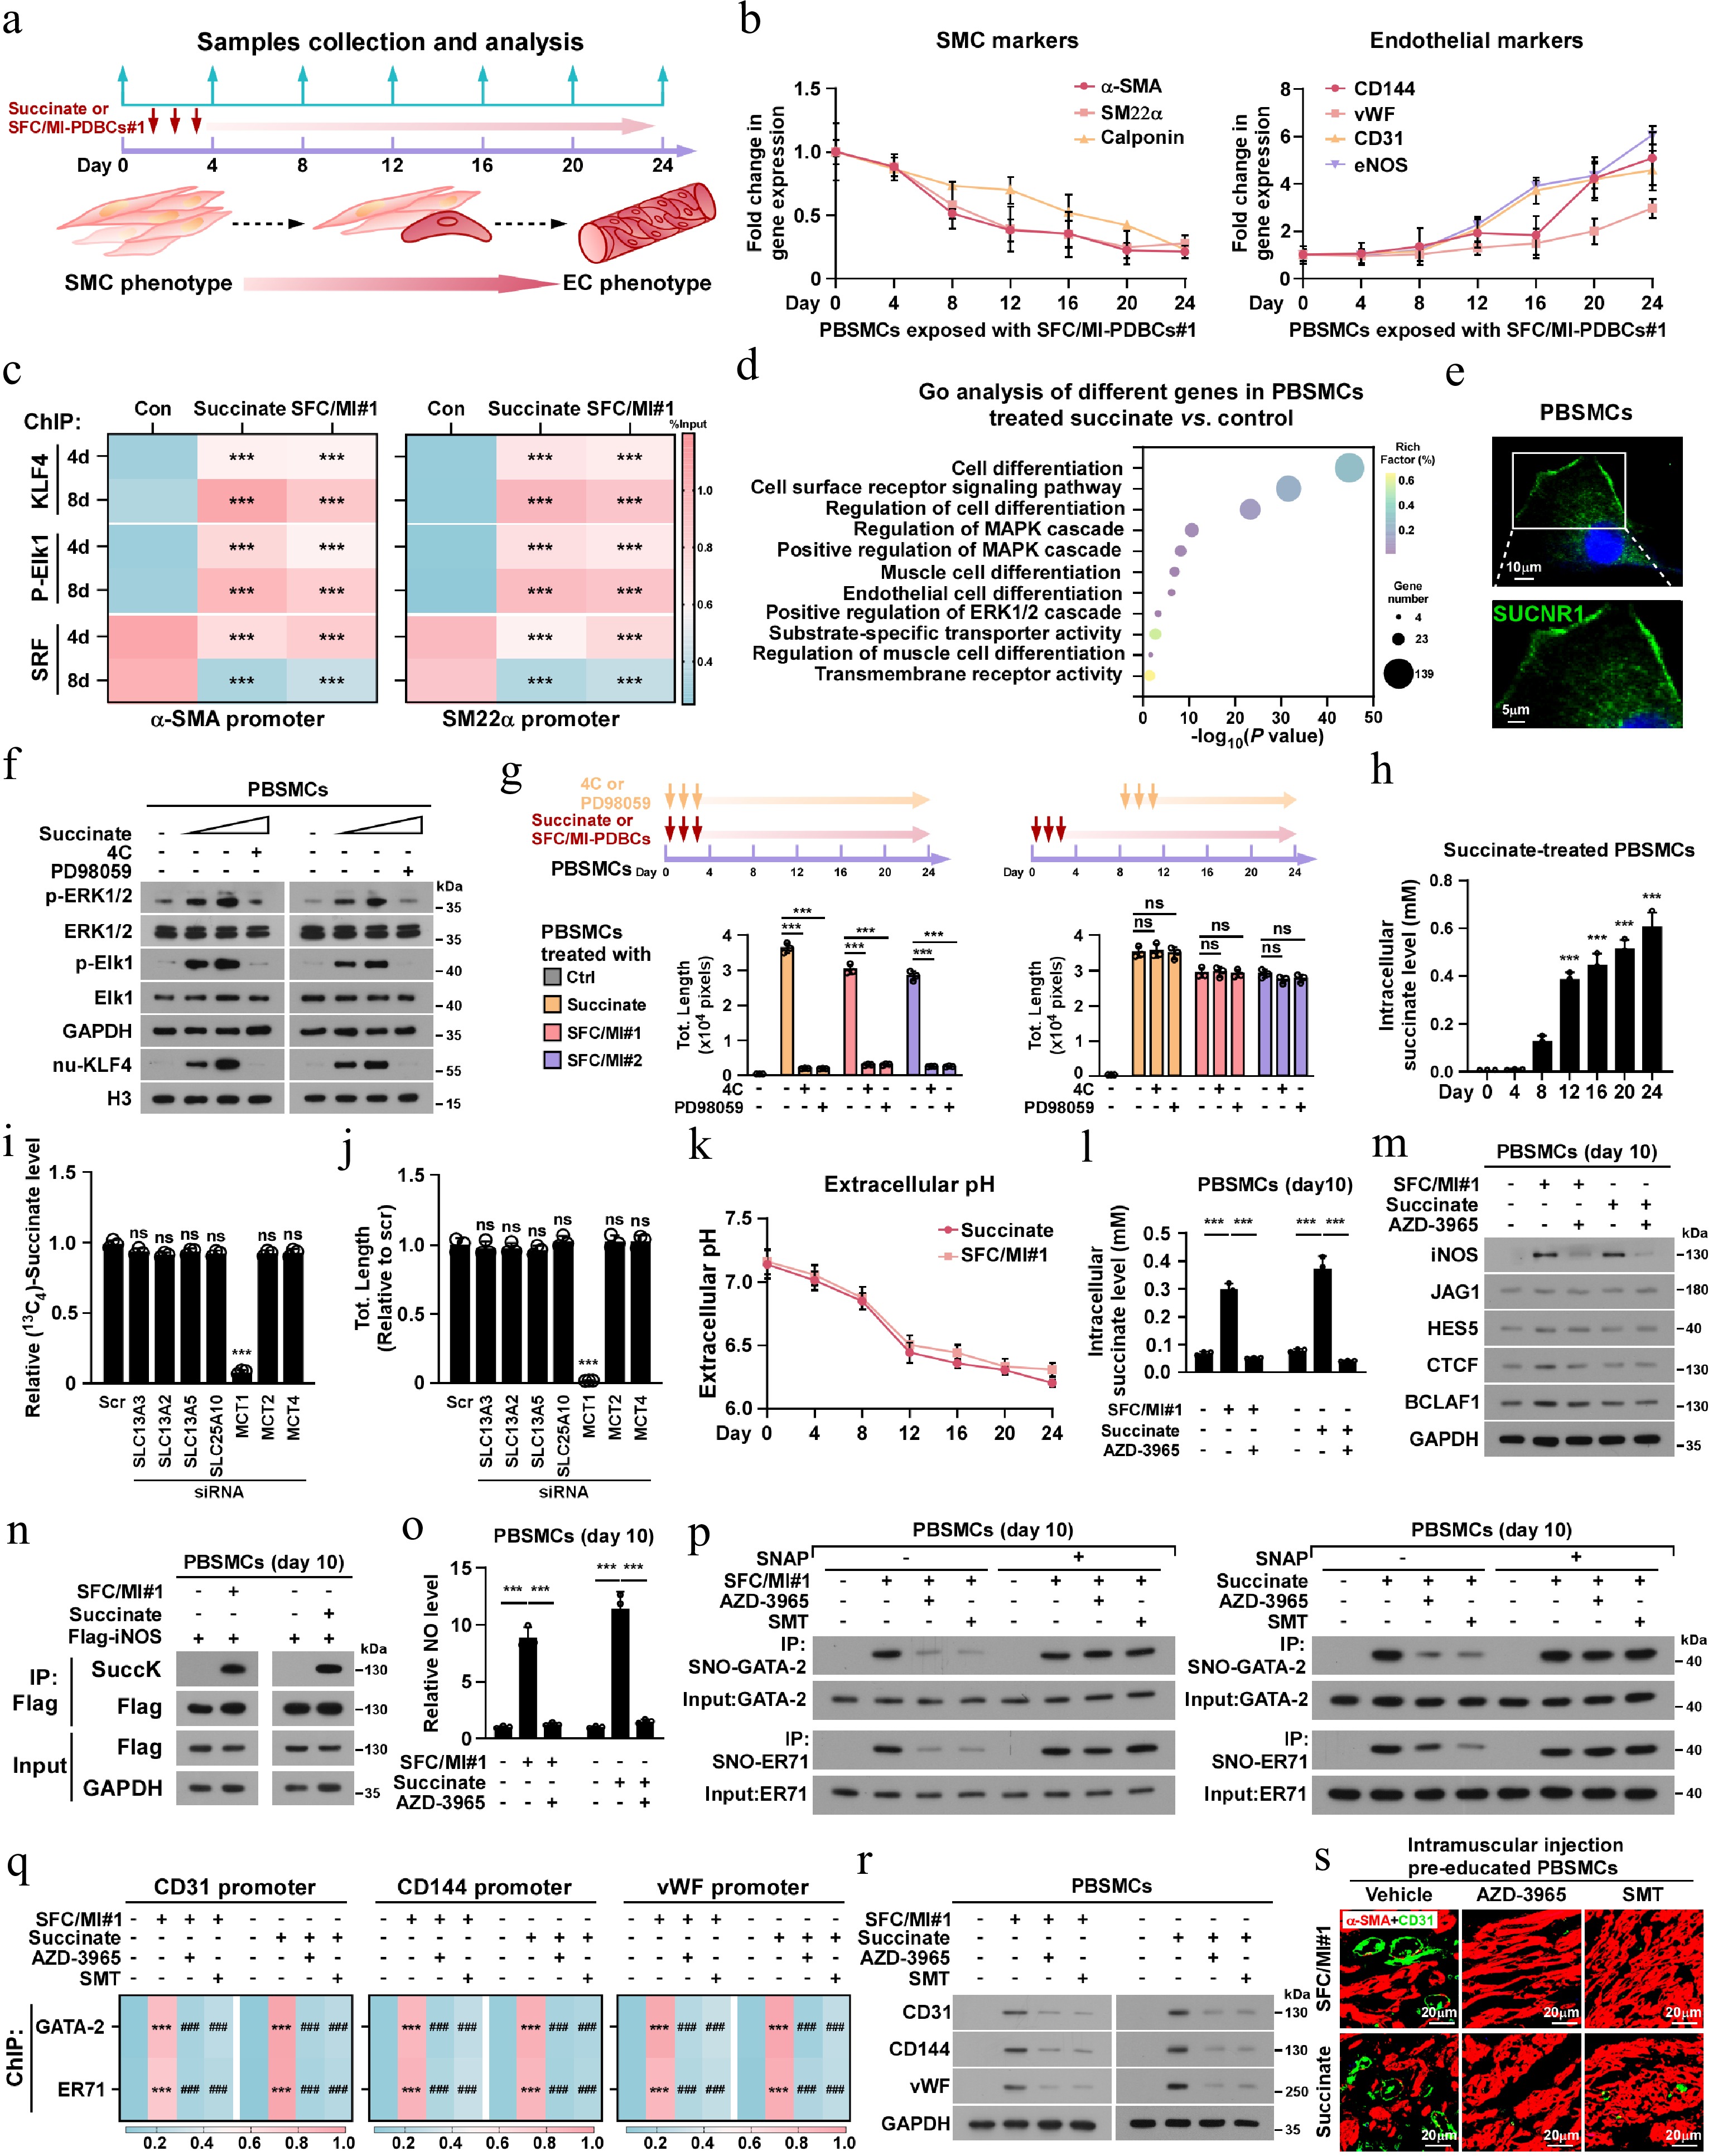
Figure 3.
Succinate induces dedifferentiation programme and endothelialization in SMCs. (a) Schematic diagram illustrating the experimental workflow for supplementation of succinate and SFC/MI-PDBCs#1 in PBSMCs-to-ELCs transdifferentiation model. (b) The mRNA expression of SMCs marker (α-SMA, SM22α, Calponin) and endothelial marker (CD144, vWF, CD31, eNOS) in the indicated times after SFC/MI-PDBCs#1 treatment. GAPDH served as the internal control. (c) ChIP assay analysis of KLF4, p-Elk1 and SRF enrichment on the α-SMA or SM22α promoter followed by SFC/MI-PDBCs#1 and succinate treatment, respectively. (d) Gene ontology (GO) enrichment analysis of dysregulated genes identified in 0.5 mM succinate- or control- treated PBSMCs on day 8. (e) Representative IF images of SUCNR1 in PBSMCs. Scale bars, 20 µm. (f) IB analysis of p-ERK1/2, ERK1/2, p-Elk1, Elk1, and KLF4 in PBSMCs following 8-d pharmacological intervention with succinate (0.5 mM), or SUCNR1 antagonist 4C (5 μM) or MAPK/ERK inhibitor PD98059 (10 μM). GAPDH served as the loading control and Histone H3 served as the nuclear loading control. (g) In vitro tube formation assays were performed in PBSMCs with the indicated treatments. (h) The intracellular succinate level in the indicated times after succinate treatments. (i) 13C4-succinate uptake, and (j) in vitro tube formation capability was monitored in PBSMCs transduced with the indicated siRNAs, respectively. (k) The extracellular pH was measured in the indicated times after succinate or SFC/MI-PDBCs#1 treatment. (l) Intracellular succinate level, and (m) IB analysis of expression of iNOS, JAG1, HES5, CTCF, and BCLAF1 was measured in PBSMCs (pretreated with succinate for 10 d) following treatment with control, succinate (0.5 mM) or SFC/MI-PDBCs#1, in the presence or absence of the MCT1 inhibitor AZD-3965 (10 μM). GAPDH served as the loading control. (n) Co-IP/IB analysis of succinylated-iNOS in the cells treated with SFC/MI-PDBCs#1 or succinate. (o) Left: the NO level in the PBSMCs (pretreated with succinate for 10 d) following treatment with succinate (0.5 mM) or SFC/MI-PDBCs#1, with or without MCT1 inhibitor AZD-3965 (10 μM). (p) Co-IP/IB analysis of S-nitrosylated-GATA-2, and -ER71 in the indicated cells. (q) ChIP assay analysis of GATA-2 and ER71 enrichment on the CD31, or CD144, or vWF promoter followed by the indicated treatment. *** p < 0.001 for vs control, ### p < 0.001 for vs SFC/MI#1 or succinate group. (r) IB analysis of expression of CD31, CD144, and vWF in the PBSMCs treated with control, succinate, or SFC/MI-PDBCs#1, with or without MCT1 inhibitor AZD-3965 or iNOS inhibitor SMT. (s) Representative IF images of intramuscular α-SMA+/CD31+ vessels in the mice intramuscularly injected with pre-educated PBSMCs. Scale bars, 20 µm. Each error bar in (b), (h), (i), (j), (k), and (o) represent the mean ± SD of three independent experiments. Statistical analysis was performed using two-way ANOVA with Šídák's multiple comparisons test for (c), (g), and (q), and one-way ANOVA with Dunnett's multiple comparison tests for (h), (i), (k), and (o). ** p < 0.01; *** p < 0.001; ns, not significant.
To identify the key regulators contributing to succinate-induced SMCs dedifferentiation, RNA sequencing (RNA-seq) analysis was performed. Gene Ontology (GO) analysis revealed significant enrichment of cell differentiation and regulation of SMCs differentiation signaling pathways in succinate-treated SMCs. Specifically, GO terms such as 'regulation of MAPK cascade', 'positive regulation of MAPK cascade', 'positive regulation of ERK1 and ERK2 cascade' and 'cell surface receptor signaling pathway', were also prominently enriched (Fig. 3d). Given that SUCNR1 is the cell surface receptor for succinate, we hypothesized that it acts as the key mediator in this context. Consistent with GO analysis, pharmacological inhibition of SUCNR1 (using antagonist 4C) or MAPK/ERK signaling (via PD98059) effectively abolished succinate-induced phosphorylation of ERK1/2 and Elk1, reduced nuclear KLF4 accumulation, and attenuated PBSMCs tube-forming capacity (Fig. 3e−g; Supplementary Fig. S3b). Therefore, these results suggest that the initial phase of succinate-induced SMC dedifferentiation is primarily mediated through the SUCNR1/MAPK pathway.
Succinate uptake promotes endothelial differentiation via iNOS succinylation
-
Although the combination therapy of SUCNR1 antagonist 4C or PD98059 completely eliminated the inductive effect of succinate or SFC/MI-PDBCs on PBSMCs tube formation, adding 4C or PD98059 after 8 d of succinate treatment failed to abrogate the effect of succinate-induced tube formation of PBSMCs (Fig. 3g). These results indicated that while SUCNR1/MAPK signaling is essential for initiating dedifferentiation, the subsequent conversion of these primed cells into ELCs operates through a SUCNR1/MAPK-independent mechanism. This led us to hypothesize that once the initial identity is lost, the second stage of endothelial commitment may instead require the direct cellular uptake and metabolic utilization of extracellular succinate. Given that extracellular succinate can be taken up and utilized in diverse biological processes[35−37], we examined whether SMCs uptake extracellular succinate from the surrounding environment. As shown in Fig. 3h, intracellular 13C4-succinate levels in SMCs progressively increase by day 12. However, only silencing succinate transporter MCT1, but not SLC13A3, SLC13A2, SLC13A5, SLC25A10, MCT2 and MCT4, significantly inhibited the 13C4-Succinate uptake in SMCs, demonstrating MCT1 as the primary succinate transporter in this context (Fig. 3i; Supplementary Fig. S3c). Importantly, silencing MCT1 also abolished succinate-induced SMCs tube formation (Supplementary Fig. S3d). Taken together, these results suggest that succinate uptake drives conversion of dedifferentiated SMCs to ELCs.
Previous studies have reported that MCT1-mediated succinate transport occurs in a pH-dependent manner, whereby succinate uptake is stimulated by decreased extracellular pH[35,38]. Intriguingly, we observed a progressive decline in the culture medium pH of SMCs, reaching 6.8 by day 8, and 6.5 by day 12 (Fig. 3j), paralleling the temporal pattern of succinate uptake shown in Fig. 3h. Consistently, silencing MCT1 or treating cells with an MCT1 inhibitor AZD3965 suppressed the 13C4-succinate uptake even under low extracellular pH conditions (Fig. 3k; Supplementary Fig. S3d). These results indicate that MCT1-mediated succinate uptake, driven by extracellular acidification, contributes to the late-stage transdifferentiation of SMCs.
We further investigated the mechanism underlying succinate-induced transformation of dedifferentiated SMCs into ELCs. As shown in Fig. 3l, treatment with succinate or SFC/MI-PDBCs drastically upregulated the expression of transdifferentiation-related factor iNOS protein, but not JAG1, HES5, CTCF and BCLAF1[39−42]. However, the succinate- or SFC/MI-PDBCs-induced iNOS upregulation was abolished by AZD-3965 treatment. Since no change in iNOS mRNA level was observed in succinate- or SFC/MI-PDBCs-treated PBSMCs (Supplementary Fig. S3e), suggesting that succinate-induced iNOS protein might be via a post-transcriptional mechanism.
Interestingly, we found that the succinylated-iNOS level was dramatically increased in succinate- or SFC/MI-PDBCs-treated SMCs, which was abrogated by MCT1 silencing (Fig. 3m; Supplementary Fig. S3f). Analysis using the GPSuc Online server (
http://kurata14.bio.kyutech.ac.jp/GPSuc/index.php ) predicted four putative succinylation sites, including K22, K505, K516 and K613 in iNOS. However, only the K22 mutant blocked succinate- or SFC/MI-PDBCs-induced succinylated-iNOS (Supplementary Fig. S3g), suggesting that the K22 residue was the succinylation site for iNOS. Meanwhile, we found that the succinate treatment dramatically reduced the half-life but increased the K48-linked polyubiquitinated level of iNOS/K22R protein (Supplementary Fig. S3g−S3i). These results suggest that succinylation of K22 in iNOS contributes to iNOS stability. The iNOS-NO axis-induced S-nitrosylation of posttranslational protein modification is involved in modulating transcriptional activity, enzymatic activity, and protein subcellular localization[43−46]. Consistently, we found that succinate or SFC/MI-PDBCs treatment drastically increased nitric oxide (NO) production, and the S-nitrosylation level of key endothelial-specific transcriptional factors GATA-2 and ER71, as well as the enrichment of GATA-2 and ER71 on promoter of endothelial markers in SMCs (Fig. 3n−p). Although MCT1 inhibitor AZD-3965 or iNOS inhibitor SMT treatment reversed these effects (Fig. 3n, o), S-nitrosylation of GATA-2 and ER71 in SMCs was restored with NO replenishment via S-Nitroso-N-acetylpenicillamine (SNAP) (Fig. 3o, p). This suggested that succinate uptake induced iNOS upregulation and NO production, which in turn enhanced the transcriptional activity of endothelial-specific factors (Fig. 3q). Importantly, an in vivo intramuscular injection mouse model revealed that the succinate-induced vessel density within muscularis was drastically abolished by AZD-3965 or an iNOS inhibitor SMT pre-education (Fig. 3r). Taken together, these results indicate that succinate drives the transdifferentiation of SMCs to ELCs through a sequential mechanism: it first initiates dedifferentiation via SUCNR1 signaling, and subsequently promotes endothelial differentiation via metabolic uptake and iNOS stabilization.Reverse SDH activity drives succinate accumulation by the reduction of fumarate
-
Succinate is a key intermediate in the tricarboxylic acid (TCA) cycle and can be produced from a broad range of carbon sources, such as glucose, fatty acids, glutamate, and aspartate under different conditions and by various mechanisms (Fig. 4a)[47−50]. To assess the contribution of these carbon sources to the build-up of succinate, we performed an array of 13C-isotopologue labeling experiments. In MI-PDBCs-formed tumors, 13C-aspartate was the only 13C-carbon donor that exhibited a markedly higher incorporation into succinate, whereas 13C-glucose, 13C-palmitate, and 13C-glutamine did not contribute to succinate accumulation (Fig. 4b). Aspartate contributes to the fumarate pool via the malate-aspartate shuttle (MAS) and the purine nucleotide cycle (PNC), leading to the production of succinate through fumarate reduction by the reversal of succinate dehydrogenase (SDH) activity[51−53] (Fig. 4c; Supplementary Fig. S4a). Intriguingly, treatment with dimethyl malonate, a membrane-permeable precursor of the SDH competitive inhibitor, significantly reduced the succinate accumulation in MI-PDBCs. These results suggest that SDH reversal plays a vital role in succinate accumulation in MIBC, as conventional inhibition of SDH would increase succinate levels (Fig. 4d).
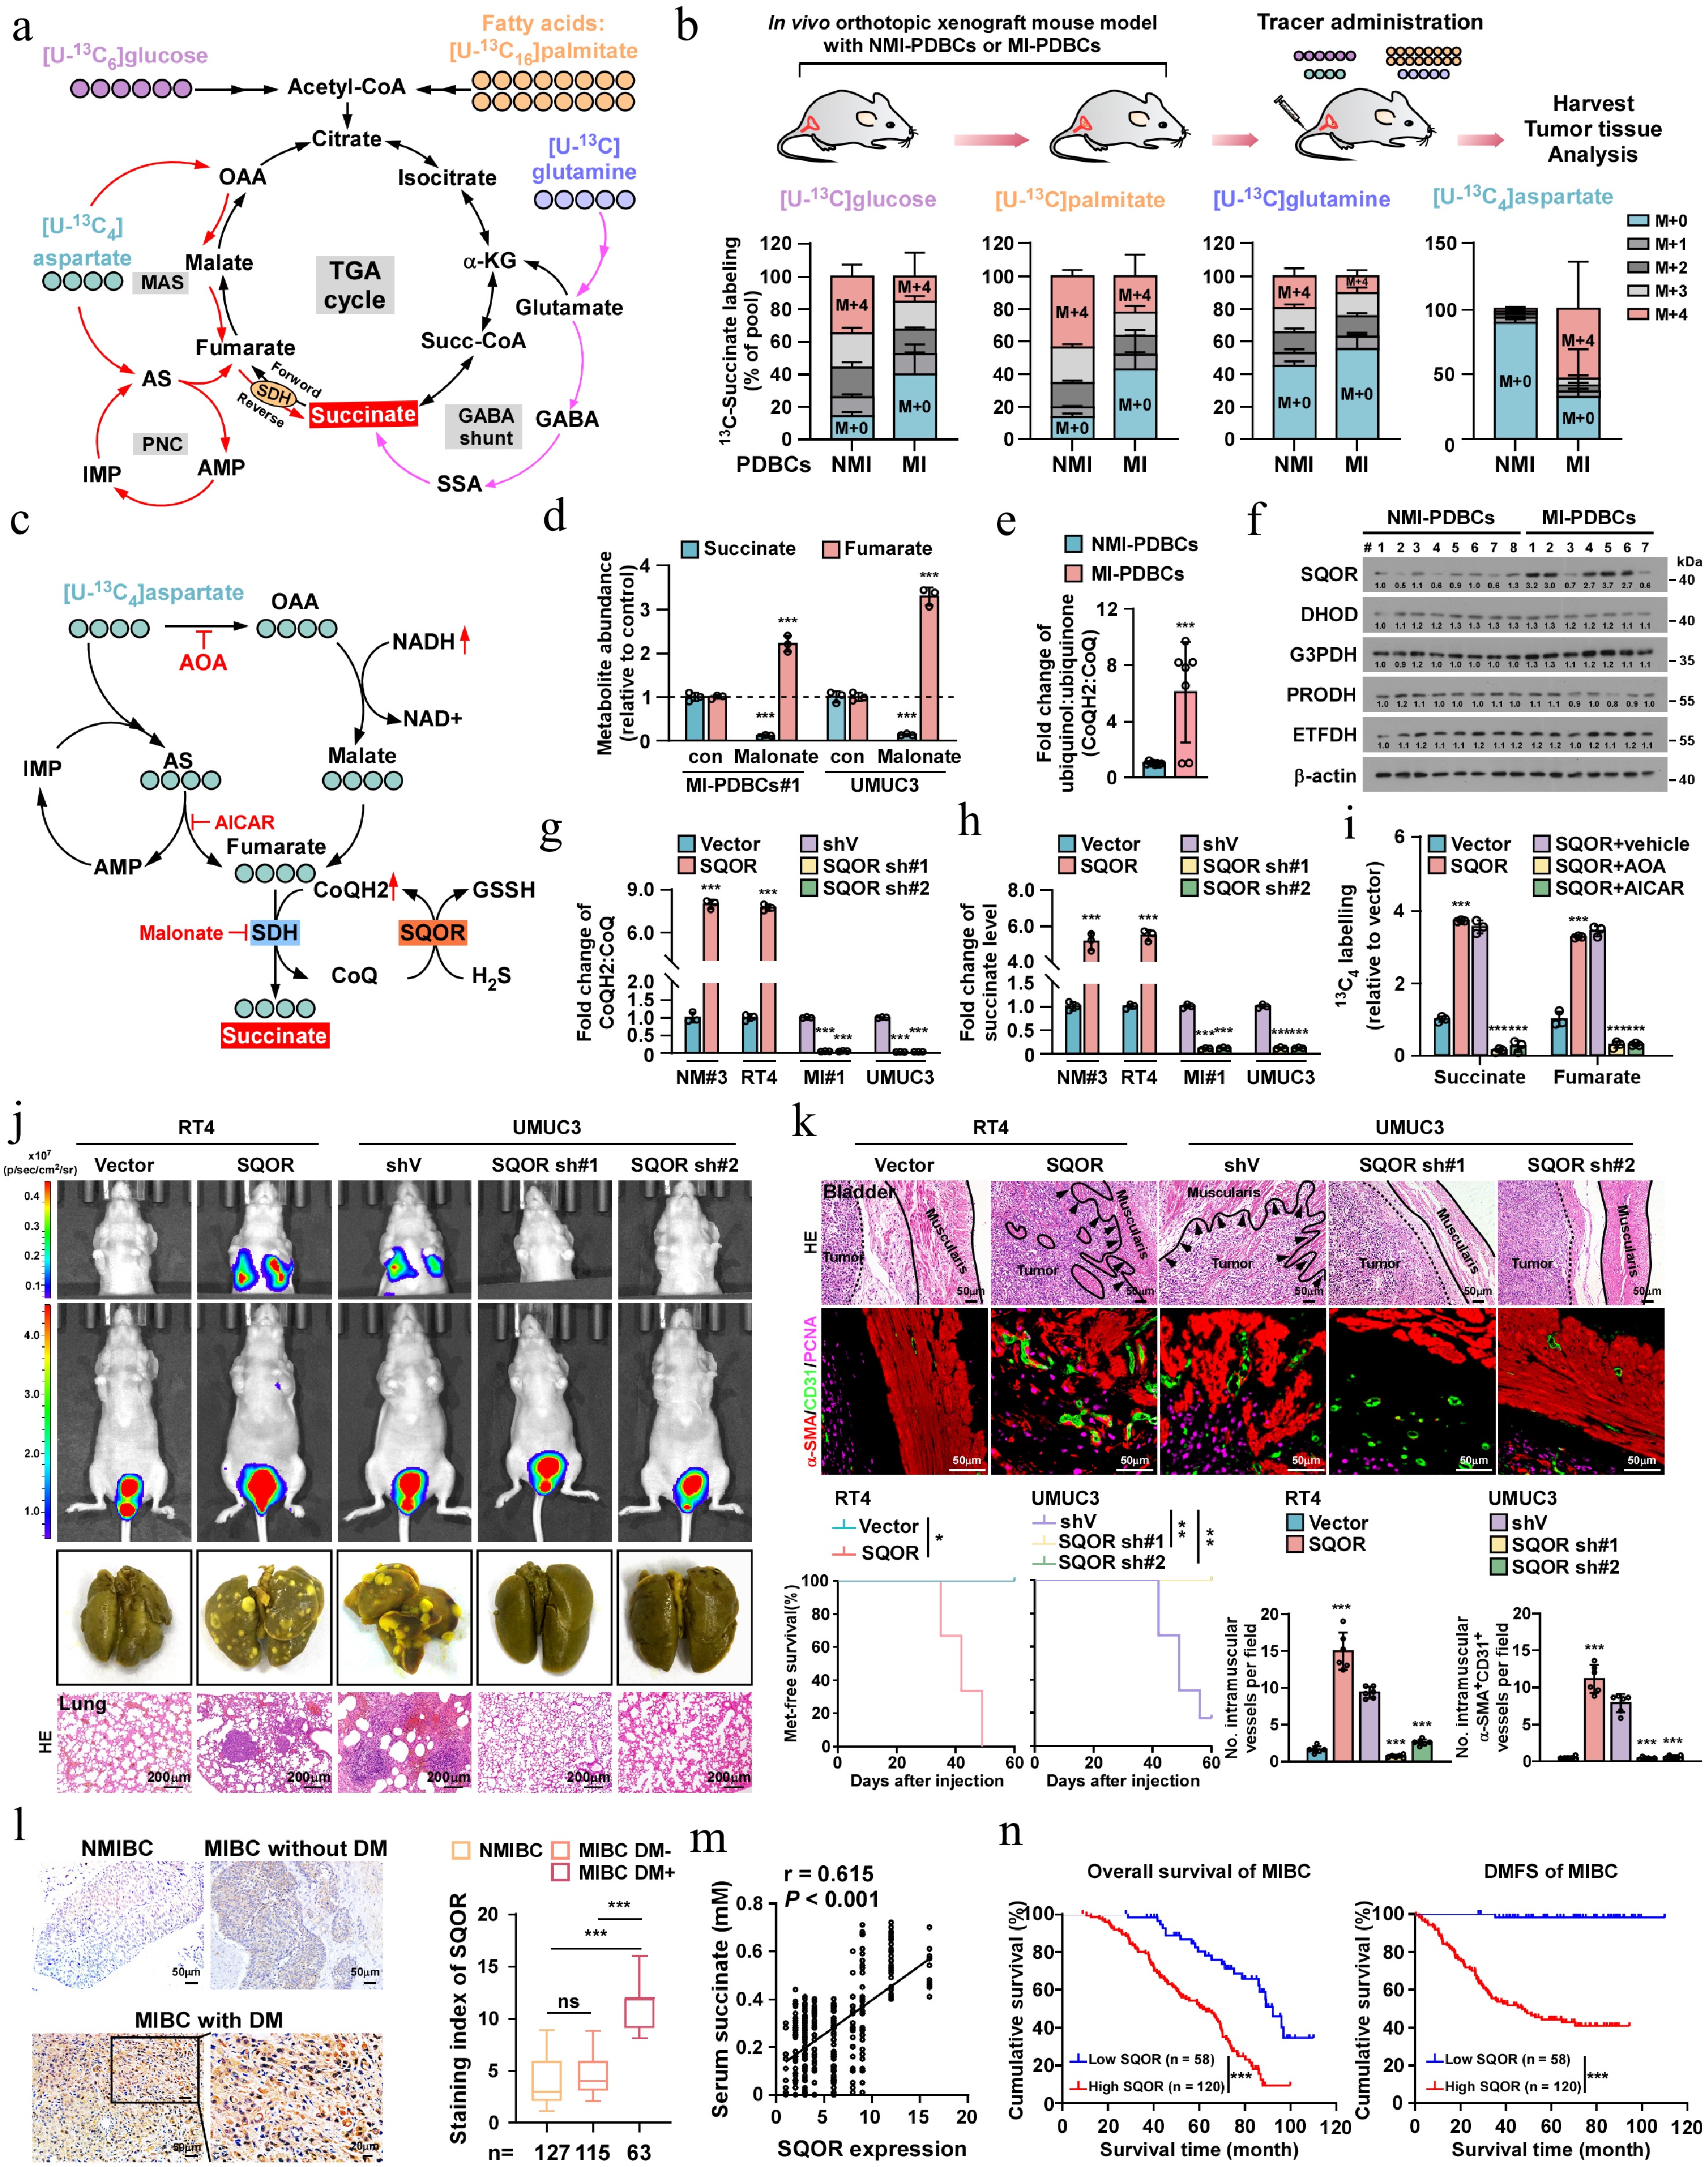
Figure 4.
SQOR-mediated SDH reversal induces succinate accumulation and SMCs-to-ELCs transdifferentiation. (a) Scheme illustrating the possible mechanism for succinate production: from α-ketoglutarate produced by the TCA cycle, derived from glycolysis, fatty acid oxidation, and glutaminolysis (black lines), from GABA shunt (purple lines), and from fumarate produced from the malate-aspartate shuttle (MAS) and purine nucleotide cycle (PNC) via the reversal of SDH (red lines). 13C-metabolite labeling strategy was employed to measure the contribution of these carbon sources to the build-up of succinate. (b) 13C-isotopologue profiles of succinate (M + 0 to M + 4 denoting the number of 13C-labeled carbons per molecule) in tumors formed by NMI-PDBCs (n = 8) or MI-PDBCs (n = 7) following infusion of 13C-labeled glucose, palmitate, glutamine, and aspartate. (c) Scheme illustrating the fumarate production from aspartate in MAS and PNC pathway, and succinate accumulation from fumarate reduction via a reductive shift in the CoQH2/CoQ pools induced by SQOR. AOA, aminooxyacetate; AS, adenylosuccinate; IMP, inosine5'-monophosphate; OAA, oxaloacetate. (d) Effect of SDH inhibition by dimethyl malonate on succinate and fumarate production. (e) The relative ubiquinol/ubiquinone (CoQH2/CoQ) ratio (group) in MI-PDBCs (n = 7) compared with NMI-PDBCs (n = 8). (f) IB analysis of expression of SQOR, DHOD, G3PDH, PRODH, ETFDH in the indicated cells. β-actin served as the loading control. (g) The relative CoQH2/CoQ ratio, and (h) succinate concentration in the indicated cells. (i) The relative incorporation of 13C-aspartate to the succinate and fumarate in SQOR-overexpressed cells (compared with the vector group); and effect on that abundance in the SQOR-overexpressed cells that blocking aspartate entry into the TCA through aspartate aminotransferase inhibitor AOA, or blocking PNC by adenylosuccinate lyase inhibitor AICAR. (j) Representative bioluminescence images, picric staining and H&E staining of pulmonary metastatic nodules in the indicated mice bearing orthotopic bladder tumor. Scale bars, 200 µm. n = 6 mice/group. (k) Upper: representative H&E images of muscularis invasion, IF images, and quantification of intramuscular CD31+ or α-SMA+CD31+ vessels in the indicated mice. Bottom: Kaplan–Meier metastasis-free survival curves of mice from the indicated experimental group. n = 6 mice/group. (l) Representative images and quantification of SQOR expression in bladder cancer patients without muscle invasion (n = 127), and muscle-invasive bladder cancer with (n = 115) or without metastasis (n = 63). Scale bar, 50 µm. Scale bars insets, 20 μm. (m) The correlation between the SQOR expression and serum succinate levels in the clinical bladder cancer patients. (n) Kaplan–Meier curves analysis of survival in bladder cancer patients with low- (n = 58) or high-SQOR expression (n = 120). Each error bar in (b), (d), (e), (g), (h), and (i) represent the mean ± SD of three independent experiments. Statistical analysis was performed using one-way ANOVA with Dunnett's multiple comparison tests for (k) and (l), two-way ANOVA with Šídák's multiple comparisons test for (b), (d), (g), (h), and (i), unpaired two-tailed t tests for (e), Spearman's correlation for (m), and Kaplan–Meier analysis method for (k) and (n). * p < 0.05; ** p < 0.01; *** p < 0.001; ns, not significant.
To identify the candidates that could contribute to succinate production, we focused on the key enzymes among the MAS and PNC pathways or SDH reversal regulators[53−57]. Interestingly, analysis of public datasets revealed that mRNA expression of SQOR and malate dehydrogenase 2 (MDH2), but not malate dehydrogenase 1 (MDH1), Glutamic-oxaloacetic Transaminase 1/2 (GOT1/GOT2) and adenylosuccinate lyase (ADSL) was significantly elevated in MIBC and metastatic bladder cancer, and only upregulated SQOR was significantly correlated with overall survival (OS) and metastasis-free survival (MFS) of bladder cancer patients (Supplementary Fig. S4b, S4c). Moreover, SQOR catalyzes the mitochondrial sulfide oxidation pathway while concomitantly reducing ubiquinone (CoQ) to ubiquinol (CoQH2; the reduced CoQ), which could induce SDH reversal to deposit electrons on fumarate and reduce fumarate to succinate[51,53,58]. Consistently, we found that the CoQH2/CoQ ratio was significantly higher in MI-PDBCs than those in NMI-PDBCs (Fig. 4e). Interestingly, the expression of SQOR, but not other reported CoQ consumers such as, dihydroorotate dehydrogenase (DHOD), glycerol 3-phosphate dehydrogenase (G3PDH), proline dehydrogenase (PRODH), and electron transfer flavoprotein dehydrogenase (ETFDH)[59], was significantly increased at both transcriptional (Supplementary Fig. S4d) and translational levels (Fig. 4f) in MI-PDBCs compared with NMI-PDBCs. These results were further confirmed by analyses of the GSE13507 and GSE48276 public databases (Supplementary Fig. S4b).
Correspondingly, overexpressing SQOR significantly increased, but silencing SQOR decreased, the CoQH2/CoQ ratio and succinate levels (Fig. 4g, h). We then evaluate the contribution of aspartate to fumarate/succinate shuttle. As shown in Fig. 4i, infusion of 13C-labeled aspartate markedly elevated the 13C-succinate content in SQOR-overexpressed cells. However, either treatment with 5-amino-1-β-D-ribofuranosyl-imidazole-4-carboxamide (AICAR), an adenylosuccinate lyase inhibitor, or aminooxyacetate (AOA), an aminotransferase inhibitor, drastically abolished the inductive effect of SQOR overexpression on succinate accumulation. Therefore, these results indicate that SQOR-dependent overloaded CoQH2 pool drives SDH reversal, thereby leading to succinate elevation in MIBC.
Overexpression of SQOR promotes muscle invasion and metastasis of bladder cancer
-
Consistent with the inductive effect of SQOR on succinate elevation in MIBC, overexpressing SQOR dramatically enhances, whereas silencing SQOR suppresses the capability of SFC/MI-bladder cancer cells to promote SMCs transdifferentiation and angiogenesis (Supplementary Fig. S4e−S4g). Notably, treatment with anti-succinate or anti-SUCNR1 antibody abrogated the effect on SQOR overexpression-induced SMCs transdifferentiation (Supplementary Fig. S4h). Therefore, these results further demonstrate the vital role of SQOR/succinate signaling axis in MIBC-induced SMCs transdifferentiation.
The biological role of SQOR in inducing SMCs transdifferentiation and bladder cancer metastasis was further examined in vivo by stereotactically implanting engineered cancer cells into the bladder muscularis of mice. As shown in Supplementary Fig. S4i, inoculation of PBSMCs pre-educated with SFC from SQOR transduced-NMI-PDBCs#3 and -RT4 significantly increased the number of CD31+/α-SMA+ vessels within the bladder muscularis of mice. Conversely, silencing SQOR in MI-PDBCs#1 and UMUC3 abolished the pro-angiogenic capability of SFC/MI-PDBCs#1 and SFC/UMUC3. In the orthotopic xenograft model, the vector-control NMI-bladder cancer cells commonly formed oval-shaped tumors with well-defined margins, while the tumors formed by SQOR-transduced NMI-bladder cancer cells displayed highly invasive morphological features, including palisading borders and spike-like protrusions structures infiltrating adjacent muscle layers (Fig. 4j, k). Importantly, the mice bearing SQOR-overexpressing tumors exhibited more intramuscular CD31+/α-SMA+ vessels, higher lung metastasis incidence, and shorter metastasis-free survival. However, SQOR-silenced tumors significantly attenuated these metastatic phenotypes (Fig. 4j, k).
To establish the clinical relevance of SQOR in bladder cancer metastasis, IHC statistical analysis was performed and revealed that SQOR expression remained lower in NMIBC tissues and non-metastatic MIBC tissues but markedly higher in metastatic bladder cancer tissues (Fig. 4l). The elevated SQOR expression was positively associated with the serum level of succinate in patients with bladder cancer (Fig. 4m). Importantly, patients with high SQOR-expressing bladder cancer exhibited significantly shorter OS and DMFS compared to those with low SQOR expression (p < 0.001; p < 0.001; Fig. 4n). Therefore, these findings establish a critical clinical link between SQOR overexpression, succinate accumulation, and aggressive metastatic progression in bladder cancer.
TGFβ3/SMAD2 pathway promotes SQOR expression and SMCs transdifferentiation
-
To explore the mechanism underlying SQOR upregulation in MIBC, the CRISPR affinity purification in situ of regulatory elements (CAPTURE) approach following the mass spectrometry was employed to identify the trans-regulatory factors involved in SQOR regulation. As shown in Fig. 5a; Supplementary Table S4, 13 trans-regulatory factors, including SMAD2, ETV4, CARM1, HMGA2, FOSL1, JUN, NFIC, NFIB, SP100, NR3C1, CBL, SIRT1 and ATF7, were found to be significantly increased in the SQOR promoter in MI-PDBCs. Functional validation revealed that individually silencing SMAD2, ETV4, CARM1, but not HMGA2, FOSL1, JUN, NFIC, NFIB, SP100, NR3C1, CBL, SIRT1 and ATF7, significantly reduced SQOR expression in MI-PDBCs, UMUC3 and RT4 (Fig. 5b; Supplementary Fig. S5a). Furthermore, ChIP-qPCR assays demonstrated enhanced promoter occupancy of SMAD2, ETV4, CARM1 on SQOR promoter in MI-PDBCs and MI-bladder cancer cell lines compared to non-muscle-invasive counterparts (NMI-PDBCs and RT4 cells) (Fig. 5c). Therefore, these results suggest that SQOR transcriptional upregulation in MIBC involves a cooperative network of multiple trans-regulatory factors.
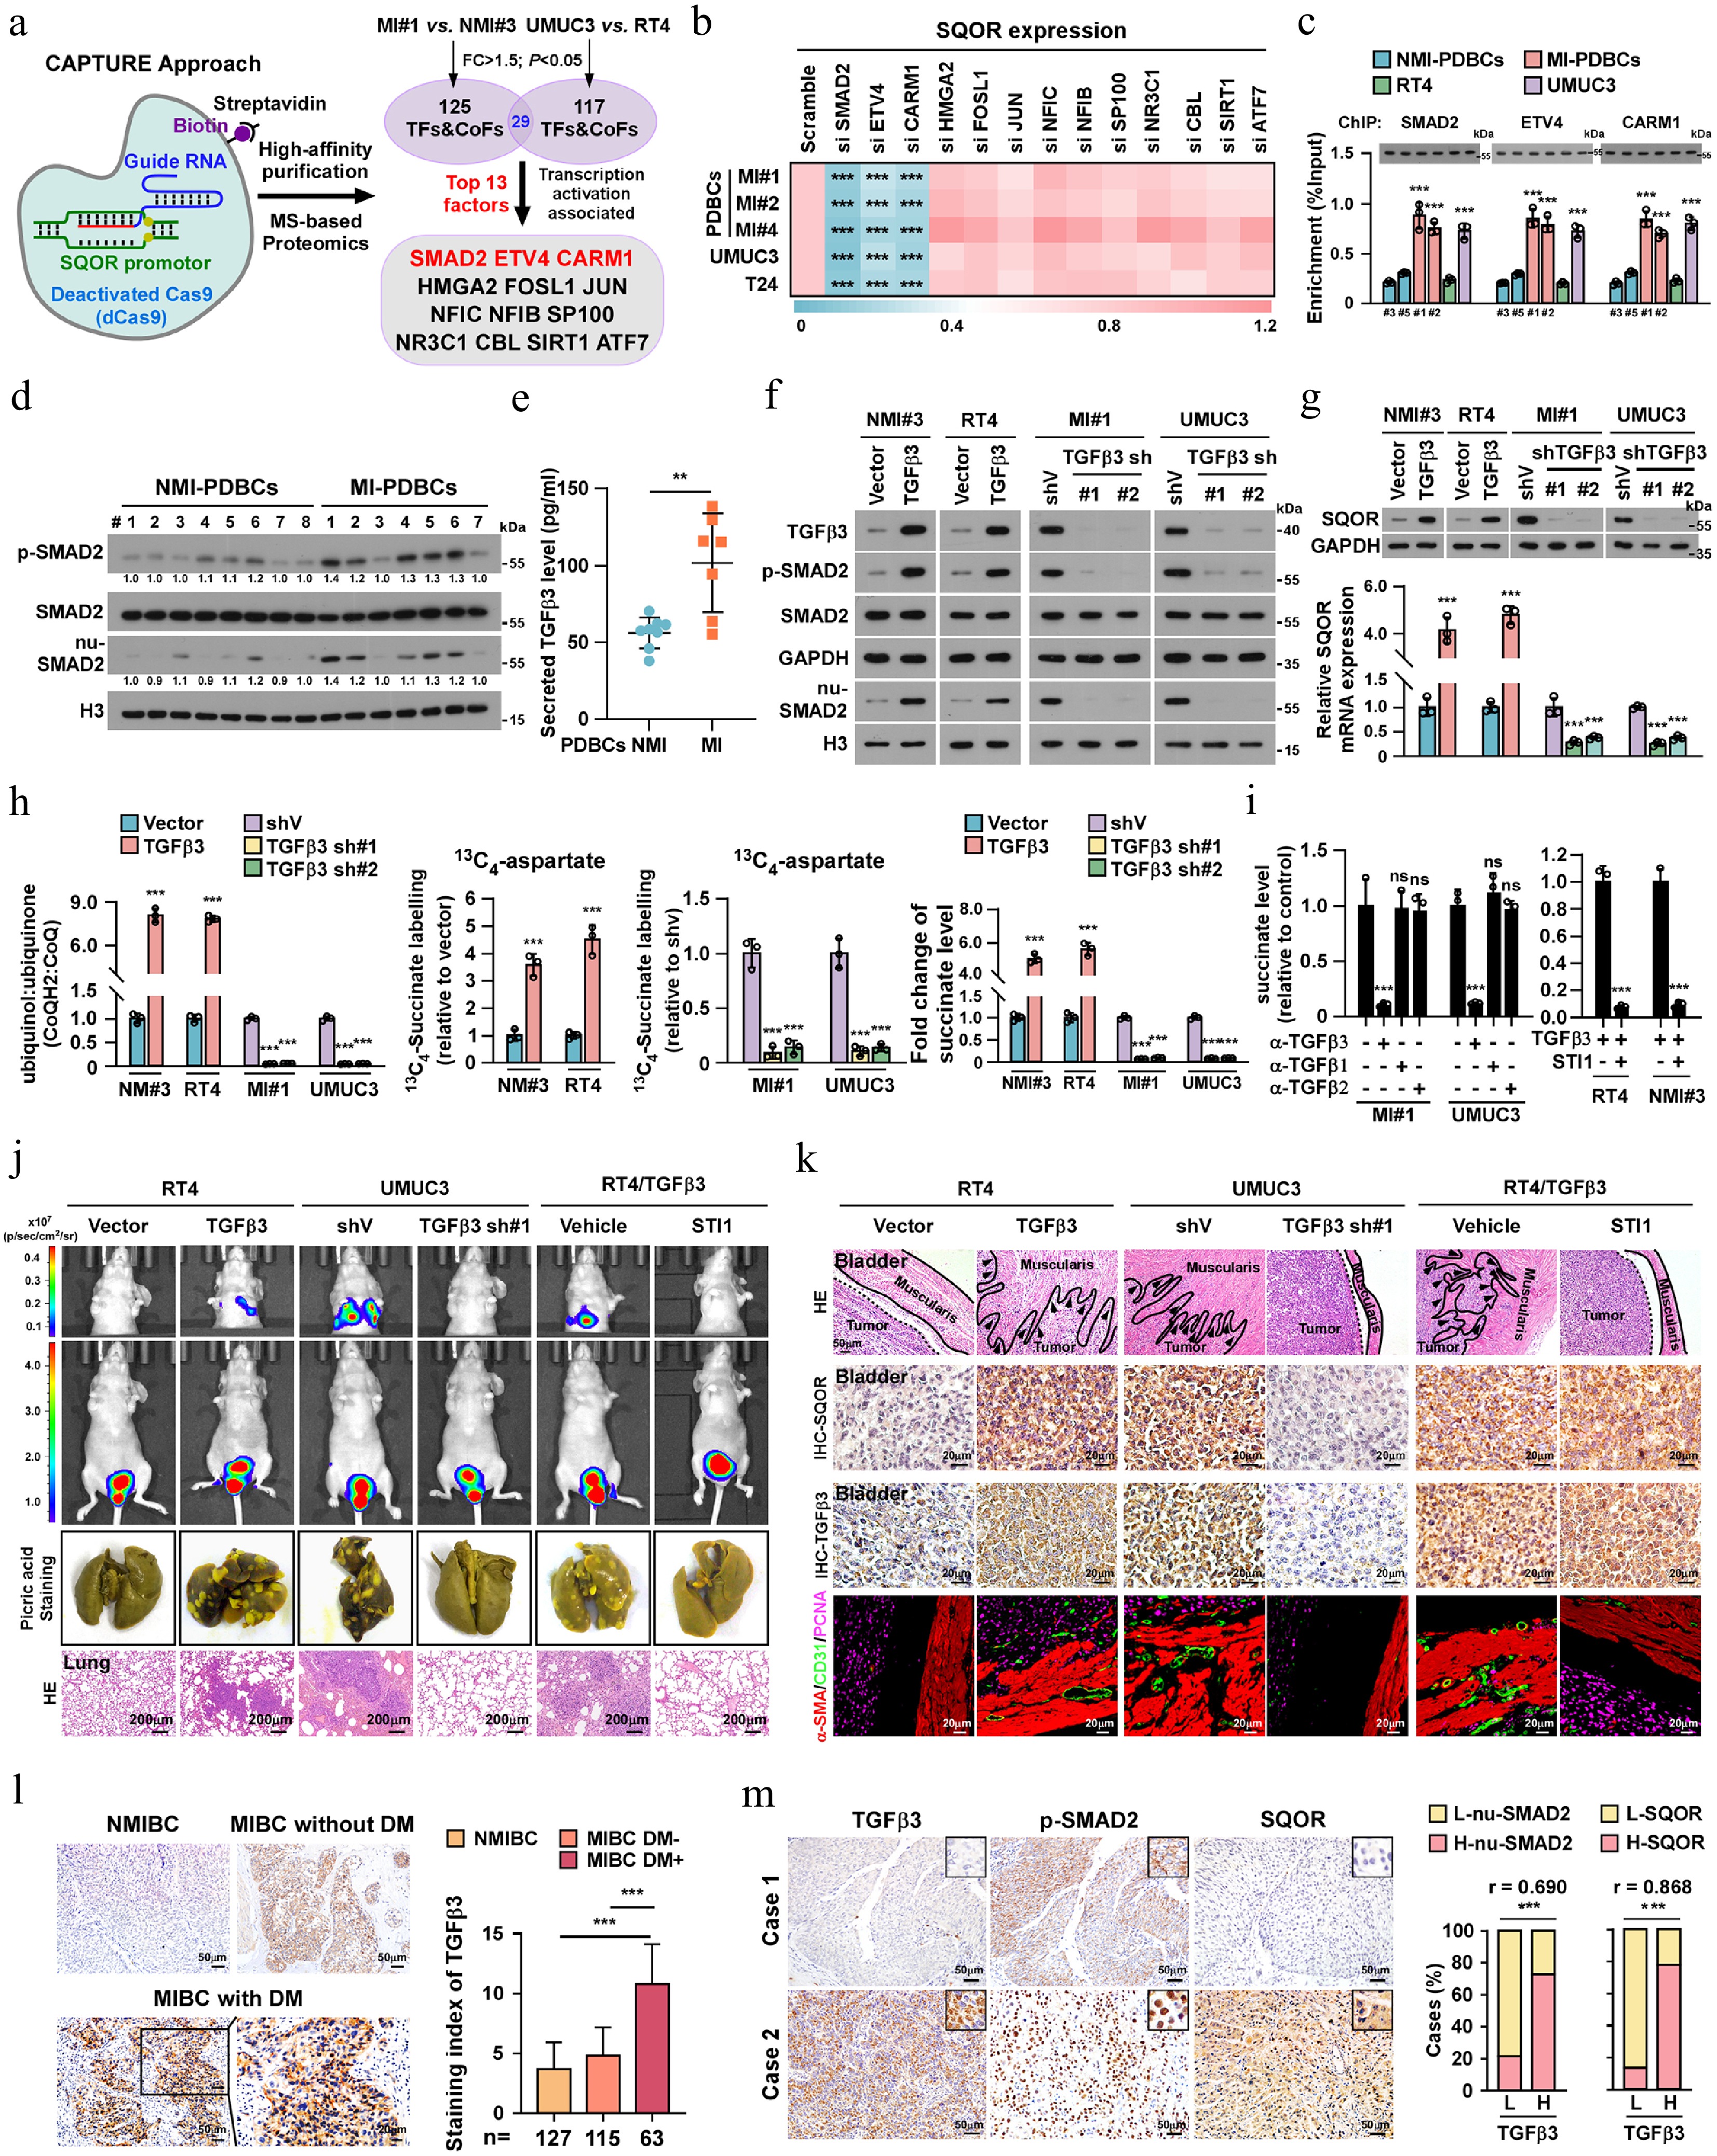
Figure 5.
TGFβ3/SMAD2 pathway contributes to SMCs-to-ELCs transdifferentiation in MIBC. (a) A schematic of dCas9-mediated capture of SQOR promoter using sequence-specific sgRNAs and mass spectrometry (MS) analysis of trans-regulatory factors targeting SQOR promoter. (b) Heatmap represented by pseudocolors was generated using the SQOR mRNA expression in the indicated cells. (c) ChIP assay analysis of SMAD2, ETV4 and CARM1 enrichment on the SQOR promoter in the indicated cells. (d) IB analysis of expression of p-SMAD2, SMAD2 and nuclear-SMAD2 in the indicated cells. GAPDH served as the loading control for total protein. H3 served as the loading control for nuclear protein. (e) ELISA analysis of level of TGFβ3 secreted form NMI-PDBCs (n = 7) or MI-PDBCs (n = 8) cells. (f) IB analysis of expression of TGFβ3, p-SMAD2, SMAD2 and nuclear-SMAD2 in the TGFβ3-overexpressed, TGFβ3-silenced cells and control cells. GAPDH served as the loading control for total protein. H3 served as the loading control for nuclear protein. (g) The protein and mRNA level of SQOR in the indicated TGFβ3-overexpressed, TGFβ3-silenced cells and control cells. (h) The relative CoQH2/CoQ ratio, incorporation of 13C-aspartate to succinate and succinate level in the indicated TGFβ3-overexpressed, TGFβ3-silenced and control cells. (i) The succinate level in MI-PDBCs#1 and UMUC3 treated with anti-TGFβ1, anti-TGFβ2 and anti-TGFβ3 antibody, or in RT4 and NMI-PDBCs#3 treated with TGFβ3, with or without SQOR inhibitor STI1. (j) Representative bioluminescence images, picric staining and H&E staining of pulmonary metastatic nodules in the indicated mice bearing orthotopic bladder tumor. Scale bars, 200 µm. n = 6 mice/group. (k) Representative H&E images of muscle infiltration (Scale bars, 50 µm), IHC images of SQOR and TGFβ3 (scale bars, 20 µm), IF images of intramuscular CD31+ or α-SMA+/CD31+ vessels (scale bars, 20 µm) in the indicated mice. n = 6 mice/group. (l) Left: representative images and quantification of TGFβ3 level in NMIBC (n = 127), MIBC with (n = 115), or without (n = 63) distant metastasis. Scale bars, 50 µm. Scale bars insets, 20 μm. (m) Percentages of specimens showing a correlation between TGFβ3 expression, and the levels of SMAD2 and SQOR in MIBC patients. Each error bar in (b), (c), (e), (g), (h), and (i) represent the mean ± SD of three independent experiments. Statistical analysis was performed using one-way ANOVA with Dunnett's multiple comparison tests for (l), two-way ANOVA with Šídák's multiple comparisons test for (c), (g), (h), and (i), unpaired two-tailed t tests for (e), Spearman's correlation for (m). * p < 0.05; ** p < 0.01; *** p < 0.001; ns, not significant.
Although SMAD2, ETV4, or CARM1 expression showed no significant differences between MIBC and NMIBC tissues, both phosphorylated-SMAD2 (p-SMAD2) and nuclear SMAD2 levels were dramatically elevated in MIBC and MI-PDBCs compared to NMIBC and NMI-PDBCs (Fig. 5d; Supplementary Fig. S5b). These results suggested that SMAD2 signaling might be involved in SQOR upregulation in MIBC.
SMAD2 signaling is classically activated by TGFβ ligands (TGFβ1, TGFβ2 and TGFβ3) to TGFβ receptors (TβRI, TβRII, and TβRIII)[60,61]. Interestingly, analysis of public datasets (GSE31684) revealed selective upregulation of TGFβ3 and TβRI mRNA in MIBC and metastatic bladder cancer, with no significant changes in TGFβ1, TGFβ2, TβRII and TβRIII expression. Importantly, upregulated TGFβ3 and TβRI expression was significantly correlated with poorer OS and reduced recurrence-free survival (RFS) in bladder cancer patients (TCGA-bladder cancer, GSE13507 and GSE48075; Supplementary Fig. S5c−S5f). ELISA and IB assays further confirmed that MI-PDBCs exhibited significantly higher intracellular and secreted TGFβ3 protein levels compared to NMI-PDBCs (Fig. 5e; Supplementary Fig. S5g).
To verify the functional role of TGFβ3/SMAD2/SQOR signaling in SMCs-to-ELCs transdifferentiation and bladder cancer metastases, we established TGFβ3-transduced NMI-PDBCs#3 and RT4 cells and TGFβ3-silenced MI-PDBCs#1 and UMUC3 cells (Fig. 5f). As shown in Fig. 5f–h, TGFβ3-transduced BC cells displayed a significant increase, whereas TGFβ3-silenced cells exhibited decreased, the phosphorylated- and nuclear-SMAD2 levels, SQOR expression, the CoQH2/CoQ ratio, the incorporation of 13C-aspartate into succinate, and succinate levels. However, treatment with TβRI&II inhibitor or anti-TGFβ3 neutralizing antibody, but not anti-TGFβ1/2 antibodies, significantly reduced the SQOR expression and counteracted the high CoQH2/CoQ ratio and succinate levels in MI-PDBCs#1 and UMUC3 cells (Supplementary Fig. S6a, S6b). Furthermore, we found that treatment with SFC/TGFβ3-transduced NMIBCs significantly induced the expression of endothelial markers (CD31, CD144 and vWF) and the tube-forming capability of PBSMCs, but TGFβ3 silencing or anti-TGFβ3 antibody treatment abolished the inductive effect of SFC/MIBC cells on endothelial-related function of PBSMCs (Supplementary Fig. S6c, S6d). Importantly, the inductive effect of TGFβ3 on the over-reduced CoQ pool, succinate accumulation, and the impact on endothelial-related function of PBSMCs was significantly abrogated by treatment with SQOR inhibitor STI1 (Fig. 5i; Supplementary Fig. S6e). Taken together, these results suggest that TGFβ3/SMAD2-mediated SQOR upregulation plays a vital role in succinate accumulation and SMCs-to-ELCs transdifferentiation.
The promotive role of TGFβ3 in SMCs-to-ELCs transdifferentiation and bladder cancer metastasis was further examined using an in vivo orthotopic xenograft mouse model. As shown in Fig. 5j, k; Supplementary Fig. S6f, the CD31+/α-SMA+ blood vessels within muscularis in RT4/TGFβ3 tumors-bearing mice were significantly more prevalent but rarely found in mice bearing TGFβ3-silenced tumors. The mice bearing TGFβ3-transduced tumor exhibited more metastatic foci in the lungs and shorter survival, whereas TGFβ3-silenced tumor-bearing mice displayed less lung metastasis and longer survival (Fig. 5j, k; Supplementary Fig. S6f, S6g). Importantly, SQOR pharmacological inhibition substantially suppressed lung colonization in TGFβ3-transduced tumor models, correlating with improved survival outcomes (Fig. 5j, k; Supplementary Fig. S6f, S6g). Taken together, these results indicate that the TGFβ3/SMAD2/SQOR signaling axis promotes succinate accumulation, facilitates functional SMCs-to-ELCs conversion, and thereby promotes bladder cancer metastasis through vascular mimicry mechanisms.
IHC analysis of our collected clinical bladder cancer cohort revealed that TGFβ3 level was slightly detected in NMIBC tissues but markedly higher in MIBC tissues and further elevated in metastatic bladder cancer tissues (Fig. 5l). The patients with TGFβ3-high bladder cancer exhibited significantly shorter DMFS and OS than those with TGFβ3-low bladder cancer (Supplementary Fig. S6h). Importantly, TGFβ3-high bladder cancer specimens showed increased CD31+/α-SMA+ vessels within the muscularis compared to TGFβ3-low-expressing bladder cancer (Supplementary Fig. S6i). Moreover, IHC statistical analysis revealed strong positive correlations between TGFβ3 and nuclear SMAD2 and SQOR expression (r = 0.690, p < 0.001; r = 0.873, p < 0.001) in MIBC tissues (Fig. 5m). These clinicopathological correlations suggest the TGFβ3/SMAD2/SQOR axis as a clinically actionable driver of MIBC metastasis.
TGFβ3/SMAD2 pathway upregulates SQOR via SMAD3/4-independent manner
-
Upon stimulation with TGFβ ligands, SMAD2 is phosphorylated by activated TβR and forms a heterotrimeric complex with SMAD3 and SMAD4, which subsequently translocates into the nucleus, where it transcriptionally regulates downstream targets through recruitment of other transcriptional cofactors[60,61]. Strikingly, our ChIP-qPCR assays revealed a specific association of SMAD2, but not SMAD3 and SMAD4, with the SQOR promoter in TGFβ3-treated cells (Fig. 6a). Consistently, both promoter activity and mRNA/protein expression of SQOR were significantly elevated in SMAD2-overexpressing cells but decreased in SMAD2-silencing cells. Notably, neither dysregulation of SMAD3 nor SMAD4 altered SQOR expression (Fig. 6b, c; Supplementary Fig. S7a). These results suggested that TGFβ3-induced SQOR upregulation was through a SMAD3/4-independent mechanism mediated specifically by SMAD2. This hypothesis was further confirmed by CAPTURE/IB assays showing that only exclusive binding of SMAD2 to the SQOR promoter (Fig. 6d, e).
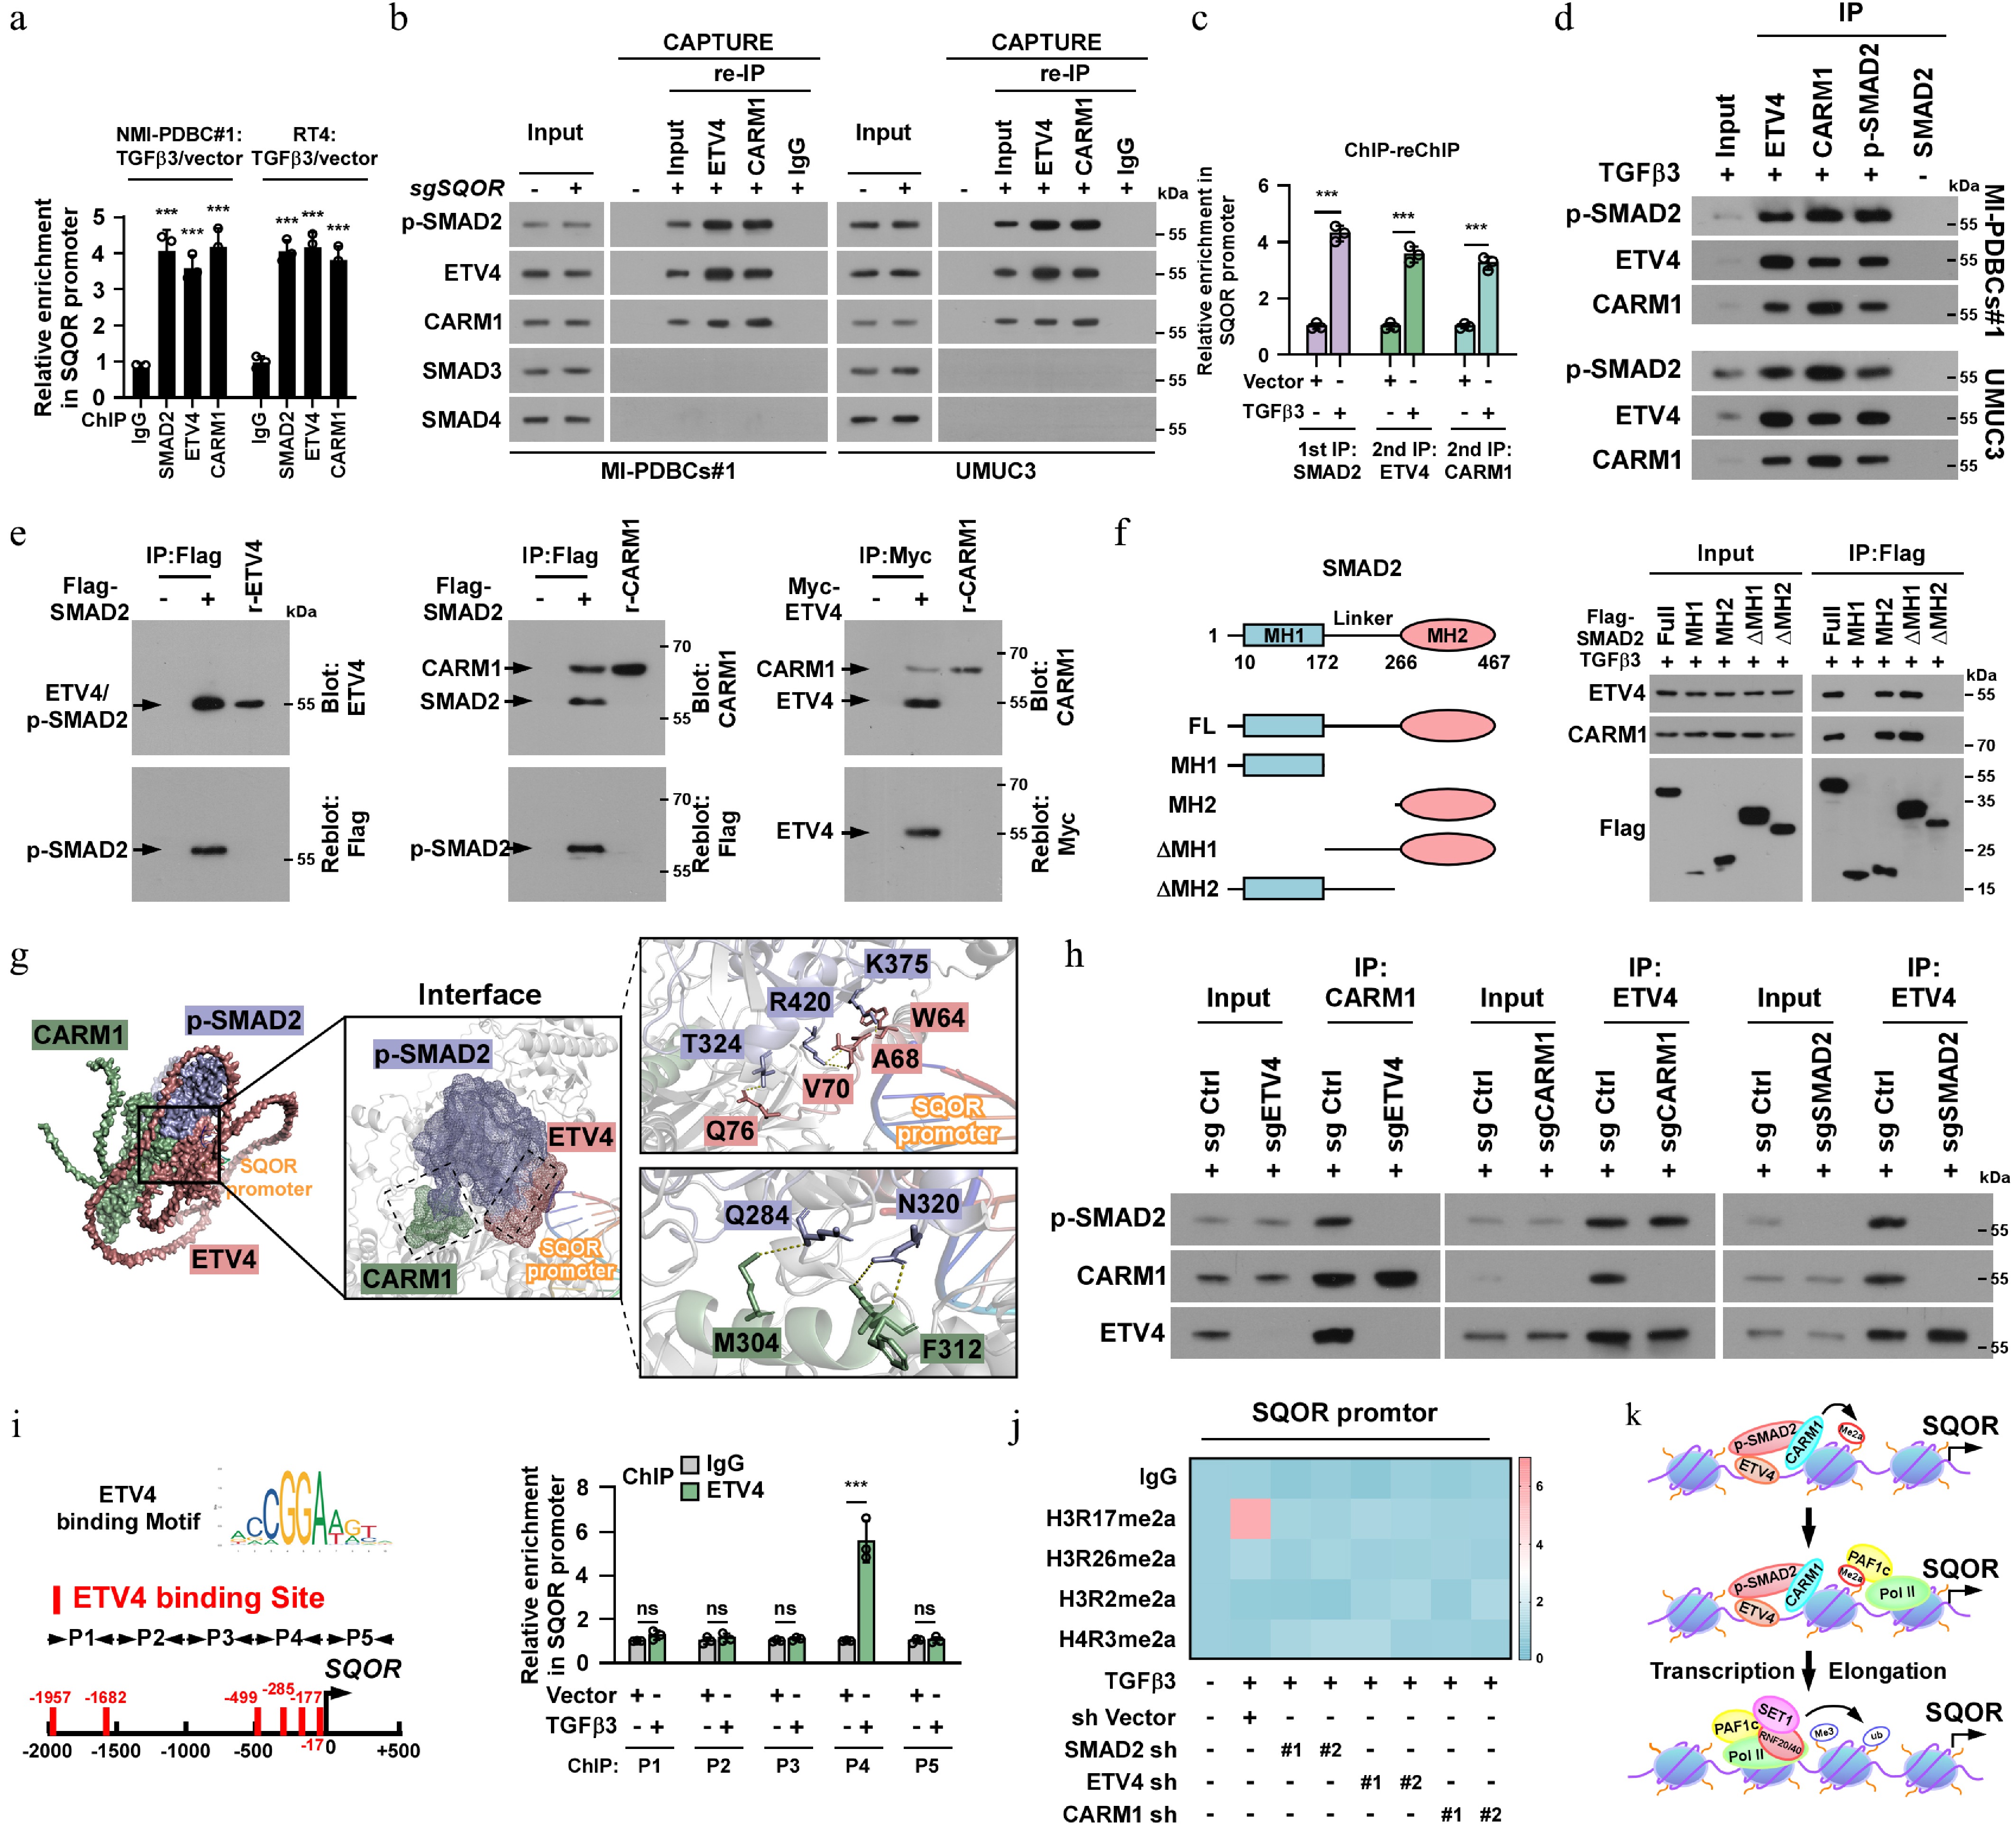
Figure 6.
TGFβ3-SMAD2/ETV4/CARM1 trimer axis epigenetically promoted SQOR transcription via SMAD3/4-independent manner. (a) ChIP assay analysis of enrichment of SMAD2, ETV4 and CARM1 on the SQOR promoter in the indicated cells. (b) CAPTURE/IB assays showing that only SMAD2, ETV4, and CARM1, but not SMAD3 or SMAD4, was associated with SQOR promoter. (c) Sequential ChIP experiments were first performed with an anti-SMAD2 antibody followed by re-ChIP using either an anti-ETV4 or anti-CARM1 antibody. (d) IP assays revealing that p-SMAD2 formed a complex with ETV4 and CARM1 in TGFβ3 treated cells. (e) Far-western blotting analysis was performed using indicated antibodies. (f) Schematic illustration of the wild-type and truncated SMAD2 protein (left) and co-IP assays were performed using anti-Flag antibody in the indicated cells (right). (g) AlphaFold3 analysis of 3D structure of the tetramer formed by p-SMAD2, ETV4, CARM1, and SQOR promoter DNA. (h) Co-IP assays were performed using anti-ETV4, or anti-SMAD2, or anti-CARM1 antibody in the indicated cells. (i) Left: Schematic illustration of ETV4 binding site at SQOR promoter. Right: ChIP assay analysis of ETV4 enrichment on the SQOR promoter in the indicated cells. (j) Heatmap represented by pseudocolors was generated using the ChIP-qPCR values that represented the enrichment of H3R17me2a, H3R26me2a, H3R2me2a and H4R3me2a on the SQOR promoter in the indicated cells. (k) A model depicting that CARM1 deposits H3R17me2a at the promoter of SQOR, which leads to the PAF1 recruitment, consequently resulting in H2BK120ub and H3K4me3 deposition and transcriptional elongation via RNAPII. Each error bar in (a), (f), and (l) represents the mean ± SD of three independent experiments. Statistical analysis was performed using two-way ANOVA with Šídák's multiple comparisons test for (a), unpaired two-tailed t tests for (c) and (i). * p < 0.05; ** p < 0.01; *** p < 0.001; ns, not significant.
TGFβ3 induces complex formation of SMAD2/ETV4/CARM1 on SQOR promoter
-
Consistent with our previous findings as shown in Fig. 5a, ChIP-reChIP and CAPTURE/IB assays revealed that TGFβ3 treatment significantly increased the enrichment of ETV4 and CARM1 on the SQOR promoter, mirroring the effects observed for SMAD2 (Fig. 6d−f). These results suggested that SMAD2 might form complexes with ETV4 and CARM1. Supporting this hypothesis, co-IP and Far-western blotting assays confirmed direct interactions between SMAD2 and both ETV4 and CARM1 in TGFβ3-treated cells (Fig. 6g, h; Supplementary Fig. S7b). Furthermore, systematic co-IP assays using serially truncated SMAD2 fragments indicated that ETV4 and CARM1 interacted with the MH2 domain of SMAD2 (Fig. 6i). This spatial overlap suggested potential competitive binding between ETV4/CARM1 and SMAD3 for SMAD2 interaction. Structural validation through AlphaFold3 server analysis revealed that the residues 324−420 in p-SMAD2 engaged with ETV4 at the residues 63−76, and the residues 284−320 in p-SMAD2 docked with CARM1 at the residues 322−329. This computational evidence provided further evidence for the formation of a p-SMAD2/ETV4/CARM1 trimeric complex on the SQOR promoter (Fig. 6j).
Intriguingly, silencing SMAD2 entirely abrogated ETV4/CARM1 interaction, and ablating ETV4 similarly impaired the p-SMAD2/CARM1 association, while CARM1 depletion did not reduce the p-SMAD2/ETV4 interaction (Fig. 6k). These results suggest that p-SMAD2 and ETV4 function as a cooperative scaffold required for the recruitment of CARM1 and the subsequent formation of the ternary complex. Consistently, silencing SMAD2 abrogated the effect of TGFβ3-induced enrichment of the ETV4/p-SMAD2/CARM1 complex on the SQOR promoter (Supplementary Fig. S7c). Therefore, these results support an indispensable role of SMAD2 in formation of ETV4/SMAD2/CARM1 ternary complex on SQOR promoter.
TGFβ receptor kinase-mediated phosphorylation of the MH2 domain in SMAD2 is crucial for the interactions of SMAD2 with other proteins[62]. We found that ETV4 and CARM1 interacted with constitutively active SMAD2-S2D mutant (S465D/S467D) but not with dominant-negative SMAD2-S3A mutants (S464A/S465A/S467A) that lack phosphorylation sites (Supplementary Fig. S7d). Consistently, overexpressing SMAD2-S2D, but not SMAD2-S3A mutant, increased the enrichment of ETV4 and CARM1 on SQOR promoter (Supplementary Fig. S7e). Therefore, these results further demonstrate the role of SMAD2 as a molecular adaptor that coordinates ETV4/CARM1 recruitment through its MH2 domain, serving as a structural platform for trimeric complex assembly on the SQOR promoter.
ETV4 is essential for binding of SMAD2/ETV4/CARM1 complex on SQOR promoter
-
SMAD2 could not directly bind DNA due to a 30-amino acid insertion in its N-terminus Mad-homology 1 (MH1) domain, which is responsible for DNA binding[63]. This structural feature suggests that SMAD2-mediated transcription of downstream targets relies on interaction with other DNA-binding transcription cofactors. We then investigated the mechanism underlying SMAD2 association with the SQOR promoter. As shown in Supplementary Fig. S7c−S7h, silencing ETV4 not only reduced the enrichment of SMAD2 and CARM1 on the SQOR promoter, but also abolished both TGFβ3-induced and SMAD2-S2D mutant-mediated SQOR upregulation. However, neither silencing CARM1 nor SMAD2 affected ETV4 levels on the SQOR promoter. These results suggested that ETV4 might act as transcription factor for recruiting ETV4/SMAD2/CARM1 ternary complex to the SQOR promoter. Consistently, analysis of the SQOR promoter region using the JASPAR program (
https://jaspar.elixir.no ) predicted six typical ETV4–binding sites (ETV4-BS; Fig. 6l). ChIP assays confirmed ETV4 binding primarily within the −20 to −500 bp region of SQOR promoter (Fig. 6l). Therefore, these results demonstrate that ETV4 serves as a critical DNA-binding component facilitating the assembly of the SMAD2/ETV4/CARM1 transcriptional complex at the SQOR promoter.CARM1 epigenetically enhances SQOR upregulation
-
Silencing CARM1 significantly abolished the inductive effect of TGFβ3 treatment or SMAD2-S2D mutant overexpression on SQOR upregulation, but had no effect on the enrichment of SMAD2/ETV4 on the SQOR promoter (Supplementary Fig. S7c−S7h). Considering that the arginine methyltransferase CARM1-mediated transcriptional regulation is through diverse histone methylation modifications, such as H3R26me2a, H3R2me2a, H3R17me2a, and H4R3me2a[64−66], we then systematically mapped its chromatin-modifying activity at the SQOR locus. ChIP assays revealed that TGFβ3 treatment significantly induced the enrichment of H3R17me2a, but not H3R26me2a, H3R2me2a, and H4R3me2a, on the SQOR promoter. Importantly, TGFβ3-induced H3R17me2a modification was abolished by silencing CARM1, SMAD2, or ETV4 (Fig. 6m). Therefore, the present results indicate that SMAD2/ETV4/CARM1 complex-mediated H3R17me2a modification is involved in TGFβ3-induced SQOR upregulation.
The H3R17me2a modification orchestrates transcription activation through recruitment of transcription elongation-associated PAF1 complex (PAF1c), which facilitates promoter clearance of RNA polymerase II (RNAPII) by coordinating H2B ubiquitination (H2B-ub) and H3K4 trimethylation (H3K4me3) during elongation phase[67−69]. In line with these reports, we observed enhanced binding of all PAF1c core subunits, including CTR9, LEO1, PAF1, CDC73, and SKI8, to the H3R17me2a tail, coupled with progressive accumulation of H2B-ub and H3K4me3 epigenetic marks at the SQOR promoter in TGFβ3-transduced bladder cancer cells (Supplementary Fig. S7i, S7j). Notably, upon TGFβ3 treatment, H3R17me2a marks were strictly localized to promoter regions, whereas PAF1 and RNAPII exhibited bimodal distribution encompassing both promoter-proximal and coding regions (Supplementary Fig. S7k). These spatial-temporal modifications align with a sequential activation mechanism: initiating with SMAD2/ETV4/CARM1-mediated H3R17me2a deposition, followed by PAF1c-dependent elongation machinery assembly at SQOR promoter (Fig. 6n).
L-chicoric acid reduces SQOR expression via disrupting ETV4/SMAD2-interaction
-
According to the tetramer structure predicted by AlphaFold3 (Fig. 6j), an in-depth interface analysis was conducted using the PDBiPISA software (
www.ebi.ac.uk ) and the PyMOL software (www.pymol.org ). The analyzed results visualized that the pivotal amino acids of p-SMAD2 that are essential for the p-SMAD2-ETV4 interaction, including S353, A354, K375, V419, K420, G421, E425, Y426, R427, and R428 (Fig. 7a), could form a pocket used for inhibitor screening. Utilizing the Virtual Screening Workflow module within the Schrodinger software (www.schrodinger.com ), 167 small molecules, from the bioactive compound library consisting of 25,682 compounds were identified to bind to the pocket of p-SMAD2. Among these 167 small molecules, 5 candidates exhibited high binding scores to the p-SMAD2 pocket (Fig. 7b; Supplementary Table S5).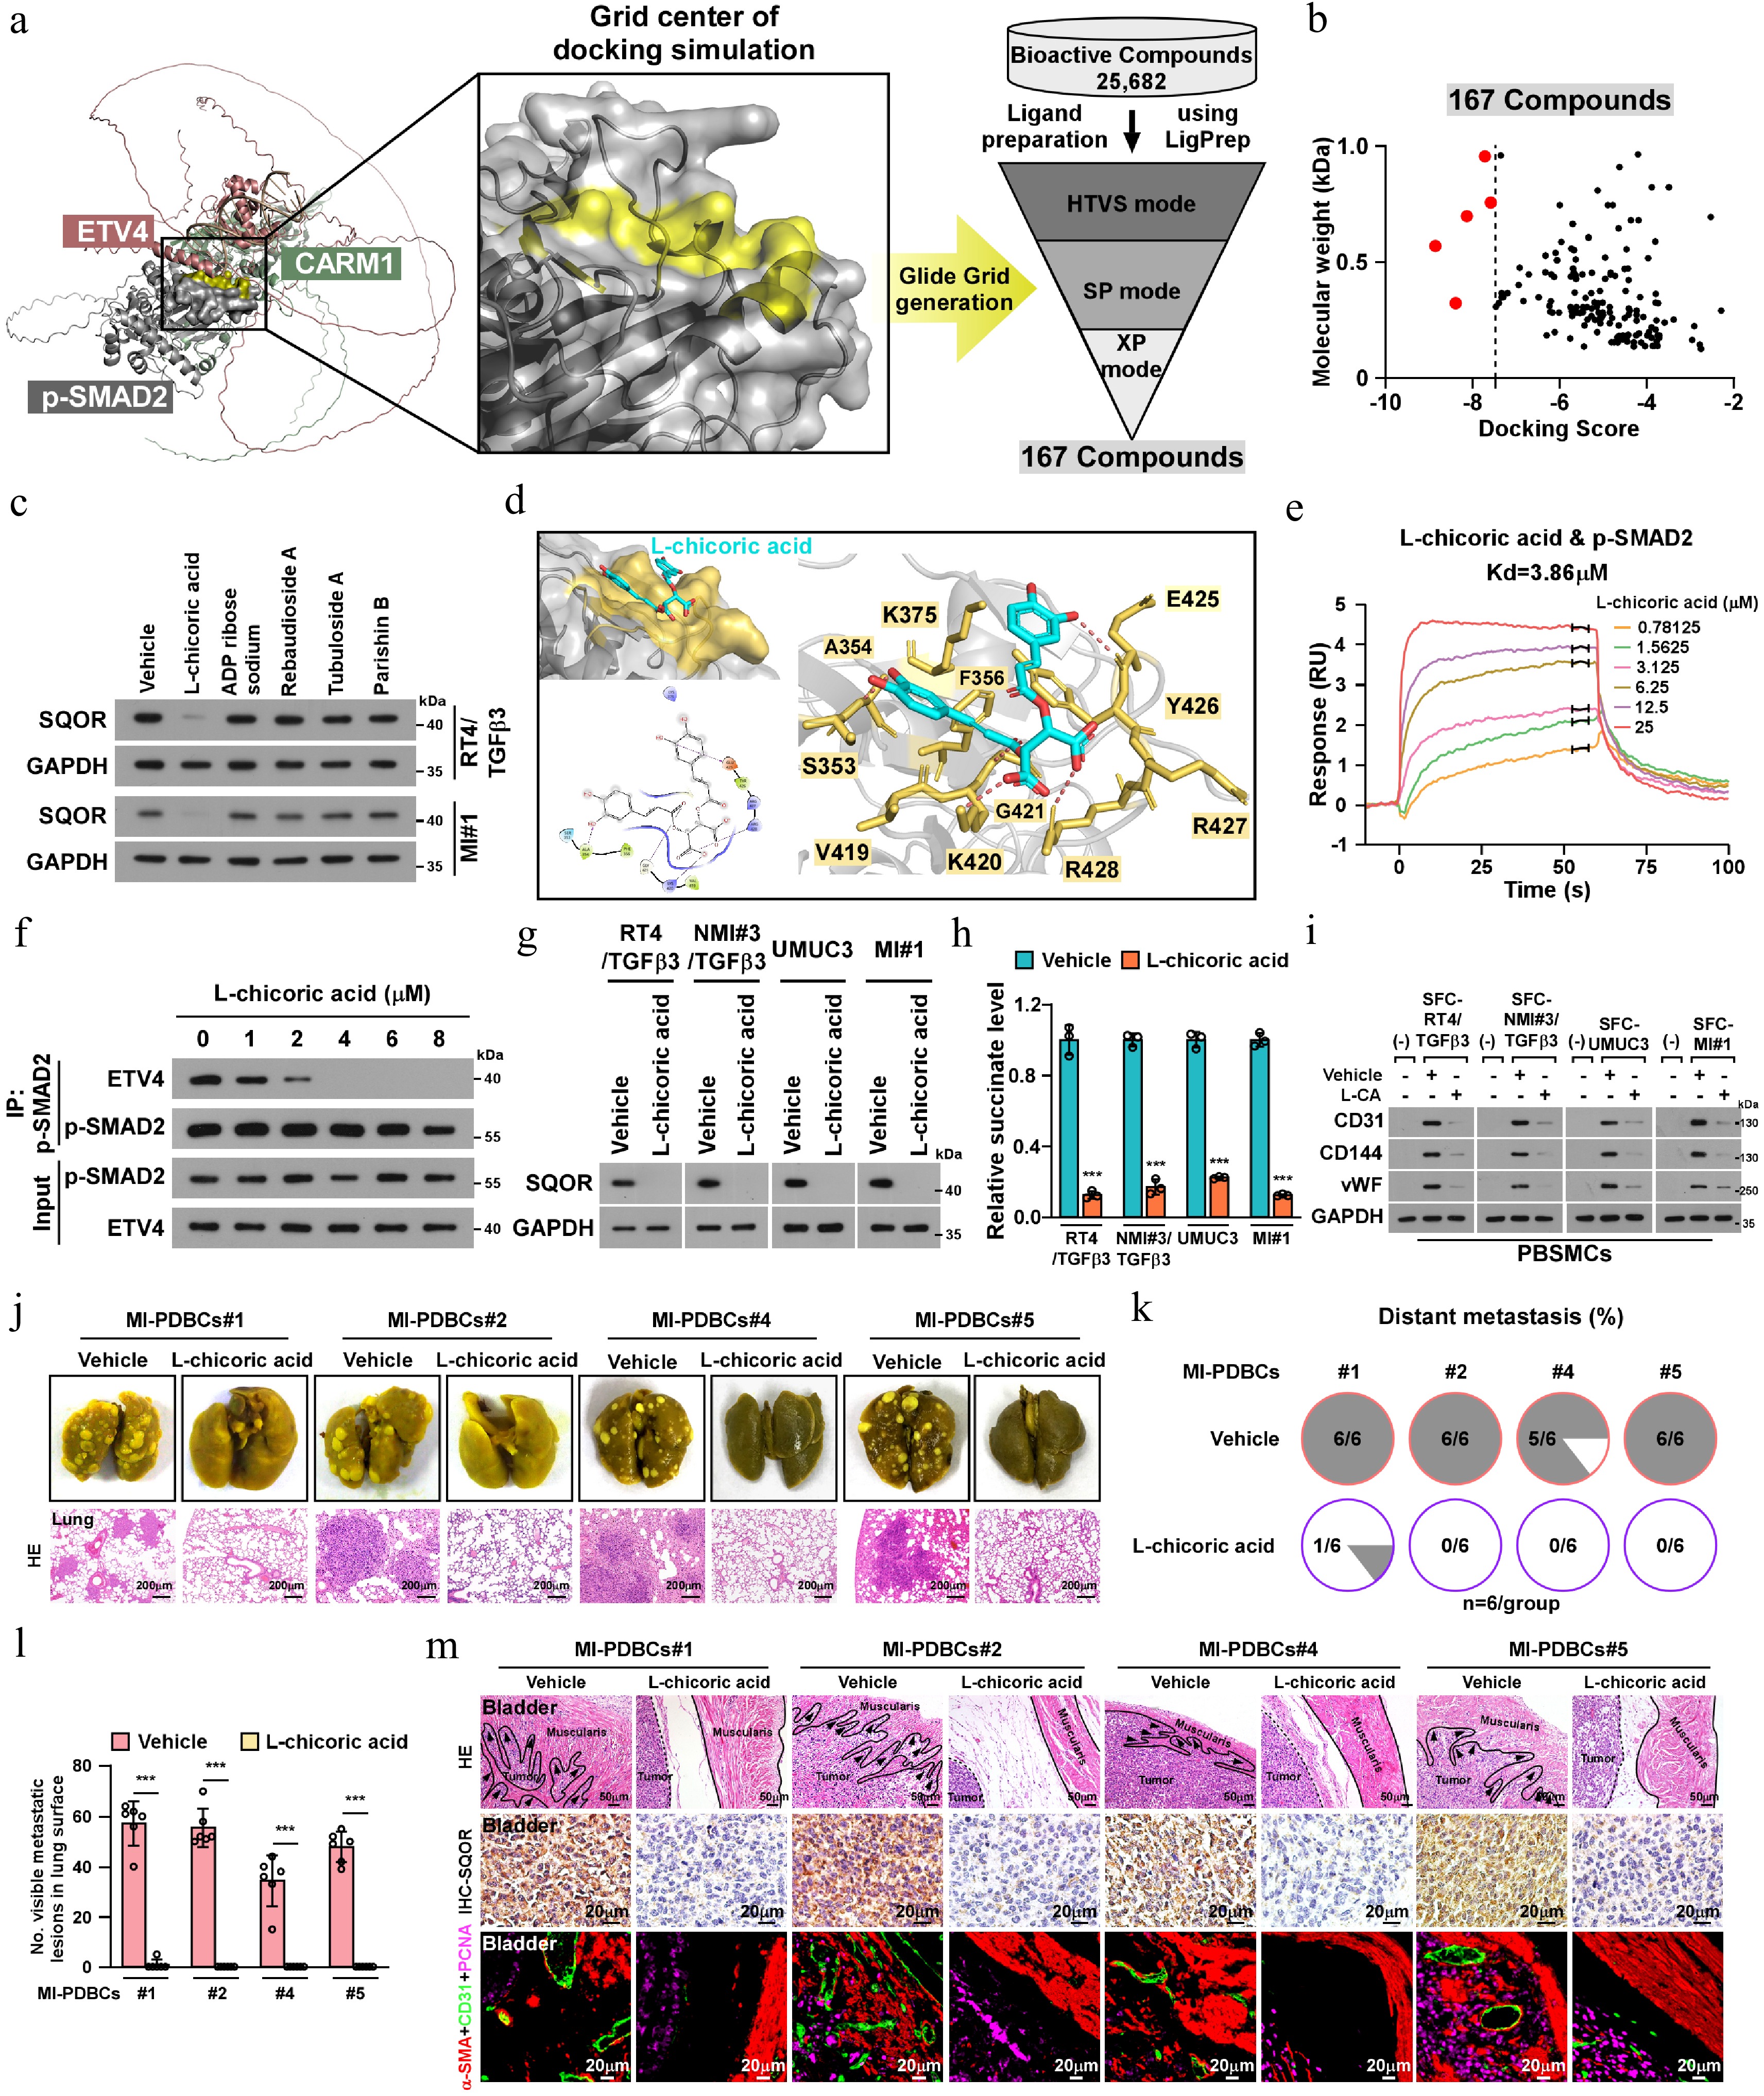
Figure 7.
Blocking SMAD2-ETV4 binding inhibited SMCs-to-ELCs transdifferentiation in MIBC. (a) Left: PDBiPISA and PyMOL software tool visualized that the core center of p-SMAD2 is required for the p-SMAD2-ETV4 interaction, as indicated by AlphaFold3-predicted 3D structure of the tetramer. Right: the Virtual Screening Workflow module in Schodinger software (
www.schrodinger.com ) showed that 167 small molecule, screened from a bioactive compound library consisting of 25,682 compounds, were identified as potential inhibitor binding to pocket of p-SMAD2. (b) Among these 167 small molecule, five candidates with high binding scores to the p-SMAD2 pocket were highlighted in red. (c) IB analysis of SQOR expression in RT4/TGFβ3 and MI-PDBCs cells treated with abovementioned five small molecules exposure for 48 h. GAPDH serve as a loading control. (d) Left upper: overview of pocket on p-SMAD2 bound to L-chicoric acid. Pocket on p-SMAD2 as indicated by yellow surface, and L-chicoric acid as indicated by blue sticks. Left bottom: two-dimensional ligand-interaction maps of co-crystals of p-SMAD2 bound with L-chicoric acid were generated using Schodinger software Computational model and interactions of L-chicoric acid and p-SMAD2. Polar interactions are shown as purple arrow and purple line. Right: Architecture of p-SMAD2 and L-chicoric acid showing interacting amino acids of p-SMAD2 (yellow). (e) SPR assay with Biacore diagram analysis of saturation curve of L-chicoric acid binding to p-SMAD2. (f) IP assays using anti-p-SMAD2 antibody in L-chicoric acid-treated UMUC3 cells and IB analysis of expression of p-SMAD2 and ETV4. (g) IB analysis of SQOR expression in the indicated cells treated with 1 µM L-chicoric acid. GAPDH serve as the loading control. (h) Succinate level in the indicated cells treated with or without L-chicoric acid (4 µM). (i) IB analysis of endothelial specific marker in PBSMCs that co-cultured with the indicated cells derived SFC treated with or without L-chicoric acid (4 µM). (j) Representative staining images showing the lung metastatic nodules in the indicated mice. Scale bars, 200 µm. n = 6 mice/group. (k) Kaplan−Meier curves analysis of metastasis-free survival in mice bearing the indicated orthotopic bladder tumors. n = 6 mice/group. (l) The quantification of pulmonary metastatic nodules in the indicated mice. n = 6 mice/group. (m) Representative staining images of muscle infiltration (scale bars, 50 µm), SQOR expression, and intramuscular CD31+ or α-SMA+CD31+ vessels in the indicated mice (scale bars, 20 µm). n = 6 mice/group. Error bar in (h) represents the mean ± SD of three independent experiments. Statistical analysis was performed using one-way ANOVA with Dunnett's multiple comparison tests for (h) and (l). *** p < 0.001.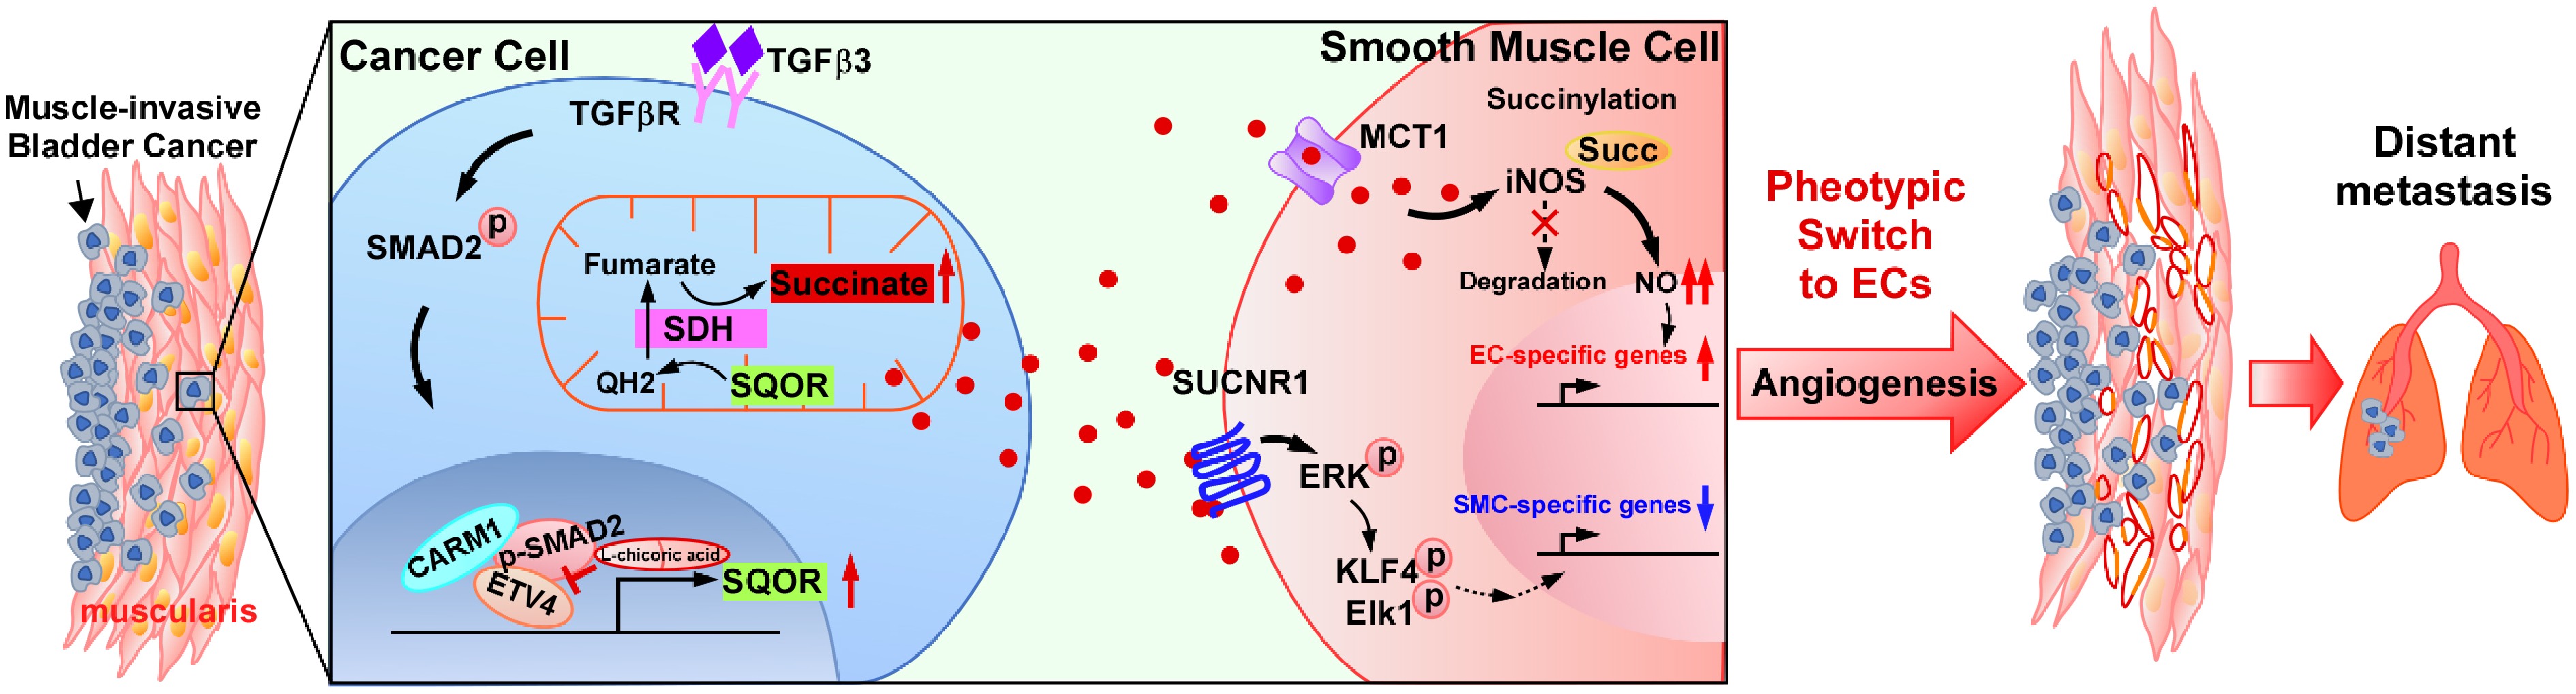
Figure 8.
A working model of bladder cancer-derived succinate promotes distant metastasis by driving SMCs-to-ELCs transdifferentiation. Briefly, MIBC cells infiltrating into the muscularis secrete succinate to trigger early-stage SMCs dedifferentiation by activating succinate receptor SUCNR1 signaling, and drives late-stage endothelial specification through succinate uptake-mediated iNOS succinylation. Isotope tracing revealed that accumulated succinate originates from reversed succinate dehydrogenase (SDH) activity, a process facilitated by sulfide quinone oxidoreductase (SQOR)-mediated overflow of ubiquinol. Mechanically, the TGFβ3-induced formation of SMAD2/ETV4/CARM1 transcriptional complex, via SMAD3/4-independent mechanism, epigenetically upregulates SQOR, enabling retrograde SDH flux and succinate accumulation. Virtual screening targeting the AlphaFold-predicted SMAD2-ETV4 interface identified L-chicoric acid as a potent inhibitor that effectively suppresses SMCs-ELCs transdifferentiation and MIBC metastasis.
We then tested the inhibitory potential effect of these 5 candidates on the p-SMAD2/ETV4/CARM1-mediated SQOR upregulation. As demonstrated in Fig. 7c, L-chicoric acid, a potent and selective HIV-1 integrase inhibitor exhibited the most pronounced inhibitory effect on SQOR expression. Mechanistic analysis revealed that L-chicoric acid directly bound to p-SMAD2 through forming four H-bonds and one salt bridge by interacting with the key amino acids A354, K420, G421, E425, and R428, in p-SMAD2 (with a Kd value of 3.86 μM), thereby disrupting the p-SMAD2/ETV4 interaction (Fig. 7d−f; Supplementary Fig. S8a). We found that L-chicoric acid treatment significantly decreased the expression of SMAD2 and CARM1 and level of H3R17me2a, H2B-ub, and H3K4me3 modifications on the SQOR promoter, but had no impact on expression of p-SMAD2 and ETV4 and the enrichment of ETV4 on SQOR promoter (Supplementary Fig. S8b, S8c). Therefore, these results indicate that L-chicoric acid-induced SQOR reduction is through disrupting the formation of ETV4/p-SMAD2/CARM1 transcriptional complex at SQOR promoter.
L-chicoric acid inhibits SMCs' transdifferentiation and MIBC distant metastasis
-
Consistent with its suppressive effect on SQOR expression, L-chicoric acid treatment significantly reduced intracellular succinate levels in TGF-β3-high-expressing bladder cancer cells (Fig. 7g, h). Although L-chicoric acid had no impact on the growth rate of MIBC cells, treatment of L-chicoric acid significantly abrogated the inductive effect of SCF/TGF-β3-high expressing bladder cancer cells on endothelial marker expression, in vitro tube-forming, and in vivo angiogenic capability (Fig. 7i; Supplementary Fig. S8d−S8g).
Then, the therapeutic efficacy of L-chicoric acid against MIBC metastasis was evaluated using an in vivo orthotopic xenograft mouse model. As shown in Fig. 7j−m and Supplementary Fig. S9a–S9f, compared to the vehicle-treated control tumors, treatment with L-chicoric acid resulted in significantly decreased SQOR expression, reduced serum succinate level, and declined infiltrated muscularis capability and the number of intramuscular CD31+ α-SMA+ vessels in the tumors formed by patient-derived MIBC cells and bladder cancer cell lines RT4/TGF-β3 or UMUC3. Importantly, the L-chicoric acid-treated mice exhibited much less distant lung metastasis foci and longer survival (Fig. 7k−m; Supplementary Fig. S9e, S9f). Taken together, these results substantiate the mechanistic cascade whereby TGF-β3-driven ETV4/SMAD2/CARM1 ternary complex formation promotes SQOR upregulation, drives SMCs-to-ELCs transdifferentiation, and facilitates metastatic progression, and represents L-chicoric acid as a promising therapeutic candidate for targeting MIBC metastasis through metabolic-angiogenic axis modulation (Fig. 8).
-
MIBC represents a biologically aggressive malignancy characterized by a high propensity for distant metastasis, resulting in a dismal five-year overall survival rate of 4.8%[3−5,70]. However, the mechanistic link between muscle invasion and metastatic dissemination, particularly whether the intramural microenvironment establishes metastasis-conducive conditions, remained elusive. In our current study, we observed a significant elevation of intramuscular microvascular density in MIBC tissues compared to NMIBC tissues, which strongly correlated with a higher risk of metastasis and poorer metastasis-free survival. These observations suggested that the muscle-infiltrating bladder cancer cells might orchestrate neoangiogenesis within the muscular microenvironment, thereby creating vascular conduits for systemic dissemination. Mechanistically, we demonstrated that MIBC-derived succinate-induced transdifferentiation of intramuscular SMCs into endothelial-like cells, thereby forming CD31+/α-SMA+ vessels within the detrusor muscle of the bladder, consequently resulting in MIBC metastasis. Thus, this study's findings provide new insights into a novel pathophysiological paradigm in MIBC progression: SMCs-to-ELCs transdifferentiation-driven intramural neovascularization serves as a critical metastatic gateway, which sheds light on a previously unexplored aspect of MIBC progression.
Tumor angiogenesis classically manifests through four canonical pathways: sprouting angiogenesis, vasculogenesis, intussusceptive angiogenesis, and vascular mimicry[71]. Intriguingly, this study observed that muscle-infiltrating neovessels co-expressed endothelial (CD31+) and smooth muscle (α-SMA+) lineage markers, suggesting a non-canonical vascularization mechanism. Although the transdifferentiation-driven vascular remodeling has been reported recently in other contexts, including that of lymphatic endothelial cells (ECs) differentiating into the vasculature during zebrafish anal-fin regeneration[72] and human fibroblast reprogramming into endothelial lineage cells for ECs regeneration[73], the precise mechanism remains unclear. Herein, this study demonstrated that increased microvascular density in MIBC was driven by the conversion of SMCs into functional ELCs in response to MIBC-secreted succinate within the muscularis. Mechanistically, this transdifferentiation occurs in a stepwise manner: Succinate first triggers early-stage SMCs dedifferentiation via SUCNR1 signaling, leading to loss of contractile markers (e.g., α-SMA); subsequently, succinate uptake by SMCs promotes iNOS succinylation, which activates iNOS/NO-dependent endothelial-specific transcriptional programs (e.g., CD31). Moreover, targeting succinate with an anti-succinate antibody effectively reduced intramuscular neovascularization and inhibited distant metastasis. Therefore, these findings highlight the pro-angiogenic role of SMCs in MIBC metastasis, revealing that the transdifferentiation of SMCs into ELCs represents a specific form of neoangiogenesis governed by succinate signaling. This multistep reprogramming process not only expands the paradigm of vascular mimicry, but may also provide new therapeutic approaches for targeting tumor metastasis.
Emerging evidence positions succinate as a pleiotropic signaling molecule extending beyond its canonical metabolic roles, such as promoting macrophage polarization and enhancing the immunostimulatory potential of dendritic cells through activation of the SUCNR1 signaling[74−77]. These findings suggest that succinate functions as a hormone-like metabolite with additional metabolic roles. This study mechanistically expands this paradigm by demonstrating succinate-driven transcriptional reprogramming in SMCs. Findings revealed that MIBC-derived succinate initiated a dedifferentiation programme in SMCs by activating SUCNR1/MAPKs cascade, which facilitated enrichment of Klf4/p-Elk1 on the promoters of specific SMC marker genes to mediate epigenetic silencing. However, SUCNR1 antagonist only blocked early-stage MIBC-derived succinate-induced SMCs dedifferentiation but failed to inhibit the conversion of late-stage dedifferentiated SMCs to endothelial-like cells, suggesting a dual role of succinate in exacerbating endothelialization. To identify the specific transporter responsible for succinate uptake during SMC-to-ELC transdifferentiation, we screened a panel of candidate transporters, including the SLC13 family (SLC13A2, SLC13A3, and SLC13A5), and the MCT family (MCT1, MCT2, and MCT4). While the SLC13 family comprises classical sodium-dependent succinate transporters, the MCT family, particularly MCT1, is known for its proton-coupled transport mechanism that becomes highly active in acidic environments[38,78]. The screening eventually pinpointed under MIBC-created acidic conditions, succinate was uptaken by succinate/SUCNR1-induced dedifferentiated SMCs via the MCT1 transporter. Then MCT1-mediated succinate uptake promotes iNOS succinylation at the K22 site. Crucially, this modification enhances iNOS stability by shielding it from K48-linked ubiquitination and proteasomal degradation. This increased stability leads to sustained iNOS protein levels and elevated NO production, which in turn acts as a substrate to promote the S-nitrosylation of endothelial-specific transcription factors such as GATA-2 and ER71. Therefore, these results delineate the expanded role of succinate in regulating SMCs-to-ELCs transdifferentiation, unveiling its moonlighting effect on vascular niche remodeling.
Another key finding of this study is that TGFβ3-mediated SQOR upregulation occurs in a SMAD3/4-independent manner. The SMAD2 signaling pathway plays vital roles in embryonic development, adult homeostasis, tissue fibrosis, and cancer progression through both SMAD3/SMAD4-dependent and -independent mechanisms[79−81]. While TGFβ typically activates SMAD2 signaling via SMAD3/SMAD4 complex formation to drive transcription[82,83], it is demonstrated that TGFβ3-activated SMAD2 promotes angiogenesis independently of SMAD3/4 by upregulating SQOR. This metabolic-signaling crosstalk may be further amplified by a reciprocal feedback loop between succinate and TGFβ signaling. As a competitive inhibitor of α-ketoglutarate-dependent dioxygenases, accumulated succinate can inhibit prolyl hydroxylases (PHDs) and histone demethylases (JHDMs). This inhibition may potentially stabilize SMAD2 phosphorylation or promote a permissive epigenetic state at endothelial gene promoters, thereby sensitizing cells to TGFβ3 and reinforcing SQOR-driven metabolic rewiring. This metabolic reprogramming drives succinate accumulation and MIBC metastasis, revealing a SMAD2-dependent mechanism, linking succinate metabolism to metastatic progression.
Given the limited therapeutic efficacy of MIBC, there is an urgent need for new treatment strategies. While the M-VAC regimen (methotrexate, vinblastine, doxorubicin, cisplatin) remains the standard therapy, it has shown only minimal prognostic improvement in MIBC patient over decades. Herein, it has been demonstrated that TGFβ3-induced SMAD2/ETV4/CARM1 complex formation played a vital role in endothelial transdifferentiation of SMCs in the bladder detrusor, facilitating angiogenesis and MIBC distant metastasis. Based on the AlphaFold 3-predicted SMAD2-ETV4 structure models, we identified L-chicoric acid as a potent inhibitor disrupting SMAD2-ETV4 interaction. It has been previously reported that high concentration (40 μM) of L-chicoric acid treatment induced autophagy and apoptosis in gastric cancer cells[84]. Strikingly, we found that treatment with low concentration (5 μM) of L-chicoric acid has no impact on MIBC cell proliferation, but specifically suppresses SMCs-to-ELCs transdifferentiation, thereby inhibiting MIBC distant metastasis. Therefore, these results uncover a paradigm-shifting mechanism whereby tumor-derived succinate orchestrates stromal transdifferentiation to establish metastatic niches, with direct translational implications for treating MIBC.
-
In summary, this study identified a TGFβ3 signaling pathway that drives metastatic progression by altering succinate metabolism. Mechanistically, TGFβ3-triggered SMAD2/ETV4/CARM1 complex reprogrammed succinate metabolism, driving SMCs to ELCs transdifferentiation, and enhancing intramuscular vascularization, which ultimately promoted MIBC distant metastasis through vascular mimicry mechanisms. Through structure-based virtual screening, L-chicoric acid is revealed as a specific inhibitor that disrupts the critical SMAD2-ETV4 interaction, thereby blocking the metabolic loop and inhibiting metastasis.
-
This study was approved by the Institutional Medical Research Ethics Committee of the Sun Yat-sen Memorial Hospital and Sun Yat-sen University Cancer Center of Sun Yat-sen University, complying with all relevant ethical regulations involving human participants (Approval number: SYSKY-2023-034-01). All experimental procedures were approved by the Institutional Animal Care and Use Committee of Sun Yat-sen University and the approval number was SYSU-IACUC-2023-001713.
-
The authors confirm contributions to the study as follows: study conception and design Tang M, Li J, Song L; data collection: Chen C, Zou H; analysis and interpretation of results: Feng R, Lin J, Chen X; draft manuscript preparation: Tang M, Yang M. All authors reviewed the results and approved the final version of the manuscript.
-
All data generated or analyzed during this study are included in supplementary information files, and also available from the corresponding author upon reasonable request.
-
This work was supported by the Shenzhen Medical Research Fund (B2302046, B2502006) and Natural Science Foundation of China (No. 82330082, 82573270, 82203746, 82460551); The Special Program for Basic Research (Natural Science Foundation) of Shenzhen (No. JCYJ20230807114100001 to Hequn Zou).
-
The authors have no conflict of interest to declare.
-
#Authors contributed equally: Miaoling Tang, Meisongzhu Yang
- Supplementary Table S1 Clinicopathological features and expression of TGFβ3 in studied bladder cancer patients.
- Supplementary Table S2 Correlation between the clinicopathological features and expression of TGFβ3.
- Supplementary Table S3 Univariate and multivariate analysis of different prognostic parameters in patients with bladder cancer.
- Supplementary Table S4 13 proteins in CAPTURE approach.
- Supplementary Table S5 167 potential bioactive compounds targeting SMAD2-ETV4 interaction.
- Supplementary Table S6 Sequence of primers used for subcloning and plasmid construction.
- Supplementary Table S7 Sequence of primers used for qPCR.
- Supplementary Table S8 Sequence of Oligonucleotides for siRNAs.
- Supplementary Fig. S1 Increased vessel density within muscularis associates with distant metastasis in MIBC.
- Supplementary Fig. S2 MIBC-derived succinate induces the lineage characteristics of endothelial on SMCs.
- Supplementary Fig. S3 Succinate induces phenotypic switching of SMCs.
- Supplementary Fig. S4 SQOR mediated SDH reversal induces succinate accumulation and SMCs-to-ELCs transdifferentiation.
- Supplementary Fig. S5 Upregulated TGFβ3 and TβRI was significantly correlated with OS and RFS of bladder cancer patients.
- Supplementary Fig. S6 TGFβ3/SMAD2 pathway promotes SQOR expression and SMCs-to-ELCs transdifferentiation.
- Supplementary Fig. S7 TGFβ3-induced ETV4/SMAD2/CARM1 complex epigenetically upregulates SQOR expression.
- Supplementary Fig. S8 Blocking SMAD2-ETV4 binding inhibited TGFβ3-mediated SMCs transdifferentiation in MIBC.
- Supplementary Fig. S9 L-chicoric acid inhibits MIBC distance metastasis.
- Copyright: © 2026 by the author(s). Published by Maximum Academic Press on behalf of China Pharmaceutical University. This article is an open access article distributed under Creative Commons Attribution License (CC BY 4.0), visit https://creativecommons.org/licenses/by/4.0/.
-
About this article
Cite this article
Tang M, Yang M, Feng R, Lin J, Chen X, et al. 2026. TGFβ3-SMAD2/ETV4/CARM1 axis drives metastatic progression in Muscle-invasive Bladder Cancer via succinate metabolic rewiring. Targetome 2(1): e008 doi: 10.48130/targetome-0026-0007 

TGFβ3-SMAD2/ETV4/CARM1 axis drives metastatic progression in Muscle-invasive Bladder Cancer via succinate metabolic rewiring
- Received: 13 January 2026
- Revised: 28 January 2026
- Accepted: 29 January 2026
- Published online: 13 February 2026
Abstract: The mechanistic connection between intramuscular invasion and distant metastasis in muscle-invasive bladder cancer (MIBC) remains unclear. In this study, a TGFβ3 signaling pathway that drives metastatic progression by altering succinate metabolism was identified. Mechanistically, a SMAD3/4-independent TGFβ3 signaling cascade that promotes the formation of a SMAD2/ETV4/CARM1 transcriptional complex was discovered. This complex epigenetically activates sulfide quinone oxidoreductase (SQOR), leading to mitochondrial metabolic reprogramming and succinate accumulation. The accumulated succinate then acts as a powerful paracrine signal, activating succinate receptor (SUCNR1) on smooth muscle cells (SMCs) to coordinate stromal remodeling and vascular niche formation that supports metastasis. Additionally, structure-based virtual screening reveals L-chicoric acid as a specific inhibitor that disrupts the critical SMAD2-ETV4 interaction, thereby blocking the metabolic loop and inhibiting metastasis. These findings establish TGFβ3 as an essential mediator of metabolic flexibility, and highlight the TGFβ3/SMAD2/ETV4/succinate axis as a promising therapeutic target.
-
Key words:
- TGF-β3 /
- Succinate /
- SQOR /
- Smooth muscle cells /
- Metastasis /
- Muscle-invasive bladder cancer