


-
Traditional Chinese medicine (TCM) is a comprehensive medical and ethnopharmacological system formed by the Chinese nation through long-term disease prevention and treatment practices. Unlike the conventional 'one drug, one target, one disease' paradigm, the therapeutic effects of TCM are characterized by holistic and systematic regulation of the organism, which is typically achieved through a 'multi-component, multi-target, and multi-pathway' mode of action[1]. In this process, the global modulation of tissue microenvironments and the coordinated changes among multiple cell types by TCM interventions are widely considered crucial foundations for its efficacy[2,3].
To address the 'multi-component, multi-target, and multi-pathway' nature of TCM, systems biology approaches such as network pharmacology have been extensively applied in TCM research. For example, by constructing 'herbs-components-targets-pathways-diseases' comprehensive biological networks, network pharmacology has provided valuable insights into the molecular basis of the holistic regulatory effects of TCM[4−6]. Nevertheless, such approaches primarily focus on distinct signaling pathways or target networks regulated by TCM, exhibiting great limitations in capturing cellular heterogeneity, multicellular coordination, and the dynamic reshaping process of the spatial microenvironment at the tissue level induced by TCM interventions.
Recent advances in single-cell and spatial omics technologies[7−16] have provided unprecedented opportunities to characterize cellular composition and spatial architecture within complex tissues. These technologies enable high-resolution profiling of cellular heterogeneity while directly linking cellular states to their spatial contexts. Meanwhile, progress in artificial intelligence (AI) has driven continuous innovation in computational methods, making it possible to systematically decode multi-level heterogeneity from these single-cell and spatial omics data. For instance, Shao et al. developed scDeepSort, a graph neural network (GNN)-based pretrained model for cell type annotation of single-cell RNA sequencing (scRNA-seq) data, which enables robust annotation of cell types across different tissues and conditions, including normal, disease, and drug-treated states[17]. Qian et al. proposed scSpace, a transfer-learning-based method for spatial reconstruction of cells and identification of spatially variated cell subpopulations, providing new insights into cellular spatial organization[18]. Recently, generative AI models, such as variational autoencoders (VAE), diffusion models, and transformer-based large language models (LLMs), have also been integrated into single-cell and spatial omics data analyses, further advancing studies on heterogeneity modeling[19−23], trajectory inference[24−26], and cell-cell interactions[27,28].
In this context, increasing attention has been directed toward cell niche analysis. As a fundamental unit that characterizes the cellular composition, spatial architecture, and functional states within specific tissue regions, the cell niche has been increasingly proven to represent a comprehensive intervention unit that transcends individual molecules or cell types, serving as a novel functional multicellular target for disease modulation and intervention[29,30]. This perspective extends the study of single cells to multicellular hubs of interacting cells[31], facilitating a deeper understanding of a wide variety of biological mechanisms such as cell plasticity[32], fate determination[33], and drug actions[34]. Crucially, the emphasis of cell niche analysis on multicellular coordination and spatial microenvironmental dependence is highly consistent with the theoretical basis of holistic regulation and systemic intervention of TCM. Consequently, adopting a cell niche-centered perspective is expected to provide a more physiologically and pathologically relevant analytical framework for elucidating the mechanisms of action of TCM.
In this review, we describe the conceptual development and research progress of the cell niche, focusing on recent advances in cell niche deciphering based on single-cell and spatial omics data with AI-driven computational methods. We also summarize representative scenarios of cell niche analysis in TCM research and discuss its potential value in elucidating the holistic regulatory mechanisms of TCM. Finally, we address current challenges and future directions, highlighting key limitations at the data, methodology, and application levels, and outlining emerging opportunities to advance interpretable, robust, and translational cell niche analytical frameworks for TCM research.
-
The concept of a niche in science originates from ecology, where it was used to describe the natural environment in which a species thrives, together with the environmental characteristics that support the functional role and long-term maintenance of the species[35]. With the advancement of research, this concept has gradually been extended to the life sciences to characterize the local environment or spatially proximal organization surrounding cells, referred to as the cell niche, also commonly termed the cellular microenvironment or spatial domain[36]. As a higher-order functional unit formed at the tissue level, the cell niche finely regulates essential cellular behaviors, including growth, proliferation, differentiation, and apoptosis, and plays a critical role in determining various biological processes, such as maintaining tissue homeostasis[37−39] and shaping disease progression[40−42]. Increasing evidence indicates that many complex pathological phenotypes cannot be fully explained by the abnormalities of a single cell type or molecular pathway, but instead arise from the coordinated dysfunction of multiple cellular components and their interactions within a specific cell niche[43]. This understanding positions the cell niche as a potential and an intervenable functional multicellular target, providing a crucial research level for understanding disease mechanisms and drug action.
The crucial regulatory role of cell niches in various physiological and pathological contexts has been systematically validated. For example, the stem cell niche controls stem cell self-renewal and differentiation precisely by providing specific signaling pathways and structural support, which is essential for proper organogenesis and tissue homeostasis[44]. Dysregulation of this cell niche may lead to tissue-specific dysfunction and disease susceptibility. Specifically, in the hematopoietic system, sickle cell disease (SCD) can cause alterations in the quantity and transcriptional state of various cellular components within the bone marrow vascular niche, thereby impairing hematopoiesis and exacerbating anemia. Studies have shown that intervening in the abnormal state of this cell niche can effectively rescue the vascular defects in SCD, highlighting the potential value of targeting cell niches in disease intervention[45].
The central role of cell niches in disease pathology further underscores their importance in drug research and therapeutic intervention. Unlike traditional strategies that focus on single molecular targets or individual cell types, targeting disease-associated cell niches offers the potential to globally intervene in multicellular coordination of regulatory networks, thereby enhancing therapeutic efficacy and reducing the risk of drug resistance. For example, in tumor tissues, the metastatic cell niche preserves and protects the cancer stem cell phenotype and cellular plasticity from differentiation cues, thereby promoting immune evasion and undermining the efficacy of conventional therapeutic interventions[46]. Related studies have found that targeting key interactions between tumor cells and astrocytes in brain metastatic cell niches can significantly inhibit metastatic lesion formation, providing direct evidence for cell niche-guided therapeutic strategies[47]. On the other hand, in the context of complex therapeutic interventions such as TCM, cell niche analysis provides a more comprehensive and consistent theoretical framework for elucidating the pharmacological mechanisms underlying such multi-target and multi-pathway synergistic regulation. For example, in the liver fibrosis model, Ma et al.[48] observed that the combination of the TCM formula Bushen Huoxue Huazhuo Formula (BSHXHZF) with bone marrow mesenchymal stem cells (BMSCs) transplantation significantly enhances the colonization of BMSCs in liver tissue, reduces hepatocyte apoptosis, suppresses pathological injury, and decreases fibrosis markers, surpassing monotherapy effects. Mechanistic investigations suggest that this synergistic effect is closely associated with the systematic remodeling of the fibrotic liver niche, including reduction of oxidative stress, inhibition of key pro-fibrotic signaling pathways (such as TGF-β1), and promotion of pro-regenerative chemokines, thus facilitating BMSCs engraftment and paracrine activity.
Early studies on the cell niche primarily relied on experimental techniques such as in vitro cell co-culture systems and tissue imaging approaches (Fig. 1). Through live imaging of the Drosophila testis, Voog et al. discovered that somatic stem cells in the Drosophila testis not only contribute to the formation of the somatic cyst cell lineage, but also participate in the establishment and maintenance of the cell niche at the apical hub, revealing the dynamic regulatory relationship between stem cells and their niche[49]. Kiel et al. used immunofluorescence analysis to uncover the spatial heterogeneity of hematopoietic stem cells (HSCs) niches within the bone marrow, showing that HSCs preferentially associate with either sinusoidal endothelial cells or the endosteum in distinct anatomical locations[50]. In addition, Al-Juboori et al. employed in vitro co-culture systems of endometrial stromal cells with cancerous epithelial cells, combined with proteomics analysis, to investigate the cell-cell adhesion and reciprocal epithelium-stroma dialogue, and identified associated signaling pathways in the tumor niches of human endometrial cancer[51]. Collectively, these studies advanced our understanding of the structural and functional characteristics of the cell niche, and provided valuable experimental evidence supporting the concept of niche-dependent regulation of cellular behavior. However, owing to intrinsic limitations in experimental design and technical resolution, these approaches generally fail to characterize the cell niches in complex tissues comprehensively. A major limitation of in vitro cell co-culture systems lies in their oversimplification of the complex multicellular composition and tissue architecture present in vivo. Most existing co-culture models involve only two or a limited number of cell types, making it difficult to recapitulate the multicellular complexity of cell niches[52]. In addition, although these systems offer experimental controllability for dissecting cell-cell signaling, they remain limited in capturing spatially constrained, tissue- or microenvironment-specific interactions. Consequently, in vitro cell co-culture systems have a restricted capacity to explain the spatially selective therapeutic effects of drug interventions, such as niche-specific regulatory observed in the tumor microenvironment or ischemic border zones[53,54]. In contrast, tissue imaging approaches preserve spatial context to some extent, but are constrained by limited molecular detection throughput, depth, and resolution. These methods typically rely on a small set of predefined markers[55], making it difficult to characterize the subtle changes of cellular states as well as the complex composition of cell niches comprehensively in physiological or pathological tissues. Moreover, both in vitro cell co-culture systems and tissue imaging approaches are predominantly static, providing limited insight into the spatiotemporal interactions and dynamic remodeling of cell niches during disease progression or therapeutic intervention. Collectively, these limitations hinder the ability of traditional methodologies in cell niche analysis.
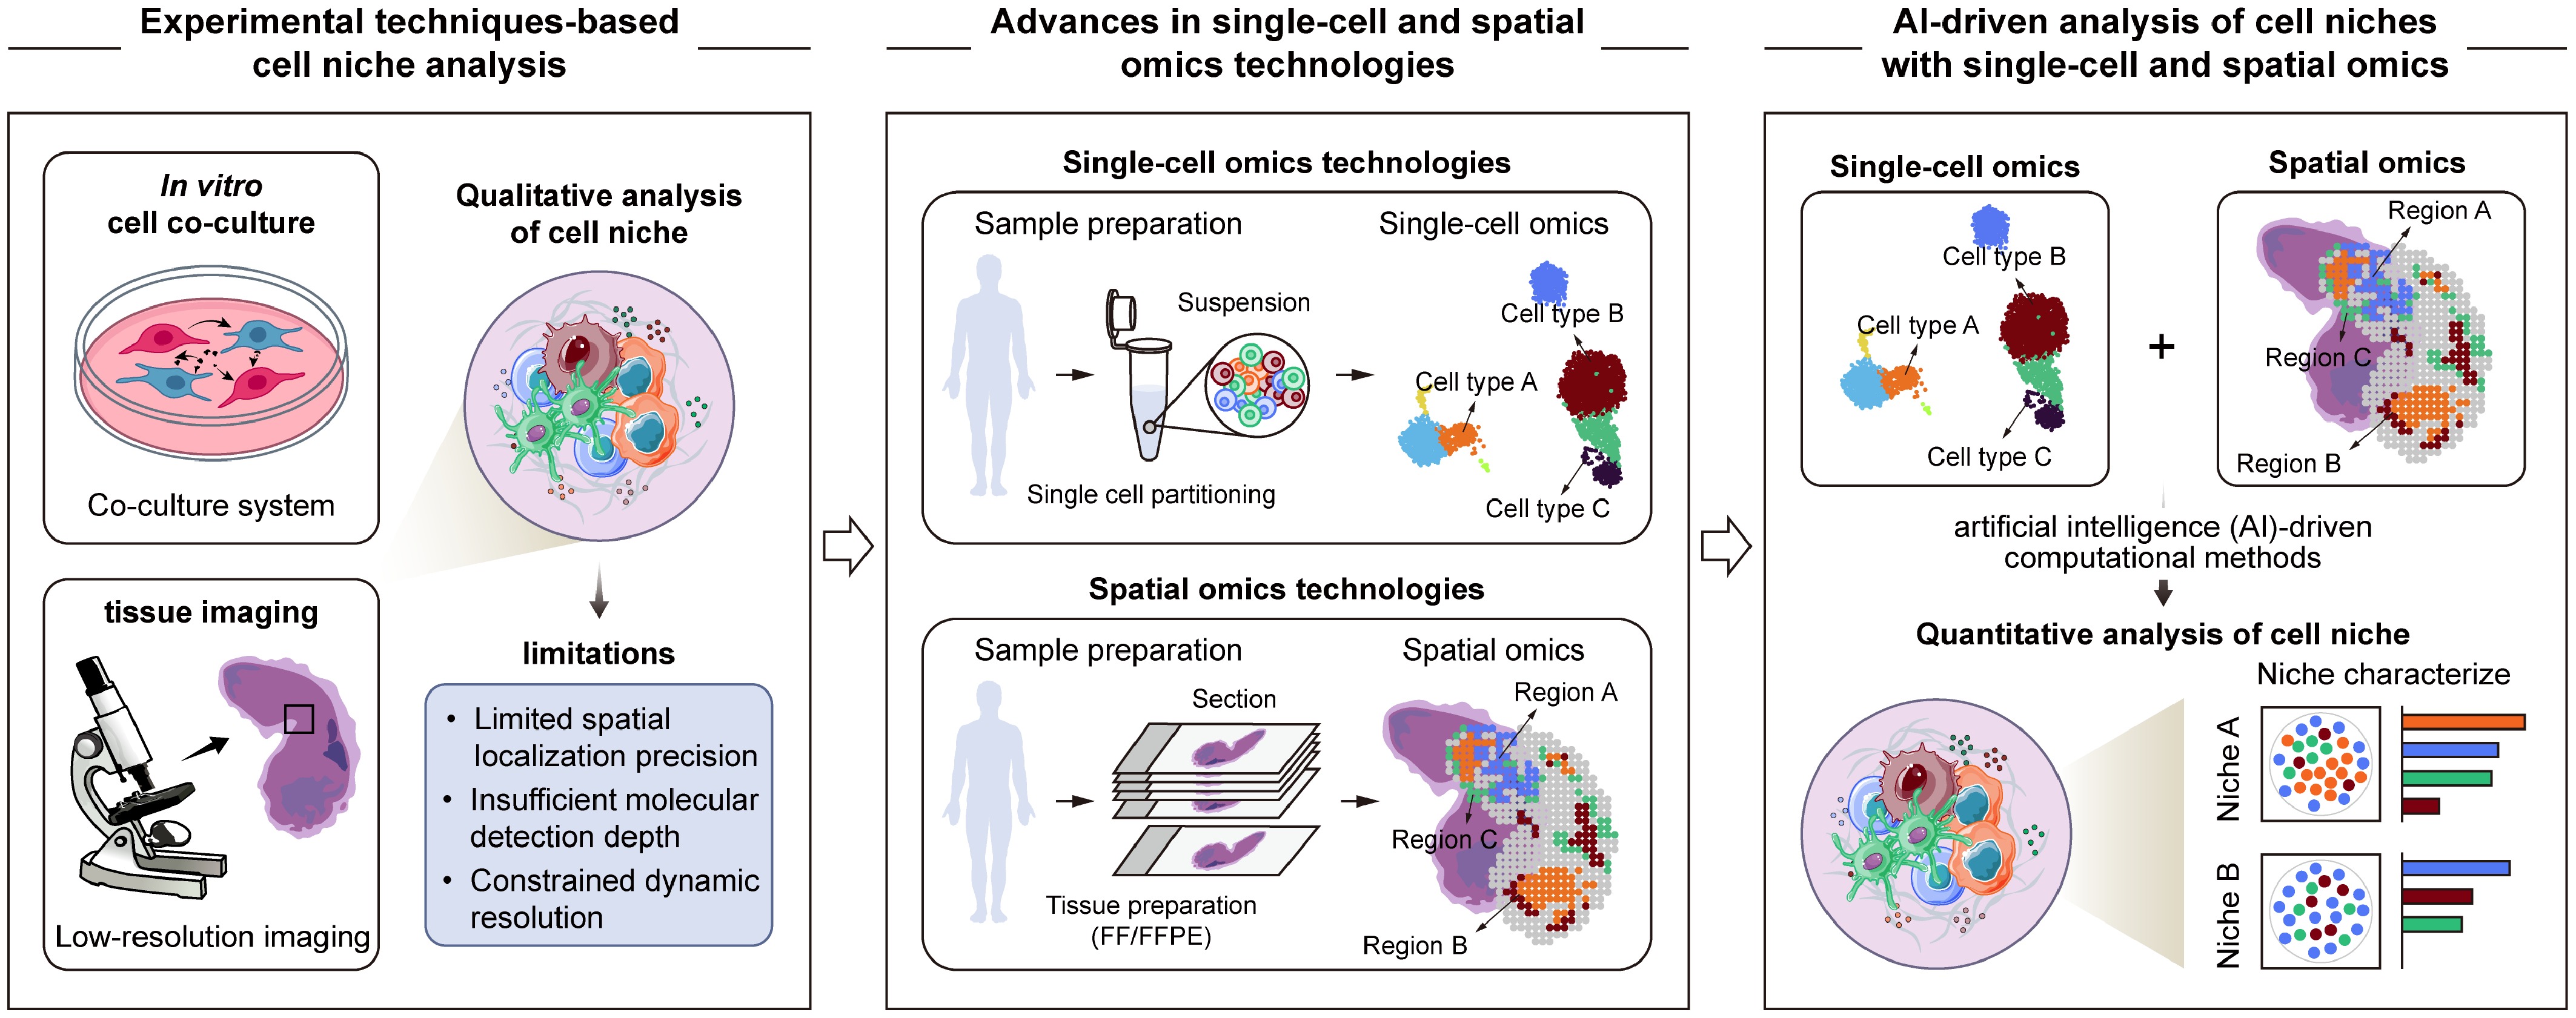
Figure 1.
Overview of advances in cell niche research. With the emergence of single-cell and spatial omics technologies, along with advances in AI-driven computational methods, cell niche research has gradually evolved from early qualitative descriptions based on experimental observations toward quantitative and systematic analysis that integrate multidimensional molecular characteristics and spatial information.
In recent years, the emergence and rapid development of single-cell and spatial omics technologies have enabled the acquisition of molecular profiles at single-cell and spatial resolution, providing critical technical foundations and data resources for cell niche analysis. Leveraging these high-resolution datasets, cell niche research has gradually evolved from largely qualitative, hypothesis-driven investigations toward quantitative and systematic analysis, allowing systematic exploration of cellular states, functions, and interactions in the tissue context at spatiotemporal resolutions. At the same time, the increasing scale and complexity of single-cell and spatial omics data has driven diverse analytical strategies and relevant AI methods in this field. Therefore, the following section focuses on recent advances in deciphering cell niches from single-cell and spatial omics data with AI-driven approaches.
-
Since the establishment of the first scRNA-seq protocol[56] in 2009, single-cell omics technologies have profoundly transformed our understanding of cellular heterogeneity and gene expression dynamics across species, tissues, and developmental stages. These technologies have enabled systematic exploration of cellular diversity and state transitions across a wide range of developmental and disease contexts, providing in-depth insights for understanding complex biological processes. Against this backdrop, early studies primarily employed two strategies to infer cell niches using the single-cell data (Fig. 2a). The first strategy treated the acquired tissue sample as a single cell niche and focused on analyzing its cellular composition and functional characteristics systematically at the single-cell resolution. For example, Qadir et al. examined the single-cell transcriptome of the human ductal tree and revealed lineage-specific differentiation potentials of progenitor-like cells in this cell niche[57]. Cheng et al. performed single-cell transcriptomic analysis of the mouse intestinal lamina propria and identified fibroblast subpopulations in the cell niche that control innate lymphoid cell homeostasis and functionality[58]. However, while this strategy partially deciphers cell niches, it simplifies the entire tissue into a homogeneous cell niche, failing to capture the heterogeneity of cell niches within the tissue.
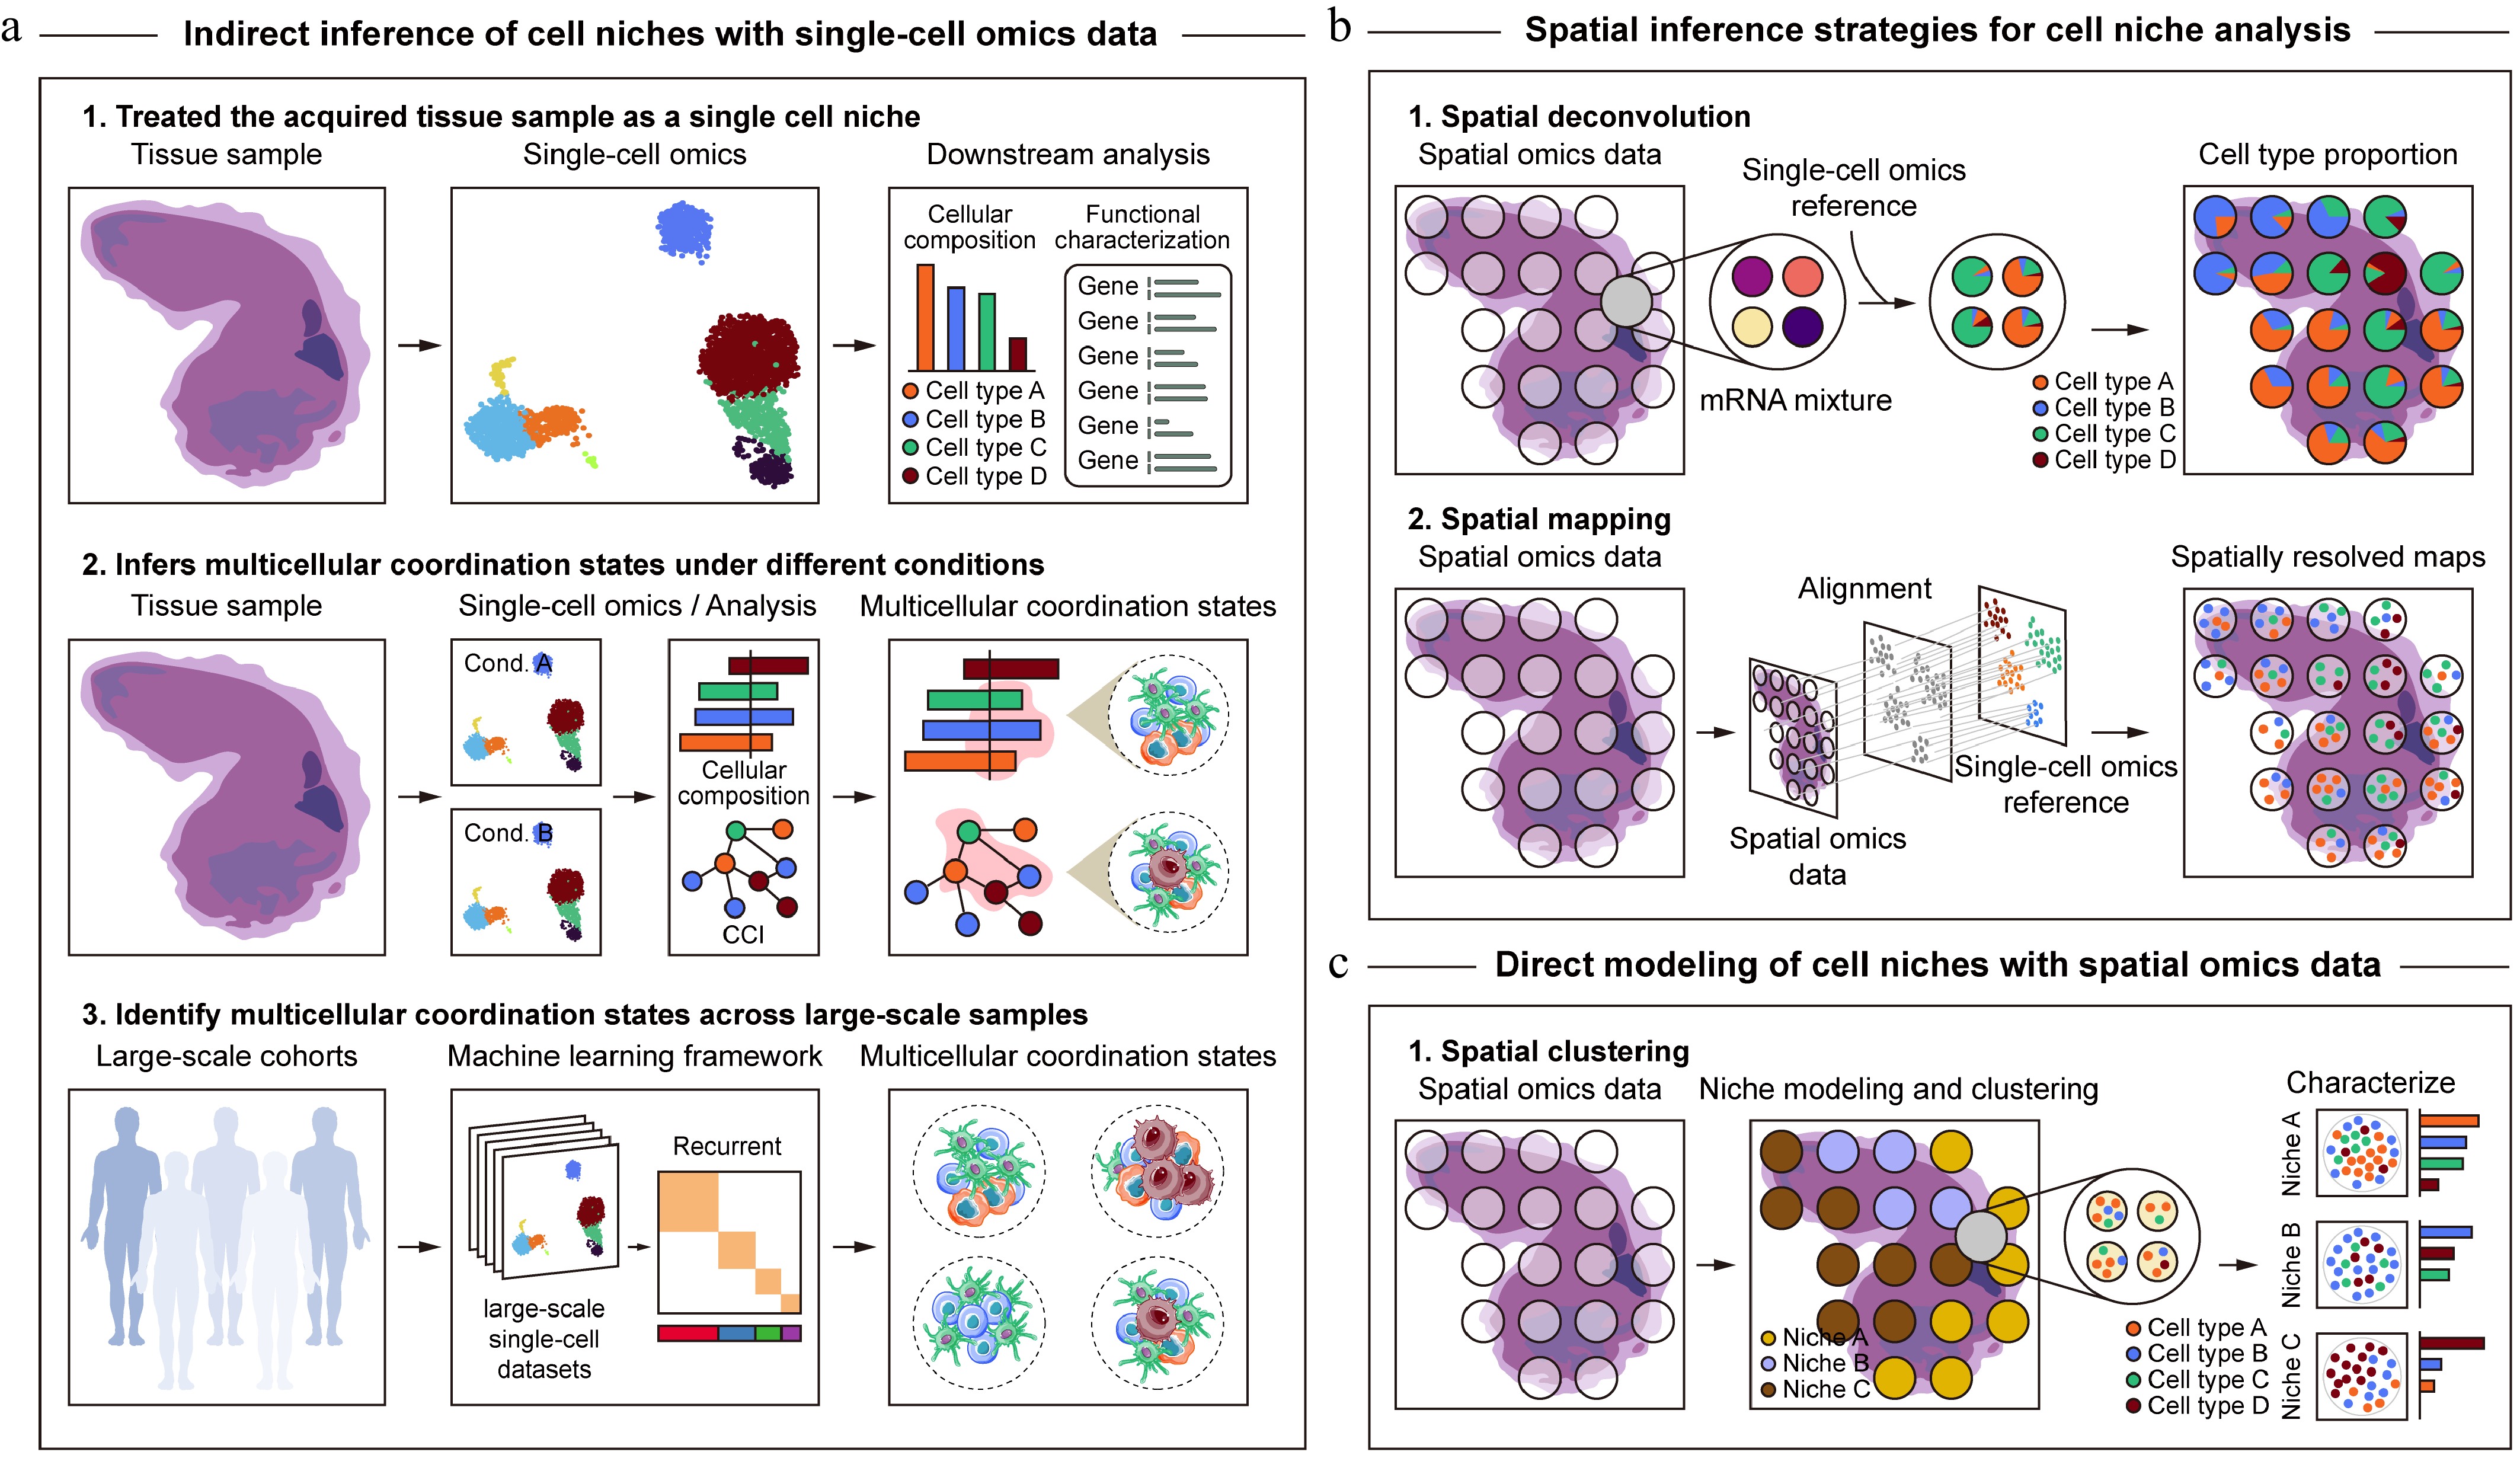
Figure 2.
Schematic pipeline for inferring cell niches from single-cell and spatial omics data. (a) Cell niche analysis based on single-cell omics data. Given the loss of spatial location information, cell niche inference from single-cell omics data mainly relies on systematic characterization of cellular composition and functional states at single-cell resolution, indirect inference of multicellular coordination states through changes in cell type proportions or CCIs, and machine learning-based identification of recurrent multicellular coordination states across large-scale single-cell cohorts. (b), (c) Cell niche analysis based on spatial omics data. In contrast to single-cell omics, spatial omics technologies explicitly preserve spatial context, enabling direct modeling of spatial proximity, cellular composition, and molecular interactions within tissues to delineate cell niches. Existing approaches can be broadly categorized into two conceptual paradigms, where the first (b), focuses on spatial inference of cell niches based on reconstructed high-resolution cellular composition and molecular features, and the second (c), emphasizes direct modeling and identification of cell niches by jointly utilizing the molecular profiles and spatial information from spatial omics data.
Another more refined strategy infers multicellular coordination states under different conditions by examining changes in cell type proportions or cell-cell interactions (CCI), thereby identifying potential cell niches. This approach has been widely applied to single-cell datasets spanning distinct disease states or interventions. For example, Shao et al. analyzed single-cell transcriptomics on 12 human liver samples procured from four early allograft dysfunction (EAD) and three non-EAD patients post-liver transplantation surgery. Through cell proportion and CCI analysis, they discovered that MAIT cells, GZMB+ GZMK+ NK cells, and S100A12+ neutrophils were significantly enriched and highly activated in EAD patients, revealing an EAD-associated pathogenic immune cell niche[59]. Similarly, Xie et al. analyzed single-cell transcriptomics of first-trimester decidua from women of advanced maternal age (AMA) and controlled reproductive age, uncovering a pathologically remodeled decidual cell niche in the AMA samples characterized by aberrant activation of fibrotic signaling pathways, immune cell dysfunction, and disrupted intercellular communication[60].
With the increasing availability of large-scale single-cell datasets containing hundreds to thousands of samples, computational methods specifically designed to identify recurrent multicellular coordination states across samples or individuals have been developed to infer conserved cell niches (Fig. 2a). Specifically, Luca et al. introduced EcoTyper[61], a machine learning framework that combines statistical learning techniques with the gene expression deconvolution algorithm CIBERSORTx[62] to systematically define cell states and potential cell niches from gene expression data. Applying EcoTyper to large-scale scRNA-seq and bulk RNA-seq datasets spanning 12 major cell lineages across 16 types of human carcinoma, the authors identified 69 transcriptionally-defined cell states and further delineated 10 cohesive cell niches conserved across cancer types and patient samples. Importantly, these cell niches exhibited improved predictive power of the clinical outcome compared with conventional biomarkers. Similarly, Shi et al. developed CoVarNet[63], a non-negative matrix factorization (NMF)-based computational method, and applied it to the high-quality scRNA-seq data containing over 2 million cells from 706 healthy samples across 35 human tissues. They identified 12 cross-tissue coordinated cell niches that exhibited distinct patterns of intercellular communication, age-associated dynamic change, and disruption of organization during cancer progression. Meanwhile, Jerby-Arnon et al. proposed DIALOGUE[64], which combines penalized matrix decomposition (PMD) with hierarchical models to identify coordinated cellular programs in different cell types, decoupling niche-dependent programs from intrinsic cell state programs, and revealing cell niches associated with specific phenotypes.
Collectively, these approaches provide effective computational frameworks for inferring the composition and expression characteristics of potential cell niches in tissues. However, due to the inevitable loss of spatial location information during tissue dissociation and preparation of single-cell suspensions, cell niche analysis based solely on single-cell omics data is inherently indirect. Such analyses rely on quantitative characterization or statistical inference of cellular composition, functional coordination, or interaction patterns, rather than explicitly delineating cell niches within spatial contexts.
Spatial inference strategies for cell niche analysis
-
Spatial omics technologies enable the simultaneous measurement of molecular profiles while preserving the spatial context of tissues, effectively overcoming the intrinsic limitations of single-cell omics approaches. These technologies have demonstrated great potential in elucidating the spatial organization, cellular interactions, and functional characteristics of complex tissues such as the brain or tumor microenvironments. Among them, spatial transcriptomics (SRT), comprehensively reviewed elsewhere[65−69], is one of the earliest developed and most widely recognized modalities. Broadly, SRT strategies can be categorized into next-generation sequencing (NGS)-based and imaging-based approaches, which differ in cellular resolution, transcriptomic coverage, cost, and commercial availability. For example, representative commercial platforms include 10X Visium and Visium HD[70], 10X Xenium[16], Vizgen MERSCOPE[71], NanoString CosMx[72], and Stereo-seq[13]. Beyond transcriptomics, an increasing number of spatial omics technologies have emerged in recent years, including spatial proteomics[14,15,73], spatial metabolomics[74−77], and spatial epigenomics[78−81], further enriching the molecular dimensions available for spatial analysis.
Compared with single-cell omics, spatial omics technologies preserve spatial information explicitly, offering distinct advantages for cell niche analysis. Leveraging this data, a large number of computational methods have been developed to decipher cell niches by modeling spatial proximity, cellular composition, and molecular interactions within tissues. Broadly, existing approaches for cell niche analysis using spatial omics data can be divided into two conceptual paradigms (Fig. 2b, c). The first paradigm focuses on spatial inference, which aims to reconstruct high-resolution cellular composition and molecular features of cell niches from spatial data with limited resolution or transcriptomic coverage by integrating single-cell omics references. The second paradigm emphasizes direct modeling, in which cell niches are explicitly identified by jointly utilizing the molecular profiles as well as spatial information of spatial omics data.
In this section, we review recent advances in computational methods related to the first paradigm. These methods primarily include spatial deconvolution and spatial mapping, which try to address the technical limitations of current spatial omics platforms to delineate fine-grained cellular composition and spatial organization of cell niches within specific anatomical regions, such as lesion-adjacent areas or tissue boundaries.
Spatial deconvolution
-
Spatial deconvolution methods are designed for low-resolution SRT data, in which each capture spot typically contains transcripts from multiple cells, ranging from several to dozens. These methods aim to decompose the mixed transcriptomic signals of each capture spot into contributions from discrete cell subpopulations based on matched scRNA-seq reference data. By estimating the cellular composition of individual spots, spatial deconvolution methods enable a refined characterization of the spatial distribution and co-localization patterns of different cell subpopulations that underpin cell niche organization. For example, Lake et al. generated 10X Visium spatial transcriptomic profiles of human kidney tissues from healthy reference as well as patients with acute kidney injury to chronic kidney disease[42]. Through spatial deconvolution analysis, they identified fibrotic and inflammatory cell niches specifically enriched in cortical injury regions, characterized by the spatial co-localization of fibroblasts, activated stromal cells, and immune populations. Similarly, Kuppe et al. applied SRT and spatial deconvolution to human heart tissues in homeostasis, and after myocardial infarction, revealing the dynamic remodeling of distinct cell niches within the border zones surrounding necrotic areas[82].
Based on their mathematical frameworks, spatial deconvolution methods can be broadly categorized into four classes: regression-based, probabilistic, deep learning-based, and other machine learning-based approaches (Table 1). Regression-based methods represent the earliest class of spatial deconvolution approaches. Their conceptual foundation originates from deconvolution methods initially developed for bulk RNA-seq data[62,83−89] and subsequently extended to spatial transcriptomics. These methods typically model the mixed gene expression profile of each capture spot as a linear combination of characteristic signatures of different cell types derived from scRNA-seq data, and then infer cell type proportions within each capture spot using regression algorithms such as non-negative least squares (NNLS) or dampened weighted least squares (DWLS). A representative example is NMFreg[90], which first applies the non-negative matrix factorization (NMF) algorithm to extract characteristic signatures of different cell types from scRNA-seq data, followed by the NNLS regression to estimate cell type proportions in SRT data. Regression-based methods are generally highly interpretable and naturally guarantee the non-negativity of cell type contributions, which has motivated the development of numerous extensions that enhance robustness and accuracy by improving signature selection or regression strategies. For instance, SPOTlight[91] and Redeconve[92] both build upon the NNLS framework, with SPOTlight incorporating prior biological knowledge via marker gene-guided NMF initialization to improve sensitivity in detecting rare populations, while Redeconve introduces a regularization term based on cell similarity to mitigate gene expression collinearity among transcriptionally similar cell types. spatialDWLS[93] further improves specificity by integrating enrichment analysis with the DWLS regression, whereas SpatialDecon[94] and SONAR[95] replace NNLS regression with log-normal regression and Poisson-Gamma regression coupled with geographically weighted regression (GWR), respectively, to better accommodate the characteristics of SRT data. For tumor microenvironment analysis, Cottrazm[96] and SpaCET[97] respectively utilize tailored DWLS and NNLS regression strategies to enhance the estimation of cell type proportions in tumor SRT data.
Table 1. AI methods for spatial deconvolution.
Method Strategy Underlying AI algorithm Language Ref. NMFreg Regression-based NNLS MATLAB [90] SPOTlight Regression-based NNLS R [91] Redeconve Regression-based Regularized NNLS R [92] spatialDWLS Regression-based DWLS R [93] SpatialDecon Regression-based log-normal regression R [94] SONAR Regression-based Poisson-Gamma regression + GWR R [95] Cottrazm Regression-based DWLS R [96] SpaCET Regression-based NNLS R [97] RCTD Probabilistic modeling Poisson distribution with MLE R [98] stereoscope Probabilistic modeling NB distribution with MAP Python [99] cell2location Probabilistic modeling NB distribution with variational Bayesian inference Python [100] Starfysh Probabilistic modeling Poisson-Gamma distribution with variational inference Python [101] STdeconvolve Probabilistic modeling LDA R [102] STRIDE Probabilistic modeling LDA Python [103] Bulk2Space Deep learning-based VAE Python [104] DestVI Deep learning-based VAE Python [105] SPACEL Deep learning-based VAE Python [106] DSTG Deep learning-based GCN R and Python [107] STdGCN Deep learning-based GCN Python [108] SD2 Deep learning-based GCN + Autoencoder R and Python [109] CellDART Deep learning-based ADDA Python [110] spSeudoMap Deep learning-based ADDA Python [111] TransformerST Deep learning-based Transformer Python [112] AntiSplodge Deep learning-based Feedforward neural network Python [113] UCDbase Deep learning-based Feedforward neural network Python [114] LETSmix Deep learning-based Feedforward neural network Python [115] Tangram Deep learning-based Nonconvex optimization Python [116] CARD Other NMF + CAR R [117] CellPie Other NMF + factor analysis Python [118] Seurat Other Enrichment score R [119] CellTrek Other Random forest R [120] SpaOTsc Other OT Python [121] NovoSpaRc Other OT Python [122] TACCO Other OT Python [123] DOT Other OT R [124] Compared with regression-based methods, spatial deconvolution methods based on probabilistic models explicitly model gene expression counts, batch effects, platform-specific biases, and unobserved sources of variability within a unified probabilistic framework, often achieving improved accuracy in complex situations at the cost of increased computational complexity. A major subclass of these approaches constructs probability distribution models based on a Bayesian statistical framework, which typically assume Poisson, negative binomial (NB), or Poisson-Gamma distributions for gene expression counts and employ maximum likelihood estimation (MLE), maximum a posteriori (MAP), or variational inference for parameter estimation, as exemplified by RCTD[98], stereoscope[99], cell2location[100], and Starfysh[101]. Notably, RCTD and cell2location explicitly introduce a specific random variable to account for platform effects and other sources of natural variability, demonstrating superior performance in cross-platform inference and fine-grained cell type resolution. Another subclass of probabilistic model-based spatial deconvolution methods mainly employ a topic model framework, such as latent Dirichlet allocation (LDA), in which inferred 'topics' are interpreted as latent cell types or functional programs. For example, STdeconvolve[102] applies LDA to perform unsupervised modeling on SRT data directly, followed by a post hoc topic annotation step. In contrast, STRIDE[103] first learns potential functional topic distributions from scRNA-seq reference data, and then transfers the trained model to SRT data, enabling the end-to-end spatial deconvolution analysis without post-processing. However, it should be noted that the biological interpretability of such approaches largely depend on the choice of feature databases and annotation strategies.
With advances in deep learning, deep learning-based spatial deconvolution methods have become increasingly prevalent for modeling complex, high-dimensional datasets. These approaches are particularly effective in capturing nonlinear relationships between scRNA-seq and SRT data, but often exhibit reduced interpretability and increased risk of overfitting when applied to small datasets. Most deep learning-based methods extract latent representations from scRNA-seq and SRT data using neural network architectures and train models on 'pseudo-SRT data' with known cellular compositions generated from scRNA-seq references. Representative examples include VAE-based approaches, such as Bulk2Space[104], DestVI[105], and the Spoint module in the SPACEL[106] toolkit, as well as GNN-based methods, including DSTG[107], STdGCN[108], and SD2[109]. Among these, STdGCN explicitly integrates spatial topology, whereas SD2 employs an autoencoder-based dimensionality reduction to mitigate dropout effects. Additional approaches explore adversarial discriminative domain adaptation (ADDA) models[110,111], transformer architectures[112], and lightweight feedforward neural networks[113−115], highlighting the diversity of neural network architectures in deep learning-based solutions. In contrast, Tangram[116] adopts a different strategy based on nonconvex optimization, learning an optimal mapping matrix between individual single cells and spatial spots with neural networks. By introducing regularization terms that account for variable cell numbers across spots, Tangram not only performs spot-level deconvolution but also enables reconstruction of gene expression patterns within spatial contexts in single-cell resolution.
Beyond the major categories described above, several alternative machine learning strategies have also been proposed. For instance, CARD[117] and CellPie[118] extend the NMF algorithm by incorporating the conditional autoregressive (CAR) modeling and factor analysis, respectively. Seurat[119] provides a marker gene-based scoring approach to estimate relative enrichment of specific cell types within each spot. CellTrek[120] combines joint dimensionality reduction of scRNA-seq and SRT data with random forest models to perform spatial deconvolution. In addition, several early methods based on the optimal transport (OT) algorithm, such as SpaOTsc[121] and NovoSpaRc[122], although not specifically designed for spatial deconvolution analysis have also demonstrated the potential to achieve accurate deconvolution of SRT data by constructing the OT mapping between scRNA-seq and SRT data. Therefore, subsequent studies including TACCO[123] and DOT[124] have further extended this framework to enable more unified and flexible information transfer and interpretation between scRNA-seq and SRT data.
Overall, spatial deconvolution methods provide an effective means to recover cellular composition and spatial co-localization patterns from low-resolution SRT data, laying the foundation for the accurate identification and characterization of cell niches in tissues. However, most existing approaches rely heavily on high-quality matched scRNA-seq reference and primarily focus on estimating cell type proportions rather than reconstructing full molecular profiles at the single-cell resolution. As a result, spatial deconvolution is mainly applicable for characterizing coarse-grained microenvironmental composition, while its ability to resolve fine-scale spatial interactions and dynamic cell niche-associated molecular changes remains limited.
Spatial mapping
-
Similar to spatial deconvolution methods, spatial mapping methods are developed to enhance the effective resolution and quality of spatial omics data. These approaches are primarily designed for imaging-based SRT technologies, such as MERFISH[11], seqFISH[125], and STARmap[126], which offer subcellular spatial resolution and single-molecule sensitivity but typically profile only a limited number of genes, ranging from several hundred to a few thousand, corresponding to approximately 1%−10% of the whole transcriptome. Spatial mapping methods aim to assign individual cells from single-cell omics data to their most likely spatial locations within spatial reference data. By integrating the full transcriptome characteristics from single-cell omics data and the spatial information from spatial reference data, these methods can predict the expression of unmeasured genes in spatial omics data and further reconstruct the high-resolution, spatially resolved single-cell expression maps. In contrast to spatial deconvolution methods, which estimate cell type proportions at the spot level, spatial mapping methods can, in some cases, recover spatial expression profiles at the single-cell level, providing higher precision for analyzing multicellular interactions and cell niche organization. For example, Fan et al. conducted spatial mapping analysis to develop a high-resolution and spatially resolved map of intratumoral expression heterogeneity in cervical squamous cell carcinoma (CSCC), identifying two spatially distinct cell niches corresponding to different stages of squamous differentiation[127]. These cell niches exhibited opposite spatial associations with immune cells and were characterized by different transcriptional signatures and clinical outcomes. Similarly, Wei et al. applied spatial mapping methods to decipher the spatial tumor-immune cell niches of ductal carcinoma in situ (DCIS) tissues, revealing tumor subclones that were restricted to different ducts, and specific T cell states adjacent to the tumor areas[120].
Based on their mathematical frameworks, spatial mapping methods can be broadly categorized into two classes: joint dimensionality reduction-based, and mapping matrix-based approaches (Table 2). Joint dimensionality reduction-based methods project single-cell and spatial omics data into a shared low-dimensional latent space, in which batch effects between platforms are usually removed while biologically meaningful variation is preserved. Within this shared latent space, the expression profiles of unmeasured genes in spatial data can be inferred from neighboring single cells of single-cell data. Early approaches rely on linear dimensionality reduction techniques, including Seurat[119], LIGER[128], Harmony[129], and SpaGE[130], which employ canonical correlation analysis (CCA), NMF, principal component analysis (PCA), or singular value decomposition (SVD) for cross-modality alignment, followed by the k-nearest neighbors (KNN)-based gene expression imputation. Recently, more methods based on nonlinear dimensionality reduction techniques have been proposed to better capture the complex relationships between datasets. For instance, gimVI[131] and stPlus[132] employ the joint VAE framework and autoencoder framework to model scRNA-seq and spatial data, respectively, whereas SpatialScope[133] leverages deep generative models to integrate scRNA-seq and SRT data. Notably, SpatialScope enhances NGS-based SRT data to achieve single-cell resolution and can also infer unmeasured gene expressions for imaging-based SRT data.
Table 2. AI methods for spatial mapping.
Method Strategy Underlying AI algorithm Language Ref. Seurat Joint dimension reduction-based CCA + KNN MATLAB [119] LIGER Joint dimension reduction-based NMF + KNN R [128] Harmony Joint dimension reduction-based PCA + KNN R [129] SpaGE Joint dimension reduction-based SVD + KNN Python [130] gimVI Joint dimension reduction-based Joint VAE Python [131] stPlus Joint dimension reduction-based Autoencoder + KNN Python [132] SpatialScope Joint dimension reduction-based Deep generative model Python [133] SpaTrio Mapping matrix-based OT R and Python [134] SIMO Mapping matrix-based OT Python [135] Tangram Mapping matrix-based Nonconvex optimization Python [116] CellTrek Mapping matrix-based Random forest R [120] SpaOTsc Mapping matrix-based OT Python [121] novoSpaRc Mapping matrix-based OT Python [122] CytoSPACE Mapping matrix-based Convex optimization Python [136] Mapping matrix-based methods aim to learn an optimal mapping matrix between individual cells in single-cell data and spatial locations in spatial reference, thereby assigning cells with whole transcriptomes back to their most appropriate positions in space and enabling the estimation of expression profiles for unmeasured genes. Therefore, compared with joint dimensionality reduction-based methods, these approaches provide more explicit cell-to-location assignments and better preserve spatial continuity and tissue architecture. In most cases, the mapping problem is formulated as an optimization task, in which the optimization function (also called the cost function) is defined based on gene expression similarity or distance metrics between cells and spatial locations, such as Euclidean distance, Pearson correlation, or cosine similarity. For example, SpaTrio[134] and SIMO[135] are both based on the fused Gromov-Wasserstein optimal transport algorithm, and employ the Euclidean distance algorithm to calculate the cost matrix. Several spatial deconvolution methods also support spatial mapping analysis, such as Tangram[116], CellTrek[120], SpaOTsc[121], and novoSpaRc[122]. Moreover, CytoSPACE[136], a recently proposed spatial mapping method, formulates spatial mapping as a convex optimization problem and solves it using the Jonker-Volgenant shortest augmenting path algorithm, achieving global optimality and high computational efficiency.
Collectively, spatial mapping methods establish explicit or implicit correspondences between single-cell and spatial omics data, and offer advantages over spatial deconvolution methods in achieving high-resolution reconstruction of spatial gene expression patterns and cell localization. However, their characterization of cell niches still relies on indirect inference, and the performance is also limited by the quality of the single-cell reference, as well as the intrinsic complexity of tissues.
Direct modeling of cell niches with spatial omics data
-
Unlike spatial deconvolution and mapping methods, which infer cell niches indirectly through estimated cell-type composition or reconstructed spatial gene expression, recently developed direct modeling strategies explicitly treat the cell niche as the fundamental unit for analysis. These methods utilize the molecular profiles as well as spatial information of spatial omics data, jointly to model and identify cell niches in a data-driven manner, demonstrating substantial potential for uncovering spatially organized microenvironments. In practice, direct modeling is most commonly implemented through spatial clustering, where niche-specific representations are learned based on the features of the cell itself and its local spatial context extracted from appropriate cellular neighborhoods, and subsequently partitioned using unsupervised algorithms. The choice of the neighborhood scale typically depends on the resolution of the spatial technology and the biological interest, and can be defined using either a fixed radius, a fixed number of nearest neighboring cells, or graph-based neighborhoods computed by Delaunay triangulation[31].
Based on their modeling principles, spatial clustering methods can be broadly categorized into five classes: probabilistic graphical model (PGM)-based, feature augmentation-based, GNN-based, improved community detection algorithm-based, and neighborhood phenotype-driven approaches (Table 3).
Table 3. AI methods for spatial clustering.
Method Strategy Underlying AI algorithm Language Ref. Giotto PGM-based HMRF R and Python [137] DR-SC PGM-based HMRF R [138] BayesSpace PGM-based Fully Bayesian model R [139] BASS PGM-based Potts model with additional hierarchical
modeling structuresR [140] PRECAST PGM-based Potts model + CAR R [141] SPICEMIX PGM-based NMF-HMRF Python [142] UTAG Feature augmentation Linear weighting Python [145] CellCharter Feature augmentation Neighborhood aggregation Python [32] ClusterMap Feature augmentation Neighborhood aggregation Python [146] BANKSY Feature augmentation Linear combination R and Python [147] SpaGCN GNN-based GCN + DEC Python [148] Spatial-MGCN GNN-based Multi-view GCN Python [149] STMGCN GNN-based Multi-view GCN Python [150] STAGATE GNN-based GATE Python [151] STAligner GNN-based GATE Python [152] DSSC GNN-based GATE Python [153] CCST GNN-based DGI Python [154] SpaceFlow GNN-based Spatially regularized DGI Python [155] SPIRAL GNN-based GraphSAGE Python [156] SEDR GNN-based VGAE + DEC Python [157] scNiche GNN-based M-GAE + GFN Python [36] SPACEL GNN-based GCN + DANN Python [106] DeepST GNN-based Denoising autoencoder + VGAE + DANN Python [158] SpaDAC GNN-based graph attention network (GAT) + CNN Python [159] stMDA GNN-based GCN + CNN + VAE Python [160] GraphST GNN-based GCN with SCL Python [161] MERINGUE Improved community detection algorithm-based Expression graph with spatial weighting + Louvain R [164] SCGP Improved community detection algorithm-based Spatial graph with expression weighting + Leiden Python [165] SpatialLeiden Improved community detection algorithm-based Multiple graph + Leiden Python [166] Schürch's method Neighborhood phenotype-driven Neighborhood cell type frequency matrix + k-means Python [167] Spatial-LDA Neighborhood phenotype-driven Neighborhood cell type frequency matrix + Spatial-LDA + k-means Python [168] CytoCommunity Neighborhood phenotype-driven Neighborhood cell type frequency matrix + GNN Python [169] PGM-based spatial clustering method
-
Early PGM-based spatial clustering methods, such as Giotto[137], DR-SC[138], and BayesSpace[139] commonly assume that spatially proximate cells belong to the same cell niche and employ a Potts model to encourage these cells to have the same label. Among them, both Giotto and DR-SC employ a hidden Markov random field (HMRF) model, whereas BayesSpace implements a fully Bayesian model and performs parameter estimation via the Markov chain Monte Carlo (MCMC) algorithm.
A key assumption underlying these methods is that cells within the same cell niche exhibit homogeneous gene expression profiles. However, this assumption does not fully reflect the biological reality, as a single cell niche often contains diverse cell types, and the same cell type may also participate in multiple cell niches. To address this limitation, subsequent PGM-based spatial clustering methods extend the framework to accommodate more complex neighborhood structures. For example, BASS[140] introduces additional hierarchical modeling structures on top of the Potts model to explicitly model heterogeneous gene expression of different cell types, thus enabling more flexible and effective modeling of spatial omics data. PRECAST[141] employs a conditional autoregressive model for spatial dependence and uses a Potts model for clustering, making it highly effective in aligning data from different tissue slices and resolving spatial structures. SPICEMIX[142] combines the HMRF model with NMF to propose a novel framework, NMF-HMRF. Compared with the original HMRF model, NMF-HMRF uniquely integrates the modeling process of the spatial topology of cells by HMRF with the dimensionality reduction step of gene expression profiles by NMF into a single model, which can unravel the complex mixing of latent intrinsic and spatial factors of heterogeneous cell identity in complex tissues effectively.
PGM-based spatial clustering methods typically exhibit strong biological interpretability. However, their computationally intensive parameter estimation procedures often limit scalability to large spatial datasets.
Feature augmentation-based spatial clustering method
-
Feature augmentation-based spatial clustering methods are motivated by the fundamental biological intuition that a cell's molecular profiles are influenced not only by intrinsic regulation, but also by interactions with neighboring cells[143,144]. Consequently, feature augmentation strategies aim to combine the molecular profiles of the cell itself with those of its neighbors to generate new features that are more representative of the cell niche. Specifically, UTAG[145] integrates the molecular profiles of neighbors into the cell's own molecular profiles using linear weighting, whereas CellCharter[32] and ClusterMap[146] achieve this through neighborhood aggregation. BANKSY[147] adopts a related but distinct strategy by incorporating neighborhood features as additional dimensions rather than direct aggregation, with a specific hyperparameter to tune the contributions of the cells and their local microenvironments.
Feature augmentation-based spatial clustering methods typically involve fewer parameters and are computationally efficient, enabling robust performance and scalability across large datasets. However, overly simplified assumptions and modeling approaches limit their ability to accurately reveal cell niches within complex tissues.
GNN-based spatial clustering method
-
Another widely used strategy for spatial clustering involves utilizing GNN deep learning models. Compared with PGM-based and feature augmentation-based approaches, GNN-based spatial clustering methods provide greater modeling flexibility, but typically involve numerous hyperparameters and are more prone to overfitting. Furthermore, such methods also face limitations in scalability.
SpaGCN[148] is a representative GNN-based spatial clustering method. It integrates gene expression, spatial location, and histological information using a single-layer graph convolutional network (GCN) coupled with a deep embedding clustering (DEC) model to identify cell niches and spatially variable genes. Subsequent studies have extended this single-layer GCN to more complex GNN architectures, including multi-view graph convolutional networks (Multi-view GCNs)[149,150], graph attention autoencoders (GATE)[151−153], unsupervised graph embedding approaches such as Deep Graph Infomax (DGI)[154,155], GraphSAGE[156], and variational graph autoencoders (VGAE)[157], to better capture the complex relationships in spatial omics data. More recently, scNiche[36] further extends GNN architectures by applying a multiple graph autoencoder (M-GAE) coupled with a graph fusion network (GFN) to integrate the multi-view features of the cell into a joint representation of the cell niche, achieving the state-of-the-art niche identification performance across multiple datasets.
Beyond refining GNN architectures, combining them with other deep learning models represents another promising avenue for improvement. For example, the Splane module in SPACEL[106] and DeepST[158] combine GNNs with domain adversarial neural networks (DANN) to eliminate batch effects across multiple tissue sections, enabling the joint analysis of multiple SRT sections. SpaDAC[159] and stMDA[160] integrate GNNs with CNNs to jointly capture transcriptomic similarity and morphological patterns from histology images. Additionally, GraphST[161] proposes a novel graph self-supervised contrastive learning architecture by combining GCNs with self-supervised contrastive learning (SCL) strategies, enabling multiple tasks for cell niche analysis, such as spatial clustering and spatial deconvolution.
Improved community detection algorithm-based spatial clustering method
-
Community detection algorithms, such as Louvain[162] and Leiden[163], are widely used in single-cell omics data analysis to identify cell populations or subpopulations with similar molecular profiles. By integrating the spatial information into the cell similarity graph constructed based on the molecular profiles of cells, these improved community detection algorithms can be extended to cell niche identification. For example, MERINGUE[164] first constructs a cell similarity graph based on the gene expression profiles of cells in SRT data, where each node in the graph represents a cell (or capture spot). Subsequently, to incorporate the spatial information into the similarity graph, MERINGUE applies spatial weighting to the edges of the graph based on the physical proximity between cells, thereby transforming the similarity graph into a spatially informed similarity graph. Finally, MERINGUE directly performs the Louvain algorithm on this spatially informed similarity graph to identify cell niches. In contrast, SCGP[165] adopts an inverse strategy by first constructing a spatial topology graph based on the physical proximity between cells, and then incorporating expression similarity as edge weights, followed by Leiden clustering to identify cell niches.
Beyond edge reweighting strategies, SpatialLeiden[166] further extends the Leiden algorithm by jointly modeling gene expression similarity and spatial adjacency using a multiple graph framework. Specifically, expression similarity and spatial neighborhood relationships are represented as separate graph layers, and clustering is achieved by optimizing a combined modularity objective across layers. This design enables a more flexible balance between transcriptional similarity and spatial continuity, resulting in robust identification of spatial domains across diverse SRT datasets.
Neighborhood phenotype-driven spatial clustering method
-
Neighborhood phenotype-driven spatial clustering methods were initially developed for spatial proteomics data. Compared with the preceding four classes of spatial clustering methods, these approaches exhibit distinct differences in feature utilization, specifically selecting the cellular phenotype (e.g., cell type) labels of cellular neighborhoods as input rather than molecular profiles. Schürch et al.[167] first applied this strategy to the CODEX data from 35 advanced-stage colorectal cancer (CRC) patients with 56 protein markers. Specifically, they annotated 29 cell types based on the expression levels of marker proteins and then quantified the frequency of each cell type within a fixed neighborhood (10 cells) for every cell to construct a 29-dimensional neighborhood cell type frequency matrix. Subsequently, they performed unsupervised clustering on this frequency matrix using the k-means algorithm and identified nine distinct cell niches in the CRC tumor microenvironment. Spatial-LDA[168] improves this framework by applying the LDA model for dimensionality reduction of the frequency matrix, enhancing the robustness of the framework to potential noise. Furthermore, Spatial-LDA modifies the traditional LDA model by introducing spatial proximity priors to promote coherence of microenvironments between nearby cells. More recently, CytoCommunity[169] improves the unsupervised clustering step by innovatively employing a GNN model based on the Minimum Cut (MinCut) algorithm to achieve both unsupervised and supervised identification of cell niches across multiple tissue sections.
Neighborhood phenotype-driven spatial clustering methods offer excellent interpretability by directly linking cell niches to specific cellular compositions. However, these methods may struggle to identify certain cell niches defined by molecular state changes rather than cellular composition, such as the cell niche located at the tumor-immune boundary, where both tumor and immune cells exhibit altered expression profiles[15].
Comparison of AI-driven cell niche analysis methods
-
In this section, we provide a systematic comparison of existing AI-driven cell niche analysis methods from multiple perspectives, including data requirement, inference strategy, interpretability, scalability, robustness, and typical application scenarios (Table 4). Overall, no single method is universally optimal. The choice of an appropriate strategy largely depends on the resolution and modality of the data, the availability of matched single-cell references, and the specific biological questions of interest.
Table 4. Comparison of AI methods for cell niche analysis.
Method Data requirement Inference strategy Interpretability Scalability Robustness Typical application scenario Single-cell-based indirect inference Single-cell data Cell niches are inferred based on multicellular coordination states, without explicit spatial context High; results are directly linked to cell types, conditions, or samples High; scalable to large cohorts High; relatively stable across datasets and parameter settings Preliminary characterization of cell niches, large-scale cohort studies, and cross-condition comparisons Spatial inference strategy: Spatial deconvolution/spatial mapping Single-cell/low-quality spatial data Cell niches are inferred based on reconstructed high-resolution cellular composition and molecular features High; results are driven by biological priors and directly linked to cell types Moderate; depends on inference strategy and
data sizeModerate; affected by batch effects, reference quality, and parameter settings Intuitive and refined descriptions of composition and molecular features of cell niches at the spatial level PGM-based spatial clustering methods Spatial data Moderate to high; clear modeling assumptions and the strong statistical foundation Low to moderate; generally computationally intensive Moderate to high; relatively stable across parameter settings Feature augmentation-based spatial clustering methods Spatial data Moderate to high; interpretability depends on feature design High; generally computationally efficient Moderate to high; simplified modeling assumptions with few parameters, but sensitive to feature design GNN-based spatial clustering methods Spatial data Cell niches are inferred based on direct modeling and unsupervised partitioning by utilizing the molecular profiles as well as spatial information of spatial omics data jointly Low to moderate; results are often difficult to interpret Low to moderate; generally limited by graph size and
GPU memoryLow to moderate; greater modeling flexibility but typically involve numerous parameters and are more prone to overfitting Discovery of previously uncharacterized cell niches
in complex tissues in a
data-driven mannerImproved community detection algorithm-based spatial clustering methods Spatial data Moderate to high; results are interpretable at the community structure level High; generally computationally efficient High; simplified modeling assumptions with few parameters Neighborhood phenotype-driven spatial clustering methods Spatial data High; results are directly linked to cell types and biologically intuitive Moderate to high; depends on inference strategy High; simplified modeling assumptions with few parameters From a methodological perspective, indirect inference methods based on single-cell omics data require only single-cell datasets and are therefore broadly applicable. However, due to the lack of explicit spatial context, these approaches provide a relatively coarse and indirect characterization of cell niches. As such, these approaches are more suitable for preliminary characterization of cell niches, large-scale cohort studies, and cross-condition comparisons. Spatial inference strategies, including spatial deconvolution and spatial mapping methods, integrate single-cell and spatial omics data to reconstruct spatial patterns of cellular composition and gene expression. Compared with indirect inference driven by single-cell data, these approaches offer more intuitive and refined descriptions of composition and molecular features of cell niches, with generally strong interpretability and direct links to known biological knowledge. Nevertheless, their performance critically depends on the quality of the single-cell reference, and the delineation of cell niches remains indirect and constrained by existing biological priors. In contrast, direct modeling strategies, represented by spatial clustering methods, explicitly treat the cell niche as the fundamental unit of analysis and identify potential cell niches in a data-driven manner, making them particularly suitable for discovering previously uncharacterized cell niches in complex tissues. However, as these approaches are typically based on unsupervised learning frameworks, their results can be sensitive to parameter selection and data noise, resulting in relatively limited interpretability.
From an algorithmic perspective, traditional machine learning and statistical models typically possess clear modeling assumptions, the strong statistical foundation, and high interpretability and robustness, while also exhibiting stable computational efficiency and scalability. However, their relatively simplified model structures struggle to fully characterize the complex nonlinear relationships in high-dimensional omics data. Deep learning-based methods, especially GNN models, demonstrate greater flexibility in modeling complex spatial dependencies and multimodal features, achieving leading performance in multiple benchmarking studies[170,171]. However, they also introduce new challenges, including insufficient model interpretability, sensitivity to hyperparameters and random initialization, reproducibility issues across datasets and platforms, overfitting risks, and high computational resource requirements.
Taken together, each AI-driven cell niche analysis method has unique strengths and limitations, and the most applicable method depends on the specific dataset and research objectives.
-
The cell niche, as the functional unit that characterizes the cellular composition, spatial architecture, and functional states within specific tissue regions, emphasizes multicellular coordination and spatial microenvironmental dependence, which is highly consistent with the theoretical basis of holistic regulation and systemic intervention of TCM. In recent years, with the rapid advancement of single-cell omics, spatial omics, and related AI-driven computational methods, cell niche analysis has been gradually introduced into TCM research, demonstrating unique advantages compared to traditional analytical paradigms. In this section, we summarize recent progress in representative scenarios of cell niche analysis in TCM research, including the identification of intervention-associated targets, delineation of dynamic regulatory processes, and elucidation of integrative mechanisms of action. We further discuss the potential translational implications of niche-level insights in TCM research (Fig. 3).
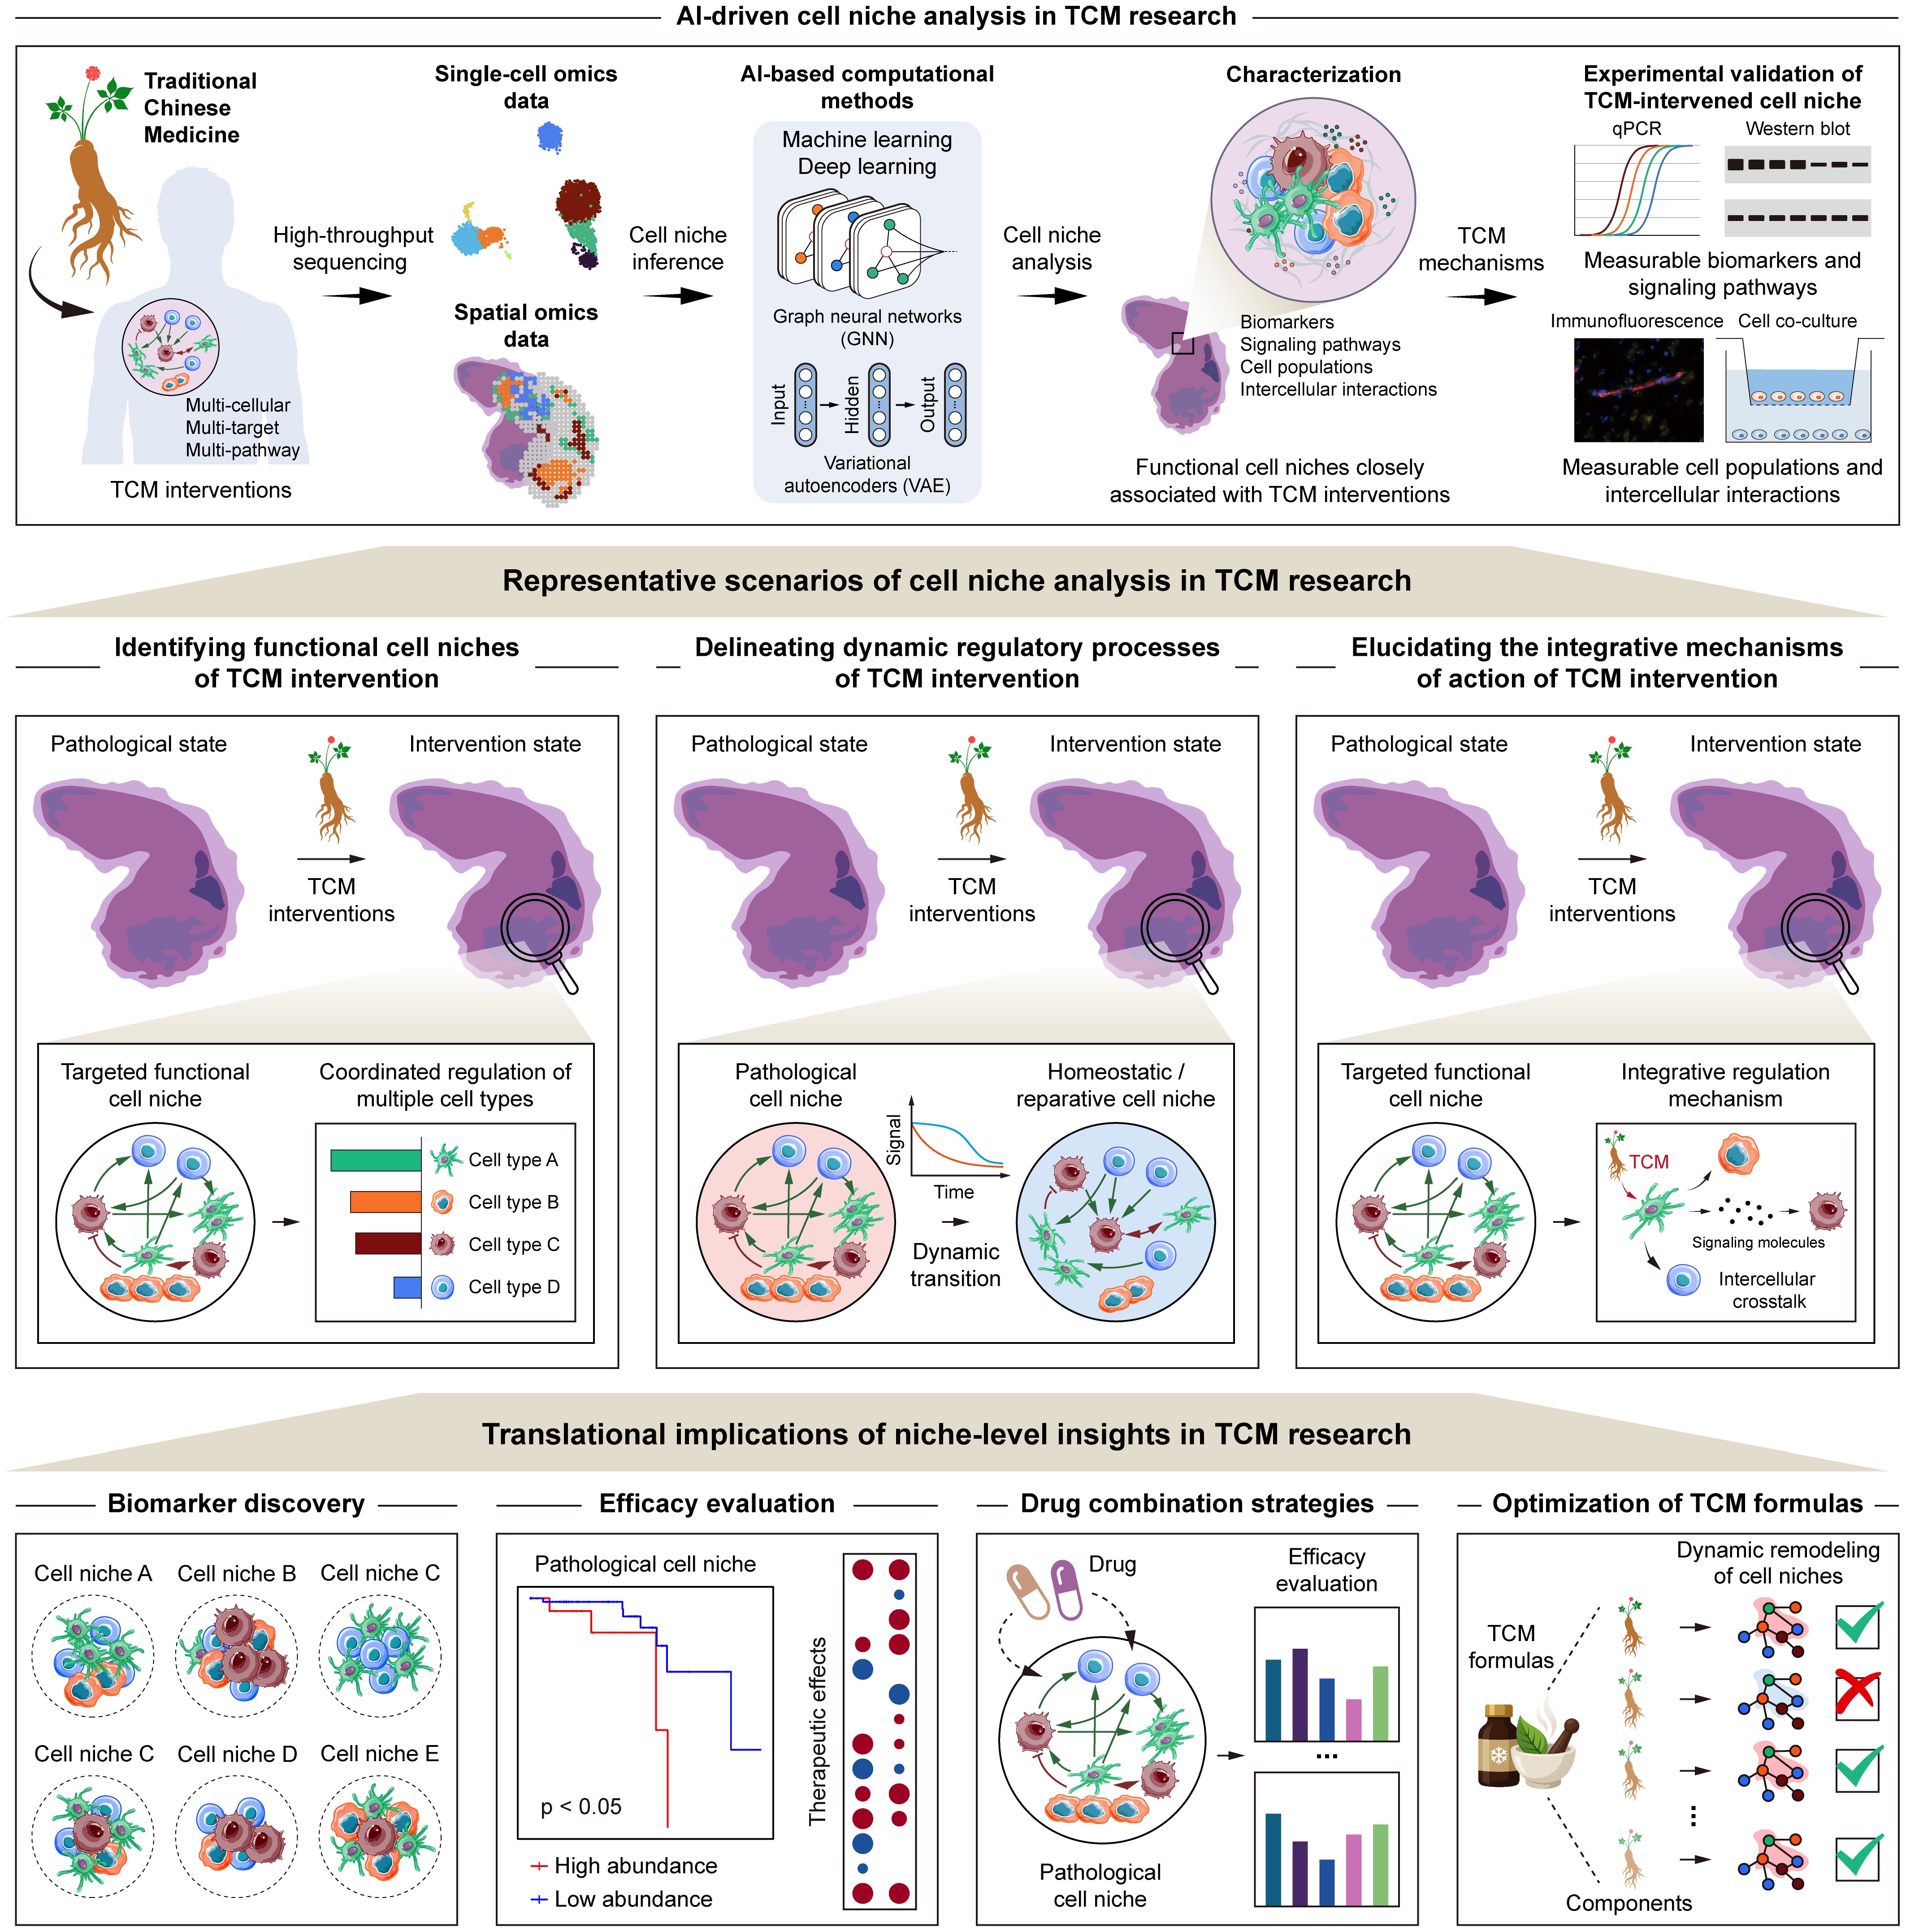
Figure 3.
Representative scenarios and translational implications of AI-driven cell niche analysis in TCM research. AI-driven cell niche analysis provides a systematic framework for investigating the mechanisms of TCM interventions, with three representative scenarios, including identifying functional multi-cellular targets associated with TCM interventions by resolving coordinated cellular architectures within specific spatial contexts, characterizing the dynamic remodeling of pathological cell niches toward homeostatic or reparative states during TCM treatment, and elucidating the integrative mechanisms of action of TCM from a multi-cellular, multi-target, and multi-pathway perspective. The niche-level insights further demonstrate translational implications, offering guidance for the discovery of functional biomarkers, efficacy evaluation, the design of drug combination strategies, and the optimization of TCM formulas.
Identifying functional cell niches of TCM intervention
-
The 'multi-component, multi-target, and multi-pathway' nature of TCM implies that its therapeutic effects are rarely mediated by a single cell type or molecular pathway, but instead arise from coordinated regulation among multiple cell types within defined spatial contexts. Accordingly, identifying functional cell niches closely associated with TCM interventions has emerged as an important entry point for mechanistic interpretation.
Facilitated by advanced AI-driven computational methods, studies on anti-tumor targets represent a classic application of cell niche analysis in TCM research. Previous studies indicate that tumor initiation and progression are often accompanied by complex remodeling of cell niches, particularly the formation of immunosuppressive niches that contribute to immune evasion and may serve as potential therapeutic targets[172,173]. By employing spatial deconvolution strategies, Zou et al.[174] integrated scRNA-seq and SRT data to resolve an immunosuppressive cell niche in the cervical cancer microenvironment, characterized by the spatial co-localization and close interaction of macrophages, neutrophils, and CD8+ T cells. Further analysis demonstrated that the natural compound matrine modulates this specific cell niche, alleviating macrophage-mediated suppression of CD8+ T cells, and restoring their cytotoxic activity to exert anti-tumor effects. This case effectively illustrates the application potential of AI-based spatial inference strategies for cell niche analysis in TCM research. By reconstructing high-resolution cellular composition and molecular features of cell niches, this approach enables the identification of niche-level targets that remain inaccessible to conventional bulk analysis, such as the multicellular spatial co-localization patterns and intercellular interactions. In studies lacking spatial omics data, the TCM intervention-related cell niche can also be characterized through indirect inference based on single-cell data. For example, Yu et al.[175] investigated the synergistic effects of Shenmai injection (SMI) and PD-1 inhibitor in non-small cell lung cancer (NSCLC) using single-cell RNA sequencing data. By inferring multicellular coordination states under different conditions through the analysis of changes in cell type proportions and CCIs, their study reported that SMI can reshape the tumor immune cell niches by enhancing the infiltration of NK cells, where NK cells further recruit dendritic cells and T cells via the XCL1 /XCL2-XCR1 axis and the CXCL10-CXCR3 axis, respectively.
Beyond oncology, cell niche analysis has also been applied to elucidate functional targets of TCM intervention in other disease contexts. For example, using single-nucleus RNA-sequencing (sNuc-seq) and 10X Visium spatial transcriptomics, combined with spatial clustering methods, Lin et al.[176] systematically characterized the cardioprotection of Shexiang Baoxin Pill (SBP) in mice with myocardial ischemia-reperfusion injury, identifying two pathological cell niches located in the infarct and border zones, respectively. The study further revealed that the therapeutic effect of SBP was achieved through the synergistic regulation of endocardial cells, fibroblasts, and macrophages within these niches. Although this work represents an initial attempt; it highlights the potential of data-driven unsupervised clustering strategies for the identification of spatially constrained cell niche targets. In addition, Liu et al.[177] demonstrated via the indirect inference of the cell niche with scRNA-seq data, that Oridonin can remodel the hepatic immune cell niche by suppressing pro-inflammatory characteristics of Kupffer cells, as well as reducing the number of cytotoxic NK cells simultaneously, thereby alleviating septic liver injury.
Delineating dynamic regulatory processes of TCM intervention
-
Beyond the identification of functional cell niches targeted by TCM interventions, delineating the dynamic regulatory processes during TCM treatment is equally important for a comprehensive understanding of its therapeutic effects. By combining with trajectory inference and temporal modeling strategies, cell niche analysis offers a powerful analytical framework to characterize the continuous transition of disease-associated cell niches from pathological states toward homeostatic or reparative states.
For instance, Jin et al.[178] employed scRNA-seq to systematically characterize the temporal diversity and dynamics of cardiac immune cell niches after myocardial infarction (MI). By analyzing the changes in the proportion of various immune cell populations at different time points and integrating trajectory inference approaches, the authors created a dynamic immune landscape after MI. Their results showed that MI induces the coordinated enrichment of multiple pro-inflammatory pathogenic immune cell populations, leading to aberrant remodeling of cardiac immune niches. Treatment with tanshinone IIA markedly mitigated this aberrant remodeling process, inhibiting some detrimental subsets, and progressively shifting the immune niche composition toward a more homeostatic state. This study demonstrates an effective strategy for delineating the dynamic regulation of cell niches under TCM interventions by integrating time-resolved single-cell data with AI-based indirect inference, even in the absence of explicit spatial information.
In contrast, the integration of single-cell and spatially resolved transcriptomic analysis can usually provide more direct evidence. For example, based on the scRNA-seq and SRT data, Shu et al.[179] employed the spatial mapping computational strategy combined with immunofluorescence experiments to identify a pathogenic inflammatory cell niche located within the submucosa in a ulcerative colitis model, characterized by the spatial co-localization of neutrophils and macrophages. Following Tripterygium wilfordii Polyglycosidium (TWP) intervention, this pathogenic inflammatory cell niche was significantly remodeled, accompanied by a decline of S100a8-mediated intercellular communication. Disruption of this inflammatory circuitry dismantled the microenvironmental basis sustaining chronic inflammation, and facilitated a transition of the niche from an inflammatory state toward a mucosal repair-associated state.
Elucidating the integrative mechanisms of action of TCM intervention
-
Cell niche analysis also provides a useful theoretical and methodological framework for systematically elucidating the integrative mechanisms of action of TCM. Compared with traditional analytical paradigms focused on single molecules or cell types, analyses at the cell niche level are better suited to reveal how TCM interventions achieve therapeutic efficacy through the holistic and systematic regulation of the organism.
For example, Zhu et al.[180] investigated the therapeutic mechanism of the natural small molecule celastrol in psoriasis using single-cell multi-omics and spatial transcriptomics. By constructing high-resolution spatial expression patterns of genes using spatial mapping approaches, their study identified a fibroblast-driven inflammatory cell niche in psoriatic lesions, characterized by the spatial co-expression of CCL2 and LRP1. Mechanistic analysis revealed that fibroblasts exacerbate disease progression by secreting CCL2 to promote macrophage recruitment, whereas celastrol was found to act directly on this inflammatory niche by binding to the β-chain of LRP1, which in turn inhibited CCL2 production and blocked fibroblast-macrophage crosstalk, thereby ameliorating psoriasis progression. Similarly, Xin et al.[181] employed spatial transcriptomics to reveal the niche-selective regulatory effects of celastrol in the context of hepatic ischemia-reperfusion (I/R) injury. Based on the spatial deconvolution approaches, their results demonstrated that I/R injury predominantly targets the pericentral zone-dependent cell niche, manifested as a significant reduction in hepatocytes and a coordinated enrichment of pro-inflammatory M1 macrophages, plasma cells, and follicular helper T cells. Celastrol preferentially modulated this cell niche by activating HIF1α signaling and restoring microenvironmental homeostasis. This integrative regulation involves enhanced cellular adaptation to hypoxia, suppression of inflammatory pathways, and a shift in macrophage polarization from a pro-inflammatory (M1) to a reparative (M2) phenotype. Collectively, these studies effectively demonstrate the utility of spatial inference strategies in elucidating the integrative mechanisms of action of TCM interventions by reconstructing high-resolution spatial gene expression patterns or cellular compositions.
Furthermore, Lu et al.[182] investigated the cardioprotective mechanisms of Fufang Danshen Pill (FDP) in myocardial ischemia-reperfusion injury by integrating scRNA-seq and spatial transcriptomics. They comprehensively employed AI-driven cell niche analysis methods, including spatial deconvolution and spatial clustering approaches, to identify and confirm a pathogenic cell niche localized to injured regions from multiple perspectives, providing a complete and thorough analytical workflow for subsequent similar TCM research. Specifically, this pathogenic cell niche was enriched in I/R-injured hearts, and is primarily composed of macrophages with high expression of S100a9. Mechanistic analysis revealed that this cell niche drives mitochondrial dysfunction and sustained inflammatory amplification through the S100a9/TLR4 axis. FDP intervention selectively targeted this cell niche and inhibited the binding of macrophage-derived S100a9 to TLR4 on the surface of cardiomyocytes by reducing the number of macrophages and increasing cardiomyocyte populations. As a result, mitochondrial complexes I and IV activities were restored, reactive oxygen species (ROS) levels were reduced, ATP production was enhanced, and mitochondrial morphology and cristae structure were markedly improved, collectively contributing to alleviating I/R injury.
Translational implications of niche-level insights in TCM research
-
Collectively, cell niche analysis has demonstrated clear utility in elucidating intervention-associated targets, dynamic regulatory processes, and integrative mechanisms of action of TCM. Importantly, by positioning cell niches as the functional multicellular target, this analytical paradigm provides an intuitive and systematic conceptual framework and methodological basis for translating niche-level insights into biomarker discovery, efficacy evaluation, drug combination strategies, and optimization of TCM formulas.
First, the multi-dimensional characteristics of cell niches, including cellular composition, relative abundance, spatial co-localization patterns, and intercellular interaction networks, are more likely to reflect disease-relevant functional states than single molecules or individual cell types, holding promise as more stable and functionally meaningful biomarkers for patient stratification and therapeutic response assessment. For example, an integrated bulk RNA-seq and scRNA-seq analysis of 299 soft tissue sarcoma samples identified a cell niche composed of activated immune cell states, NOSTRIN/PECAM1/CD36+ normal-like endothelial cells, and malignant cells with activation of the KRAS pathway. This cell niche captured classical 'immune hot' tumor features and robustly stratified patients, with high niche abundance being significantly associated with improved clinical outcomes[183]. Similarly, a large-scale study of 571 patients with advanced metastatic disease prior to receiving immune checkpoint blockade, demonstrated that disease-associated niche abundance outperformed numerous single-molecule and single-cell-state biomarkers in predicting immune checkpoint inhibitor response[61]. Together, these findings highlight the potential of niche-level features as promising functional biomarkers for efficacy evaluation.
Second, mechanistic insights at the cell niche level provide a rational basis for designing drug combination strategies. Generally, different drugs or natural compounds may preferentially act on distinct cellular components or interaction axes within the same cell niche, resulting in synergistic effects that are difficult to capture at the single-target level. Recently, Xiao et al.[184] elucidated the combinatorial mechanism of ginsenoside protopanaxatriol (PPT) and icariin (ICA) in alleviating chemotherapy-induced myelosuppression. Their results showed that PPT primarily restored interactions between endothelial cells and mesenchymal stem cells within the bone marrow cell niche, whereas ICA repaired the endosteum by reducing osteoblast apoptosis and promoting osteogenesis. This study exemplifies how niche-level insights can guide rational drug combination strategies based on complementary regulatory mechanisms.
Finally, although studies that optimize TCM formulas based on cell niche analysis remain limited, existing evidence suggests substantial potential. The therapeutic effects of TCM formulas typically arise from coordinated regulation of multiple cell types and interaction networks within specific cell niches. Therefore, systematically delineating the dynamic remodeling of cell niches induced by individual components may facilitate the identification of key functional modules and complementary regulatory axes, thereby providing a mechanism-guided framework for formulation optimization. Such a shift from experience-driven to mechanism-driven design is expected to substantially advance the modernization of TCM.
-
As discussed above, the rapid development of single-cell and spatial omics technologies has substantially advanced cell niche research and provided powerful new analytical perspectives for elucidating the integrative mechanisms underlying the 'multi-component, multi-target, and multi-pathway' action of TCM. However, the systematic application of cell niche analysis in TCM research still faces numerous challenges. These challenges arise not only from inherent technical limitations of single-cell and spatial omics, but also from methodological issues related to robustness and interpretability, which are further amplified by the intrinsic complexity of TCM interventions.
Data-level challenges
-
At the data level, although various sequencing platforms have been developed to generate single-cell and spatial omics data, substantial trade-offs remain among spatial resolution, molecular coverage, tissue compatibility, cost, and infrastructure requirements[31]. A universally applicable approach enabling spatially resolved single-cell whole molecular profiles across diverse tissues has not yet been fully realized. For example, the widely used commercial SRT platform 10X Visium captures transcripts of multiple cells within each capture spot, resulting in inherently mixed expression signals that limit the precise delineation of fine-grained cellular composition and functional heterogeneity of cell niches. In contrast, imaging-based SRT technologies provide superior spatial resolution but are constrained by limited targeted gene panels[66], hindering comprehensive molecular characterization of complex cell niches. These quality limitations of single-cell and spatial omics data pose a particular challenge for resolving subtle but biologically meaningful variations in molecular expression and intercellular interactions within cell niches.
Recent advances, including high-resolution sequencing platforms such as 10X Visium HD[70] and Stereo-seq[13], partially alleviate this trade-off by enabling whole-transcriptome profiling at near single-cell spatial resolution. Nevertheless, their high cost, technical complexity, and reliance on specialized equipment still limit their widespread accessibility in pharmacological and translational studies[185,186]. Computation methods for integrating single-cell and spatial omics data, such as iStar[187], Spotiphy[188], and PanoSpace[189], offer additional opportunities to enhance the quality of the original sequencing data, yet their effectiveness in improving the accuracy and robustness of cell niche inference remains to be systematically evaluated.
On the other hand, single-cell and spatial omics data commonly exhibit high sparsity, dropout effects, and batch effects[190,191]. These data noises further constrain the accurate inference of cell niches. In TCM research, heterogeneous sample sources, and experimental conditions further exacerbate these issues, potentially obscuring the relatively subtle cellular states and transitions induced by TCM's modulatory effects, and reducing reproducibility across studies[3].
Furthermore, compared with fields such as cancer, immunology, and developmental biology, there is still a notable lack of systematically constructed and publicly available single-cell and spatial omics databases related to TCM. Existing data largely originates from isolated individual studies with limited sample sizes, heterogeneous disease models, intervention strategies, and annotation standards, which substantially hampers cross-study integration and methodological benchmarking. This limitation is particularly pronounced for spatial omics data, as high-quality spatial datasets targeting representative TCM syndromes or compound interventions remain scarce, constituting a major data-level bottleneck for the application of cell niche analysis in TCM research.
Methodology-level challenges
-
At the methodology level, existing cell niche analysis methods still face limitations in terms of stability, reproducibility, generalizability, and biological interpretability. As summarized above, spatial clustering methods, which directly model cell niches by utilizing the molecular profiles as well as the spatial information of spatial omics data jointly, have emerged as a primary strategy for niche identification. However, most of them rely on deep learning frameworks and exhibit high sensitivity to hyperparameter selection, neighborhood definition, and random initialization[36,147], leading to substantial variability in inferred cell niches. Most importantly, the robustness and reproducibility of these models across independent datasets, spatial platforms, and tissue contexts have not been systematically evaluated. Many existing methods demonstrate strong performance preferences toward specific datasets but fail to generalize or reproduce consistent results across datasets or platforms[170,171]. These limitations directly compromise the reliability of inferred cell niches as the functional multi-cellular targets and restrict their translational potential in biomarker discovery, drug mechanism elucidation, therapeutic efficacy evaluation, formulation optimization, and other pharmacological applications.
In parallel, many deep learning-based methods, particularly those based on GNN architectures, offer greater flexibility for modeling complex spatial dependencies but typically involve numerous hyperparameters. In high-dimensional, noisy, and often small-sample spatial omics datasets, such models are more prone to overfitting, which further limits their generalizability to real tissue and disease contexts. Moreover, these methods are often highly dependent on computational resources. Tasks such as large-scale graph construction, complex network training, and hyperparameter optimization frequently require high-performance GPUs, substantial memory, and prolonged computation times, which may constrain their accessibility in ordinary laboratory or multi-center research settings. Consequently, future studies should balance performance optimization with systematic considerations of computational resource requirements, cross-dataset robustness assessment, and the establishment of standardized benchmarking frameworks.
In addition, the 'black box' nature of deep learning models, coupled with unsupervised clustering-driven cell niche discovery, often struggles in mechanism interpretation. While these methods may achieve excellent performance in spatial pattern recognition on the simulated data, they frequently lack the ability to trace niche formation back to specific cell subpopulations, signaling pathways, or intercellular interactions. From an AI modeling perspective, most existing approaches are primarily optimized for data-driven spatial pattern fitting rather than explicitly modeling the biological processes underlying microenvironment formation, which fundamentally constrains their interpretability. This limitation is particularly problematic in TCM research, where the modern biological interpretation of the theoretical basis of TCM such as holistic regulation, systemic intervention, and 'Gui Jing' (meridian tropism)[192] urgently requires an interpretable multicellular coordination framework. Therefore, establishing quantifiable and experimentally verifiable links between the results of cell niche analysis and the theoretical basis of TCM remains a major methodological bottleneck.
Application-level challenges
-
At the application level, the complexity of TCM intervention imposes additional demands on cell niche analysis. Unlike gene perturbations or single-target drugs, TCM typically exerts effects through the synergistic regulation of multiple targets and pathways. Such effects are often gradual, distributed, and strongly time-dependent[193], rendering niche-level changes subtle and difficult to capture using static, single-time-point analysis.
Furthermore, many TCM studies involve compound formulas, whose administration and dosing regimens are often dynamically adjusted based on disease progression stages and individual variations[194]. These characteristics often result in limited availability of longitudinal clinical samples and heterogeneous data quality, constraining systematic characterization of the dynamic remodeling process of cell niches. The current analytical paradigm, which primarily relies on cross-sectional comparisons, struggles to fully delineate the continuous trajectory of the cell niche under TCM intervention. This limitation also hinders a deeper understanding of the systemic mechanism of action of TCM.
Future perspectives
-
To facilitate the broader application of cell niche analysis in TCM research, future efforts are expected to prioritize critical bottlenecks that currently limit its translational potential in biomarker discovery, drug mechanism elucidation, therapeutic efficacy evaluation, and other pharmacological applications. Overall, these bottlenecks can be summarized into three key aspects: (1) improving the biological interpretability and experimental verifiability of cell niches as the functional multicellular targets; (2) enhancing the robustness, reproducibility, and generalizability of AI-driven cell niche analysis methods across datasets, platforms, and tissue contexts; and (3) establishing high-quality, publicly available single-cell and spatial omics data resources and analysis frameworks tailored for TCM research.
First, improving the interpretability of cell niches as the functional multicellular targets is a prerequisite for their meaningful application in pharmacology and TCM research. Currently, most cell niche analyses rely heavily on unsupervised spatial clustering, where the definition of cell niches remains largely at the level of data-driven spatial patterns, failing to directly link to specific cell subpopulations, key signaling pathways, or intercellular interactions. As a result, inferred cell niches are often difficult to validate experimentally and interpret mechanistically, limiting the utility of cell niches as actionable pharmacological targets. Therefore, future studies are supposed to integrate multi-modal information from transcriptomics, proteomics, metabolomics, and epigenomics, to comprehensively characterize the molecular basis of multicellular coordination within cell niches from complementary functional dimensions[195,196]. Meanwhile, methodological development in cell niche analysis is expected to move beyond descriptive paradigms dominated by unsupervised clustering toward frameworks that emphasize mechanistic interpretation and causal inference. Explicitly incorporating cell-cell communication networks[197], pathway activity information, and established biological priors into cell niche modeling, together with perturbation-based experimental designs[198] and causal inference frameworks[191] will facilitate the dissection and validation of key regulatory processes underlying niche formation, evolution, and remodeling. Moreover, cross-scale integration of molecular, cellular, and tissue-level data to construct biologically realistic virtual cell or virtual niche models[199] may help bridge the gap between correlative observations and causal mechanisms, thereby providing more robust and experimentally testable insights into TCM-induced niche remodeling.
Second, improving the stability, reproducibility, and generalizability across datasets and platforms is a core technical bottleneck currently hindering the reliable application of AI-driven cell niche analysis methods. Currently, variations in single-cell and spatial omics platforms, sample preparation protocols, and analysis pipelines, coupled with the high sensitivity of deep learning models to data noise, hyperparameter selection, and random initialization, often lead to poor reproducibility of cell niche identification across datasets. These limitations directly compromise the reliability of inferred cell niches. Against this backdrop, future AI-driven cell niche analysis methods should prioritize stability and consistency across diverse data contexts rather than focusing solely on performance optimization. Incorporating biological constraints into model design, reducing dependence on sensitive hyperparameters or random factors, and establishing standardized benchmarking frameworks across platforms and tissues will be essential for providing a more reliable methodological foundation for the broader application of cell niche analysis in pharmacological and TCM research.
Finally, establishing high-quality, publicly available single-cell and spatial omics data resources and analysis frameworks tailored for TCM research will scale up cell niche analysis and enhance its clinical relevance and translational potential. Compared with fields such as cancer, immunology, and developmental biology, TCM-related single-cell and spatial omics databases remain fragmented, with limited standardization in sample sizes, disease models, intervention strategies, and annotation. Future studies may focus on representative TCM syndrome models[200], such as pulmonary Qi-deficiency syndrome, Heart-Blood-Stasis syndrome, spleen-deficient syndrome, and establish large-scale, high-quality single-cell and spatial omics atlases through multi-center collaborations. By implementing standardized and reproducible niche analysis pipelines, it may become possible to quantitatively link cell niche features with experimental models, therapeutic responses, and TCM syndromes. Such efforts could provide a novel technical pathway for the objective and quantifiable characterization of TCM syndromes, ultimately supporting the development of personalized TCM[3].
-
Not applicable.
-
The authors confirm their contributions to the review as follows: conceptualization: Fan X, Shao X; manuscript writing: Qian J, Bao H, Yang H, Zhang J. All authors reviewed the results and approved the final version of the manuscript.
-
Data sharing is not applicable to this review as no datasets were generated or analyzed.
-
This work is supported by New Generation Artificial Intelligence-National Science and Technology Major Project (2025ZD0122805), and the National Natural Science Foundation of China (U23A20513).
-
The authors declare that there is no conflict of interest.
- Copyright: © 2026 by the author(s). Published by Maximum Academic Press on behalf of China Pharmaceutical University. This article is an open access article distributed under Creative Commons Attribution License (CC BY 4.0), visit https://creativecommons.org/licenses/by/4.0/.
-
About this article
Cite this article
Qian J, Bao H, Yang H, Zhang J, Shao X, et al. 2026. AI-driven deciphering of cell niches with single-cell and spatial omics: a new perspective for traditional Chinese medicine research. Targetome 2(2): e009 doi: 10.48130/targetome-0026-0009 

AI-driven deciphering of cell niches with single-cell and spatial omics: a new perspective for traditional Chinese medicine research
- Received: 26 December 2025
- Revised: 23 January 2026
- Accepted: 26 January 2026
- Published online: 05 March 2026
Abstract: The therapeutic effects of traditional Chinese medicine (TCM) are characterized by holistic and systematic regulation of the organism, typically achieved through coordinating tissue microenvironments and multicellular interactions. However, conventional molecular biology approaches struggle to precisely characterize cellular composition, spatial architecture, and associated microenvironment (cell niche) at the tissue level, constraining a comprehensive understanding of the mechanism of action of TCM. In recent years, the rapid advancement of single-cell and spatial omics technologies, together with artificial intelligence (AI)-driven computational methods, has enabled systematic deciphering of cell niches within complex tissues, offering new opportunities for TCM research. Centered on the cell niche, this review outlines its conceptual development and research progress, with a particular focus on recent advances in AI-assisted cell niche analysis based on single-cell and spatial omics data. We further summarize representative scenarios of cell niche analysis in TCM research, while discussing current challenges and future directions, highlighting its potential to provide a new perspective and analytical paradigm in TCM.