













-
The global aging population is experiencing a rapid expansion, accompanied by an increasing prevalence of polypharmacy among older adults due to the presence of chronic diseases affecting multiple systems and organs[1−3]. This widespread use of multiple medications significantly elevates the risk of adverse drug reactions (ADRs) and complications arising from drug-drug interactions[1,4,5]. Consequently, the development of strategies to ensure therapeutic efficacy while minimizing the risks associated with polypharmacy has become a critical concern within the medical community.
The advent of pharmacogenomics (PGx) testing offers a promising solution, providing a more precise and personalized approach to medication management in older adults with polypharmacy[6]. PGx testing enables the prediction of drug response based on an individual's genetic profile, thereby enhancing therapeutic outcomes and reducing the risk of ADRs[7,8]. PGx testing can be conducted preemptively, prior to medication prescription, or reactively, in response to treatment failure or ADRs[9].
In numerous cases, a small number of pharmacogenes can influence the efficacy and safety of drugs across different therapeutic classes in older adults. For example, CYP2C19 genotyping can provide valuable insights for the use of antidepressants, clopidogrel, proton pump inhibitors, and voriconazole[10−14]. Because germline genotypes are stable, a validated PGx result can potentially be reused when relevant medications are prescribed during subsequent episodes of care. This reusability provides a rationale for preemptive multigene panels covering pharmacogenes relevant to medications across multiple therapeutic classes[15,16]. The potential clinical and economic value of such panels may increase as patients encounter additional relevant medications over time, although that value also depends on the medications ultimately prescribed, testing costs, clinical utility, and the implementation setting.
The longitudinal electronic health record (EHR), which tracks patients' medical histories over several years, serves as an optimal platform for integrating PGx data with prescribing episodes[17,18]. Embedded clinical decision support within these records represents a crucial tool for facilitating the integration of pharmacogenomics into routine patient care. Multi-gene PGx testing has the potential to inform numerous prescribing decisions throughout a patient's lifetime[19].
Currently, various health consortiums are actively engaged in the development of pharmacogenomics research and guidelines to advance the use of PGx testing in clinical practice. Consortiums such as the Clinical Pharmacogenetics Implementation Consortium (CPIC)[20,21], the Dutch Pharmacogenetics Working Group (DPWG), the Canadian Pharmacogenomics Network for Drug Safety (CPNDS), and the French National Network of Pharmacogenetics (RNPGx) have published numerous PGx guidelines in recent years[22]. Prior studies have explored the implications and potential of PGx testing across various demographic cohorts, drawing on evidence from CPIC or ClinPGx (the successor to PharmGKB, the Pharmacogenomics Knowledge Base) and including the general population, as well as adult and pediatric subgroups[23−27]. However, annual exposure to multiple drugs with CPIC Level A guidance and the pharmacogenes represented by that exposure have not been well characterized among older adults in China.
Therefore, this study aimed to characterize annual exposure to multiple PGx-related drugs among older adults included in the China Health Insurance Research Association (CHIRA) database. Specifically, we estimated the unweighted prevalence of patient-year records with exposure to at least two or five CPIC Level A drugs within the same calendar year, described the corresponding therapeutic classes and pharmacogenes, evaluated the rank-ordered incremental coverage of pharmacogenes, and compared the listed testing charges for separately billed gene tests vs a combined testing panel under a provincial capped per-locus pricing model.
-
We conducted a retrospective cross-sectional study based on claims data from the CHIRA database for the years 2015−2017[28]. CHIRA, established in 2007, was a nationwide database of anonymized longitudinal medical records covering inpatient and outpatient visits under the urban basic medical insurance scheme in China. The data were derived from a random sampling of local insurance centers across various regions in China, with annual sampling rates of at least 2% from municipalities, 2% from provincial capitals, and 5% from prefecture-level cities. A new sample was drawn in each calendar year, and cross-year linkage was not performed. Patient identifiers were used only to link medication records to patients and construct annual exposure indicators within the same calendar year. The unit of analysis was therefore the patient-year record, and an individual sampled in more than one year could contribute one record in each sampled year. Accordingly, pooled analyses represent aggregated patient-year records rather than unique individuals followed longitudinally. Survey weights and the information required to reconstruct individual selection probabilities were unavailable; all counts, percentages, and prevalence estimates are unweighted descriptions of the CHIRA samples. The 2015−2017 window represented the most recent consecutive years for which a complete, quality-checked CHIRA extract was available at the time of analysis. Given that only anonymized data were extracted from the CHIRA database, neither institutional ethics approval nor informed consent was necessary.
For this analysis, we defined older adults as individuals aged 65 years or older. Medication products were identified by Chinese drug approval number prefixes: H for chemical medicines, J for imported drugs, and S for biopharmaceuticals. CHIRA provided patient ID, age, sex, insurance type, type of healthcare encounter, recorded province, calendar year, discharge diagnosis, and medication product or generic name. No province values were missing in the analytic patient-year sample. Patient IDs were used to identify unique patients. The province variable recorded in CHIRA was used to define economic-region subgroups. Following the National Bureau of Statistics of China classification developed to reflect regional socioeconomic development[29], provinces were grouped into four economic regions: Eastern China (Beijing, Tianjin, Hebei, Shanghai, Jiangsu, Zhejiang, Fujian, Shandong, Guangdong, and Hainan), Central China (Shanxi, Anhui, Jiangxi, Henan, Hubei, and Hunan), Western China (Inner Mongolia, Guangxi, Chongqing, Sichuan, Guizhou, Yunnan, Tibet, Shaanxi, Gansu, Qinghai, Ningxia, and Xinjiang), and Northeastern China (Liaoning, Jilin, and Heilongjiang).
Identification of CPIC Level A drugs and pharmacogenes
-
Medication product and generic names were standardized to active ingredients using product package inserts and a study lookup table based on the US Food and Drug Administration Center for Drug Evaluation and Research active ingredient/moiety concept. Salt, formulation, infusion-solution, and spelling variants were mapped to a common active-ingredient label. For combination products, the active ingredient considered to provide the principal therapeutic effect was extracted and standardized. Products outside the intended medication scope, formulations without systemic exposure, and names that could not be reliably identified were excluded as detailed in Fig. 1. Standardized ingredients were mapped to CPIC Level A drug-gene pairs using the CPIC list dated 28 July 2026 (
www.clinpgx.org/cpic/pairs ).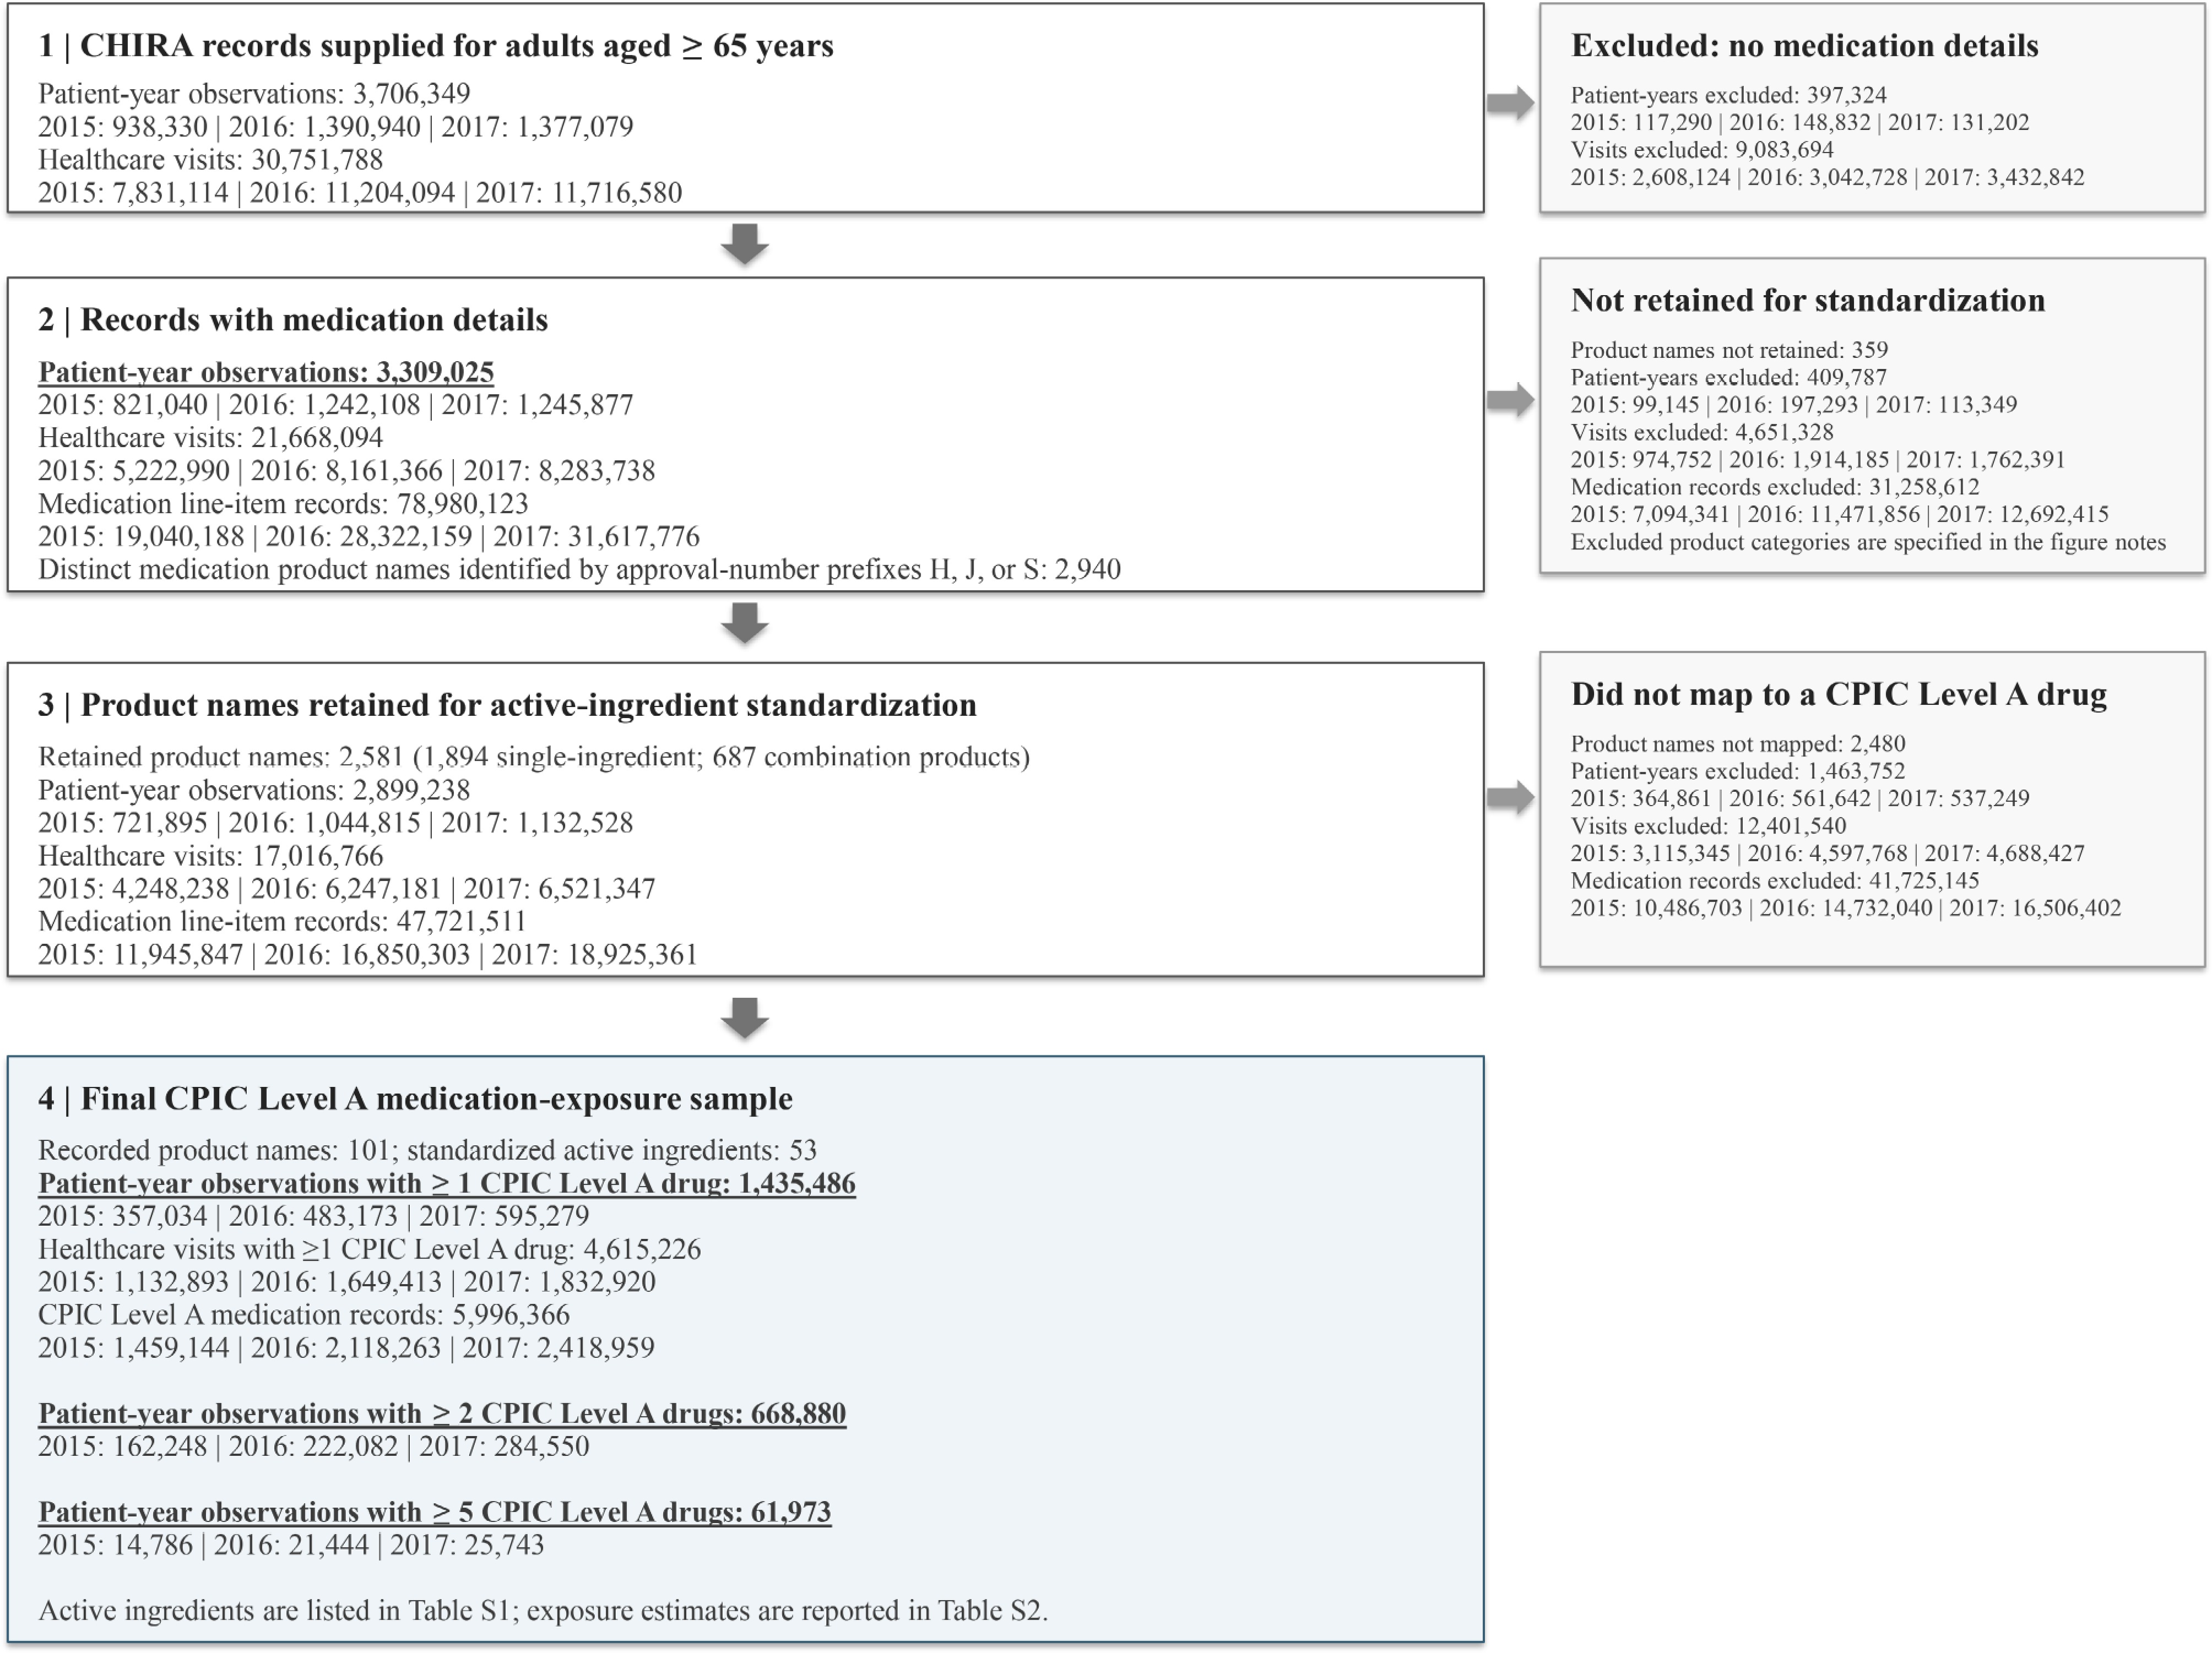
Figure 1.
Selection of patient-year observations and medication records from CHIRA. Notes: Medication products were identified using Chinese drug approval-number prefixes H (chemical medicines), J (imported drugs), and S (biopharmaceuticals). The 359 excluded distinct product names comprised topical or other locally applied preparations; vaccines and immunological products; blood- or tissue-derived products; diagnostic reagents; radiopharmaceutical diagnostic agents or labeling precursors; parenteral nutrition and nutritional-support preparations; infusion fluids, replacement fluids, or nutrient products; disinfectants; and entries whose medication identity could not be reliably determined. CHIRA was sampled each year independently; pooled counts represent patient-year observations, not unique individuals across years. Province was complete in the analytic sample, and no exact duplicate medication line-item records were identified. Product-name counts refer to distinct names, not claims.
In total, 53 active ingredients with CPIC Level A guidance were retained and mapped to 19 pharmacogenes. Eighteen of these pharmacogenes had non-zero exposure in the ≥ 2-drug or ≥ 5-drug samples, and were included in the pharmacogene prevalence and rank-ordered coverage analyses. For therapeutic-class analyses, each active ingredient was assigned to one of 20 study-defined categories based on its primary clinical indication. To improve the interpretability of results and avoid fragmented presentation of categories with sparse representation, eight low-frequency categories (anticoagulants, antifungals, antileprotic drugs, antimalarial drugs, antiplatelet agents, antihypertensives, gout medications, and muscle relaxants) were merged into the group 'Others', resulting in 13 final groups for presentation. This approach retained clinically distinct, frequently represented therapeutic classes[23,26] and enabled consistent comparisons across the overall, year-stratified, and economic-region-stratified analyses. The complete ingredient-class-pharmacogene mapping is provided in Supplementary Table S1.
Exposure definition and handling of repeated prescriptions
-
The primary exposure of interest was multiple PGx-drug exposure, which was defined as the dispensing of two or more distinct CPIC Level A drugs to the same individual within one calendar year. We selected the ≥ 2-drug threshold to maintain consistency with existing literature on polypharmacy and PGx prescribing[23,30,31]. We additionally analyzed a stricter secondary exposure threshold of ≥ 5 distinct CPIC Level A drugs dispensed to an individual within one calendar year, to allow comparison with previous studies and characterize patients with more intensive exposure[23,30,31]. Both thresholds are presented side-by-side throughout the Results section.
No exact duplicate medication line-item records were identified in the raw extract. Repeated dispensing of the same standardized active ingredient to the same patient within a calendar year was retained in the raw line-item data. For construction of annual exposure indicators, each patient-year-drug pair contributed once to the number of distinct CPIC Level A drugs, regardless of refills or in-hospital re-orders. If multiple drugs mapped to the same pharmacogene, the patient-year record contributed only once to that pharmacogene. Prevalence per 1,000 therefore reflects distinct annual patient exposures rather than the number of prescriptions or line items.
Comparison of listed PGx testing charges
-
We systematically reviewed PGx testing fee schedules across all provinces in China, and selected the capped per-locus schedule used in Zhejiang Province as an illustrative pricing model for this analysis[32−34]. Under this schedule, the listed fee was 400 CNY (~US
${\$} $ ${\$} $ ${\$} $ Statistical analysis
Baseline characteristics
-
We used descriptive statistics to summarize the baseline demographic, care-setting, insurance, and regional characteristics of patient-year records meeting the ≥ 2-drug and ≥ 5-drug exposure thresholds. Categorical variables (including sex, age group: 65–79 vs ≥ 80 years, proportion of outpatient vs inpatient encounters, geographic region, and insurance type) were reported as counts and percentages, while continuous variables (mean age, average number of medications per patient, and prescription volume) were reported as means. Patient characteristics were tabulated separately for 2015, 2016, and 2017, along with pooled descriptive summaries across all annual patient-year records.
Prevalence of exposure to CPIC Level A drugs by drug and therapeutic class
-
For 2015, 2016, and 2017, we estimated the unweighted annual prevalence of patient-year records with exposure to ≥ 1, ≥ 2, or ≥ 5 CPIC Level A drugs. Prevalence for specific drugs and specific therapeutic classes was expressed per 1,000 patient-year records. We conducted year-stratified analyses for individual drugs and therapeutic classes at the ≥ 2 and ≥ 5 exposure thresholds. For economic-region analyses, all eligible patient-year records in each region were used as the denominator. These analyses are descriptive comparisons conducted within CHIRA, rather than population-projected regional estimates.
Pharmacogene-level exposure prevalence and rank-ordered incremental coverage
-
We mapped CPIC Level A drugs to corresponding pharmacogenes based on the CPIC drug-gene pair list updated on July 28, 2026. A pharmacogene is counted once for a patient-year record if the patient was dispensed at least one CPIC Level A drug that maps to this gene. Exposure prevalence specific to each pharmacogene is reported per 1,000 patient-year records. Rank-ordered incremental pharmacogene coverage was assessed by adding pharmacogenes successively in descending order of exposure prevalence and recalculating the proportion of multi-exposed patient-year records represented by at least one included pharmacogene. This is a cross-sectional coverage measure across an ordered gene set and does not represent accumulation of exposure or benefit over time. Analyses were repeated by calendar year and economic region at both exposure thresholds. Genetic testing was not an eligibility criterion, and no individual-level genotype or phenotype data were available; all pharmacogene findings were derived solely from medication exposure and CPIC mappings. All analyses were conducted using StataNow/MP 19.5 for Windows (StataCorp LLC, College Station, TX, USA).
Comparison of the cost of single-gene testing vs multigene panel testing under the capped per-locus pricing model
-
Drawing on the three pharmacogenes with the highest exposure-based coverage, we compared the listed charge for three separately billed gene tests with that for one combined panel under the specified capped per-locus pricing schedule.
-
After the record selection process, a total of 3,309,025 patient-year observations from the three independently sampled annual CHIRA datasets were included in the analysis, with 821,040 observations from 2015, 1,242,108 from 2016, and 1,245,877 from 2017 (Fig. 1). In pooled unweighted summary statistics, 1,435,486 observations (43.4%) had exposure to at least one (≥ 1) CPIC Level A drug, and 668,880 observations (20.2%) had exposure to two or more (≥ 2) CPIC Level A drugs. Among the 668,880 patient-year observations with exposure to ≥ 2 drugs, 61,973 (9.3%) had exposure to ≥ 5 drugs. These observations exposed to ≥ 5 drugs accounted for 1.9% of all patient-year observations in total (Supplementary Table S2). At every exposure threshold, the prevalence was the highest in the Eastern sample and the lowest in the Western sample. Specifically, the prevalence of ≥ 1-drug exposure was 59.3%, 51.6%, 31.3%, and 53.8% in Eastern, Central, Western, and Northeastern China, respectively; the corresponding prevalence was 33.5%, 25.6%, 11.1%, and 25.4% for ≥ 2 drugs, and 4.3%, 2.2%, 0.6%, and 1.9% for ≥ 5 drugs (Supplementary Table S3). The groups with exposure to ≥ 2 drugs and ≥ 5 drugs had broadly similar age and sex distributions: 51.5% and 53.3% of participants were male, the mean ages were 74.6 and 75.1 years, and 25.0% and 27.6% of participants were aged 80 years or older, respectively. Compared with the group exposed to ≥ 2 drugs, patient-year observations in the group exposed to ≥ 5 drugs were more likely to come from the Eastern sample (53.9% vs 39.0%), more frequently involved hospitalization (90.6% vs 75.2%), and had a higher proportion covered by Urban Employee Basic Medical Insurance (78.8% vs 69.4%). In contrast, the Western sample accounted for 15.6% and 27.6% of the ≥ 5-drug group and the ≥ 2-drug group, respectively. Between 2015 and 2017, both mean age and sex distribution showed little variation within each exposure group. However, the proportion of observations from the Eastern sample dropped in 2017: for the ≥ 2-drug group, it fell from 43.5%–44.4% in 2015–2016 to 32.2%, and for the ≥ 5-drug group, it decreased from 60.8%–61.1% to 43.9%. The annual proportion of observations involving hospitalization ranged from 72.3%–78.3% in the ≥ 2-drug group and 88.8%–92.7% in the ≥ 5-drug group, while Urban Employee Basic Medical Insurance coverage ranged from 65.7%–72.6% for the former and 73.2%–83.4% for the latter (Supplementary Tables S4 and S5).
Prevalence of exposure to multiple CPIC Level A drugs
-
Among patient-year records exposed to at least 2 CPIC Level A drugs, atorvastatin was the most frequently prescribed medication (84.2 per 1,000 records), followed by the proton pump inhibitors (PPIs) omeprazole (76.3 per 1,000 records) and pantoprazole (69.5 per 1,000 records), and then clopidogrel (67.6 per 1,000 records). Under the ≥ 5-drug threshold, pantoprazole (11.9 per 1,000 records) and omeprazole (11.7 per 1,000 records) were the two most frequently prescribed (Fig. 2). When stratifying the analysis by year, atorvastatin still remained the most frequently prescribed drug at the ≥ 2-drug threshold, while pantoprazole and omeprazole retained the top positions at the ≥ 5-drug threshold (Supplementary Fig. S1). Although the absolute prevalence of exposure varied across different economic regions, stratified analyses at the individual drug level showed that the overall prescription composition was broadly similar. Atorvastatin, omeprazole, pantoprazole, and clopidogrel remained the main contributors to overall CPIC Level A drug exposure (Supplementary Fig. S2).
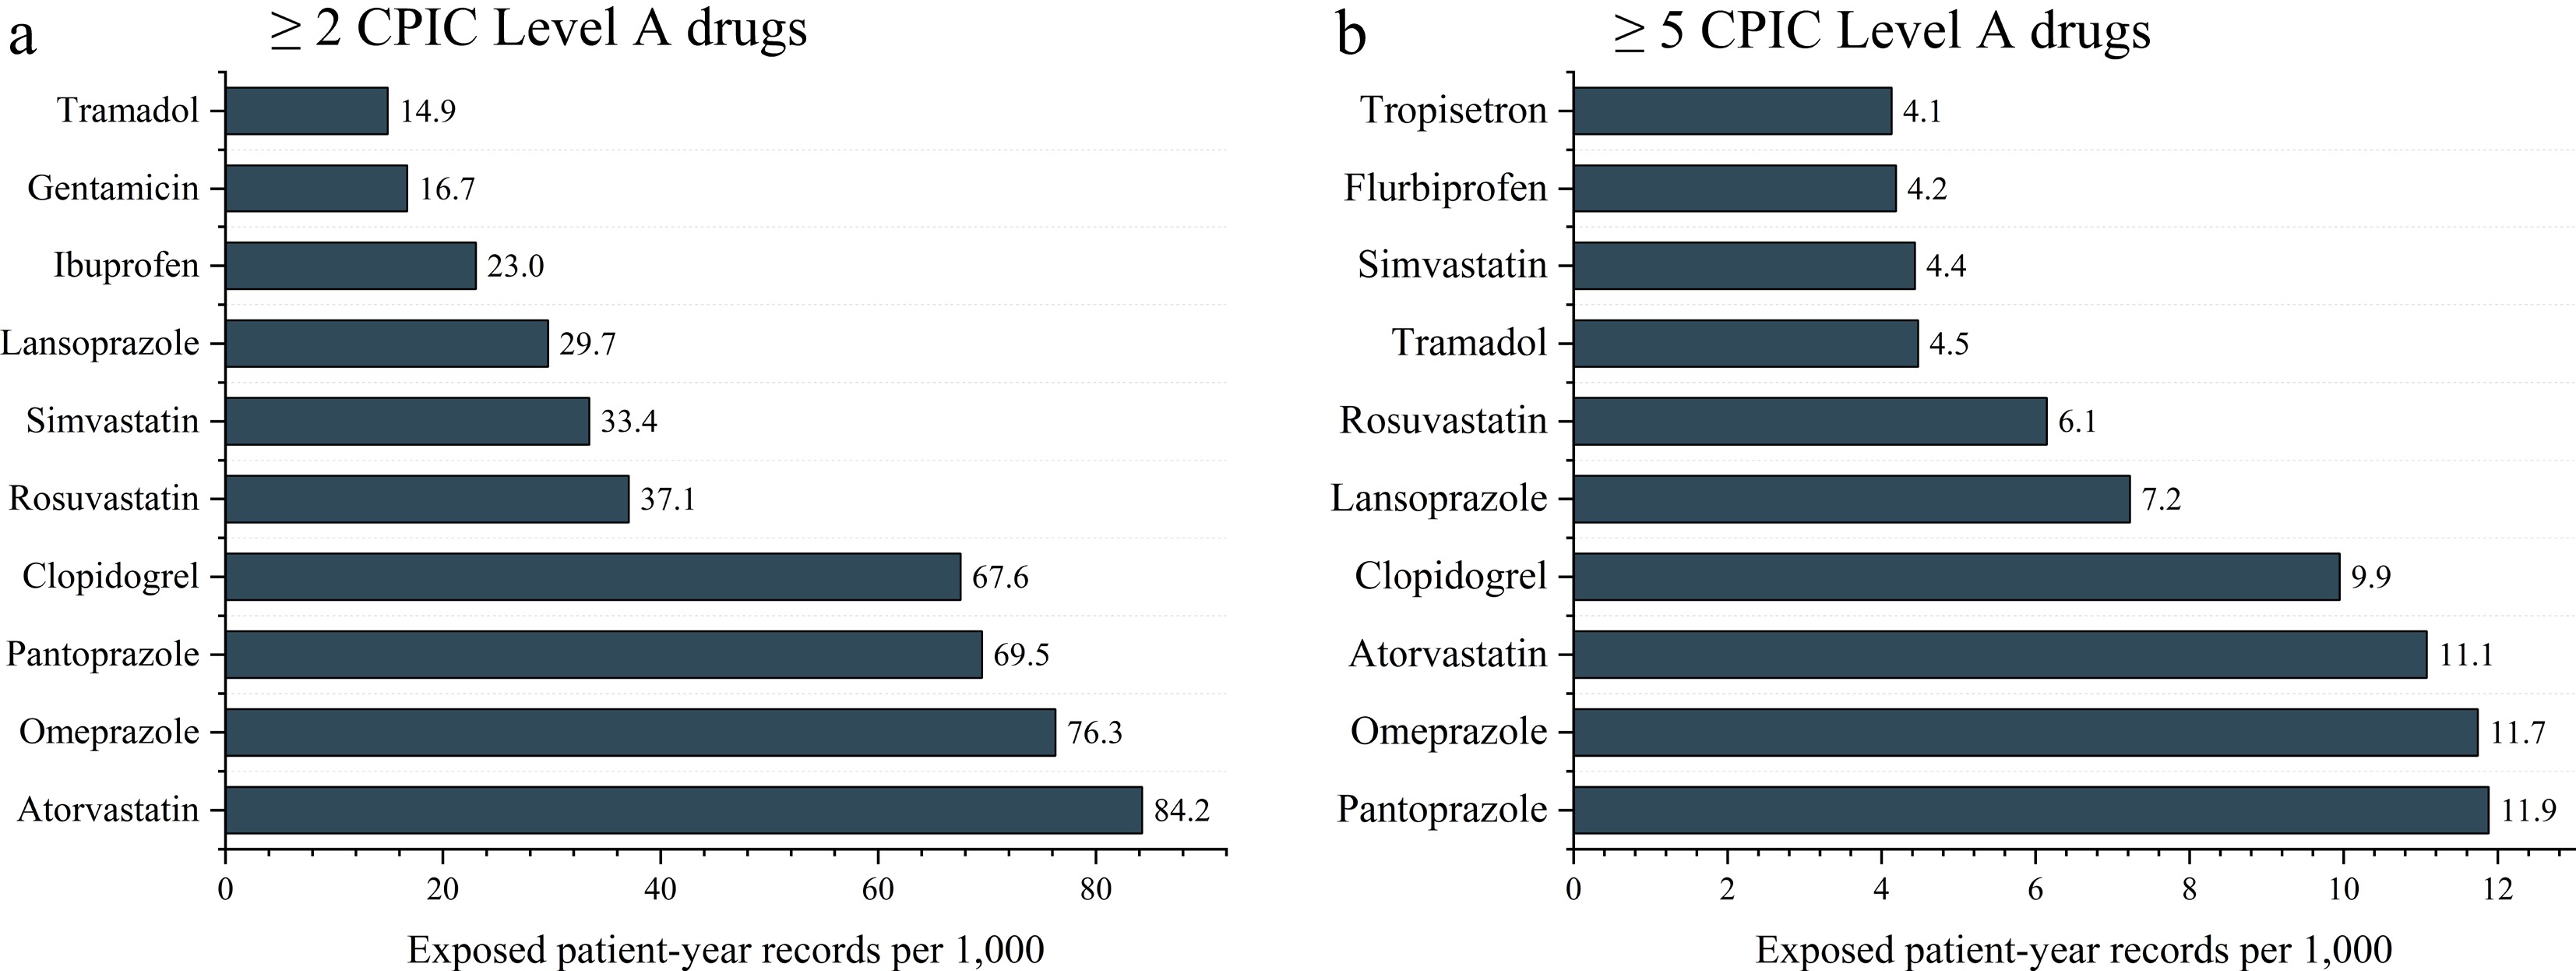
Figure 2.
Unweighted observed prevalence (per 1,000 older-adult patient-year records) of exposure to the ten most frequent CPIC Level A medications in the CHIRA samples. (a) ≥ 2-drug threshold. (b) ≥ 5-drug threshold. CPIC, Clinical Pharmacogenetics Implementation Consortium.
Prevalence of exposure to multiple CPIC Level A drugs by drug class
-
Figure 3 presents the unweighted exposure prevalence of CPIC Level A medications grouped by therapeutic class. At both the ≥ 2-drug and ≥ 5-drug thresholds, statins, proton pump inhibitors (PPIs), and the combined 'Others' category were the three most prevalent groups, with NSAIDs ranking fourth. This ranking stayed consistent across all study years (Supplementary Fig. S3), and statins and PPIs remained the dominant therapeutic classes across all sampled economic regions (Supplementary Fig. S4).
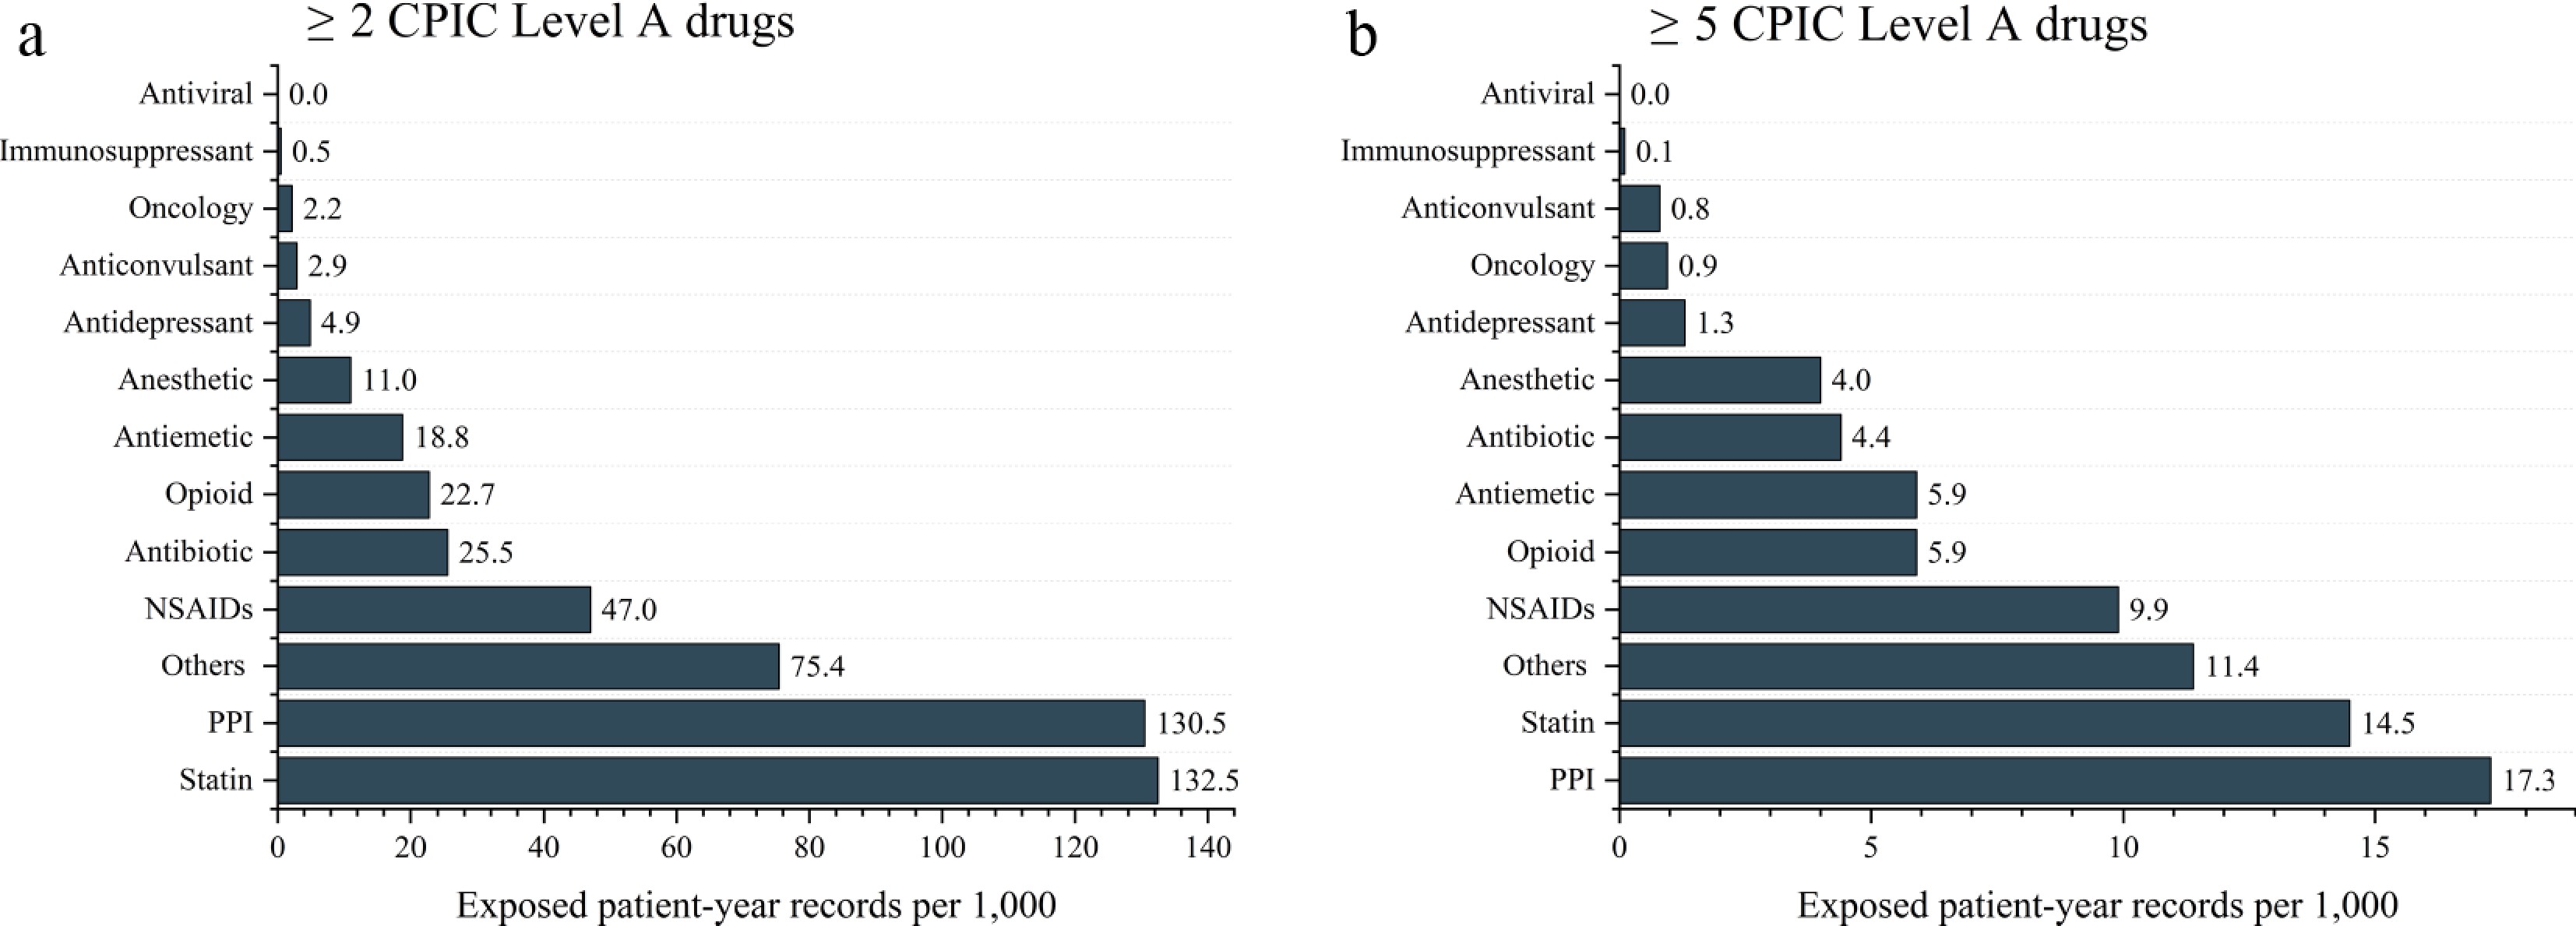
Figure 3.
Unweighted observed prevalence (per 1,000 older-adult patient-year records) of exposure to CPIC Level A medications, grouped by therapeutic class, derived from the CHIRA samples. (a) Results for the ≥ 2-drug threshold. (b) Results for the ≥ 5-drug threshold. The 'Others' category includes anticoagulants, antifungals, antileprotic drugs, antimalarial drugs, antiplatelet agents, antihypertensives, gout medications, and muscle relaxants. Abbreviations: CPIC, Clinical Pharmacogenetics Implementation Consortium; NSAID, non-steroidal anti-inflammatory drug; PPI, proton pump inhibitor.
Pharmacogene-level exposure and rank-ordered incremental coverage
-
Among patient-year records with exposure to ≥ 2 or ≥ 5 CPIC Level A drugs, the top pharmacogenes mapped to the exposures were CYP2C19, SLCO1B1, CYP2C9, CYP2D6, and ABCG2 (Fig. 4). This rank order remained stable across all calendar years (Supplementary Fig. S5), and CYP2C19, SLCO1B1, and CYP2C9 stayed the top-ranked pharmacogenes in all four sampled economic regions (Supplementary Fig. S6).
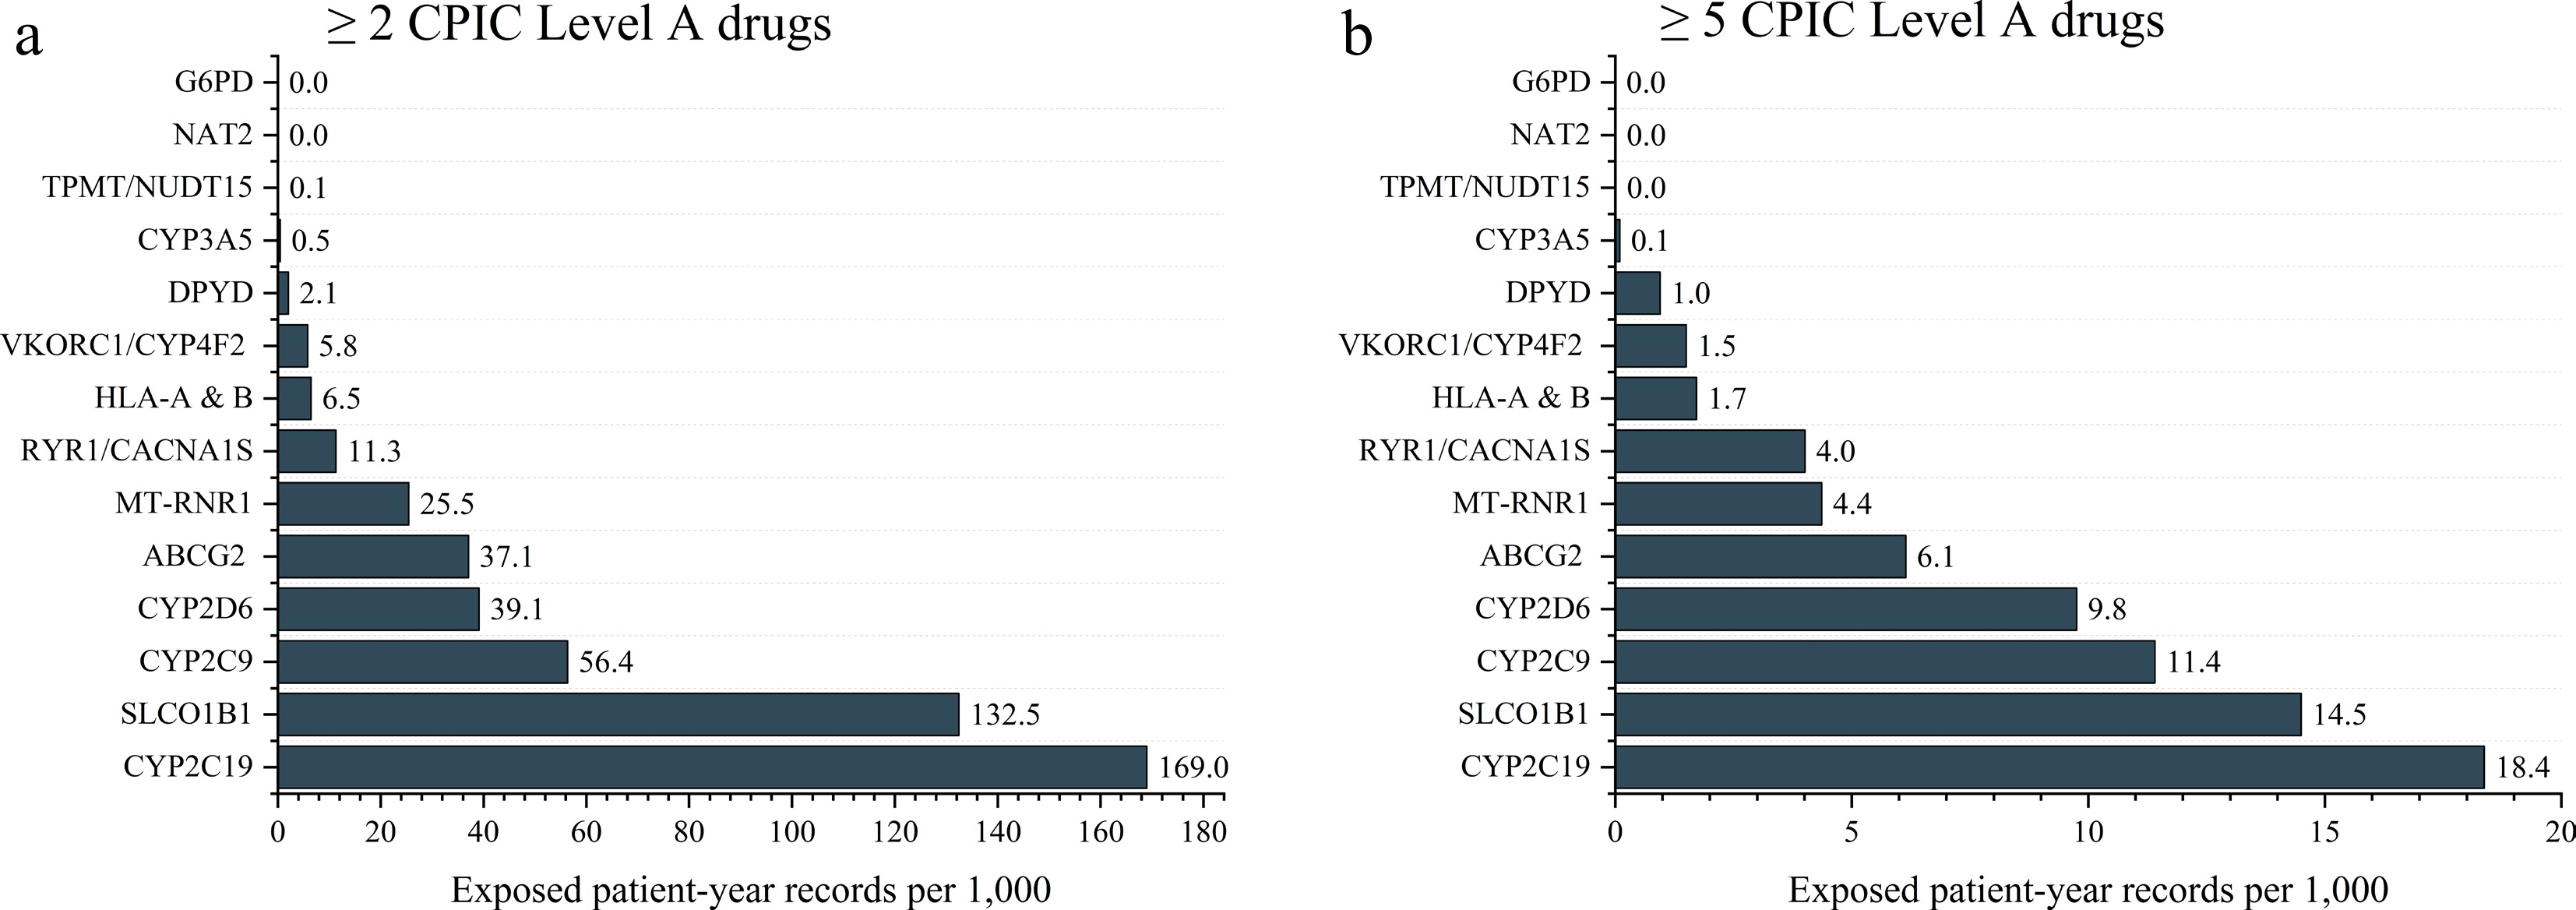
Figure 4.
Unweighted observed prevalence (per 1,000 older-adult patient-year records) of exposure to CPIC Level A medications, grouped by pharmacogene, from the CHIRA samples. (a) Results for the ≥ 2-drug threshold. (b) Results for the ≥ 5-drug threshold. Abbreviation: CPIC, Clinical Pharmacogenetics Implementation Consortium. Gene symbols follow the nomenclature standards of the Human Genome Organization Gene Nomenclature Committee.
Figure 5 presents the rank-ordered incremental coverage across the 18 pharmacogenes with non-zero exposure in the multi-exposed samples. At the ≥ 2-drug threshold, CYP2C19 and SLCO1B1 together covered approximately 96% of patient-year records, and the combined coverage rose to at least 98% after adding CYP2C9. At the ≥ 5-drug threshold, the top-ranked pharmacogenes reached nearly 100% coverage. This non-temporal coverage pattern was consistent across different study years (Supplementary Fig. S7) and all sampled economic regions (Supplementary Fig. S8).
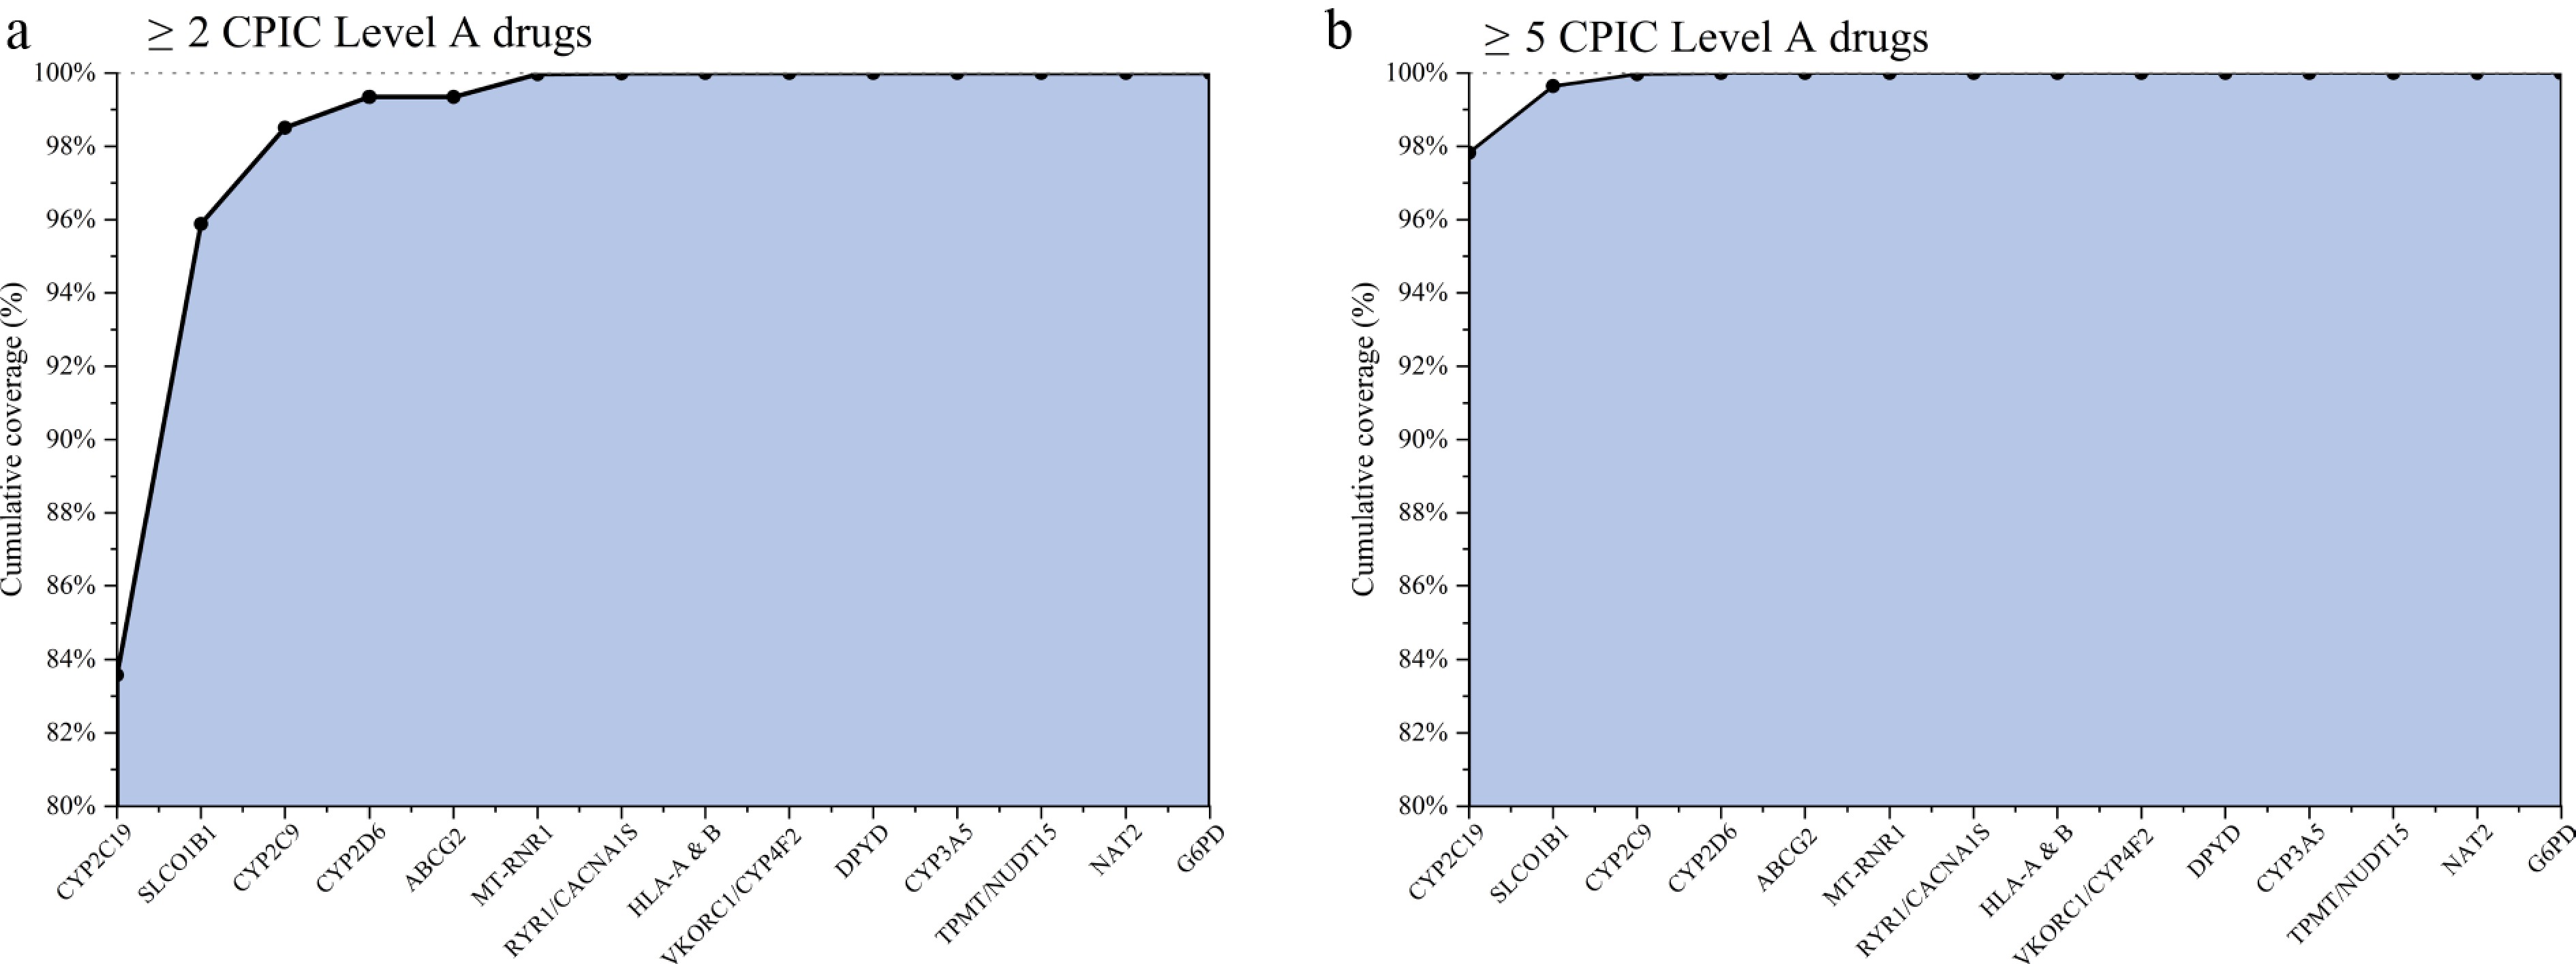
Figure 5.
Rank-ordered incremental pharmacogene coverage of annual multi-exposed patient-year records from the CHIRA samples. Pharmacogenes were added in descending order of exposure prevalence; this cross-sectional measurement does not reflect cumulative exposure over time. (a) Results for the ≥ 2-drug threshold. (b) Results for the ≥ 5-drug threshold. Gene symbols follow the nomenclature standards of the Human Genome Organization (HUGO) Gene Nomenclature Committee.
Comparison of the cost of single-gene testing vs multiple-panel testing under the capped per-locus pricing model
-
The listed-charge comparison focused on three clinically significant genes (CYP2C19, SLCO1B1, and CYP2C9), covering at least 11 core loci[20]. We estimated the cost implications for the minimum gene/allele panel (CYP2C19: *2, *3, *17; SLCO1B1: c.521T>C, c.388A>G; CYP2C9: *2, *3, *5, *6, *8, *11) under the capped per-locus pricing model[20]. Table 1 illustrates fee structures for single-gene and multi-gene panel tests under the capped per-locus pricing model. This model calculates costs based on the total loci analyzed. For example, testing CYP2C19 (3 loci) is priced at 800 CNY (~US
${\$} $ ${\$} $ ${\$} $ ${\$} $ Table 1. Comparison of costs between single-gene testing and multi-gene panel testing under the capped per-locus pricing modela.
Model of test chargesb Charges Notes Overall charges (1) Single gene testing CYP2C19 (*2, *3, *17) CNY 400 × 1 + CNY 200 × (3–1) = CNY 800 3 loci CNY 2,800 (~US$ {\$} $387) SLCO1B1 (c.521T>C, c.388A>G) CNY 400 × 1 + CNY 200 × (2–1) = CNY 600 2 loci CYP2C9 (*2, *3, *5, *6, *8, *11) CNY 400 × 1 + CNY 200 × (6–1) = CNY 1,400 6 loci (2) Multiple panel testing CYP2C19 (*2, *3, *17),
SLCO1B1 (c.521T>C, c.388A>G),
CYP2C9 (*2, *3, *5, *6, *8, *11)CNY 400 × 1 + CNY 200 × (11–1) = CNY 2,200 11 loci, up to a maximum of CNY 2,200 CNY 2,200 (~US$ {\$} $304) a MINIMUM gene/allele panel includes CYP2C19 (*2, *3, *17), SLCO1B1 (c.521T>C, c.388A>G), CYP2C9 (*2, *3, *5, *6, *8, *11), total 11 loci[28−30]. b PGx medical testing pricing model (Zhejiang Province): capped per-locus pricing. A base fee of CNY 400 (~US$ {\$} $55) applies to the first locus, and each additional locus costs an extra CNY 200 (~US$ {\$} $28), with the total charge capped at CNY 2,200 (~US$ {\$} $304). -
In the unweighted annual CHIRA samples, 20.2% of patient-year records from older adults recorded exposure to at least two CPIC Level A drugs within a single calendar year, while 1.9% recorded exposure to at least five. Among records that already met the threshold of at least two CPIC Level A drugs, 9.3% met the threshold of at least five. Atorvastatin, omeprazole, and pantoprazole were the most commonly exposed medications, and statins and proton pump inhibitors (PPIs) were the most prevalent therapeutic classes. CYP2C19, SLCO1B1, and CYP2C9 accounted for the majority of all mapped medication exposure.
Compared with previous international studies, the CHIRA samples similarly found frequent exposure to CPIC Level A medications, though the absolute prevalence estimates varied across study populations and research designs. In pooled CHIRA patient-year records, 20.2% met the ≥ 2 drug exposure threshold and 1.9% met the ≥ 5 threshold within a single calendar year. Schildcrout et al. reported corresponding estimates of 40.1% and 5.9% over a 5-year observation period at Vanderbilt University Medical Centre[31], while Kimpton et al. reported 47% and 7% among English primary care patients aged 50−99 years[30]. Chanfreau-Coffinier et al. found that 15.3% of US Veterans Health Administration pharmacy users received two CPIC Level A drugs[23], and Samwald et al.[35], reported estimates of 27.5% and 2.8% among Medicare beneficiaries aged ≥ 65 years. Differences in observation windows, age distributions, healthcare settings, sampling approaches, weighting methods, and drug inclusion criteria mean that direct numerical comparisons between studies are not feasible.
The composition of drug exposure also differed across studies. Atorvastatin, omeprazole, pantoprazole, and clopidogrel were the most prominent medications in our cohort; by contrast, Schildcrout et al. identified simvastatin, metoprolol, esomeprazole, warfarin, atorvastatin, and clopidogrel[31] as the most common, while Smith et al. reported clopidogrel, simvastatin, warfarin, tramadol, and escitalopram[27]. Metoprolol was excluded from the present analysis because it did not satisfy the CPIC Level A inclusion criterion. Cardiovascular and gastroprotective medications predominated in the CHIRA cohort, whereas pain-related and psychiatric PGx medications contributed more substantially in several Western cohorts. These differences may stem from variations in clinical prescribing practices, care settings, population age structures, sampling designs, and drug-inclusion criteria across studies.
At the pharmacogene level, our findings are consistent with results from previous medication utilization studies, which show that a relatively small number of genes account for the majority of PGx-relevant prescribing. In a UK primary care study, three key pharmacogenes (CYP2C19, CYP2D6, and SLCO1B1) together covered more than 95% of patients aged 50–99 years[30]. Genotype-based studies offer complementary evidence: 96% of 5,408 Australian patients carried at least one actionable variant in CYP2D6, CYP2C19, CYP2C9, or VKORC1[36], and 99% of 1,013 Mayo Clinic participants carried an actionable variant in CYP2D6, CYP2C19, CYP2C9, VKORC1, or SLCO1B1[37]. In CHIRA, the corresponding core gene set comprised CYP2C19, SLCO1B1, and CYP2C9, while CYP2D6 made a smaller contribution. Collectively, these studies support the potential efficiency of targeted multigene testing, and differences in the composition of core pharmacogenes across studies most likely reflect variations in medication use, prescribing practice, healthcare settings, and study designs. Population-specific allele frequencies also influence the expected clinical yield of any resulting testing panel, which underscores the need to tailor panel composition to the target population and its corresponding healthcare system.
The concentration of clinically relevant variation in CYP2C19, SLCO1B1, and CYP2C9 was consistent with the pharmacological characteristics of the drug list we observed, and supports prioritization of these three genes for older Chinese patients. CYP2C19 is the main cytochrome P450 isoform responsible for bioactivating clopidogrel, and also mediates the metabolism of all major proton pump inhibitors, including omeprazole, pantoprazole, lansoprazole, esomeprazole, and rabeprazole[13,38]. The loss-of-function CYP2C19 *2 and *3 alleles have a combined frequency of approximately 30%−35% in East Asian populations, a rate substantially higher than that in Europeans, which results in a larger proportion of intermediate and poor metabolizers among older Chinese adults, corresponding to a higher risk of clopidogrel non-response[38]. SLCO1B1 encodes the hepatic uptake transporter OATP1B1, which mediates the rate-limiting step for statins (notably atorvastatin and simvastatin) to enter hepatocytes. The reduced-function SLCO1B1 c.521T>C (rs4149056) variant elevates systemic statin exposure several-fold and is the principal pharmacogenomic determinant of statin-associated myopathy[39]. CYP2C9 loss-of-function alleles modulate the metabolism of warfarin and multiple non-steroidal anti-inflammatory drugs[40,41]. The convergence of these three genes on the drug classes that account for the majority of our prevalence estimates, namely statins, proton pump inhibitors, antiplatelets and anticoagulants, therefore reflects biological and pharmacological coupling rather than coincidence. This convergence is particularly impactful for older adults, as diminished hepatic and renal reserve, drug-drug interactions, and pharmacokinetic variability all amplify the effects of any additional pharmacogenomic perturbation.
The economic-region subgroup analysis adds important socioeconomic context to these findings. Although the absolute prevalence of exposure to multiple CPIC Level A drugs differed across the four economic regions, with the highest estimates in Eastern China and the lowest in Western China, the leading drugs, drug classes, and pharmacogenes were broadly consistent across regions. In particular, CYP2C19, SLCO1B1, and CYP2C9 remained the core pharmacogenes in all four regions, and their cumulative coverage was similar to that in the pooled national analysis. This consistency supports the potential nationwide relevance of a targeted panel anchored on these pharmacogenes, while the variation in absolute exposure suggests that the scale and setting of implementations may need to be adapted to regional service capacity and prescribing volume. The observed differences may reflect regional variation in disease burden, healthcare access, hospital utilization, insurance arrangements, formularies, prescribing practice, socioeconomic development, or the composition of the CHIRA sample; however, the descriptive claims data do not allow these explanations to be distinguished. Furthermore, this economic-region classification should not be interpreted as a natural geographic division or as a measure of genetic ancestry.
The concentration of annual mapped exposures in a small number of pharmacogenes may help define candidate panels for prospective evaluation. The inpatient and insurance distributions provide descriptive context for identifying populations and care settings for such evaluation. Panel composition and implementation strategies would additionally depend on current prescribing data, genotype frequencies, validated clinical outcomes, workflow feasibility, and prospective evidence of patient benefit. Prospective implementation would also require structured reporting of PGx results and integration with electronic health records and clinical decision support so that validated results can be retrieved when relevant medications are prescribed.
Artificial intelligence based on routinely collected images may complement medication-exposure analyses and broaden access to precision-diagnostic triage. Self-supervised or contrastive-learning approaches such as CTransPath and RetCCL demonstrate how large archives of unlabeled histopathology images can be used to learn transferable representations for classification and whole-slide retrieval, while the CHIEF pathology foundation model extends this approach across cancer detection, tumor-origin identification, molecular-profile characterization, and prognostic prediction[42−44]. Related task-specific and multimodal studies illustrate the breadth of possible downstream applications. PROGPATH combines whole-slide histopathology features with routinely collected clinical variables for pancancer prognostic stratification[45]; the HiCervix dataset and HierSwin benchmark support hierarchical cervical-cytology screening[46]; FMDet addresses cross-center domain variation in mitosis detection[47]; and SAC-Net uses weak supervision to reduce the annotation burden for nuclei segmentation[48]. Beyond computational pathology, DeepComp integrates routine computed tomography features with clinical variables for preoperative complication and survival risk stratification, illustrating how image representations and structured clinical data can be combined in a clinically oriented model[49]. Collectively, these approaches show how routinely generated images may contribute to biomarker screening, patient stratification, and diagnostic triage when linked with clinical information. A future PGx implementation pathway could combine these AI capabilities with medication histories and electronic health records. Annual exposure indicators and longitudinal prescribing information could first identify patients likely to encounter drugs with actionable PGx guidance; image-derived representations and structured clinical variables could then refine prioritization according to the anticipated timing and clinical context of treatment. Selected patients would proceed to confirmatory molecular PGx testing, with validated results stored in the electronic health record and delivered through clinical decision support when a relevant medication is prescribed. The complete AI-assisted pathway should ultimately be evaluated using patient-centered and implementation outcomes, including testing uptake, turnaround time, prescribing changes, adverse drug events, equity of access, and budget impact.
Building on these implementation considerations, the listed charge comparison provides a China-specific illustration of how panel composition interacts with a capped per-locus fee schedule. Under the Zhejiang pricing model (Table 1), the listed charge was CNY 2,200 for the combined 11-locus panel and CNY 2,800 for three separately billed gene tests, corresponding to a difference of CNY 600. This difference arose from the structure of the fee schedule: additional loci were billed incrementally until the per-test cap was reached, whereas separate gene-test orders were charged independently. Within this model, consolidating clinically relevant loci into a single panel can therefore carry a lower upfront listed charge than ordering several gene tests separately. It may also reduce repeated ordering and provide results relevant to medications across different therapeutic classes, although the practical implications depend on the panel content and local testing workflow. International experience further illustrates that the affordability of PGx testing is shaped by both test pricing and reimbursement arrangements. In Australia, commercially available single-gene and multigene tests have been reported at AUD
${\$} $ ${\$} $ ${\$} $ ${\$} $ This study had several limitations. First, CHIRA was independently sampled each year, cross-year linkage was not performed, and pooled analyses used patient-year records rather than unique individuals followed longitudinally. Second, survey weights were unavailable; all estimates are unweighted descriptions of the CHIRA samples and may be affected by differential sampling probabilities and sample composition. Third, pharmacogenetic testing was not an eligibility criterion, and CHIRA does not include individual genotypes or phenotypes. Pharmacogene findings therefore reflect medication exposure mapped to CPIC drug-gene pairs and cannot be interpreted as actionable-variant or metabolizer-phenotype prevalence. Validated clinical outcomes were also unavailable, so clinical benefit was not assessed. Fourth, data covered 2015−2017, and prescribing patterns may have changed despite stable rankings in year-stratified analyses. Fifth, laboratory values were unavailable and diagnostic coding, particularly for outpatient encounters, was insufficient for a validated comorbidity index; renal function, disease burden, drug-drug interactions, and other determinants could not be adjusted. Sixth, available patient descriptors were limited to age, sex, insurance type, encounter type, province, and year. Economic-region aggregation could not capture within-region variation or explain observed differences and should not be interpreted as geography or genetic ancestry. Seventh, annual exposure was not classified as concurrent vs sequential, and rank-ordered pharmacogene coverage is non-temporal; neither measure represents lifetime exposure or cumulative benefit. Eighth, the listed-charge comparison used one provincial fee schedule and did not evaluate healthcare costs, quality-adjusted life-years, budget impact, or cost-effectiveness.
-
In unweighted annual CHIRA samples, annual exposure to multiple CPIC Level A drugs is common among older-adult patient-year records. CYP2C19, SLCO1B1, and CYP2C9 account for the majority of all mapped medication exposure and remain the most relevant pharmacogenes across calendar years and the economic regions sampled. These findings identify a small core set of pharmacogenes that warrant prospective evaluation when developing targeted PGx testing strategies for older adults in China.
-
Only anonymized information was accessed from the CHIRA database, so institutional ethics approval and informed consent were not required. During the preparation of this work the author(s) used AI-assisted technologies (deep seek) to improve readability and language of the work. After using this tool/service, the authors reviewed and edited the content as needed and took full responsibility for the content of the publication.
-
The authors confirm contribution to the paper as follows: study conception and design: Nie X; investigation: Hu X, Zhao Y; formal analysis: Hu X; software: Hu X, Zhao Y; data curation: Hu X, Wang X, Wang G, Zhang X, Dong W; data interpretation: Nie X, Lu C; visualization: Hu X; resources: Jin P, Guan X, Shi L; draft manuscript preparation: Hu X, Nie X; writing – review & editing: Hu X, Zhao Y, Wang X, Wang G, Zhang X, Dong W, Jin P, Guan X, Shi L, Nie X, Lu CY. All authors reviewed the results and approved the final version of the manuscript.
-
The de-identified participant data cannot be made publicly available, as it contains information that could compromise the privacy of research participants. However, the software code and population-level data can be provided to other researchers upon reasonable request to the corresponding author, Nie X.
-
The authors have no conflicts of interest to declare.
-
accompanies this paper online at: https://doi.org/10.48130/targetome-0026-0043.
- Supplementary Table S1 CPIC Level A active ingredients, therapeutic classes, and mapped pharmacogenes used in the final analysis.
- Supplementary Table S2 Unweighted exposure of patient-year records to CPIC Level A drugs in CHIRA, by year.
- Supplementary Table S3 Unweighted exposure of patient-year records to CPIC Level A drugs in CHIRA, by sampled economic region.
- Supplementary Table S4 Characteristics of patient-year records exposed to at least two CPIC Level A drugs in CHIRA, 2015-2017 (N = 668,880).
- Supplementary Table S5 Characteristics of patient-year records exposed to at least five CPIC Level A drugs in CHIRA, 2015-2017 (N = 61,973).
- Supplementary Fig. S1 Year-stratified unweighted prevalence of exposure to the 10 most frequent CPIC Level A medications among older-adult patient-year records in CHIRA.
- Supplementary Fig. S2 Economic-region-stratified unweighted prevalence of exposure to the 10 most frequent CPIC Level A medications among older-adult patient-year records in CHIRA.
- Supplementary Fig. S3 Year-stratified unweighted prevalence of exposure to CPIC Level A medications by therapeutic class.
- Supplementary Fig. S4 Economic-region-stratified unweighted prevalence of exposure to CPIC Level A medications by therapeutic class.
- Supplementary Fig. S5 Year-stratified unweighted prevalence of exposure to CPIC Level A medications by pharmacogene.
- Supplementary Fig. S6 Economic-region-stratified unweighted prevalence of exposure to CPIC Level A medications by pharmacogene.
- Supplementary Fig. S7 Year-stratified rank-ordered incremental pharmacogene coverage of annual multi-exposed patient-year records.
- Supplementary Fig. S8 Economic-region-stratified rank-ordered incremental pharmacogene coverage of annual multi-exposed patient-year records.
- Copyright: © 2026 by the author(s). Published by Maximum Academic Press on behalf of China Pharmaceutical University. This article is an open access article distributed under Creative Commons Attribution License (CC BY 4.0), visit https://creativecommons.org/licenses/by/4.0/.
-
About this article
Cite this article
Hu X, Zhao Y, Wang X, Wang G, Zhang X, et al. 2026. Exposure to multiple drugs with actionable pharmacogenetic biomarkers among older adults in China: a retrospective analysis. Targetome 2(5): e044 doi: 10.48130/targetome-0026-0043 

Exposure to multiple drugs with actionable pharmacogenetic biomarkers among older adults in China: a retrospective analysis
- Received: 29 April 2026
- Revised: 10 August 2026
- Accepted: 19 August 2026
- Published online: 10 September 2026
Abstract: This study aimed to estimate the annual prevalence of exposure to multiple CPIC Level A drugs among older adults included in the China Health Insurance Research Association (CHIRA) samples, assess the rank-ordered incremental pharmacogene coverage, and compare the listed testing costs under a specified provincial capped per-locus pricing model. We conducted a retrospective cross-sectional analysis using independently sampled 2015–2017 claims files from CHIRA, focusing on individuals aged ≥ 65 years. Because cross-year patient linkage was not available, the patient-year record was used as the unit of analysis, and all estimates remained unweighted. We evaluated 53 active ingredients with CPIC Level A guidance, which were included in the CPIC list updated on 28 July 2026 and detected in the analytical medication mapping. The primary exposure was the dispensing of two or more distinct CPIC Level A drugs within a single calendar year, and we also performed an additional analysis with a secondary threshold of five or more distinct drugs. Pharmacogenes were matched from CPIC drug-gene pairs, and we then assessed rank-ordered incremental pharmacogene coverage. We compared the listed charges of separately billed gene tests vs a combined testing panel under the capped per-locus pricing model. Across 3,309,025 patient-year records, 20.2% included exposure to two or more CPIC Level A drugs within a single calendar year. Among these records, 9.3% had exposure to five or more drugs (accounting for 1.9% of all patient-year records). Among patients prescribed two or more CPIC Level A drugs, atorvastatin was the most common drug (84.2 per 1,000 patient-year records), while among patients prescribed five or more CPIC Level A drugs, pantoprazole was the most frequent (11.9 per 1,000 patient-year records). CYP2C19, SLCO1B1, and CYP2C9 accounted for more than 95% of all mapped exposure among multi-exposed patient-year records. Under the specified capped per-locus fee schedule, the combined gene testing panel had a listed charge of CNY 2,200, while the listed charge of three separately billed gene tests was CNY 2,800. In unweighted annual CHIRA samples, annual exposure to multiple CPIC Level A drugs is common among older adult patient-year records. CYP2C19, SLCO1B1, and CYP2C9 account for the majority of all mapped medication exposure, which highlights that a small core set of pharmacogenes warrants prospective evaluation for the development of targeted pharmacogenomics testing strategies.
-
Key words:
- Geriatric /
- Pharmacogenomics /
- Multiple exposure /
- Potential clinical implications