


-
No-till systems have emerged as one of the most effective strategies for increasing the sustainability of agriculture in tropical and subtropical regions by minimizing soil and nutrient losses through erosion. No-till systems are based on three fundamental principles: (1) The absence of soil disturbance, (2) permanent maintenance of soil cover with plant residues, and (3) crop rotation[1]. In Brazil, soybean (Glycine max [L.] Merrill) is the most important commercial crop grown during the spring–summer season.
Under long-term no-till systems, stratification in soil chemical attributes normally occurs from the surface towards the subsoil. Such stratification results in an increase in acidity in subsurface layers and in a strong nutrient availability gradient, with the highest concentrations found in the topsoil, which decrease abruptly in the soil's deeper layers[2,3].
Crop rotation, including the use of cover and grain crops, has been an important strategy for effective soil protection under no-till systems. At the same time that crop rotation diversifies the production system, there is also greater balance in the dynamics of the decomposition of crop phytomass, optimization of the use of fertilizers, and greater water storage in the soil[4,5]. The use of different cover species, single or in consortia, has proven to be beneficial in increasing organic carbon stocks and improving nutrient cycling[3,6,7].
The effectiveness of soil exploration by the plant root system depends on the soil's chemical properties, mainly the presence of calcium (Ca), which has low mobility in plants, and the level of acidity throughout the soil profile[8,9]. Associated with soil Ca levels, increases in nutrient stocks, such as phosphorus (P) and magnesium (Mg), have been shown to be among the essential components for maximizing crop yield and stabilizing the carbon binding with iron (Fe) and aluminum (Al) oxides in deep soil layers[10].
In no-till systems, although surface application of lime is an effective practice in correcting acidity and increasing the availability of Ca and Mg in soil the surface layers, its effect is slow in improving the subsoil[8,11]. The application of phosphogypsum to the soil's surface is a viable alternative for improving the subsoil's chemical conditions by increasing Ca and sulfur (S) levels, and reducing Al toxicity[12]. As a result of improving the subsoil improvement through the use of phosphogypsum, increased root growth and crop yield have been reported, especially under rainfall shortages during crop development[8,9].
Since soil is a limited resource and some of its components require prolonged periods to be restored, forecasting the degree of environmental disturbance caused by inadequate management of agricultural activities is essential to obtain production systems with greater sustainability. Determining the species that that make up the crop rotation and practices that aim to improve the soil profile are crucial tools for maintaining soil quality and production under no-till systems. This study aimed to evaluate chemical changes in the soil and soybean performance under different crop rotations, with and without surface application of phosphogypsum, in a subtropical no-till cropping system.
-
The experiment was carried out at the Experimental Station of the Institute of Rural Development of Paraná (IDR-Paraná-IAPAR-EMATER), located in Ponta Grossa, in the center-south region of the State of Parana, Brazil (25º09'38'' S, 50º09'24'' W, with an altitude of 835 m).
The experimental area has been managed under a no-till system since 1987, with crops of black oat (Avena strigosa Schreb) in winter and soybean (Glycine max [L.] Merrill) or maize (Zea mays L.) alternately in summer. The study of the influence of different crop rotations was established in 2017. The soil was classified as a typical dystrophic Red Latosol with a clayey texture[13] (clayey, kaolinitic, thermic Rhodic Hapludox), and the terrain is smoothly undulating.
The climate in the region is categorized as a Cfb type (mesothermal, humid, subtropical) with an average annual temperature of 18 °C and an average annual rainfall of 1,550 mm[14].
Experimental design and treatments
-
A randomized complete block design was used, with four replications in a split-plot arrangement. In the plots (10 m × 30 m), the crop rotations shown in Table 1 were used for the period from 2017–2018 to 2022–2023. In the subplots (5 m × 30 m), two treatments were used, with and without surface application of phosphogypsum before sowing soybean in 2021. Phosphogypsum was applied at a rate of 2.85 Mg ha−1, which was defined according to the recommendation based on the level of Ca saturation in the effective cation exchange capacity (ECEC) at 20–40 cm depth to 60%[12]. Phosphogypsum contained 175 g kg−1 Ca, 135 g kg−1 S, 3.6 g kg−1 P, < 0.1 g kg−1 Cu, 1.7 g kg−1 Fe, < 0.1 g kg−1 Mn, and < 0.1 g kg−1 Zn. To correct soil acidity, dolomitic limestone was applied to the soil surface at a rate of 3 Mg ha−1 both before the experiment was installed in 2017 and before sowing wheat in 2021.
Table 1. Crop rotation treatments in the period from 2017 to 2023.
Crop rotation Year 1 (2017–2018) Year 2 (2018–2019) Year 3 (2019–2020) Year 4 (2020–2021) Year 5 (2021–2022) Year 6 (2022–2023) I W S W S W S W S W S W S II BO M W S W S BO M W S W S III CAN M W S BAR S CAN M W S BAR S IV BO + RY M BO + RY M BO + RY S VET M W S W S W, wheat (Triticum aestivum L.); S, soybean (Glycine max [L.] Merrill); BO, black oat (Avena strigosa Schreb); RY, ryegrass (Lolium multiflorum Lam.); M, maize (Zea mays L.); CAN, canola (Brassica napus L. var. oleifera); BAR, barley (Hordeum vulgare L.); VET, vetch (Vicia sativa L.). The rates and fertilizers used for each species included in the crop rotations in the period from 2017 to 2023 are shown in Table 2. Soybean was cultivated during two cropping seasons (2021–2022, cultivar NS 6209 RR; 2022–2023, cultivar BMX CROMO 57I59 IPRO), according to the adopted crop rotation scheme. In these two growing seasons, soybean was sown in November at a seeding rate of 15 seeds m−1 (inoculated with Bradyrhizobium japonicum) and a row spacing of 0.45 m.
Table 2. Fertilization used in different crop rotations (I, II, III, IV) under a no-till system in the period from 2017 to 2023 (kg ha−1).
Growing season I II III IV S TD S TD S TD S TD 2017−2018 Winter 300B 110A 0 0 240B 110A 0 0 Summer 300C 0 300B 250A 300B 250A 300B 250A 2018−2019 Winter 270B 100A 270B 100A 270B 100A 0 0 Summer 270B 0 270B 0 270B 0 300B 200A 2019−2020 Winter 250D 100A 250D 100A 250D 100A 0 0 Summer 270B 0 270B 0 270B 0 270B 0 2020−2021 Winter 280B 100A 0 0 280B 100E + 50A 0 0 Summer 270B 0 300B 250A 300B 250A 300B 250A 2021−2022 Winter 296D 200A 296D 200A 296D 200A 296D 200A Summer 300B 0 300B 0 300B 0 300B 0 2022−2023 Winter 300D 111A 300D 111A 300D 111A 296D 111A Summer 300D 0 300D 0 300D 0 300D 0 S, sowing; TD, top dressing; A urea; B formulation 04–30–10 N–P2O5–K2O; C formulation 02–28–20 N–P2O5–K2O; D formulation 10–30–10 N–P2O5–K2O; E ammonium sulfate. Soil sampling and chemical analysis
-
Soil samples were taken after harvesting soybean in 2022 and 2023. To obtain a composite sample, 10 soil cores were sampled at 0–5, 5–10, and 10–20 cm depths, and five soil core samples were sampled at 20–40 cm depth in each subplot using a soil probe. Before the chemical analysis, soils were dried in an oven with forced air circulation at 40 °C and ground to pass through a 2-mm sieve. Soil pH was determined in a 0.01 mol L−1 CaCl2 suspension (1:2.5 soil/solution, v/v). Exchangeable Al3+, Ca2+, and Mg2+ were extracted with a neutral 1 mol L−1 KCl solution, while P and K+ were extracted with double acid (Mehlich-1) in a 1:10 (v/v) soil/solution ratio according to the standard methods used by the Agronomic Institute of Paraná State[15]. Aluminum (KCl-exchangeable acidity) was determined by titration with a 0.025 mol L−1 NaOH solution, Ca2+ and Mg2+ by titration with 0.025 mol L−1 ethylenediaminetetraacetic acid (EDTA), P by molecular absorption spectrophotometry, and K+ by flame photometry.
Soil organic C was determined by the Walkley–Black method on the basis of soil volume. Sulfate (SO4-S) was extracted with a 0.01 mol L−1 calcium phosphate solution in a 1:2.5 (v/v) soil/solution ratio; it was later determined turbidimetrically to be BaSO4[16]. The ECEC was calculated by summation of the exchangeable cations, the Al3+ saturation as 100 × (Al3+/ECEC), and the Ca2+ saturation as 100 × (Ca2+/ECEC).
Soybean leaf sampling and chemical analysis
-
At the time of full flowering of soybean grown in 2021–2022, leaf tissue samples were collected, removing the third trefoil from the apex of 30 plants in each subplot. The leaf samples were washed with deionized water, placed to dry in an oven with forced air circulation at 60 ºC until they reached constant mass, and ground. The contents of N, P, K, Ca, Mg, S, Cu, Mn, Fe, and Zn were determined according to the methods described by Malavolta et al.[17].
Soybean grain yield
-
In the two growing seasons (2021–2022 and 2022–2023), after reaching physiological maturity, soybean was harvested and threshed to assess grain yield. For this purpose, three subsamples composed of four rows of 5 m in length (9 m2) were collected from each subplot. After threshing, grain yield was estimated by correcting grain moisture to 130 g kg−1.
Statistical analysis
-
The data obtained were initially submitted to an evaluation of the assumptions of normality and homogeneity, respectively, using the Shapiro–Wilk and Bartlett tests, at a 5% significance level. After confirming the assumptions, the data were submitted to analysis of variance and compared by Tukey's test at the 5% level of significance.
-
The 10-day climatological data and the normal climatological water balance estimated using the method proposed by Thornthwaite and Mather[18], for the period 2021–2023, are shown in Fig. 1.
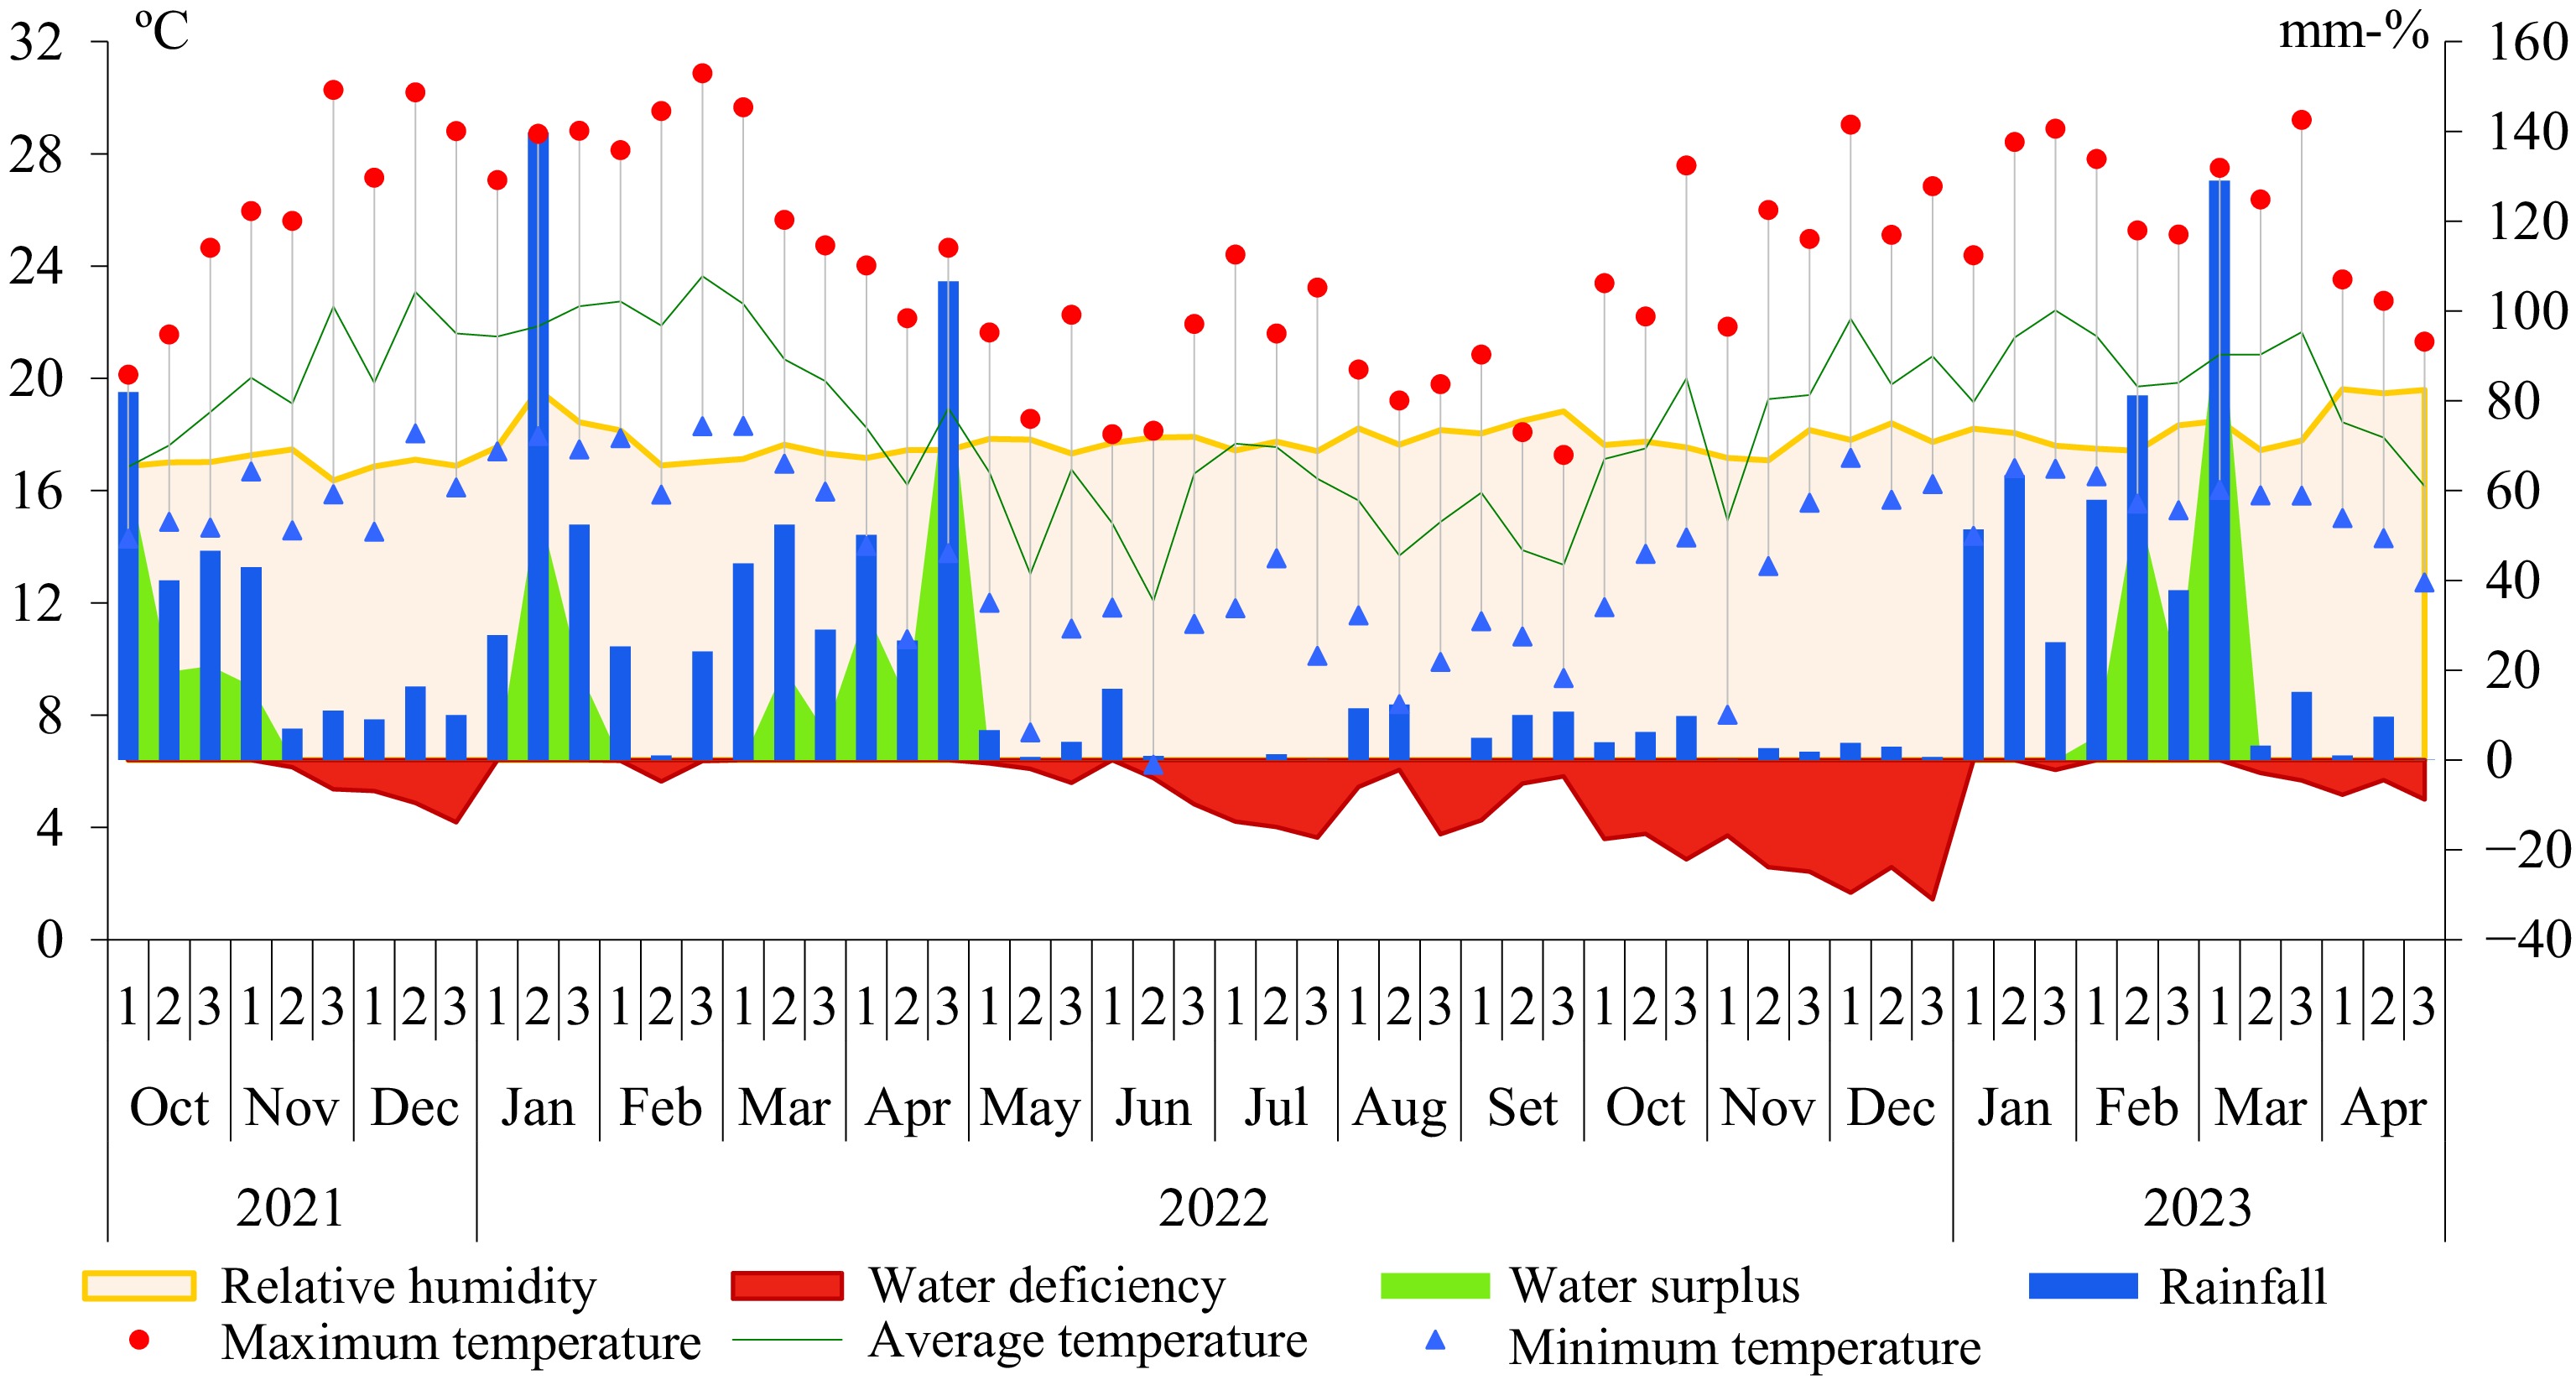
Figure 1.
Climatological data (relative humidity, rainfall, maximum temperature, average temperature, and minimum temperature) and water balance (water deficiency and water surplus) every 10 days during crop development in the field from 2021 to 2023.
Crop rotations and the application of phosphogypsum to the soil surface did not cause significant changes in soil pH at different depths (Table 3). Application of phosphogypsum significantly reduced the exchangeable Al3+ levels from 0.20 to 0.15 cmolc dm−3 in the 0–5 cm layer and from 0.60 to 0.47 cmolc dm−3 in the 5–10 cm layer, and reduced Al3+ saturation from 2.4 to 1.9% in the 0–5 cm layer and from 10.2 to 8.0% in the 5–10 cm layer. However, as production systems diversified with a greater frequency of grain-producing species, as in Rotation III (canola/maize, wheat/soybean, barley/soybean, canola/maize, wheat/soybean), significant increases were observed in the exchangeable acidity levels and Al3+ saturation in the soil surface layer (0–5 cm), standing out in relation to the other rotations evaluated.
Table 3. Soil pH (0.01 mol L−1 CaCl2), exchangeable Al3+ content, and Al3+ saturation at different depths as affected by crop rotations and application of phosphogypsum in a no-till system of the soil, at different depths, considering crop rotations and the use of phosphogypsum in a no-till system.
Attribute Depth
(cm)Phospho-gypsum Crop rotation Average I II III IV pH (CaCl2) 0−5 Without 5.2 5.2 5.0 5.2 5.2 a With 4.9 5.0 5.2 5.1 5.1 a Average 5.0 A 5.1 A 5.1 A 5.2 A 5−10 Without 4.7 4.8 4.7 4.8 4.7 a With 4.7 4.8 4.7 4.7 4.7 a Average 4.7 A 4.8 A 4.7 A 4.7 A 10−20 Without 4.4 4.5 4.5 4.5 4.5 a With 4.4 4.4 4.4 4.5 4.4 a Average 4.4 A 4.5 A 4.4 A 4.5 A 20−40 Without 4.6 4.6 4.5 4.6 4.6 a With 4.5 4.6 4.5 4.6 4.6 a Average 4.5 A 4.6 A 4.5 A 4.6 A Al3+
(cmolc dm−3)0−5 Without 0.16 0.18 0.30 0.15 0.20 a With 0.13 0.15 0.21 0.12 0.15 b Average 0.15 B 0.16 B 0.25 A 0.13 B 5−10 Without 0.80 0.50 0.59 0.53 0.60 a With 0.45 0.43 0.50 0.51 0.47 b Average 0.62 A 0.46 A 0.55 A 0.52 A 10−20 Without 0.70 0.74 0.76 0.87 0.76 a With 0.61 0.56 0.65 0.80 0.65 a Average 0.65 A 0.65 A 0.70 A 0.83 A 20−40 Without 0.73 0.71 0.68 0.54 0.67 a With 0.77 0.74 0.75 0.66 0.73 a Average 0.75 A 0.72 A 0.71 A 0.60 A Al3+ saturation
(%)0−5 Without 2.1 2.1 3.8 1.6 2.4 a With 1.8 1.8 2.5 1.4 1.9 b Average 2.0 B 2.0B 3.2 A 1.5 B 5−10 Without 13.9 9.3 9.2 8.5 10.2 a With 7.3 7.4 8.2 9.2 8.0 b Average 10.6 A 8.4 A 8.7 A 8.9 A 10−20 Without 17.7 16.2 17.3 18.7 17.5 a With 13.8 13.7 14.6 17.6 14.9 a Average 15.8 A 15.0 A 16.0 A 18.2 A 20−40 Without 18.9 18.2 18.2 14.8 17.5 a With 20.4 18.6 18.5 16.9 18.6 a Average 19.7 A 18.4 A 18.4 A 15.9 A Mean values followed by the same letter (uppercase for crop rotation; lowercase for application of phosphogypsum) do not differ significantly according to the Tukey test at 5% significance. The exchangeable Ca2+ and Mg2+ contents in the soil did not significantly change with the application of phosphogypsum (Table 4). The average contents of exchangeable Ca2+ and Mg2+ were 5.6 and 2.1 cmolc dm−3 in the 0–5 cm layer, 3.2 and 1.8 cmolc dm−3 in the 5–10 cm layer, 2.3 and 1.2 cmolc dm−3 in the 10–20 cm layer, and 2.0 and 1.0 cmolc dm−3 in the 20–40 cm layer, respectively. There was an increase in the exchangeable Ca2+ content in the soil surface layer (0–5 cm) with the use of Rotation IV (6.0 cmolc dm−3) compared with Rotation I (control) (5.2 cmolc dm−3). The inclusion of a single black oat crop for green manure and the insertion of the maize crop in the summer in Rotation II provided increments of around 11.5% in the Ca2+ content in the soil compared with the Ca content found in the wheat–soybean rotation. The exchangeable Mg2+ content at different soil depths was not significantly changed by crop rotations.
Table 4. Exchangeable Ca2+, Mg2+, and K+ contents at different soil depths as affected by crop rotations and application of phosphogypsum in a no-till system.
Attribute Depth
(cm)Phospho-
gypsumCrop rotation Average I II III IV Ca2+
(cmolc dm−3)0−5 Without 5.4 5.6 4.8 5.9 5.4 a With 5.0 5.9 6.2 6.1 5.8 a Average 5.2 B 5.8 AB 5.5 AB 6.0 A 5−10 Without 3.4 3.2 3.2 3.3 3.3 a With 3.3 3.2 3.4 3.0 3.2 a Average 3.4 A 3.2 A 3.3 A 3.2 A 10−20 Without 2.1 2.3 2.3 2.3 2.3 a With 2.4 2.3 2.4 2.4 2.4 a Average 2.3 A 2.3 A 2.4 A 2.4 A 20−40 Without 1.9 2.0 2.0 2.1 2.0 a With 1.8 2.1 2.0 2.2 2.0 a Average 1.9 A 2.1 A 2.0 A 2.2 A Mg2+
(cmolc dm−3)0−5 Without 2.0 2.1 2.0 2.5 2.2 a With 1.9 2.1 1.7 2.2 2.0 a Average 2.0 A 2.1 A 1.9 A 2.4 A 5−10 Without 1.2 2.0 2.2 2.3 1.9 a With 1.6 1.8 1.8 2.0 1.8 a Average 1.4 A 1.9 A 2.0 A 2.2 A 10−20 Without 1.0 1.3 1.0 1.4 1.2 a With 1.3 1.3 1.2 1.3 1.3 a Average 1.2 A 1.3 A 1.1 A 1.4 A 20−40 Without 1.1 1.2 0.9 0.9 1.0 a With 1.0 1.0 1.2 1.0 1.1 a Average 1.1 A 1.1 A 1.1 A 1.0 A K+
(cmolc dm−3)Without 0.67 0.71 0.64 0.75 0.69 a 0−5 With 0.52 0.65 0.58 0.60 0.59 b Average 0.59 B 0.68 A 0.61 AB 0.67 A Without 0.32 0.37 0.40 0.29 0.35 b 5−10 With 0.36 0.45 0.41 0.38 0.40 a Average 0.34 A 0.41 A 0.41 A 0.34 A Without 0.19 0.22 0.31 0.20 0.23 a 10−20 With 0.26 0.23 0.25 0.19 0.23 a Average 0.22 A 0.22 A 0.28 A 0.20 A Without 0.15 0.13 0.16 0.09 0.13 b 20−40 With 0.22 0.18 0.18 0.14 0.18 a Average 0.18 A 0.16 B 0.17 AB 0.11 C Mean values followed by the same letter (uppercase for crop rotation; lowercase for application of phosphogypsum) do not differ significantly according to the Tukey test at 5% significance. The addition of phosphogypsum significantly reduced the exchangeable K+ content from 0.69 to 0.59 cmolc dm−3 in the soil surface layer (0–5 cm), and increased the exchangeable K+ level from 0.35 to 0.40 cmolc dm−3 in the 5–10 cm layer and from 0.13 to 0.18 cmolc dm−3 in the 20–40 cm layer (Table 4). Compared with Rotation I (control), the use of Rotations II (0.68 cmolc dm−3) and IV (0.67 cmolc dm−3) increased the exchangeable K+ content in the soil surface layer (0–5 cm). On the other hand, lower levels of K+ were found at a depth of 20–40 cm with the use of Rotations II (0.16 cmolc dm−3) and IV (0.11 cmolc dm−3) compared with Rotation I (0.18 cmolc dm−3).
The organic C contents showed stratification along the soil profile, with the presence of higher contents in the soil surface layer (0–5 cm), between 33.3 and 36.6 g kg−1, which decreased with depth (Table 5). However, the use of different crop rotations provided significant increases in organic C content only at 10–20 and 20–40 cm depths. At these two depths, Rotation IV (black oat + ryegrass/maize, black oat + ryegrass/soybean, black oat + ryegrass/soybean, vetch/maize, wheat/soybean) provided higher organic C content compared with Rotation I (control, wheat–soybean). Still at the depth of 20–40 cm, in addition to Rotation IV, Rotation II (black oat/maize, wheat/soybean, wheat/soybean, black oat/maize, wheat/soybean) was statistically superior compared with Rotation I (control); however, it was not statistically different from Rotation IV. No changes were found in the organic C content after seven months of applying phosphogypsum.
Table 5. Organic C and extractable P (Mehlich-1) and SO4-S (0.01 mol L−1 calcium phosphate) contents at different soil depths as affected by crop rotations and application of phosphogypsum in a no-till system.
Attribute Depth
(cm)Phosphogypsum Crop rotation Average I II III IV Organic C
(g dm−3)0−5 Without 34.2 34.8 33.3 37.7 35.0 a With 33.6 33.2 33.3 35.5 33.9 a Average 33.9 A 34.0 A 33.3 A 36.6 A 5−10 Without 30.3 31.5 32.9 29.9 31.2 a With 31.4 31.8 32.1 30.2 31.4 a Average 30.9 A 31.7 A 32.5 A 30.1 A 10−20 Without 25.4 28.4 25.9 29.1 27.2 a With 25.8 26.2 26.2 27.5 26.4 a Average 25.6 B 27.3 AB 26.1 B 28.3 A 20−40 Without 22.5 24.9 23.5 25.4 24.1 a With 23.0 25.4 24.5 25.8 24.7 a Average 22.8 B 25.2 A 24.0 AB 25.6 A P
(mg dm−3)0−5 Without 32.2 38.8 27.5 23.9 30.6 b With 48.1 34.5 40.8 30.8 38.6 a Average 40.2 A 36.7 A 34.2 AB 27.4 B 5−10 Without 27.2 24.0 32.3 28.6 28.0 a With 21.3 24.5 27.3 23.3 24.1 a Average 24.3 A 24.3 A 29.8 A 26.0 A 10−20 Without 8.6 6.7 7.2 10.2 8.2 a With 6.3 8.1 9.0 7.1 7.6 a Average 7.5 A 7.4 A 8.1 A 8.7 A 20−40 Without 5.0 3.7 3.5 3.0 3.8 a With 4.3 3.0 3.8 3.4 3.6 a Average 4.7 A 3.4 A 3.7 A 3.2 A SO4-S
(mg dm−3)Without 51.5 Ab 45.6 Ab 50.0 Ab 42.5 Ab 47.4 0-5 With 78.2 Ba 74.2 Ba 84.1 Ba 135.4 Aa 93.0 Average 64.9 59.9 67.1 89.0 Without 82.3 86.5 78.4 74.9 80.5 b 5−10 With 185.5 162.7 171.6 189.2 177.3 a Average 133.9 A 124.6 A 125.0 A 132.1 A Without 124.3 100.6 110.1 107.6 110.7 b 10-20 With 217.4 170.3 193.1 190.6 192.9 a Average 170.9 A 135.5 A 151.6 A 149.1 A Without 206.0 199.3 218.1 141.5 191.2 b 20-40 With 262.4 254.8 274.0 227.5 254.7 a Average 234.2 A 227.1 A 246.1 A 184.5 B Mean values followed by the same letter (uppercase for crop rotation; lowercase for application of phosphogypsum) do not differ significantly according to Tukey's test at 5% significance. Rotations I and II provided a higher concentration of P (Mehlich-1) in the soil surface layer (0–5 cm) compared with Rotation IV (Table 5). However, the existence of significant differences in the P content in the soil in terms of crop rotation remained only in the soil surface layer. As soil depth increased, P levels showed stratification along the soil profile. Surface application of phosphogypsum significantly increased P (Mehlich-1) content in the soil surface layer (0–5 cm) from 30.6 to 38.6 mg dm−3.
Applying phosphogypsum increased the SO4-S content in the soil in all layers sampled (Table 5). There was a significant interaction effect of crop rotations and application of phosphogypsum for SO4-S content in the 0–5 cm layer. Applying phosphogypsum increased SO4-S content at the soil surface layer in all crop rotations; however, in the presence of phosphogypsum, Rotation IV had a higher SO4-S content (135.4 mg dm−3) compared with Rotations I (78.2 mg dm−3), II (74.2 mg dm−3), and III (84.1 mg dm−3). In the 20–40 cm layer, Rotations I (234.2 mg dm−3), II (227.1 mg dm−3), and III (246.1 mg dm−3) had a higher SO4-S content than Rotation IV (184.5 mg dm−3), regardless of the use of phosphogypsum.
Crop Rotation IV with the inclusion of different species of grasses and legumes as winter cover crops, interspersed in different years with soybean and maize in the summer, provided higher contents of N (43.3 g kg−1), Mg (3.2 g kg−1), and S (3.0 g kg−1) in soybean leaves compared with Rotation II (38.6 g kg−1 N, 2.9 g kg−1 Mg, and 2.5 g kg−1 S) (Table 6). In addition, compared with Rotation IV (7.1 mg kg−1 Cu and 54.4 mg kg−1 Mn), there was a higher Cu content in the leaves with the use of Rotation II (11.1 mg kg−1) and a higher Mn content in the leaves with the use of Rotation I (65.0 mg kg−1). Application of phosphogypsum significantly increased soybean leaf P content from 4.9 to 5.8 g kg−1, Ca content from 8.5 to 9.6 g kg−1, S content 2.5 to 2.9 g kg−1, and Zn content from 30.5 to 32.9 mg kg−1. Phosphogypsum use also reduced the leaf content of Mg in soybean from 3.4 to 2.8 g kg−1.
Table 6. Leaf nutrient contents of soybean in 2021–2022 as affected by crop rotations and application of phosphogypsum in a no-till system.
Phosphogypsum Crop rotation Average I II III IV N, leaf (g kg−1) Without 43.7 37.1 42.0 43.9 41.7 a With 44.4 40.1 41.2 42.6 42.1 a Average 44.1 A 38.6 B 41.6 AB 43.3 A P, leaf (g kg−1) Without 5.1 4.8 5.1 4.6 4.9 b With 5.8 5.6 6.0 5.7 5.8 a Average 5.5 A 5.2 A 5.6 A 5.2 A K, leaf (g kg−1) Without 31.4 32.9 32.6 31.0 32.0 a With 31.3 34.0 31.3 30.0 31.7 a Average 31.4 A 33.5 A 32.0 A 30.5 A Ca, leaf (g kg−1) Without 8.5 8.3 8.5 8.7 8.5 b With 9,4 9,3 10,4 9,3 9,6 a Average 9,0 A 8,8 A 9,5 A 9,0 A Mg, leaf (g kg−1) Without 3,5 3,2 3,4 3,5 3,4 a With 2,8 2,6 2,9 2,9 2,8 b Average 3,2 A 2,9 B 3,2 A 3,2 A S, leaf (g kg−1) Without 2.6 2.2 2.2 2.8 2.5 b With 2.6 2.8 2.8 3.2 2.9 a Average 2.6 AB 2.5 B 2.5 B 3.0 A Cu, leaf (mg kg−1) Without 10.2 11.8 10.8 7.7 10.1 a With 10.5 10.4 9.9 6.4 9.3 a Average 10.4 AB 11.1 A 10.4 AB 7.1 B Mn, leaf (mg kg−1) Without 60.8 59.8 63.1 53.3 59.3 a With 69.2 69.0 64.3 55.5 64.5 a Average 65.0 A 64.4 AB 63.7 AB 54.4 B Fe, leaf (mg kg−1) Without 93.0 92.5 93.6 93.1 93.1 a With 95.9 91.9 96.7 85.1 92.4 a Average 94.5 A 92.2 A 95.2 A 89.1 A Zn, leaf (mg kg−1) Without 29.2 29.7 31.7 31.2 30.5 b With 33.5 31.7 33.2 33.0 32.9 a Average 31.4 A 30.7 A 32.5 A 32.1 A Mean values followed by the same letter (uppercase for crop rotation; lowercase for application of phosphogypsum) do not differ significantly according to the Tukey test at 5%. Soybean grain yield in 2021–2022 was higher with Rotation IV (3,723 kg ha−1) compared with Rotation III (3,289 kg ha−1), representing a 13.2% increase in grain yield (Table 7). However, soybean grain yields in 2022–2023 were statistically similar in Rotations I (control, 4,474 kg ha−1), II (4,719 kg ha−1), III (4,298 kg ha−1), and IV (4,423 kg ha−1). Application of phosphogypsum increased soybean grain yields in both growing seasons by 10% and 8%, respectively.
Table 7. Soybean grain yields in 2021–2022 and 2022–2023 as affected by crop rotations and application of phosphogypsum in a no-till system.
Phosphogypsum Crop rotation Average I II III IV 2021−2022 (kg ha−1) Without 3,415 3,225 3,188 3,554 3,346 b With 3,685 3,742 3,390 3,892 3,677 a Average 3,550 AB 3,484 AB 3,289 B 3,723 A 2022−2023 (kg ha−1) Without 4,370 4,697 4,179 4,004 4,312 b With 4,577 4,741 4,418 4,843 4,645 a Average 4,474 A 4,719 A 4,298 A 4,423 A Mean values followed by the same letter (uppercase for crop rotation; lowercase for application of phosphogypsum) do not differ significantly according to the Tukey test at 5% significance. -
Because phosphogypsum is a neutral salt (CaSO4.2H2O), soil pH (Table 3) is not affected by its application[8]. The beneficial effect of phosphogypsum in attenuating Al3+ toxicity in the soil surface layers (0–5 and 5–10 cm) corroborates the results found by Zambrosi et al.[19], who attributed important increases in the SO4-S and fluorine (F) contents to the surface application of phosphogypsum for the attenuation of Al3+ toxicity resulting from the formation of ionic pairs AlSO4+ and AlF. According to these authors, the presence of Al3+ in the soil may affect the availability of phosphate in the soil solution, resulting from strong interactions with the formation of the chemical species Al-HxPO4x.
Considering the nutritional dynamics in each crop rotation, it is assumed that lower outputs of nutrients from the productive system were seen under Rotation IV compared with Rotation III because the cover crops in winter were managed in their stage of full flowering, characterizing the maximum nutritional accumulation in plant tissues. However, in Rotation III, the greater use of grain-producing crops would represent greater output of nutrients from the soil via grain export, causing changes in the soil cation exchange complex and an increase in Al3+ saturation, as observed in Table 3. Another preponderant factor in the soil acidification process arises from the use of ammoniacal sources in the management of crop species, such as the use of ammonium sulfate (Table 2) which, through the conversion of ammonium to nitrate, promotes the release of H+ with an increase in exchangeable Al3+ content, as observed by Rosado et al.[20].
Since the downward movement of phosphogypsum in the soil profile occurs slowly and gradually, there were no significant changes in the exchangeable soil Ca2+ and Mg2+ contents after the application of phosphogypsum (Table 4). In our study, the effects of phosphogypsum on the soil's chemical attributes were evaluated seven months after application. In Oxisols of Southern Brazil under no-till cropping systems, Caires et al.[12] found that the movement of exchangeable Ca2+ in the soil profile resulting from the application of phosphogypsum depends on rainfall. Furthermore, the application of phosphogypsum also causes the movement of exchangeable Mg2+ in the soil over time through the formation of the MgSO40 ion pairs.
The movement of exchangeable K+ from the soil surface layer (0–5 cm) to the deeper layers of the soil (5–10 and 20–40 cm) through the application of phosphogypsum (Table 4) was also reported in another study carried out on a soil with a high K+ content in the surface layer[21]. According to Zambrosi et al.[19], the sulfate from phosphogypsum present in the soil solution, in addition to its free ionic form (SO42−), occurs in complexes with other cations, such as Mg2+ (MgSO40), Ca2+ (CaSO40), and, to a lesser extent, K+ (KSO4−). When the exchangeable K+ content in the soil surface layer is high, normally, the KSO4− complex ends up moving a little deeper into the subsoil, as occurred in our study.
The nutritional increases in the soil surface layer (0–5 cm) could be attributed to the high density of plants for the cultivation of grasses for green manure and to the morphophysiological plasticity characteristics of the fasciculated root systems, with maximized uptake of nutrients such as K+, Ca2+, and SO42− at greater depths and increased nutrient availability to succeeding crops (Tables 4 and 5) from decomposing root and shoot residues. The results obtained here corroborate those observed by Wolschick et al.[22], who verified the relevance of using black oat and vetch in single or intercropped cultivation in the production of shoot and root dry biomass, as well as in the cycling of nutrients through the residues of the root system, with amounts of 1.5 and 2.1 kg ha−1 Ca, 7.8 and 5.9 kg ha−1 Mg, and 63.3 and 24.1 kg ha−1 K, respectively.
The superiority found in Rotation IV for organic C content at 10–20 and 20–40 cm depths (Table 5) could be attributed to the greater diversity of grain crops associated with cover crops, which have higher flows of biomass input and release of organic compounds derived from root and shoot residues, contributing to the increase in organic C stocks throughout the soil profile[7]. Because of the continuous input of plant residues, dos Santos Canalli et al.[23] observed higher organic C levels in the surface layer and a reduction in the subsurface layers of the soil.
The increase in P (Mehlich-1) content in the soil surface layer with the application of phosphogypsum (Table 5) could have been caused by the presence of P, as a residue, in the composition of the phosphogypsum. This result corroborates other reports on the use of phosphogypsum in a no-till cropping system[9]. The stratification in P content throughout the soil profile in no-till systems is caused by the absence of soil disturbance, the release of P during the decomposition of plant residues left on the surface, and the annual applications of phosphate fertilizers in the seeding furrow[9]. Regarding the use of different crop rotations, there were higher inputs of P via fertilization, in agreement with the higher frequency of grain-producing crops in Rotations I, II, and III (Tables 1 and 2). However, despite the lower P content in the soil surface layer (0–5 cm) found for Rotation IV, the greater diversity of species in this rotation allowed the occurrence of high P content, in accordance with the reference values for clayey soils presented by Pauletti and Motta[24], showing the capacity of the different species in the cycling and availability of nutrients for the crops in succession. Teles et al.[25] found that grass crops, such as oat and ryegrass, had a high capacity to uptake moderately labile fractions of P present in the soil surface layer, storing them in their aerial structures and, subsequently, increasing the soil P content through the decomposition of the residues. In addition, accumulation of labile P and nonlabile P in the soil is commonly observed in layers close to the surface, resulting from the application of phosphate fertilizer sources and the low mobility of this nutrient in the soil[25].
The movement of sulfate along the soil profile (Table 5) and its prevalence in the subsurface layers are a result of (1) the repulsion of anions caused by higher levels of organic matter in the surface layers of the soil; (2) the increase in soil pH in the surface layers by surface liming, which releases the adsorbed sulfate; and (3) the practice of phosphate fertilization in the soil surface layers, considering that the phosphate binds with greater strength at the same sulfate binding sites[8,21]. Dalla Nora et al.[26] reported an accelerated process of vertical sulfate displacement in the rhizospheric region under no-till managment, with an increase in sulfate content from 85% to 147% in the 25–40 cm layer and from 284% to 338% in the 40–60 cm layer at 56 months after application of 5.0 Mg ha−1 of phosphogypsum.
Phosphogypsum applied to the soil surface moves down the profile during drainage, resulting in increases in the Ca2+ supply and a reduction in toxic levels of Al3+. As a result, a more favorable environment for plant root growth can be achieved in both tropical[8] and subtropical[9] regions.
Soybean nutrition
-
Despite the changes in plant nutrition found with crop rotation treatments and the use of phosphogypsum (Table 6), nutrient contents in the leaves remained at levels considered to be adequate for soybean crops[17].
The increments in leaf N and P contents, as well as the lower leaf Cu and Mn contents of soybean (2021–2022) with the use of Rotation IV were probably related to the high biomass contribution capacity of grasses, with the production of plant residues with a high C/N ratio and longer half-lives leading to a slow and gradual release of nutrients to the succeeding crop. However, the inclusion of the hairy vetch legume in this rotation favored a more intense dynamic for the decomposition of plant residues by supplying N, enhancing the release of N and P in the soil[4], and favoring the gradual availability of micronutrients to the soil solution. These results corroborate those obtained by Caires et al.[11], who reported that the maintenance of black oat residues on the soil surface favored the nutrition of N and P in soybean plants grown in succession, although it reduced the leaf Mn content of soybean.
The improvement in Ca, P, and S contents in soybean leaves (2021–2022) resulting from the application of phosphogypsum (Table 6) is in line with the results obtained regarding the evaluation of soil quality parameters, with an increase in P content in the soil surface layer (0–5 cm) (Table 3) and in SO4-S content throughout the soil profile (Table 5). The results found for soybean nutrition were similar to other studies conducted under no-till systems, in which the application of phosphogypsum provided increases in the leaf contents of Ca, P, and S of soybean[9,21].
The increase in leaf Zn content with the surface application of phosphogypsum (Table 6) could have been a consequence of the presence of this micronutrient as an impurity in phosphogypsum. In another study conducted on an Oxisol in Jataí (GO, Brazil), an increase in the leaf Zn content of soybean was also found with increasing application rates of phosphogypsum[27]. The lack of an effect of phosphogypsum on the leaf K content of soybean corroborates the results found by Caires et al.[9] in a wheat–soybean cropping system and was certainly caused by the adequate supply of K provided by fertilizer management in the different species that made up the crop rotations (Tables 1 and 2).
Soybean grain yield
-
Soybean grain yield in both growing seasons (2021–2022 and 2022–2023) was increased by applying phosphogypsum (Table 7). Caires et al.[9] found that the positive effect of applying phosphogypsum on soybean grain yield was dependent on the water balance during crop flowering, with an average increase of 15% in soybean yield observed with the use of phosphogypsum in the season marked by water deficit. Thus, periods with water deficit in the initial stages of crop development (38.4 mm) and flowering (from 5.1 to 29.5 mm) (Fig. 1) were certainly essential in causing increases in soybean grain yield through the addition of phosphogypsum of 10% in 2021–2022 and 8% in 2022–2023.
The adoption of grasses in crop rotations has a gradual effect on improving soil structure, promoting greater root growth of soybean in depth, as a result of the presence of biopores and reduced resistance to penetration[28]. The increase in biopores promotes a favorable environment for root growth in the presence of periods of low rainfall through greater soybean root elongation beneath the sowing row and greater root length density between the rows. de Moraes Sá et al.[29] showed an increase in cation exchange capacity (CEC) at a rate of 0.37 cmolc kg−1 for each g of C per kg of soil, and a high impact of crop residues on the maintenance of nutrients such as P and K throughout the soil profile. In addition to the significant increase in CEC and, consequently, in the retention of cations (Ca2+, Mg2+, and K+), the accumulation of organic matter in soils with a predominance of low-activity clay can cause the complexation of H+ and Al3+, leading to a stabilization of the soil pH through its acidity buffering capacity[29,30].
The stimulation of cultivated plants in the face of adverse conditions is also favored by the presence of humic acids from plant residues, acting as a key regulatory center for plant hormones, modifiers of plant receptors, and phosphatase activity[31]. Among the responses caused by humic acids, auxins showed a greater number of positively regulated genes, particularly those associated with mechanisms of cellular homeostasis, such as aldo-keto reductases, promoting detoxification of less toxic compounds such as alcohols or carboxylic acids, and stimulating plant growth[31].
Considering the performance of the soybean crop, the use of Rotation IV ensured adequate plant nutrition and higher soybean grain yield in 2021–2022 compared with Rotation III. Cover crops such as black oat and vetch promoted an increase in biomass input in no-till systems, resulting in an increase in the rate of C sequestration, both by increasing the labile C fraction and the total organic C stock[32]. Furthermore, a positive correlation was found between the combined cultivation of black oat and vetch and soybean root length[32]. In another study, de Moraes Sá et al.[7] reported a strong relationship between organic C stocks and grain yields of wheat and soybean, with an increase of 1 t C ha−1 in the 0–20 cm layer accounting for increases of 26 kg ha−1 of wheat and 11 kg ha−1 of soybean. However, Rotation IV was not statistically different from Rotation I (control) in terms of soybean grain yields in 2021–2022 and 2022–2023, showing that wheat was an important option for rotation management, given its high capacity to produce phytomass with a high C/N ratio, allowing nutrients to be available throughout the soybean crop cycle[4].
-
Greater species diversification in a crop rotation (Rotation IV), with cover crops such as black oat, ryegrass, and vetch intercropped with commercial soybean and maize, led to significant increases in soil Ca2+, K+, SO4-S, and organic C contents, and improved soybean leaf N, Mg, and S contents. Depending on the year, Rotation IV also promoted higher soybean grain yield compared with Rotation III with canola, wheat, and barley instead of winter cover crops. It is noteworthy, however, that Rotation IV provided a soybean grain yield similar to the wheat–soybean rotation.
Application of phosphogypsum increased soil P and SO4-S contents, and reduced soil Al3+ toxicity. Phosphogypsum increased leaf contents of P, Ca, S, and Zn in soybean, and resulted in 8%–10% increases in soybean grain yield during growing seasons marked by periods of water deficit.
-
The authors confirm their contributions to the paper as follows: study conception and design: Caires EF, Serber CE, Canalli LBdS; data collection: Serber CE and Canalli LBdS; analysis and interpretation of results: Caires EF, Serber CE, Canalli LBdS, Francisco, ALO; draft manuscript preparation: Serber CE, Caires EF, and Canalli, LBdS. All authors reviewed the results and approved the final version of the manuscript.
-
The datasets generated during and/or analyzed during the current study are available from the corresponding author on reasonable request.
-
Thanks IDR-Paraná and to the State University of Ponta Grossa (UEPG) for maintaining the experiment and allowing this study to be carried out.
-
The authors declare that they have no conflict of interest.
- Copyright: © 2025 by the author(s). Published by Maximum Academic Press, Fayetteville, GA. This article is an open access article distributed under Creative Commons Attribution License (CC BY 4.0), visit https://creativecommons.org/licenses/by/4.0/.
-
About this article
Cite this article
Serber CE, Caires EF, Canalli LBdS, de Francisco ALO. 2025. Soil chemical properties and soybean performance under crop rotation and application of phosphogypsum in a no-till system. Technology in Agronomy 5: e018 doi: 10.48130/tia-0025-0013 

Soil chemical properties and soybean performance under crop rotation and application of phosphogypsum in a no-till system
- Received: 06 August 2025
- Revised: 09 October 2025
- Accepted: 28 October 2025
- Published online: 11 December 2025
Abstract: Crop rotation and improving the rooting profile are fundamental to increasing crop yields and the sustainability of production systems. We evaluated soil chemical changes and soybean's performance as affected by different crop rotations and surface application of phosphogypsum. A randomized complete block design was used with four replications in a split-plot arrangement. In the plots, the following crop rotations were used in the period from 2017 to 2023: I, wheat/soybean succession (control); II, black oat/maize, wheat/soybean, wheat/soybean, black oat/maize, wheat/soybean, wheat/soybean; III, canola/maize, wheat/soybean, barley/soybean, canola/maize, wheat/soybean, barley/soybean; IV, black oat + ryegrass/maize, black oat + ryegrass/maize, black oat + ryegrass/soybean, vetch/maize, wheat/soybean, wheat/soybean. In the subplots, two treatments were used, with and without surface application of phosphogypsum before soybean sowing in 2021. Soybean's performance was evaluated in the 2021–2022 and 2022–2023 growing seasons. Applying phosphogypsum increased soil P and SO4-S contents, reduced soil Al3+ toxicity; improved the P, Ca, S, and Zn nutrition profile; and increased soybean grain yield by 8%–10%. The greater diversification of species in Rotation IV increased the Ca2+, K+, SO4-S, and organic carbon levels in the soil. Depending on the year, soybean grain yield increased by 13% with the adoption of Rotation IV compared with Rotation III. Our results suggest that the use of crop rotation with greater species diversity improves the soil's chemical quality and that the use of phosphogypsum increases soybean yield during growing seasons marked by periods of water deficit.
-
Key words:
- Subsoil acidity /
- Gypsum /
- Glycine max L. (Merrill) /
- Crop rotation /
- Conservation agriculture /
- Subtropical soil